lawrence berkeley national laboratory environmental energy...
TRANSCRIPT
Lawrence Berkeley National LaboratoryLawrence Berkeley National LaboratoryEnvironmental Energy Technologies DivisionEnvironmental Energy Technologies Division
OverviewOverview
William J. FiskWilliam J. FiskActing Division DirectorActing Division Director

US Department of Energy
National Laboratory System
Lawrence Berkeley National Laboratory~4000 Employees
Managed by the University of California
Environmental Energy Technologies Division~400 Employees, 5 Departments
Energy and Environment ResearchPrimary Sponsors: Federal and State Agencies
What is the Environmental Energy Technologies Division?

Berkeley Lab OrganizationBerkeley Lab Organization
http://www.lbl.gov/image-gallery/overview/

Berkeley Lab’s New Scientific
Directions Scientific ComputingAdvanced Scientific
Computing ResearchUltrafast Science
Basic Energy Sciences
Matter and Energy in the Universe
High Energy Physics
Nano-Bio FrontierBasic Energy SciencesSolar to Chemical
EnergyBasic Energy Sciences
01234
432101234
4321
Quantitative BiologyBiological and
Environmental Researc
New Energy Systems and Environmental Solutions
Energy Efficiency and Environmental Research

Energy Analysis DepartmentEnergy Analysis Department123 staff & guests123 staff & guests
Electricity Markets &
Policy
Inter-national Energy Studies
China Energy
Government & Industry Programs
Energy Efficiency Standards
End-Use Forecasting
& Market Assessment
Heat Islands
Independent Research Projects
J.E. McMahon, Head

Building Technologies DepartmentBuilding Technologies Department66 staff & guests66 staff & guests
Windows & DaylightingWindows & Daylighting
Commercial Building Systems
Commercial Building Systems
Lighting SystemsLighting Systems
Simulations Research
Simulations Research
Applications Team
Applications Team
S.E. Selkowitz, HeadS.E. Selkowitz, Head
Demand Response, Residential & Industrial
Policy
Demand Response, Residential & Industrial
Policy

Advanced Energy Technologies DepartmentAdvanced Energy Technologies Department95 staff & guests95 staff & guests
Physical/Chemical Technologies
Physical/Chemical Technologies
Combustions TechnologiesCombustions Technologies
Electrochemical Technologies
Electrochemical Technologies
R.E. Russo, HeadR.E. Russo, Head

Indoor Environment DepartmentIndoor Environment Department63 total staff63 total staff
Airflow & Pollutant Transport
Airflow & Pollutant Transport
Tom McKone, Head (acting)Tom McKone, Head (acting)
Environmental Chemistry,
Exposure, and Risk
Environmental Chemistry,
Exposure, and Risk
Commercial Building
Ventilation & Indoor
Environmental Quality
Commercial Building
Ventilation & Indoor
Environmental Quality
Energy Performance of
Buildings
Energy Performance of
Buildings

Atmospheric Sciences DepartmentAtmospheric Sciences Department26 total staff (includes 26 total staff (includes matrixedmatrixed staff & guests)staff & guests)
Atmospheric Processes
Impacting Air Quality
Atmospheric Processes
Impacting Air Quality
Atmospheric Processes Impacting
Global Climate
Atmospheric Processes Impacting
Global Climate
EmissionsEmissions
N.J. Brown, HeadN.J. Brown, Head
Aerosol Sources and Exposures
Aerosol Sources and Exposures

Impacts of Impacts of EETDEETD’’ss Efficiency R&DEfficiency R&DFrom National Academy of Sciences ReportFrom National Academy of Sciences Report
• Primary energy savings = 9% of 2025 residential energy use
• Carbon reductions in 2025= 132 million metric tons CO2/year
NAS estimate of economic benefits of EE R&D assigns $23 of $30 billion in savings to two LBNL - derived technologies (Table 3-4, page 64)
Additional $48 billion in savings from standards for 9 Residential Products
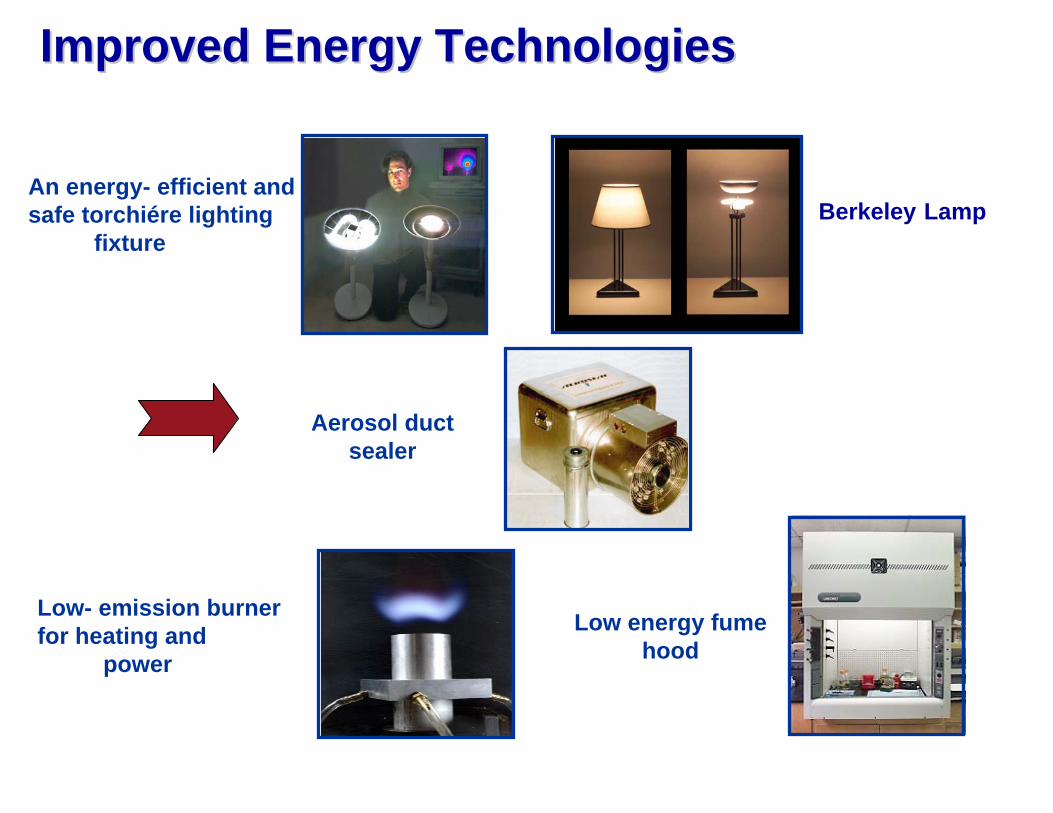
Aerosol duct sealer
An energy- efficient and safe torchiére lighting
fixtureBerkeley Lamp
Low- emission burner for heating and
power
Low energy fume hood
Improved Energy TechnologiesImproved Energy Technologies

Assisted China in: • Transformation of refrigeration
and lighting industries• Appliance standards• Building energy standards• Iron & steel industry efficiency• Motor systems
Intergovernmental Panel on Climate Change• Significant
contributions toreports
• Real time monitoring tools
Electricity reliability
Reducing standby power losses• U.S. executive order• International 1-watt
guideline
China energy efficiency policies
• Energy Efficiency in Federal Acquisition Regulations
• Federal Energy Management guidelines
Federal procurement
“OFF” – 17 Watts ON - 21 Watts
Energy Impacts Energy Impacts (cont.)(cont.)

Widely Used EETDWidely Used EETD--Developed Simulation ToolsDeveloped Simulation Tools
• DOE-2— Building energy simulation program widely used
for building design and energy performance compliance with standards
• EnergyPlus— Next generation of building energy simulation
program with expanded capabilities and flexibility
• Radiance— Program for predicting and rendering lighting
environments, used for lighting system design• Window
— WINDOW 5.2 is a publicly available computer program for calculating total window thermal performance indices
• Home Energy Saver— Web-based tool to guide selection of energy
efficiency technologies by homeowners• CalTOX
— a risk assessment model that calculates chemical emissions and concentrations and the risk of an adverse health effects

Environmental Research: ImpactsEnvironmental Research: Impacts (cont)(cont)
• ~4M deaths/year from polluted drinking water
• Appropriate low-cost technology
• Initial commercialization
Reduced Annual U.S. Health Benefits
Impacts (1996 $U.S.)
Respiratory disease
16-37M avoided illnesses $6 - $14 billion
Allergies and asthma
8 - 25% decrease in symptoms in asthmatics
and allergy sufferers $1 - $4 billion
Sick building syndrome
20 - 50% reduction in symptoms $10 - $30 billion
Source: Fisk Annual Rev. E&E 2000
LBNL’s Contributions to ReducedExposures to Indoor PollutantsWe have played leadership role in:• Characterizing pollutant sources• Identifying risk factors and health
effects• Evaluating and demonstrating control
measures
Scientific and Technology Underpinnings of Health Benefits from Improved Indoor Air Quality
UV Waterworks

Examples of Examples of Current DirectionsCurrent Directions

SwitchableSwitchable Electrochromic Windows:Electrochromic Windows:
• LBNL full-scale windows field test facility

High Power LithiumHigh Power Lithium--Ion BatteriesIon Batteries
Microscopic images of electrodesMicroscopic images of electrodes
• Color-coded images reveal how electrode surface chemistry changes during battery tests
Loss of conductive carbon contributes to unwanted battery power loss
Discovering causes of battery power loss in hybrid electric vehiDiscovering causes of battery power loss in hybrid electric vehiclescles
10 µmLiNi0.8Co0.15Al0.05O2graphiteacetylene black
Fresh cathode Failed cathode• Hybrid EVs are entering the
market, and lithium-ion is poised to become the preferred battery technology
Higher power & energy, longer life, and similar cost, compared to Ni/MH
• EETD researchers are addressing key issues to advance lithium-ion technology

Fuel Cells for Transportation Fuel Cells for Transportation ApplicationsApplications
• Research Areas:— Novel catalyst layer:
microstructures to reduce Pt loading (cost issue)
— Nanostructuredmembranes
— New diagnostic methods to help develop advanced hydride materials
— Modeling of fuel cell components
• Proton-exchange membrane fuel cells are favored for future transportation— Benign emissions, non-petroleum fuel, good performance, rapid refueling— Require lower cost, greater durability, hydrogen storage, infrastructure, and
production

Water and EnergyWater and Energy
• Goals: identify cost-effective ways to:— Increase energy efficiency of water delivery — Reduce waste of water
• Significance:— 7% of world energy is for delivering water
• 50-60% of some municipal electricity bills is for water
— U.S. freshwater withdrawals:• 38% thermoelectric power (recycled and reused)• 39% irrigation • 19% commercial, industrial, residential
— Serious and growing water availability problems – in U.S. and worldwide
• As in energy efficiency, technology can play a major role in reducing water use; behavior may be more important for water
EnergyEnergy
WaterWater

Getting to Getting to ““Zero Net EnergyZero Net Energy”” or or ““Carbon NeutralCarbon Neutral”” BuildingsBuildings
• Deployment: (5 - 30% savings)• Identify what works and deploy it widely• Applies to all buildings: new and existing• Mandatory programs: codes and standards• Voluntary programs: incentives
• Demonstrate Emerging Solutions (20 - 60% savings)• Find Underutilized, unproven technologies and systems• R&D to improve, optimize; Make them mainstream
• Breakthrough Innovations (50-80% savings plus on-site renewable power)• New, more effective, high performance options• Lower costs, Lower risk
• National Initiative Needed to Achieve this vision: $200M+/yr

Health Effects of Indoor ExposuresHealth Effects of Indoor Exposures
LBNL Initiative: Create capability for assessing/reducing adverse health effects of indoor air quality
Significance•• Establish priorities for mitigation researchEstablish priorities for mitigation research
•• Enable energy efficiency in buildings without compromising healtEnable energy efficiency in buildings without compromising healthh•• Ultimately provide basis to reassess impacts of outdoor air qualUltimately provide basis to reassess impacts of outdoor air qualityity
Background• Most exposures to
pollutants occur indoors
Indoor Indoor pollutant sourcespollutant sources
transport, transport, transformation, transformation, and depositionand deposition
InitiativeInitiative
HealthHealthRisksRisks
ExposureExposureAssessmentAssessment
Current Current StrengthsStrengths
• Improved exposure assessment
• Epidemiologic analyses• Intervention studiesInitial efforts • Particles• VOCs

Monitoring the Electricity GridMonitoring the Electricity Grid
• Problem:— Operators of electricity grid were
unable to analyze the data in close to real time
• Achievements— Created visualization tool to analyze
and display data in real time— Tool being adopted by all 23 National
Electricity Reliabiliyty Council Coordinators (covering nation) and by several Independent System Operators
*
*
* Achievements by the Consortium for Electricity Reliability Technology Solutions (CERTS) led by LBNL
• Background:— Massive amounts of real time data collected about electricity flows
on U.S. transmission grids

Climate Effects of AerosolsClimate Effects of Aerosols
• Using the Goddard Institute for Space Studies climate model• Simulations revealed that the heating effects of black carbon result in
lower level heating, changes in vertical motions, circulation, and thus cloud cover and rainfall. (Menon et al. Science, 2002)
• Results show that the regional climate effects of BC particles can be quite significant.
With black carbon∆ Precipitation mm/d
Without black carbon∆ Precipitation mm/d

For More InformationFor More Information
http://http://eetd.lbl.goveetd.lbl.gov//