layman’s guide to investing in the s&p 500 - hvass-labs.org · layman’s guide to investing...
TRANSCRIPT


Layman’s Guide to Investing in the S&P 500
Magnus Erik Hvass Pedersen
Hvass Laboratories Book HL-1502
First Edition April 29, 2015
This Revision June 3, 2015 (See last page for changes.)
Latest Revision www.Hvass-Labs.org/books/files/pedersen2015layman-sp500.pdf
Summary
This book explains in simple terms all the relevant aspects of investing in the S&P 500 stock-market index,
including analysis of its historical returns, the causes of those returns, and comparison to inflation and
US government bonds. The book explains the advantages of adding to your investment in the S&P 500 on a
monthly basis. It also shows how to allocate your portfolio between the S&P 500 and US government
bonds, and the advantages and disadvantages of doing this. Other topics include the importance of low
expense ratios and tax-deferred accounts, and how to invest an inheritance in the S&P 500 and save for
your child’s education. There is also a section for foreigners on how to reduce the currency risk when
investing in the S&P 500 from other countries.
Warning
The S&P 500 can be very volatile and you should read the entire book to understand the risks. The author is not responsible for your investment results.
About the Author
The author has a BSc degree in Computer Science and a PhD degree in Engineering Science. The author’s
previous work in finance includes a comprehensive theory on share buyback valuation, new models for
financial Monte Carlo simulation, and strategies for investing in the S&P 500. The work is available at:
www.Hvass-Labs.Org
Copyright Copyright 2015 by Magnus Erik Hvass Pedersen, except for the original financial data.
The book may be copied freely in its entirety, but may not be modified. Author’s consent is required for commercial redistribution.
Cover photograph by the author, location is somewhere in New Zealand.

Layman’s Guide to Investing in the S&P 500
3
Donations
This book is made available for free so it can benefit as many people as possible. But the book has been costly to produce as it required years of experience and months of research and writing. This work was funded entirely by the author.
Donations are used towards these expenses and to assess whether there is interest in more books like this.
If you found the book useful then please donate. The average donation is $10 but a
small donation is always better than no donation and even $1 is appreciated.
Click on the link to donate securely using PayPal.
www.Hvass-Labs.org/books

Layman’s Guide to Investing in the S&P 500
4
“Everyone says that no masters of the arts will appear as the world
comes to an end. This is something that I cannot claim to understand.
Plants such as peonies, azaleas and camellias will be able to produce
beautiful flowers, end of the world or not. If men would give some
thought to this fact, they would understand. And if people took notice
of the masters of even these times, they would be able to say that
there are masters in the various arts. But people become imbued with
the idea that the world has come to an end and no longer put forth
any effort. This is a shame. There is no fault in the times.”
– Hagakure, 1716 A.D.

Layman’s Guide to Investing in the S&P 500
5
Contents
1. INTRODUCTION .................................................................................................................................................. 6
2. PERCENTAGE RETURNS ...................................................................................................................................... 9
3. INFLATION .........................................................................................................................................................11
4. BONDS ..............................................................................................................................................................15
5. WHAT IS THE S&P 500? .....................................................................................................................................23
6. HISTORICAL RETURNS OF THE S&P 500 .............................................................................................................30
7. MONTHLY INVESTING........................................................................................................................................53
8. FORECASTING THE S&P 500 ...............................................................................................................................60
9. PORTFOLIO ALLOCATION AND REBALANCING ...................................................................................................64
10. TAX ...............................................................................................................................................................70
11. HOW MUCH TO INVEST .................................................................................................................................72
12. OTHER ASPECTS OF INVESTING .....................................................................................................................74
13. WHAT NOW? ................................................................................................................................................80
14. FOREIGN INVESTORS .....................................................................................................................................81
15. BIBLIOGRAPHY ..............................................................................................................................................83
16. REVISION HISTORY ........................................................................................................................................84

Layman’s Guide to Investing in the S&P 500
6
1. Introduction Investing in individual companies is challenging because it requires insight about the future of the
company’s products, management, competitors, finances, etc. Some industries change so rapidly and
dramatically that they are impossible to predict even for insiders. You can protect yourself against such
risks by diversifying your investment in many different companies and industries.
The easiest and cheapest way of diversifying your investment is to invest in an index fund. The S&P 500
allows you to invest in 500 of the largest companies in USA that operate in a wide variety of industries
including energy and utility, financial services, health care, information technology, heavy industry,
manufacturers of consumer products, etc. Rather than having to assess the future of individual companies
you now only have to assess the general future of companies in USA.
Between 1962 and 2013 the S&P 500 returned almost 9.7% per year to its investors. Adjusting for inflation
the return was 5.4% per year, which means the purchasing power of an investment in the S&P 500 doubled
every 13 years. However, the S&P 500 is very volatile and lost half its value in one year and gained more
than 70% in another year. To protect yourself you should therefore combine an investment in the volatile
S&P 500 with a guaranteed return from US government bonds.
This book explains all the important aspects of investing in the S&P 500, including analysis of its historical
returns, and how to allocate your portfolio between the S&P 500 and US government bonds so as to limit
the future losses to a level you can tolerate.
You should make an effort to read the entire book. The book is fairly short and the knowledge you obtain
will make it well worth your time and effort. Although I have put much effort into writing the book so it can
be understood by people with diverse educational backgrounds, some of the topics are complicated and I
may not have explained them well enough. If you get confused and do not know what strategy might be
right for you, then follow the simple strategy of adding to your investment in the S&P 500 on a monthly
basis, while making sure you have sufficient emergency funds invested in US government bonds. You
cannot know in advance whether the S&P 500 is currently cheap or expensive, but when you add to your
investment every month and hold the investment for many years, you should get a good return on average.
You should start investing at a young age to take full advantage of the so-called compounding effect. For
example, if you are currently 20 years old and you can only afford to invest $100 each month, and if the
S&P 500 returns 9.7% per year as it did in the previous 50 years, then the $100 would be worth $252 when
you are 30 years old, it would be worth $637 when you are 40 years old and $1,608 when you are 50 years
old. If you leave it invested until you are 60 years old then it would be worth $4,058. Note how the value
grows much more in the later years. This is because the value of the investment doubles every 8 years if the
annual return is 9.7%. This is the compounding effect that you should take advantage of by investing over
many decades. Although inflation will also decrease the purchasing power of each dollar, the money you
invest in the S&P 500 today will likely be able to purchase 8 times as many goods 40 years from now.
1.1. Warren Buffett One of the wealthiest people in the world is Warren Buffett who has accumulated his wealth through
investing. Buffett believes laymen should invest in a broadly diversified stock-market index such as the
S&P 500 and his own heirs should do the same, as he explains [1]:
Layman’s Guide to Investing in the S&P 500
7
“In aggregate, American business has done wonderfully over time and will continue to do so
(though, most assuredly, in unpredictable fits and starts). In the 20th Century, the Dow Jones
Industrials index advanced from 66 to 11,497, paying a rising stream of dividends to boot. The 21st
Century will witness further gains, almost certain to be substantial. The goal of the non-professional
should not be to pick winners – neither he nor his “helpers” can do that – but should rather be to
own a cross-section of businesses that in aggregate are bound to do well. A low-cost S&P 500 index
fund will achieve this goal.
(...) The main danger is that the timid or beginning investor will enter the market at a time of
extreme exuberance and then become disillusioned when paper losses occur. (...) The antidote to
that kind of mistiming is for an investor to accumulate shares over a long period and never to sell
when the news is bad and stocks are well off their highs. Following those rules, the “know-nothing”
investor who both diversifies and keeps his costs minimal is virtually certain to get satisfactory
results.
(...) What I advise here is essentially identical to certain instructions I’ve laid out in my will. One
bequest provides that cash will be delivered to a trustee for my wife’s benefit. (...) My advice to the
trustee could not be more simple: Put 10% of the cash in short-term government bonds and 90% in
a very low-cost S&P 500 index fund. (...) I believe the trust’s long-term results from this policy will be
superior to those attained by most investors – whether pension funds, institutions or individuals –
who employ high-fee managers.”
Note that Buffett’s suggested portfolio allocation for his wife consists of 90% S&P 500 and 10% short-term
government bonds but this may not be appropriate for everyone, as we will see later in this book.
1.2. Ben Graham Warren Buffett’s teacher was Ben Graham who is known as the founder of so-called “value investing”. After
decades of investing, Graham also spoke in favour of investing in a broadly diversified index [2]:
“(...) I have a feeling that the way in which institutional funds should be managed, at least a number
of them, would be to start with the index concept – the equivalent of index results, say 100 or 150
stocks out of the Standard & Poor's 500. Then turn over to managers the privilege of making a
variation, provided they would accept personal responsibility for the success of the variation that
they introduced. (...) I think any experience of the last 20 years, let's say, would indicate that one
could have done as well with Standard & Poor's than with a great deal of work, intelligence, and
talk.”
This was from an interview in 1976, around the same time a financial company named Vanguard was
founded for providing index-based investing to the general public. It seems plausible that Graham would
have suggested both institutions and laymen should invest in a broadly diversified index if it had been
widely available at the time. But without a fund such as Vanguard, the trading commissions would have
been excessive for the individual small investor to invest in all or part of the S&P 500 index.

Layman’s Guide to Investing in the S&P 500
8
Around the same time, Graham gave his opinion on allocation between stocks and bonds [3]:
“(...) the investor should always have a minimum percentage of his total portfolio in common stocks
and a minimum percentage in bond equivalents. I recommend at least 25% of the total at all times
in each category. A good case can be made for a consistent 50-50 division here, with adjustments
for changes in the market level. This means the investor would switch some of his stocks into bonds
on significant rises of the [stock] market level, and vice-versa when the [stock] market declines. I
would suggest, in general, an average seven- or eight-year maturity for his bond holdings.”
Note how Graham’s allocation between stocks and bonds differs from Buffett’s above.
1.3. Ed Thorp Edward Thorp was a professor of mathematics who discovered ways of improving the chances of winning in
some gambling games e.g. by counting cards in Blackjack [4]. Thorp also discovered ways of beating the
stock-market [5] and used the techniques for decades to get very wealthy. In a recent interview [6] Thorp
recommends people without special knowledge should invest in a broadly diversified stock-market index:
“Basically, people should be putting money into index funds when they can't demonstrate that an
investment with similar characteristics is better.
(...) Warren Buffett has knowledge about the fundamentals of a lot of companies, among many
other things. So in that area, the markets are inefficient from his point of view, but there are a
hundred million people out there who don't have that knowledge, and they should behave as if the
markets are efficient because, from their point of view, they don't have any edge at all.”
The term ‘efficient stock-market’ refers to an academic theory that it is impossible to beat the stock-
market. Although both Thorp and Warren Buffett have outperformed the stock-market for many decades,
they have unique skills that laymen do not, so Thorp recommends laymen invest in a stock-market index.
In the same interview, Thorp also discusses portfolio allocation between different types of investments:
“(...) the board [of a university endowment] that I sit on has investment guidelines that allocate in a
certain range to various categories, such as real estate, private equity, bonds, domestic equity,
international equity, and so forth. They move these guidelines around. (...) I'm not sure that the time
and energy spent get us very much, though. They'll debate whether to have 20% or 25% in domestic
equity, and the finance committee will spend a lot of time offering opinions about this. Maybe
they'll decide to move the guideline from 20% to 25%, but no matter what happens, it will only have
an incremental effect on returns that is so small that it's hardly noticeable and appears to me to be
almost random.”
So Thorp believes minor portfolio adjustments are irrelevant, but unfortunately he does not offer any
advice on how to allocate between the S&P 500 and US government bonds, which is covered in this book.
1.4. Video Talks The main aspects of this book are explained in several video talks that can be viewed freely on the internet:
www.youtube.com/user/hvasslabs/playlists

Layman’s Guide to Investing in the S&P 500
9
2. Percentage Returns This section explains percentage returns which are used throughout the book to compare how different
investments have performed relative to each other. It is important that you understand these concepts.
2.1. Example Imagine that you have $100 and you invest it somehow. After a year you sell the investment and you get
$110, so you receive the original $100 you invested plus an additional $10. We call this extra $10 for the
return on the investment. It is often more convenient to write the investment return as a percentage
number. In this case it would be 10% because $10 is 10% of $100.
2.2. Compounded Returns Imagine that you invest the $110 for another year and you get another 10% return on the investment. The
second year’s return is not just 10% on the original $100 but also 10% on the $10 return from the first year
because it was reinvested in the second year. The return for the second year comes to $11 because 10% of
$110 equals $11. So after the second year you have $121 which is 21% more than the original $100 you
started out with. This 21% is called the compounded return from getting a return of 10% in the first year
and another 10% in the second year. Note that the compounded return is 21% and not 20% because the
returns of the two years are multiplied instead of added.1
Compounded returns are very important in long-term investing because even a small annual return will
eventually compound into a very large return over time. For example, if the annual return is just 5% then
$100 will grow to $163 in 10 years, to $265 in 20 years and to $432 in 30 years.
The investment’s value doubles every 14 years and 3 months when the annual return is 5%. So the $100
you invest grows into $200 after about 14 years, to $400 after about 28 years and to $800 after about 42
years. If the annual return is instead 10% then the investment’s value doubles every 7 years and 4 months.
If the annual return is instead 15% then the investment’s value doubles every 5 years.
2.3. Total Return An investor in the S&P 500 gets two kinds of returns: A return from the change in price of the S&P 500, and
a return in the form of dividends. The price change is usually the larger of the two returns and may be
either positive for a gain or negative for a loss. The dividend return is always positive so it is always a gain.
The so-called total return assumes that the dividends are reinvested in the S&P 500. For example, if you
invest $100 in the S&P 500 and the price increases 6% during the year, then you have $106 at the end of
the year. But you also receive dividends from the S&P 500. If the dividend is 2% of the $100 you invested at
the beginning of the year, then you receive $2 in dividends. The total return is the sum of the price return
and dividend return, in this case a 6% price return plus a 2% dividend return which gives an 8% total return.
1 As long as you understand what compounded return means, it is not necessary for you to understand the
mathematical formula for calculating it. In case you are curious, the formula for this example is:
Compounded Return = (1 + Return for First Year) x (1 + Return for Second Year) – 1 = 110% x 110% – 1 = 21%

Layman’s Guide to Investing in the S&P 500
10
It is important to make the distinction between the price return and the total return on the S&P 500. Even
though a dividend return of 2% or 3% may seem small, when it is reinvested in the S&P 500 each year over
several decades it will eventually compound into a massive contribution to the total return.
2.4. Negative Percentages Negative percentages are written as (x%) rather than –x%. For example, (43.2%) means –43.2%. This
notation is typical in accounting and financial reports and makes it easy to see when a return is a loss. For
example, if an investment lost half its value we write it as a return of (50%), that is, minus fifty percent. If
an investment lost its entire value then we write it as a loss of (100%), that is, minus one hundred percent.
2.5. Annualized Returns Imagine you invest $100 in the S&P 500 and reinvest the dividends so after 5 years the investment is worth
$150, which is a 50% return on your original $100. What is the return per year? One might think the return
is 10% per year because the return was 50% for 5 years and 5 times 10% is 50%. But if you compound a
return of 10% per year for 5 years you get a compounded return of about 61% instead of 50%. The so-called
annualized return is the return per year that compounds into a return of 50% after 5 years, which in this
case is only about 8.4%.2
Annualized returns are useful for comparing returns for different investment periods. For example, if you
invest $100 and after 5 years the investment is worth $161 then you have made a return of 61%. Imagine
that you also make another investment of $100 which is worth $216 after 10 years for a return of 116%.
The second investment was apparently best because the return was 116% compared to only 61% for the
first investment. But these returns cannot be compared directly because the investment periods were
different. The first investment returned 61% after 5 years so it had an annualized return of 10%. That is, if
you compound a return of 10% per year for 5 years then you get a return of 61%. The second investment
returned 116% after 10 years so it had an annualized return of only 8%. The second investment had a lower
return per year but gave a better return overall simply because the investment duration was twice as long
as the first investment. This shows the importance of comparing annualized returns.
However, there are limitations to comparing annualized returns. The annualized return is a type of average
which does not tell us anything about the year-to-year volatility of an investment. For example, one
investment could have a return of 8% in one year and a return of 12% in the next year. The annualized
return for this investment is nearly 10%. Another investment could have a loss of (20%) in the first year and
a gain of 51% in the second year. This investment would also have an annualized return of nearly 10%. The
compounded return is almost 21% for both investments, but the first investment had very low volatility
while the second investment was highly volatile.
2.6. Tutorials It is very important that you understand percentages, compounded and annualized returns because they
are used throughout the book. You may also watch the tutorials on percentages and compounded returns
at Khan Academy; unfortunately they do not seem to have a tutorial on annualized returns.
2 As long as you understand what annualized return means, it is not necessary for you to understand the
mathematical formula for calculating it. In case you are curious, the formula for this example is:
Annualized Return = (1 + Compounded Return)1/Years – 1 = (1 + 50%)1/5 – 1 ≈ 8.4%
Layman’s Guide to Investing in the S&P 500
11
3. Inflation We need to understand a little about inflation so we can understand why investing is important to long-
term saving. You have probably noticed how most goods and services become more expensive over time.
This is called price inflation. For example, a 12 ounce bottle of Coca-Cola cost $0.05 in 1950 and about
$0.40 in 2015 (depending on where you bought it and the quantity). This is an 8-fold increase in price over
65 years, corresponding to an average price increase of about 3.3% per year. Such price increases are
typical for most goods and services. A rare exception is computer technology where the price decreases but
the computer power doubles every few years. This is called price deflation.
Economists have different theories on what causes price inflation. The theories are not important here.
What is important is the negative effect that price inflation has on your savings and that this will most likely
continue in the future.
3.1. Consumer Price Index The Consumer Price Index (CPI) estimates the price change for a so-called market basket of goods and
services that are consumed by typical US households. A “market basket” is just the term used by
economists for a list of different goods and services. The list contains the items that typical US households
spend their money on, such as food and beverages, housing, apparel, transportation, medical care,
recreation, education, communication, etc. Some items on the list are given more weight than others
because the typical US household spends more on those particular items. For example, expenses related to
housing amount to about 42% of the total expenses of a typical US household while food and beverages
account for about 15% and transportation accounts for another 15%. These are average numbers for urban
households in USA so your own particular expenses may be different.
3.1.1. Between 1950 and 2015
Figure 1 shows the CPI between January 1950 and January 2015. The starting CPI in January 1950 is set to
100 and after 65 years the CPI had increased to almost 1,000. So prices for the goods and services that
typical US consumers buy increased almost 10-fold during these 65 years. The CPI did not change by the
same percentage each year and in some years it even decreased because of price deflation, for example
between 2008 and 2009 the CPI decreased more than (2%). But on average the CPI increased about 3.6%
per year during these 65 years, which means the CPI doubled every 20 years on average. This 65-year
period included a shorter period of high inflation in the 1970’s.
If we instead consider the shorter period of 30 years between January 1985 and January 2015 then the CPI
only increased about 2.8% per year on average, which means the CPI would double every 25 years.

Layman’s Guide to Investing in the S&P 500
12
Figure 1: Consumer Price Index for USA. Starting value is 100. Period is January 1, 1950 to January 1, 2015. Data source [7].
3.1.2. Prior to 1950
Consumer prices were more volatile prior to 1950, which was a turbulent period with two world wars
separated by The Great Depression. During and after the First World War, between 1915 and 1919, the
inflation in USA frequently exceeded 20% and peaked at almost 24% between June 1919 and 1920. This
reversed in the following years with price deflation of almost (16%) in the year between June 1920 and
1921. In the following years consumer prices stabilized somewhat and changed at most ±5% per year. Then
The Great Depression started in 1929 and the annual deflation was again in excess of (10%) during several
of the following years. As the economy gradually improved the consumer prices stabilized but then the
Second World War began in 1939 and in 1942 the US inflation again reached 13% per year but then
stabilized to just a few percent of inflation per year for the remainder of the war. After the war between
1946 and 1947 inflation reached 20% for a while and then towards the end of the 1940’s there was
deflation of almost (3%) per year, which was then replaced with inflation of almost 10% between 1950-
1951. Those were turbulent times indeed.
1950 1960 1970 1980 1990 2000 20101950 1960 1970 1980 1990 2000 2010
20
04
00
60
08
00
10
00
Co
nsu
me
r P
rice
In
de
x (
CP
I)

Layman’s Guide to Investing in the S&P 500
13
3.2. Purchasing Power The CPI measures the change in prices that are relevant to the typical US household. As shown in Figure 1,
these prices generally increase over time. Another way of looking at this is to consider the change in the
amount of goods and services each dollar can purchase over time. This is called the purchasing power of a
dollar.
For example, if you had $1 in 1950 and spent it all on Coca-Cola at $0.05 per 12 ounce bottle then you
would have bought 20 bottles in 1950. If instead you had put the $1 away for safe keeping under your
mattress for the next 65 years and then spent the $1 on Coca-Cola at $0.40 per 12 ounce can in 2015, then
you would only get 2.5 cans as opposed to the 20 bottles in 1950. This is because of price inflation and the
corresponding decrease in the amount of goods that each dollar purchases.
Figure 2 shows the purchasing power of $1 from January 1, 1950. This is calculated from the CPI data in
Figure 1. Because the prices of goods and services generally increase over time, the purchasing power
decreases correspondingly. As shown in Figure 2, the purchasing power of $1 from 1950 was only about
$0.10 in 2015. So there was a (90%) loss in purchasing power of $1 during these 65 years. On average, the
purchasing power decreased about (3.5%) per year, which means the purchasing power was halved every
20 years on average.
Note how the (3.5%) average decrease in purchasing power is slightly different from the 3.6% average
increase in the CPI discussed above. The small difference is due to the way percentage changes are
calculated where an increase in the CPI of 3.6% corresponds to a decrease in purchasing power of about
(3.5%).
3.3. Nominal and Real Values Economists use the terms “nominal” and “real” values when adjusting for inflation. The nominal value is
the listed dollar-amount. For example, if you have $1 in 1950 and you keep it under your mattress until
2015 then it is still just $1. These $1 amounts are the nominal values. But as shown above, the purchasing
power of that $1 from 1950 has decreased to only $0.10 in 2015. This $0.10 is called the real value in 2015
of $1 from 1950. Instead of using these academic terms we will simply write that values are adjusted for
inflation.
3.4. Summary We cannot accurately predict the future price inflation but it seems reasonable to assume that in the long
term price inflation will be somewhat similar to the past several years. In the 65 years between 1950 and
2015 the annual inflation was about 3.6% on average. This included a highly inflationary period during the
1970’s and if that can be avoided in the future then the future inflation will be lower. In the 30-year period
between 1985 and 2015 the inflation was only about 2.8% per year on average. If this continues in the
future then it means the price of goods and services consumed by typical US households would double
every 25 years. Or said in another way, the purchasing power of one dollar would be halved every 25 years.
So if you save for your retirement decades into the future, then you need to invest the money somehow to
avoid the severe decrease in purchasing power caused by price inflation. The rest of the book describes
how to do this.

Layman’s Guide to Investing in the S&P 500
14
Figure 2: Purchasing power of $1 from January 1, 1950 to January 1, 2015. Calculated from the CPI data in Figure 1.
1950 1960 1970 1980 1990 2000 20101950 1960 1970 1980 1990 2000 2010
$ 0.20
$ 0.40
$ 0.60
$ 0.80
$ 1.00

Layman’s Guide to Investing in the S&P 500
15
4. Bonds The previous section showed how inflation significantly decreases the purchasing power of a dollar over
time. To counter inflation you must invest your savings somehow. A basic type of investment is called a
bond and the safest bonds are those issued by the US government. But there are still some risks when
investing in bonds that you need to consider.
When you buy a bond you are actually lending money to someone, whether it is the US government, a
company or a municipality. The issuer of the bond is borrowing money from you and they agree to repay
the money at a future date known as the bond’s maturity date. The amount you will receive when the bond
matures is called the principal, or face value or par value of the bond.
You should be compensated for lending money to someone because by the time you get the money back,
inflation will have decreased the purchasing power of the original amount you lent them. Furthermore, if
there is risk that you might not get some or all of the money back then you should be compensated for
taking this risk. The compensation is called interest and is either paid at regular intervals or at the time the
bond matures.
The return you get on a bond comes from the interest you receive during the life of the bond, and the
difference between the purchase price and the selling price in case you sell the bond before it matures, or
the difference between the purchase price and the principal in case you own the bond until it matures. In
the following we will generally assume that you own a bond until it matures. The bond yield is then the
annualized return you will earn from the interest on the bond and from return of the principal.
4.1. US Government Bonds The least risky bonds are those issued by the US government because the government can always just print
more money to repay the bonds. Of course, the government’s ability to print money has its limitations
because printing too much money may eventually lead to hyper-inflation which destabilizes society. But
US government bonds are generally regarded as risk free which also means that the interest they pay is
usually lower than the interest on other bonds that carry more risk.
US government bonds with maturity of one year or less are often called Treasury Bills but will be called
bonds in the following.
4.1.1. One Year Maturity
We want to know if US government bonds have historically been an effective protection against inflation,
so let us compare the two. Figure 3 shows the yield on US government bonds with one year maturity and
the annual inflation as measured by the CPI described in section 3.1. The data period is February 1962 to
January 2014 so the bonds that were purchased in January 2014 would mature in January 2015. During this
period the average bond yield was around 5.5%. But the bond yield was quite volatile, for example it was
more than 17% in late 1981 and it was almost 0% in late 2011.
The inflation was also volatile during this period. For example, in 1979 there was large price inflation and
typical consumer goods became more expensive by almost 15%. In the year starting July 2008 there was
price deflation and typical consumer goods became cheaper by (2.1%).

Layman’s Guide to Investing in the S&P 500
16
Figure 3: US government bond yield with one year maturity, compared to the rate of inflation for the following year as measured by the CPI. Period is February 1962 to January 2014. Data sources [7] and [8].
During this period of 53 years you would not always have succeeded in protecting your savings from
inflation by investing in US government bonds with one year maturity. The interest you earned on the
bonds were greater than the rate of inflation in only 7 out of 10 years. On average the bond interest was
about 1.5% (percentage points) higher than the annual inflation, so on average you would make up for the
rising prices and get an additional 1.5% return per year. But some years were far from average. The worst
year was 1974 during which the government bonds yielded 7.3% but the inflation was 12.2%, so your
purchasing power still decreased almost (5%) even though you had invested in US government bonds. Of
course, it was better than keeping the money under your mattress where they would have earned no
interest at all and hence experienced the full decrease in purchasing power due to inflation. The best year
started in September 1981 where the government bond returned more than 17% but the inflation was only
5% so the bond earned 12% (percentage points) more than the inflation.
The above comparison assumed you paid no taxes on the bond interests you received. If you had to pay
15% on the bond interests then your average after-tax returns would only have been 0.7% (percentage
points) greater than the rate of inflation. Furthermore, your after-tax bond returns would have failed to
match the rate of inflation in almost 4 out of 10 years.
1970 1980 1990 2000 20101970 1980 1990 2000 2010
0%
5%
10%
15%
Bond Yield
Inflation

Layman’s Guide to Investing in the S&P 500
17
The conclusion is that investing in US government bonds with one year maturity has frequently failed to
match the rising consumer prices, but investing in US government bonds was still better than not having
invested the money at all.
4.1.2. Ten Year Maturity
The US government also issues bonds with longer maturity that usually have higher yields. Figure 4 shows
the yield on US government bonds with 10 year maturity. The period is from February 1962 to January 2005
which means the bonds that were purchased in January 2005 would mature in January 2015. During this
period the average bond yield was 7.2% but it was quite volatile, for example it was 3.4% in June 2003 and
almost 16% in October 1981.
The inflation is also shown in Figure 4 and is calculated from the 10-year change in the CPI from Figure 1.
The average inflation rate over 10-year periods was 4.4% per year but this was also quite volatile. The
lowest inflation rate occurred in the 10 years starting January 2005 where the CPI increased almost 23%
over the next 10 years, corresponding to an average increase of about 2.1% per year. The greatest inflation
rate occurred in the 10 years starting August 1972 where the CPI increased almost 133% over the next 10
years, corresponding to an average increase of about 8.8% per year.
Figure 4: US government bond yield with ten year maturity, compared to the rate of inflation over the following ten years as measured by the CPI. Period is February 1962 to January 2005. Data sources [7] and [8].
1970 1980 1990 20001970 1980 1990 2000
0%
5%
10%
15%
Bond Yield
Inflation

Layman’s Guide to Investing in the S&P 500
18
US government bonds with 10-year maturity did not always succeed in protecting the investor from
inflation. Although the bonds yielded 2.8% (percentage points) more than the rate of inflation on average,
the bond yield failed to match the inflation in 1 out of 4 years. As can be seen in Figure 4 it was the bonds
purchased approximately between 1965 and 1975 that did not match the inflation. The worst 10-year
period started in November 1971 where the yield was 5.8% for a bond with 10 year maturity, but the
average rate of inflation was 8.6% per year over the following ten years, thus causing the bonds to lose
about (2.8%) of purchasing power per year. The best period started in October 1981 where the yield was
almost 15.8% for bonds maturing 10 years later, but the inflation over those ten years was only 3.9% per
year on average, thus causing the bonds to earn 11.8% more than the inflation each year.
The above comparison assumed you paid no taxes on the bond interests you received. If you had to pay
15% tax on the bond interests then your average after-tax returns would only have been 1.7% (percentage
points) greater than the rate of inflation. Furthermore, your after-tax bond returns would have failed to
match the rate of inflation in more than 1 of 3 years.
Reinvestment Risk
The above comparison also assumed that the bond interests were reinvested in new bonds with the same
yield as the first bond you started out with. In reality, the bond yields change over time so you would
possibly have to reinvest the interests in new bonds with lower yields. This is called reinvestment risk.
First consider an example of falling bond yields. If you invested $1,000 in a US government bond with 10-
year maturity in January 1982, it yielded 14.2% per year so you would receive $142 interest per year
starting in January 1983. You would then reinvest the $142 in another bond. But in January 1983 the bond
yields had decreased and were now only 10.3% for US government bonds with 10-year maturity.
Furthermore, you would reinvest in a bond that matured after only 9 years so as to match the maturity
date in January 1992 for the original 10-year bond you had bought, because we want to compare the return
on US government bonds to inflation over the 10 years from January 1982 to 1992.
You would continue reinvesting the bond interests like this until January 1992. Because the interest rates
were gradually decreasing during this period, your overall return on these bond investments were only
about 12.5% per year, which is lower than the 14.2% bond yield you started out with in 1982. Your return
of about 12.5% per year was still much more than the inflation of 3.9% per year between 1982 and 1992.
Now consider an example of rising inflation and interest rates. In January 1972 the yield was 5.9% for a
US government bond with 10-year maturity. The yield increased in the following years and was 12.4% in
January 1981. Because you would reinvest the interests in new bonds with higher yields, your overall return
between 1972 and 1982 was about 6.3% per year which was slightly higher than the 5.9% bond yield you
started out with in 1972. Compare this return to the inflation which was 8.7% per year during this 10-year
period. Although the bond yields increased significantly during this period, the bonds still did not match
inflation because the starting yield in 1972 was too low compared to the high inflation a few years later.
For 10-year bonds, the yield on the first bond you start out with is a good estimate of the annual return you
will earn after reinvesting the interests in new bonds during the next 10 years. This is because the majority
of the return comes from the fixed interests on the first bond you start out with. It is therefore reasonable
to compare inflation to the yield on US government bonds with 10-year maturity, as was done above.
Layman’s Guide to Investing in the S&P 500
19
Conclusion
The conclusion is that investing in US government bonds with 10-year maturity did not always exceed or
even match the inflation in the following 10 years. But investing in these bonds was still better than not
investing the money at all, and on average these bonds returned approximately 2.8% (percentage points)
more per year than the inflation.
4.2. Interest Rate Risk The US government issues bonds with maturities up to 30 years. Bonds with longer maturity generally have
higher yields but these bonds should only be bought if you intend to own them until maturity. This is
because the price of a bond changes inversely with changes in the bond yield. When the bond yield
increases, the bond price decreases, and vice versa. Furthermore, the price changes are much greater for
bonds with longer maturity. This is called interest rate risk.
For example, assume you buy a bond for $78.35 that does not pay interest but after five years you get $100
principal in return which means you effectively earn $21.65 in interest after five years of owning the bond.
This corresponds to an annual interest rate of about 5%. If the prevailing yield for bonds with five year
maturity increases from 5% to 6%, then nobody will buy your bond for $78.35 anymore because they would
only earn 5% interest and they could buy another similar bond which would pay them 6% interest. The
market price of your bond therefore decreases to about $74.73 so its yield becomes 6% as well. The yield
increased one percentage point but the bond price decreased almost (5%).
The price decrease is much larger for bonds with longer maturity. Consider for example a bond with 30 year
maturity. Assume you buy the bond for $23.14 and it does not pay any interest but after 30 years you get
$100 in return so you effectively earn $76.86 in interest after 30 years. This corresponds to an annual yield
of about 5%. If the prevailing yield for bonds with 30 year maturity increases to 6% then the market price of
your bond will decrease to about $17.41 which is a decrease in bond price of almost (25%) for an increase
in bond yield of one percentage point.
The opposite is also true, that the bond price increases when the bond yield decreases, so you could profit
greatly if you bought bonds with long maturity and the prevailing yield decreased. Changes in bond yield of
one percentage point or more are fairly common within a few years. But it is very difficult to predict the
exact time the change will occur and whether the yield will increase or decrease. You should therefore only
invest in bonds with the intention of owning them until maturity, so the wild fluctuations in bond prices do
not matter to you because you will get the principal back at maturity.
4.3. Treasury Inflation-Protected Securities (TIPS) The US government sells special bonds that are protected from price inflation in addition to paying regular
interests. These bonds are called Treasury Inflation-Protected Securities (TIPS). They are issued in terms of
5, 10 or 30 years. The principal is adjusted for inflation according to changes in the CPI described in section
3.1. The principal of the TIPS bond increases when there is price inflation and the principal decreases when
there is price deflation. TIPS bonds pay interest twice a year on the inflation-adjusted principal.
For example, if you buy a TIPS bond with 5% yield for $100 and after a year the CPI increases 2% due to
inflation, then the principal of your TIPS increases to $102. The interest is paid on the inflation-adjusted

Layman’s Guide to Investing in the S&P 500
20
principal so instead of receiving $5 interest on the original $100 principal, you now receive $5.10 interest
which is 5% of the $102 inflation-adjusted principal.
In case of deflation in which consumer prices fall, the TIPS principal is adjusted downwards to match the
decrease in the CPI. Interests are paid on the adjusted principal as usual. For example, if the original
principal of $100 has decreased to $90 due to price deflation of (10%), then you would only receive $4.50
interest which is 5% of the $90 deflation-adjusted principal. But in this case the US government still repays
the original $100 principal at maturity. This added protection against deflation may seem like a nice bonus
but it is probably not relevant, because during the 65 years between 1950 and 2015, significant price
deflations have only rarely occurred and it was limited to a few percent that only lasted for a short while.
4.3.1. Interest Rate Risk
TIPS bonds are also subject to interest rate risk as described in section 4.2. While TIPS protect you from
rising prices of consumer goods, TIPS do not protect you from interest rate risk which is usually a much
greater risk than inflation. For example, if you buy a TIPS bond with 30 year maturity and the interest rate
increases from 5% to 6% then your TIPS bond decreases almost (25%) in market price. So if you want to buy
TIPS bonds then you should do it with the intention of holding them until maturity as with other bonds.
4.3.2. TIPS versus Normal Government Bonds
TIPS were introduced in 1997 and because of their long maturity of 5, 10 or 30 years there is not much
historical data available for comparing TIPS to normal government bonds to see if they have generally
performed better or worse. But a few remarks can still be made.
There is a difference in yield between normal US government bonds and the inflation-protected TIPS. The
yield difference can be considered the market’s expectation for the future inflation. Whether you will earn
a higher return from TIPS or normal government bonds depends on whether the actual inflation is lower or
higher than the expected inflation that is implied by the yield difference. But the future inflation is very
difficult to predict so we cannot know in advance whether TIPS or normal bonds will perform better.
For example, if TIPS yield 2% and normal bonds yield 4% then there is a yield difference of 2% which implies
the expected inflation rate is 2%. If the inflation rate turns out to be 1% then the TIPS principal is increased
by 1% which means you effectively get a 3% return. But if you had bought the normal bond then the yield
would have been 4% so that would have been the better choice. The opposite could also have happened,
for example if the inflation rate turned out to be 3% then the TIPS would effectively return 5% consisting of
its 2% yield plus 3% for the inflation adjustment. So in this case the TIPS would have been better than the
normal bond which only returned 4%.
In the relatively short period between 2003 and 2015 there have been cases where both TIPS and normal
government bonds have performed best, because the actual inflation rate turned out to be either higher or
lower than the yield difference.
In recent years the TIPS yield has sometimes been negative. This may seem peculiar but the explanation is
again that the TIPS yield is based on the yield for normal US government bonds minus the expected rate of
inflation. For example, in September 2012 the yield was negative at (1.7%) for TIPS with 5 year maturity,
while the yield was positive at 0.7% for normal US government bonds with 5 year maturity. This gives a
yield difference and expected inflation rate of 2.4%. If the actual inflation turns out to be greater than 2.4%,

Layman’s Guide to Investing in the S&P 500
21
then the TIPS will have a greater return than normal government bonds even though the TIPS yield was
negative at the time of purchase. For example, if the inflation turns out to be 3.5% instead of the expected
2.4% then the TIPS would effectively have a positive return of 1.8% because the negative yield of (1.7%)
gets adjusted upwards by 3.5% to account for the inflation, while the normal government bond still only
returned 0.7%. If instead the inflation turns out to be only 1% then the TIPS would have a net loss of (0.7%)
because the negative yield of (1.7%) was only adjusted upwards by 1% to account for inflation. We will
have to wait until September 2017 to see whether these 5-year TIPS or normal government bonds were
better.
Do not worry if you are confused by all this. It is confusing. There is no simple and clear answer whether
TIPS or normal US government bonds are better. It ultimately depends on the future inflation rate which is
unpredictable. One suggestion is to invest half in TIPS and half in normal US government bonds. But
remember to only invest in bonds if you intend to own them until maturity, so you are not concerned about
interest rate risk as described in section 4.2.
4.4. Tax Interest income from US government bonds is subject to federal income tax but is exempt from all state
and local income taxes. This is also the case for TIPS, but when the TIPS principal is increased due to
inflation you have to pay tax on this increase even though you will first receive the principal in return when
the TIPS matures possibly decades into the future.
Government bonds can be held in tax-deferred retirement accounts but whether this is advantageous
depends on your particular circumstances, including your tax bracket, when you might need the money,
etc. See section 10 for more details on tax-deferred accounts.
4.5. Where to Buy US government bonds can be bought from banks and brokers. They can also be bought directly from the US
Department of the Treasury, which eliminates all transaction costs and makes it easy to transfer money to
and from your bank account, reinvest in new bonds as the old bonds mature, etc. The internet address is:
www.treasurydirect.gov
4.6. Corporate and Municipality Bonds Corporations and municipalities also issue bonds that you can invest in, but they generally do not come
with the guarantee of the US government so you must assess the risk of the individual bond issuer before
investing. This takes time and special skills. To avoid this you can invest in diversified bond portfolios
through bond-funds which invest in bonds of a certain maturity and credit rating from many different
issuers. It is beyond the scope of this book to describe bond-funds in detail. This book instead suggests the
investor keeps the investment strategy simple by combining risk-free US government bonds with a volatile
stock-market index, as described in the following sections.

Layman’s Guide to Investing in the S&P 500
22
4.7. Summary It was shown that US government bonds with 1-year maturity historically have failed to earn back the
purchasing power that was lost due to inflation in 3 out of 10 years. US government bonds with 10-year
maturity were also an imperfect protection against inflation although they performed better than bonds
with 1-year maturity.
Inflation-protected government bonds known as TIPS are adjusted for inflation but they also offer a lower
yield than normal government bonds because the expected future inflation is priced into the yield.
Whether TIPS are better or worse than normal government bonds depends on whether the actual inflation
turns out to be higher or lower than the expected inflation already priced into the TIPS yield. Because the
future inflation is generally unpredictable it is not possible to say in advance whether TIPS or normal
government bonds will give the highest return. This may seem confusing and if you are in doubt then you
may either buy half TIPS and half normal government bonds – or simply stick with the normal government
bonds for simplicity.
The daily market price of a bond changes inversely with changes in bond yield and this effect is stronger for
bonds with longer maturity. You could therefore lose or gain substantial amounts of money if you sell a
bond before it matures. Whether you will lose or gain on a premature sale of a bond is generally
unpredictable because it depends on overall changes in interest rates. Bonds should therefore be bought
with the intention of owning them until they mature at which time the principal is repaid in full. If you are
unsure whether you will need the money within a few years then you should invest in government bonds
with shorter maturity such as one year and reinvest in new bonds when the old ones mature.
This section focused on US government bonds and only briefly mentioned corporate and municipality
bonds. The book generally suggests you keep your investment strategy simple by investing in
US government bonds because they are guaranteed by the US government. To increase the long-term
return of your portfolio you can invest a part of the portfolio in a stock-market index, as discussed in the
following sections.
Layman’s Guide to Investing in the S&P 500
23
5. What is the S&P 500? The S&P 500 is a so-called stock-market index which consists of the stocks of 500 large companies in USA.
Before we can understand what the S&P 500 is, we first need to understand what a stock is.
5.1. What is a Stock? The terminology for stocks is somewhat ambiguous and we will use the terms stock and share
interchangeably in the following. A share or a stock represents a part ownership in a company. If you buy a
share in the Coca-Cola company then you become a part owner of that company. This means you have
voting rights at the annual meeting proportionate to the number of shares you own, and you are entitled to
future dividend payments on each share, provided the Coca-Cola company is profitable and decides to pay
dividends on its stock.
5.1.1. Shareholder Liability
If a company goes bankrupt then the shareholders are not liable for any debts the company might have, so
the most a shareholder can lose is the amount paid for the stock. This is true for stocks you would buy
through a broker on a public stock-exchange such as NYSE or NASDAQ.
However, if you buy stock in a private company that is not listed on a stock-exchange, then you may also
have to agree to be responsible for some of the company’s other debts and liabilities in case of bankruptcy.
But we will ignore that here because laymen usually do not buy stock in private companies.
5.1.2. Shareholder Value
A shareholder receives value from owning shares in two ways: (1) through dividends that the company pays
out while you own the shares, and (2) through an increase in share-price when the shares are sold.
The dividends are usually much more predictable than the stock price. The annual dividends of established
companies are rarely more than 2-4% of the stock price, but the stock-price itself can easily change ±10% in
a year under normal circumstances. Under extreme conditions, for example if significant doubt arises about
the future of a company, then the stock-price can fall (80%) or more over just a few months or years. If the
pessimism turns out to be warranted then the stock price may even go to zero if the company eventually
goes bankrupt, but if the pessimism turns out to be unwarranted then the stock-price may recover
completely for a 5-fold increase or more within a year or two.
5.1.3. Predicting the Future of Stocks
It is very difficult to predict what will happen to any individual stock in the next few minutes, hours or days.
There are so-called hedge funds which are run by elite scientists that are capable of predicting stock prices
to some extent, and by doing thousands of trades each day these hedge funds manage to get a high return
on average. It would be very foolish of you to think you can outsmart these geniuses with their advanced
degrees in physics, mathematics, statistics and computer science, and their combined experience of many
millennia. So you should not try to predict what will happen to stock prices in the short term. You may get
lucky a few times but eventually you will lose badly.
How about predicting what will happen to individual stocks in the long term? Warren Buffett is probably
the most successful long-term investor in modern history with a career spanning six decades. But even after
all his experience and success, Buffett still makes mistakes when investing in individual stocks, as he openly

Layman’s Guide to Investing in the S&P 500
24
admits. Do you think you can do better than Buffett and avoid making costly mistakes when investing in
individual companies?
To accurately predict the long-term future of a stock, you would need to have a good understanding of the
company in which the stock represents part ownership: Are the managers competent and honest? Is there
a good and productive culture amongst the employees? Will there continue to be demand for the
company’s products and services long into the future? Or will improvements in technology make the
company’s products obsolete in the future? Will the competing companies do better and eventually pose a
serious threat to the company? And so on.
Even if you believe you understand all the relevant aspects of a company’s future, you also have to assess
whether the share-price is too high so the shares should not be bought. This means you have to estimate
the future earnings of the company, not just for the next year but for ten years or more into the future.
If Warren Buffett sometimes fails at making these complex assessments after having been the world’s most
successful investor for six decades, then you should expect to make a lot of costly mistakes as well.
5.1.4. The Simple Solution
Fortunately there are two very simple solutions you can do to protect yourself from making bad and costly
investments in individual companies.
The first is to diversify your investments so whatever bad happens to one stock will not hurt you much
overall because you have many other stocks in your portfolio. An easy and cheap way of getting very broad
diversification is to invest in a so-called stock-market index, which is explained in more detail below.
The second thing you can do to protect yourself is to add to your investment in the stock-market index over
time so you sometimes buy the stocks really cheap and sometimes you buy them much too expensive
compared to the future earnings of the companies in the index, but on average you pay a fair price and will
get a good return over time. Such cumulative investing is explained in more detail in section 7.
5.2. What is a Stock Index? A stock index is a collection of stocks that have something in common. For example, one index contains
stocks of companies in the financial sector, another index contains stocks of companies in the health care
sector, yet another index is for the energy sector, and so on.
You cannot invest directly in a stock index but you can invest in an index-fund that tries as closely as
possible to match the given index. The index-fund will generally buy all the stocks in the index but
sometimes it is infeasible for the index-fund to buy certain stocks of the index, and there are also expenses
related to managing the index-fund which must be deducted from the return on the stocks themselves. So
the index-fund may perform slightly differently from the actual index.
If we were to invest in a sector index such as financial or health-care companies then we would have to
assess the future prospects of that particular sector and whether the shares in that sector are generally
overpriced so we should not buy them at this point in time. Although this may seem easier than selecting
individual stocks, entire sectors of stocks are also sometimes subject to large swings in their share-prices,
and predicting the future of a sector is still very difficult and should not be attempted by the layman.
Layman’s Guide to Investing in the S&P 500
25
The next level is to consider an index for the entire US stock-market which would consist of all the stocks
traded on the large US stock-exchanges such as NYSE and NASDAQ. There are several thousand different US
stocks. Although there are index-funds that try to cover most of these stocks, it is actually only necessary to
invest in a few hundred stocks of the largest US companies because they generally dominate the overall
stock-market returns due to their size.
5.3. S&P 500 The S&P 500 stock-market index consists of 500 large companies in USA that operate in a wide variety of
industries including energy and utility, financial services, health care, information technology, heavy
industry, consumer products, etc. The S&P 500 index may be used as a proxy for the entire US stock market
because it covers about 80% of that market in terms of the combined size of the companies [9].
5.3.1. Market Capitalization Weighted
The S&P 500 is a so-called market-capitalization-weighted index, which means the index consists of
individual stocks in proportion to the total market value of all the stocks.
For example, at the time of this writing in March 2015, the company Apple accounted for about 4% of the
S&P 500 index, while the second-largest holding was Exxon Mobil which only accounted for about 2% of the
S&P 500 index, and the third-largest holding was Microsoft which accounted for about 1.9% of the S&P 500
index.
The companies of the S&P 500 index are chosen in proportion to their market value. The market value of all
the shares of a company is also called the market capitalization of the company. The market capitalization
of Apple is currently about $740 billion, which is calculated from the number of Apple’s shares multiplied
by the price per share. Apple currently has about 5.83 billion shares outstanding and the price per share is
about $127, which gives a total market value of $740 billion for all Apple’s shares, and this is what is meant
by Apple’s market capitalization. So if you were to buy all the shares of Apple and become the sole owner
of the company then you would have to pay $740 billion – provided all the existing shareholders would be
willing to sell their shares for $127 per share.
Similarly, the market capitalization of Exxon Mobil is currently about $356 billion and the market
capitalization of Microsoft is currently about $341 billion. The proportion of companies in the S&P 500
index is determined by these market capitalizations. The market capitalization of Apple is about twice as big
as that of Exxon Mobil and Microsoft, so the S&P 500 index contains about twice as much Apple stock as it
contains Exxon Mobil and Microsoft stock.
The 10th largest company in the S&P 500 is currently the pharmaceutical company Pfizer. The market
capitalization of all Pfizer’s shares is about $211 billion, which means it only accounts for about 1.1% of the
S&P 500 index. The 25th largest company in the S&P 500 index is PepsiCo which currently has a market
capitalization of about $141 billion and therefore only accounts for about 0.8% of the S&P 500 index. The
smallest company in the S&P 500 index is currently a company called Diamond Offshore Drilling whose
market capitalization is less than $4 billion and therefore only accounts for 0.02% of the S&P 500 index.

Layman’s Guide to Investing in the S&P 500
26
5.3.2. Safety of Diversification
Investing in the S&P 500 index gives very broad diversification as demonstrated above and this gives you
tremendous protection from problems with any individual company or industry.
Imagine you invest $10,000 in the S&P 500 and that its smallest company, Diamond Offshore Drilling, goes
bankrupt and their stock-price goes to zero. Because this company only accounts for 0.02% of the entire
S&P 500 index, their bankruptcy would only cause you to lose $2 on your $10,000 investment in the
S&P 500. The company Apple currently accounts for about 4% of the S&P 500 index and is by far the largest
constituent of the S&P 500. But even if Apple should go bankrupt and its stock went to zero you would only
lose about $400 on your $10,000 investment.
Of course, the opposite is also true. If an individual company in the S&P 500 index performs really well,
then the impact is very small on the overall S&P 500 index. For example, if the stock-price of the smallest
company in the S&P 500 increases 10-fold then you would only make $18 on your $10,000 investment in
the S&P 500 because that particular company only accounts for 0.02% of the S&P 500 index.
5.3.3. Replacing Companies
Companies may be added or removed from the S&P 500 index for a number of reasons, one of them being
bankruptcy. A committee at Standard & Poor’s decides which companies to remove and add based on
several criteria. Only few companies of the S&P 500 index are replaced each year and they are generally not
the largest companies of the index. Each company that is removed is replaced with another company so
there are always 500 companies in the index. The effect of replacing companies in the S&P 500 index is not
noticeable and can be ignored by the layman investor.
5.3.4. Alternatives
There are many alternatives to the S&P 500 index which provide similar or even broader diversification. For
example, the S&P Composite 1500 index covers about 91% of the available US stock-market compared to
only 80% coverage for the S&P 500. The MSCI US Investable Market 2500 index covers 98% of the US stock
market and the MSCI US Broad Market covers 99.5% of the US stock market because it also includes stocks
of very small companies.
There are also variations of the S&P 500 index itself, such as the equal-weighted S&P 500 in which each of
the 500 companies of the original S&P 500 account for about 0.2% of the portfolio. Some people believe
the equal-weighted S&P 500 is destined to outperform the original S&P 500 because the larger and more
mature companies will grow less percentage-wise than the small companies. Although the argument may
sound plausible, it is not true in general. For example, Apple is the largest company in the S&P 500 and
during the year up to March 2015 Apple’s stock-price increased almost 70%, while the smallest company in
the S&P 500, Diamond Offshore Drilling, lost more than (39%) during that year. Furthermore, variants of
the S&P 500 index may have much higher expense ratios than the original S&P 500 index and this
compounds into a significant cost over several decades of investing, as explained in section 5.5 below.
It is suggested that the layman invests in the original S&P 500 index for several reasons. The S&P 500 index
started in 1957 and is the oldest broadly diversified US stock-market index. Although the Dow Jones
Industrial Average (DJIA) already started in 1896 and is therefore much older than the S&P 500, the DJIA
only contains 30 large companies and is hence not as diversified and representative of the entire US stock-

Layman’s Guide to Investing in the S&P 500
27
market as the S&P 500 which covers about 80% of the US stock-market in terms of size. Another reason for
investing in the S&P 500 as opposed to newer indices is that price and dividend data is available for the
S&P 500 for almost 60 years, and more detailed financial data is available for more than 35 years. This
means we can get an understanding of how the S&P 500 performed during different historical periods and
economic conditions. Yet another reason for investing in the S&P 500 is the many competing index-funds
that help keep the expenses low, which is of great importance when you invest over several decades.
5.4. How to Invest in the S&P 500 Investing in the S&P 500 can be done in different ways. The specifics may have changed by the time you
read this, so you are encouraged to do your own research on the internet. What follows is a general
outline.
5.4.1. Vanguard
The first company to offer index-funds for investing in the S&P 500 was the Vanguard Group founded by
John Bogle. Vanguard have some of the funds with lowest expense ratios, which is important when you
invest over several decades, because a tiny increase in annual expenses may compound into substantial
costs when investing over several decades, as explained below.
Vanguard currently offers three ways of investing in the S&P 500, either through one of their mutual funds
which they call Admiral Shares and Investor Shares, or through an Exchange Traded Fund (ETF) which can
be traded like normal shares through a stock-broker using the ticker symbol VOO. The fees and expenses
vary for these three funds and you should research the current details directly on Vanguard’s website and
contact their staff for any questions, if you are confused about which fund may be right for you. Vanguard’s
internet website is:
www.vanguard.com
If you intend to invest for many years or even decades, then it is very important that you invest in the fund
that has the lowest expense ratio, as explained below. Vanguard requires you to initially invest a certain
amount in their fund with the lowest expense ratio. If you cannot afford this, then you may be able to
negotiate a lower initial amount if you agree to add to the account regularly – which is what you should do
anyway, as explained in section 7.
5.4.2. Exchange Traded Funds
There are several Exchange Traded Funds (ETFs) for investing in the S&P 500 which can be traded as if they
were normal shares through your stock-broker. Vanguard’s ETF was already mentioned above and trades
under the ticker symbol VOO. The company SPDR offers the ETF with the ticker symbol SPY, and the
company Blackrock (aka. iShares) offers the ETF with the ticker symbol IVV. Note that the share price of an
ETF normally does not equal the price of the S&P 500, but the percentage returns are very close.
An advantage of ETFs compared to mutual funds is that ETFs have no minimum amount you need to invest
while mutual funds may have minimum amounts of a few thousand dollars, although there may be no
lower limit when you add to your investment after this. Furthermore, if you already have an account with a
stock-broker then you can buy an ETF as you would any other stock. But if you plan to invest on a monthly
basis as is suggested in section 7, then the trading commissions for ETFs may become substantial over time
and it may be much cheaper and easier to set up an account with a mutual fund.

Layman’s Guide to Investing in the S&P 500
28
5.4.3. Alternatives
Some stock-brokers and financial institutions provide index funds for their customers that are very similar
to the S&P 500 but with even lower expense ratios and broker commissions. These funds might be
attractive alternatives to the S&P 500 if you have access to them, but there are a few things you should
investigate before investing in such a fund.
You should first ensure that the fund is highly diversified in several hundred of the largest US companies so
you get a performance similar to the S&P 500. Also ensure that the fund is unlevered so it does not use
borrowed money, and that the fund is passively managed so the fund simply buys and holds the stocks
without active trading in an attempt to outperform the stock-market. Finally ensure that the expense ratio
is lower than for the S&P 500 fund. A low expense ratio is very important as explained in the next section.
You should ask your stock-broker, bank or the company that handles your retirement savings if they have
any such low-cost alternatives to the S&P 500.
An example is the ETF that trades under the ticker symbol SCHX provided by the company Charles Schwab.
The fund buys and holds the stocks of the 750 largest US companies so it is even more diversified than the
S&P 500. Schwab also provides an ETF with the ticker symbol SCHB which invests in about 2,500 of the
largest US companies. The expense ratios are currently amongst the lowest for these types of funds, and if
you are a client with Charles Schwab then you pay no stock-broker commissions for these ETFs.
5.5. Fees and Commissions There are two costs you should beware of when investing in index-funds. The first cost is the commission or
fee that you have to pay when you make your investment in the index-fund or when you add to an existing
investment. It is important that these fees are a very low percentage of the investment amount.
As will be discussed in section 7, you should ideally add to your S&P 500 investment every month, because
you are then more likely to pay a fair price for the shares, on average and over time. But if the amount you
can afford to invest on a monthly basis is so small that trading commissions are a substantial part of the
investment amount, say 1% or more, then you should save the money for several months until you can
invest an amount where the trading commission is lower than 1%. In the meantime you can invest the
money in US government bonds to get some return on the money, see section 4.
For example, if you can only afford to save $100 per month and you have to pay $10 commission each time
you add to your investment in the S&P 500 index-fund, then you have effectively already lost 10% on the
investment just to pay for the commission. This loss will probably take you more than a year to make up
from the returns on the S&P 500. Instead you should save the $100 each month until you have $1,000 or
more. Then the $10 commission only represents 1% of the amount you invest, which is on average earned
back within a month or two of investing in the S&P 500 index.
5.5.1. Expense Ratio
The other cost of investing in the S&P 500 that you should beware of is the expense ratio of the index-fund.
This may seem like a tiny cost, but over decades of investing even a tiny difference in the annual expense
ratio compounds into a substantial overall cost.
For example, at the time of this writing in March 2015, the expense ratio is about 0.1% for the SPY ETF.
Compare this to the expense ratio of 0.05% for the VOO ETF. At first glance this looks like a tiny difference

Layman’s Guide to Investing in the S&P 500
29
in expense ratio especially because they are already so low. If you invest $10,000 in both the SPY and VOO
ETFs, and the price of the S&P 500 index does not change for the year, then the expense ratio corresponds
to $10 for SPY and $5 for VOO. Five dollars difference seems tiny and unimportant compared to your
$10,000 investment. But if you keep the investment for 30 years and the S&P 500 gains 9% per year on
average, then the SPY investment would only be worth $129,073 while the VOO investment would be
worth $130,863 after 30 years.3 The difference is almost $1,790. So by merely investing in VOO instead of
SPY you will end up with $1,790 more after 30 years, when taxes are ignored. If the inflation over the next
30 years is 3% per year, then the $1,790 in 30 years from now corresponds to almost $740 today, which is
7.4% of the original $10,000 investment. What seemed like a tiny difference in expense ratio compounds
into a substantial difference over many years. Furthermore, if you add to your S&P 500 investment on a
monthly basis as suggested in section 7, then the compounded savings become even greater.
The average expense ratio for an index-fund that invests in the S&P 500 is 0.36% according to the research
company Morningstar. Let us see how much we would pay in expenses if we selected an index-fund with
this expense ratio. Assume again that you invest $10,000 and the S&P 500 gains 9% per year and the index-
fund takes 0.36% to cover their expenses each year. After 30 years your $10,000 investment would be
worth $120,141 which is $10,722 less than if the money had been invested in an index-fund with an
expense ratio of only 0.05%, such as the VOO fund mentioned above. If the inflation over the next 30 years
is 3% per year, then the $120,141 in 30 years from now corresponds to almost $49,497 today. Compare this
to the investment in the VOO fund with its 0.05% expense ratio where the $10,000 investment would be
worth $130,863 after 30 years, which corresponds to almost $53,914 in today’s money when adjusted for
3% inflation per year. The difference between an expense ratio of 0.05% and 0.36% correspond to about
$4,417 in today’s money, which is more than 44% of the original $10,000 investment.
What may seem like a small difference in expense ratio, will compound into a substantial under-
performance when investing for several decades. It is therefore very important that you invest in the
S&P 500 index-fund that offers the lowest expense ratio, unless there are very good reasons to invest
elsewhere.
5.6. Summary The S&P 500 is a stock-market index which contains the stocks of 500 of the largest companies in USA. The
S&P 500 is diversified in all major business sectors and covers about 80% of the total US stock-market in
terms of size. The largest company currently accounts for about 4% of the S&P 500 index while the smallest
company only accounts for 0.02% of the index. This broad diversification protects the investor from making
costly mistakes when investing in individual companies.
There are many other stock indices but the S&P 500 has two advantages to the layman. Firstly, there are
many mutual funds and Exchange Traded Funds (ETFs) available for investing in the S&P 500. You should
select the index-fund with the lowest expense ratio, which is very important if you invest over several
decades because it saves you substantial amounts of money over time. Secondly, historical data for the
S&P 500 is available from 1957 which allows us to study the performance during different periods to get an
understanding of the historical risks and returns of the S&P 500. This is done in the following section.
3 Calculated as: Value = Invested Amount x (1 + Return – Expense Ratio)
Years = $10,000 x (1 + 9% – 0.05%)
30 ≈ $130,863

Layman’s Guide to Investing in the S&P 500
30
6. Historical Returns of the S&P 500 This section studies the historical returns of the S&P 500 index. Although the S&P 500 dates back to 1957,
this section only uses data beginning in January 1962 because the S&P 500 is compared to US government
bonds whose data is apparently only publicly available from 1962. The period between 1957 and 1962 was
uneventful for the S&P 500 and its price increased steadily during those five years so they can safely be
ignored here. Taxes are also ignored in this section and discussed in section 10.
This section has a lot of statistics. If you get confused and want to skip it, make sure you read the summary.
6.1. Long-Term Returns At the beginning of January 1962 the price for the S&P 500 was almost $71 and at the end of December
2013 it was almost $1,850. This was a return of more than 2,500% over 52 years, corresponding to a return
of almost 6.5% per year on average.
The companies in the S&P 500 also pay dividends which are not included in the annual 6.5% price return of
the S&P 500. The so-called total return of the S&P 500 assumes dividends are reinvested each year and
there are no taxes. With dividends reinvested, the S&P 500 gained more than 12,000% during these 52
years, which means that $1 invested in the S&P 500 in January 1962 would have been worth about $121 in
December 2013. This corresponds to an average annual return of almost 9.7%. This is shown in Figure 5.
Figure 5: Total return for the S&P 500 when dividends are reinvested. Period is January 1962 to December 2013. Data from Standard & Poor’s, alternative sources e.g. [10] and [11].
1960 1970 1980 1990 2000 20101960 1970 1980 1990 2000 2010
0 %
2,000 %
4,000 %
6,000 %
8,000 %
10,000 %
12,000 %

Layman’s Guide to Investing in the S&P 500
31
6.1.1. Inflation
Although $1 invested in the S&P 500 in 1962 had increased to about $121 at the end of 2013 through the
increase in the S&P 500 price and reinvestment of dividends, the purchasing power of the dollar had in the
meantime decreased by (87%) because of inflation. The inflation-adjusted return on the S&P 500 was
therefore only about 1,500% over 52 years which corresponds to an average return of about 5.4% per year.
This means that if you invested in the S&P 500 during this period then after 13 years on average, the
inflation-adjusted value of your investment had doubled and you could buy twice as many goods, even
though the goods had become much more expensive due to inflation during those 13 years. After 26 years
you could buy four times as many goods, after 39 years you could buy eight times as many goods, and
finally after 52 years you could buy nearly sixteen times as many goods for the money you had originally
invested in the S&P 500. This doubling in purchasing power of your investment every 13 years shows the
power of compounding investment returns over many years.
6.2. Causes of Growth To assess whether the historical returns of the S&P 500 can be expected to continue in the future, we first
need to consider the causes of those historical returns. The return on the S&P 500 depends on the price
change and dividend payouts, both of which depend on the earnings of the companies in the S&P 500.
Figure 6 shows the price, earnings and dividends of the S&P 500 between January 1962 and December
2013 which are discussed in the following sections.
Figure 6: Growth of the price, earnings and dividends of the S&P 500 between January 1962 and December 2013. Data from Standard & Poor’s, alternative sources e.g. [10] and [11].
1960 1970 1980 1990 2000 20101960 1970 1980 1990 2000 2010
0 %
500 %
1,000 %
1,500 %
2,000 %
2,500 %
S&P 500 Price
Earnings
Dividends
Layman’s Guide to Investing in the S&P 500
32
6.2.1. Earnings
On average, the price of the S&P 500 grew 6.40% per year while the earnings grew slightly more at 6.45%
per year.4
In the long term we would expect the price of the S&P 500 to follow the earnings growth, because the
earnings ultimately determine how valuable the companies in the S&P 500 are to their shareholders. But
the future earnings cannot be known in advance which gives rise to speculation that causes the price of the
S&P 500 to be more volatile than the actual earnings. Such speculation is inevitable in stock-markets.
6.2.2. Dividends
Now compare the earnings and dividends in Figure 6 and note that the dividends grew more smoothly than
the earnings. Dividends are paid out to shareholders from the earnings so in the long term dividends
cannot exceed the earnings. Because the earnings are volatile, companies can smoothen the dividends by
using cash reserves or borrowing money in case of temporarily declining earnings, and companies can build
their cash reserves by delaying dividend increases when their earnings are growing.
Share Buybacks
On average, the dividends only grew 5.5% per year which was almost 1% (percentage point) less than the
earnings growth of 6.45%. A possible cause of this disparity is that US companies have significantly
increased their so-called share buybacks since the mid 1990’s. Instead of paying a dividend a company can
use the money to repurchase some of the shares from the shareholders who wish to sell their shares.
Whether this is good or bad for the remaining shareholders depends on the share-price relative to future
earnings, which is something that cannot be known in advance. This means a share buyback is a peculiar
form of investment that the company makes on behalf of its remaining shareholders. If the share-price
eventually turns out to have been too high then the share buyback would have destroyed value for the
remaining shareholders, and conversely if the share-price eventually turns out to have been a bargain then
the share buyback would have increased value for the remaining shareholders.
There is an elaborate mathematical theory on how to assess whether a share buyback is good or bad for
the remaining shareholders, see [12]. But this is not something a small private investor in the S&P 500
should be concerned about.
6.2.3. US Economy
The so-called Gross Domestic Product (GDP) measures the total size of the US economy. In 1962 the GDP
was almost $600 billion and by 2013 the GDP had grown to more than $17,000 billion, which corresponds
to a growth of almost 6.7% per year on average. This is similar to the earnings growth for the S&P 500
which was 6.5% per year on average. We would expect such a close relationship between the US economy
and the S&P 500 because the companies in the S&P 500 are some of the largest companies in USA.
4 The price growth was previously reported to be 6.5% per year because it was calculated using the start
and end-values of the S&P 500, while the growth rate of 6.40% per year is calculated by fitting a so-called
exponential curve to the data so as to lower any distortion that might be caused by those particular start
and end-values. The estimated growth rates are very similar and you can ignore this minor technicality.

Layman’s Guide to Investing in the S&P 500
33
6.2.4. Inflation, Population and Productivity
A significant cause of the growth in the US economy and the earnings of the S&P 500 was inflation.
Between 1962 and 2013 the inflation was about 4.0% per year on average, as measured by the CPI in
section 3. The earnings of the S&P 500 grew almost 6.5% per year during this period, which was almost
2.5% (percentage points) more than the inflation each year.
There are several causes for the earnings growth of the S&P 500 exceeding the inflation. One cause is the
growth in the US population. In January 1962 there were about 184 million people in USA and by December
2013 the population had grown to almost 318 million. This corresponds to a growth rate of about 1.06%
per year on average. The population growth was larger in the earlier part of this period.
Another and more significant cause of earnings growth for the S&P 500 is increased productivity of US
workers. This can be measured by adjusting the GDP for both the inflation and increased population. The
adjusted GDP growth rate was about 2.0% per year on average. This means the productivity of each US
worker increased about 2% per year and almost tripled between 1962 and 2013. The work hours did not
increase from 8 to 24 hours a day, so the cause of this improved productivity is likely the technological
innovation that occurred during that period.
6.2.5. Forecasting the Future
The historical return on the S&P 500 was mainly driven by inflation, increased productivity of US workers,
and a growing US population.
The most significant factor was inflation of about 4% per year on average. Whatever the future inflation is
going to be, the S&P 500 can be expected to grow at least as much as the inflation over time. This is
because the price of goods and services increase with inflation and this causes the earnings to increase for
the companies in the S&P 500, which in turn causes the price and dividends of the S&P 500 to increase.
The second factor was increased productivity of US workers of about 2% per year, which was likely due to
technological innovation. The past few hundred years have seen human innovation of epic proportions.
Whether this will continue in the future and for how long is hard to predict.
The third factor was a US population that grew about 1% per year, although it seemed to contribute less to
the growth of the S&P 500. The US Census Bureau estimates that the US population will grow about 0.8% in
2015 and the annual growth rate will gradually decrease to about 0.5% in 2060. Although the US population
may grow slightly less than it previously has, it does not appear to be an important factor in the growth of
the S&P 500, and the companies in the S&P 500 may also sell more products abroad where populations are
growing more and also becoming wealthier.
So the main question about the long-term future return of the S&P 500 seems to be whether the
technological innovation will continue and for how long.

Layman’s Guide to Investing in the S&P 500
34
6.3. Investment Periods The historical long-term return of the S&P 500 had greatly outperformed inflation and made the investor
much wealthier in terms of purchasing power. But merely considering the average return of the S&P 500
over more than half a century hides a volatility that can sometimes be extreme. For example, in the nine
years ending on March 24, 2000, the price of the S&P 500 increased from around $367 to $1,527 for a gain
of about 316%. But in the following nine years ending on March 24, 2009, the price of the S&P 500
decreased from about $1,527 to $806 for a loss of about (47%), that is, nearly a halving in price. To better
understand the historical risks and returns of the S&P 500 we must therefore consider many different
starting dates and investment durations.
6.4. Investing for 1 Year We first consider one-year investment periods for the S&P 500 index. The earliest one-year period that we
consider started in January 1962. The last one-year period started in December 2012 and ended in
December 2013. We do not merely consider investment periods that match the calendar years but consider
all possible starting dates. For example, the first investment period we consider started on January 2, 1962
and ended on January 2, 1963. But we also consider the investment period that started on the following
day, January 3, 1962 and ended on January 3, 1963. Altogether we consider a total of 12,694 one-year
investment periods between January 1962 and December 2013.
The average return for the S&P 500 over all these one-year investment periods was about 11.2%, but there
were great differences in return depending on when the investments were made.
The worst one-year loss for the S&P 500 was (46.8%) which occurred in the year following March 5, 2008
where the price of the S&P 500 was $1,334 and decreased to $683 a year later, thus having a loss of
(48.8%) which was slightly offset by a dividend yield of 2% for a total return of (46.8%).
The greatest one-year gain for the S&P 500 was 71.8% which occurred in the year following March 9, 2009
where the price of the S&P 500 was $677 and increased to $1,140 a year later, thus having a gain of 68.6%
plus a dividend yield of 3.2% for a total return of 71.8%.
An example of a one-year return that was very close to the average return, occurred in the year following
October 19, 1964 where the price of the S&P 500 was $84.93 and increased to $91.80 a year later, thus
having a gain of 8.1% plus a dividend yield of 3.1% for a total return of about 11.2%, which was about the
same as the average return for all one-year investment periods between 1962 and 2013.
In summary, the one-year returns of the S&P 500 were 11.2% on average, but the returns were very volatile
and ranged between a loss of (46.8%) in one year and a gain of 71.8% in another year. Half of the one-year
returns were between 2% and 22%.
6.4.1. Compared to Inflation
An important reason for investing is to make up for inflation. So let us compare how the S&P 500
performed relative to inflation over all one-year periods between 1962 and 2013. On average, the S&P 500
returned 7.1% (i.e. percentage points) more than the inflation. But because the S&P 500 was highly volatile,
the return on the S&P 500 was only greater than the inflation in about 7 out of 10 years.

Layman’s Guide to Investing in the S&P 500
35
The worst under-performance occurred in the year following October 3, 1973 during which the S&P 500
lost (39.4%) and at the same time inflation was very high at 12%, thus giving an inflation-adjusted loss of
(45.9%) for the S&P 500.
Conversely, the S&P 500 outperformed inflation the most in the year following March 9, 2009, which was
already mentioned above as the year in which the S&P 500 had its greatest historical one-year return of
71.8%. During this year the inflation was only 2.3% so the inflation-adjusted return on the S&P 500 was
about 68%.
Note that the correct way of calculating inflation-adjusted returns is to use division rather than subtraction,
so the return on the S&P 500 is divided by the change in the CPI. For example, a 71.8% return of the
S&P 500 and a 2.3% increase in the CPI gives an inflation-adjusted return of 171.8% / 102.3% – 1 = 68%,
rather than calculating the inflation-adjusted return using subtraction like so: 71.8% – 2.3% = 69.5%.
Although the results are quite similar and will often suffice for making quick estimates.
6.4.2. Compared to US Government Bonds
Now consider whether the S&P 500 or US government bonds were better investments when investing for
one year and ignoring taxes. Between 1962 and 2013 the S&P 500 outperformed US government bonds in 7
out of 10 years, about the same frequency as the S&P 500 outperformed inflation. On average, the S&P 500
returned 5.6% (i.e. percentage points) more than US government bonds with one-year maturity.
The worst under-performance occurred in the year following November 20, 2007 where the S&P 500 lost
(45.8%) and US government bonds returned 3.3%.
Conversely, the S&P 500 outperformed US government bonds the most in the year following March 9,
2009, which was already mentioned above as the year in which the S&P 500 had its greatest historical one-
year return of 71.8%. During this year US government bonds returned only 0.7%.
6.5. Investing for 5 Years Now consider 5-year investment periods for the S&P 500 index. The earliest 5-year period we consider
started in January 1962. The last 5-year period started in December 2008 and ended in December 2013. We
do not merely consider investment periods that match the calendar years but consider all possible starting
dates. For example, the first investment period we consider started on January 2, 1962 and ended 5 years
later. But we also consider the investment period that started on the following day, January 3, 1962 and
ended 5 years later. Altogether we consider a total of 11,694 five-year investment periods between January
1962 and December 2013.
The average annualized return for the S&P 500 over all these 5-year investment periods was about 9.6%.
There were big differences in annualized return depending on when the investments were made, but the
annualized returns were less extreme when investing for 5 years compared to just one year.

Layman’s Guide to Investing in the S&P 500
36
Worst 5 Year Period
The worst 5-year loss for the S&P 500 was (34.4%) which occurred in the 5 years from March 5, 2004 to
2009. This corresponds to an annual loss of (8.1%) that is compounded for 5 years. The starting price for
the S&P 500 was $1,157 which decreased to $683 five years later for a loss of (41.0%) which was offset
slightly by dividends that were reinvested during the years so the net loss was (34.4%). This period is shown
in Figure 7.
Figure 7: Comparison of the total return for the S&P 500 index, US government bonds and inflation as measured by the US CPI. Starting date is March 5, 2004 and investment period is 5 years.
2004 2005 2006 2007 2008 20092004 2005 2006 2007 2008 2009
-20 %
0 %
20 %
40 %
S&P 500
US Gov. Bond
Inflation CPI

Layman’s Guide to Investing in the S&P 500
37
Best 5 Year Period
The greatest 5-year gain for the S&P 500 was 292% which occurred in the 5 years from August 11, 1982 to
1987. This corresponds to an annual gain of 31.4% that is compounded for 5 years. The starting price for
the S&P 500 was $102.60 which increased to $333.33 five years later for a 225% gain, which was further
increased by dividends that were reinvested during the years so the total gain was 292%. This period is
shown in Figure 8.
Figure 8: Comparison of the total return for the S&P 500 index, US government bonds and inflation as measured by the US CPI. Starting date is August 11, 1982 and investment period is 5 years.
1983 1984 1985 1986 19871983 1984 1985 1986 1987
0 %
50 %
100 %
150 %
200 %
250 %
300 %S&P 500
US Gov. Bond
Inflation CPI

Layman’s Guide to Investing in the S&P 500
38
Average 5 Year Period
An example of a 5-year return that was very close to the average annualized return of 9.6%, occurred in the
5 years from June 28, 1989 to 1994. The starting price for the S&P 500 was $325.81 which increased to
$446.07 five years later for a 37% gain, which was further increased by dividends that were reinvested
during the 5 years so the total gain was 58% corresponding to about 9.6% per year on average. This period
is shown in Figure 9.
Figure 9: Comparison of the total return for the S&P 500 index, US government bonds and inflation as measured by the US CPI. Starting date is June 28, 1989 and investment period is 5 years.
Summary
The 5-year returns of the S&P 500 were 9.6% per year on average, but the returns were quite volatile and
ranged between an annualized loss of (8.1%) in one 5-year period and an annualized gain of 31.4% in
another 5-year period. Half of the 5-year periods had annualized returns between 3% and 15%.
6.5.1. Compared to Inflation
Now compare the S&P 500 returns to the inflation over all 5-year periods between 1962 and 2013. On
average, the S&P 500 returned 5.3% (i.e. percentage points) more than the inflation each year. But because
the S&P 500 was highly volatile compared to the inflation, the return on the S&P 500 was only greater than
the inflation in about 67% of the 5-year periods.
1990 1991 1992 1993 19941990 1991 1992 1993 1994
0 %
20 %
40 %
60 %
S&P 500
US Gov. Bond
Inflation CPI

Layman’s Guide to Investing in the S&P 500
39
The worst under-performance occurred in the 5 years from October 2, 1969 to 1974 during which the
S&P 500 lost (4.3%) per year on average and at the same time inflation was high at 6.5% per year, thus
giving an inflation-adjusted loss of (10.2%) per year for the S&P 500.
Conversely, the S&P 500 outperformed inflation the most in the 5 years from August 11, 1982 to 1987,
which was already mentioned above and shown in Figure 8 as the 5 years in which the S&P 500 had its
greatest historical return of 31.4% per year. During these 5 years the inflation was only 3.2% per year so the
inflation-adjusted return on the S&P 500 was 27.3% per year.
You may note that these inflation-adjusted returns of the S&P 500 are not calculated by subtracting the
inflation from the S&P 500 return. As mentioned in section 6.4.1, the correct way of calculating inflation-
adjusted returns is to use division rather than subtraction.
6.5.2. Compared to US Government Bonds
Now consider whether the S&P 500 or US government bonds were better investments over 5-year periods.
We consider the total return of the S&P 500 where the dividends are reinvested, and we consider US
government bonds with one-year maturity that are reinvested in new government bonds after each year.
On average, the S&P 500 returned 3.7% (i.e. percentage points) more than US government bonds each
year, when investing over 5-year periods. But because the S&P 500 was highly volatile compared to
US government bonds, the return on the S&P 500 was only greater than the return on US government
bonds in about 66% of the 5-year periods.
The worst under-performance occurred in the 5 years from March 5, 2004 to 2009 during which the
S&P 500 lost (8.1%) per year on average and at the same time US government bonds returned 3.1% per
year on average. This is shown in Figure 7.
Conversely, the S&P 500 outperformed US government bonds the most in the 5 years from December 1,
1994 to 1999. During these 5 years the S&P 500 returned 28.3% per year on average while US government
bonds only returned 5.5% per year on average.
6.6. Investing for 10 Years Now consider 10-year investment periods for the S&P 500 index. The earliest 10-year period we consider
started in January 1962. The last 10-year period started in December 2003 and ended in December 2013.
We do not merely consider investment periods that match the calendar years but consider all possible
starting dates. For example, the first investment period we consider started on January 2, 1962 and ended
10 years later. But we also consider the investment period that started on the following day, January 3,
1962 and ended 10 years later. Altogether we consider a total of 10,442 ten-year investment periods
between January 1962 and December 2013.
The average annualized return for the S&P 500 over all these 10-year investment periods was about 10.1%.
There were big differences in annualized return depending on when the investments were made, but the
annualized returns were less extreme when investing for 10 years compared to just one year.

Layman’s Guide to Investing in the S&P 500
40
Worst 10 Year Period
The worst 10-year loss for the S&P 500 was (33.6%) which occurred in the 10 years from March 3, 1999 to
2009. This corresponds to an annual loss of (4.0%) that is compounded for 10 years. The starting price for
the S&P 500 was $1,228 which decreased to $696 ten years later for a loss of (43.3%) which was offset
somewhat by dividends that were reinvested during the years. This period is shown in Figure 10.
Figure 10: Comparison of the total return for the S&P 500 index, US government bonds and inflation as measured by the US CPI. Starting date is March 3, 1999 and investment period is 10 years.
2000 2002 2004 2006 20082000 2002 2004 2006 2008
-20 %
0 %
20 %
40 %
S&P 500
US Gov. Bond
Inflation CPI
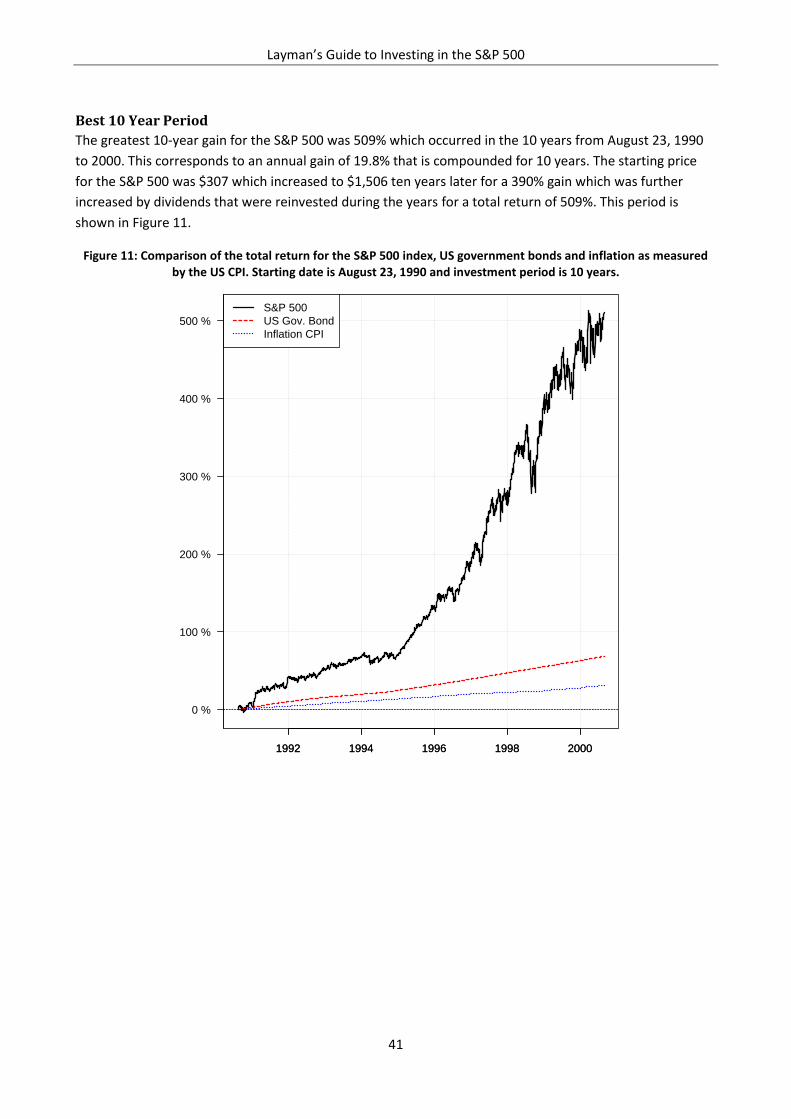
Layman’s Guide to Investing in the S&P 500
41
Best 10 Year Period
The greatest 10-year gain for the S&P 500 was 509% which occurred in the 10 years from August 23, 1990
to 2000. This corresponds to an annual gain of 19.8% that is compounded for 10 years. The starting price
for the S&P 500 was $307 which increased to $1,506 ten years later for a 390% gain which was further
increased by dividends that were reinvested during the years for a total return of 509%. This period is
shown in Figure 11.
Figure 11: Comparison of the total return for the S&P 500 index, US government bonds and inflation as measured by the US CPI. Starting date is August 23, 1990 and investment period is 10 years.
1992 1994 1996 1998 20001992 1994 1996 1998 2000
0 %
100 %
200 %
300 %
400 %
500 %
S&P 500
US Gov. Bond
Inflation CPI
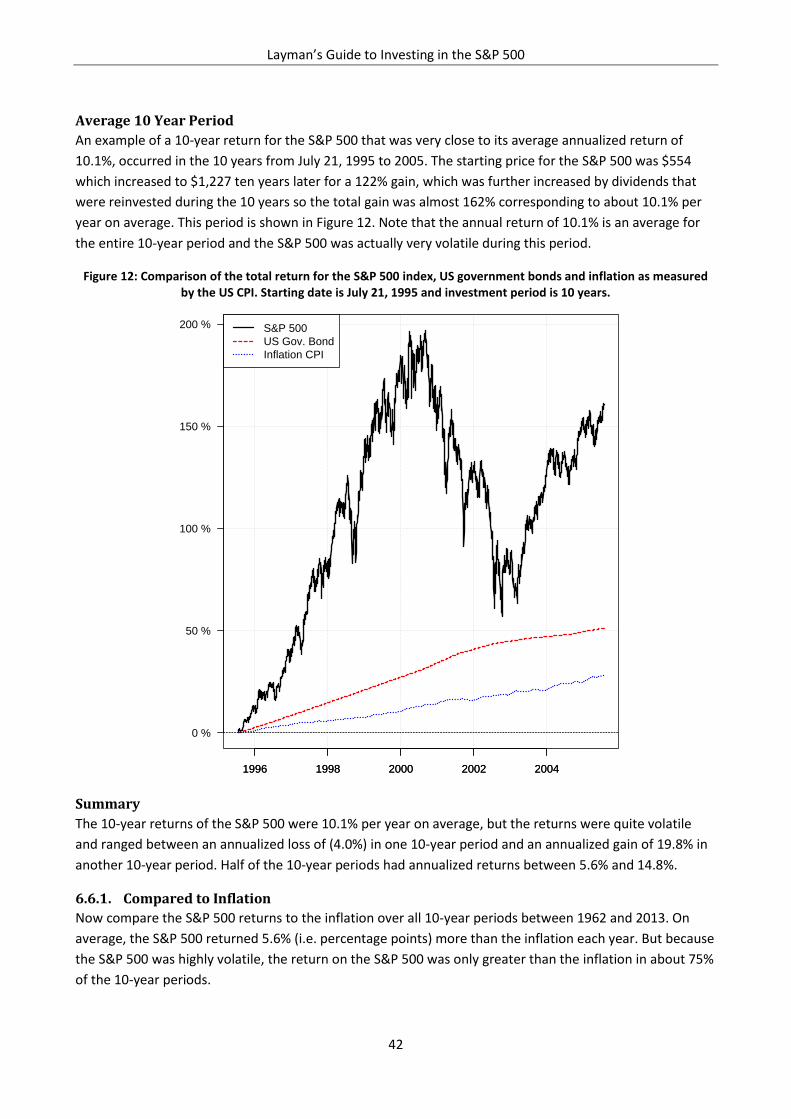
Layman’s Guide to Investing in the S&P 500
42
Average 10 Year Period
An example of a 10-year return for the S&P 500 that was very close to its average annualized return of
10.1%, occurred in the 10 years from July 21, 1995 to 2005. The starting price for the S&P 500 was $554
which increased to $1,227 ten years later for a 122% gain, which was further increased by dividends that
were reinvested during the 10 years so the total gain was almost 162% corresponding to about 10.1% per
year on average. This period is shown in Figure 12. Note that the annual return of 10.1% is an average for
the entire 10-year period and the S&P 500 was actually very volatile during this period.
Figure 12: Comparison of the total return for the S&P 500 index, US government bonds and inflation as measured by the US CPI. Starting date is July 21, 1995 and investment period is 10 years.
Summary
The 10-year returns of the S&P 500 were 10.1% per year on average, but the returns were quite volatile
and ranged between an annualized loss of (4.0%) in one 10-year period and an annualized gain of 19.8% in
another 10-year period. Half of the 10-year periods had annualized returns between 5.6% and 14.8%.
6.6.1. Compared to Inflation
Now compare the S&P 500 returns to the inflation over all 10-year periods between 1962 and 2013. On
average, the S&P 500 returned 5.6% (i.e. percentage points) more than the inflation each year. But because
the S&P 500 was highly volatile, the return on the S&P 500 was only greater than the inflation in about 75%
of the 10-year periods.
1996 1998 2000 2002 20041996 1998 2000 2002 2004
0 %
50 %
100 %
150 %
200 % S&P 500
US Gov. Bond
Inflation CPI

Layman’s Guide to Investing in the S&P 500
43
The worst under-performance occurred in the 10 years from March 3, 1999 to 2009 during which the
S&P 500 lost (4.0%) per year and at the same time inflation was 2.6% per year, thus giving an inflation-
adjusted loss of (6.4%) per year for the S&P 500.
Conversely, the S&P 500 outperformed inflation the most in the 10 years from August 23, 1990 to 2000,
which was already mentioned above as the 10 years in which the S&P 500 had its greatest historical return
of 19.8% per year. This is shown in Figure 11. During these 10 years the inflation was only 2.7% per year so
the inflation-adjusted return on the S&P 500 was 16.6% per year.
You may note that these inflation-adjusted returns of the S&P 500 are not calculated by subtracting the
inflation from the S&P 500 return. As mentioned in section 6.4.1, the correct way of calculating inflation-
adjusted returns is to use division rather than subtraction.
6.6.2. Compared to US Government Bonds
Now consider whether the S&P 500 or US government bonds were better investments when investing for
10 years. We consider the total return of the S&P 500 where the dividends are reinvested, and we consider
US government bonds with one-year maturity that are reinvested in new government bonds after each
year.
On average, the S&P 500 returned 3.8% (i.e. percentage points) more than US government bonds each
year, when investing over 10-year periods. But because the S&P 500 was highly volatile compared to
government bond yields, the return on the S&P 500 was only greater than the return on US government
bonds in about 74% of the 10-year periods.
The worst under-performance occurred in the 10 years from March 3, 1999 to 2009, which was already
mentioned above as the 10 years in which the S&P 500 had its greatest historical 10-year loss of (4.0%) per
year, while US government bonds returned 3.5% per year on average. This is shown in Figure 10.
Conversely, the S&P 500 outperformed US government bonds the most in the 10 years from August 23,
1990 to 2000, which was already mentioned above as the 10 years in which the S&P 500 had its greatest
historical return of 19.8% per year, while US government bonds only returned 5.4% per year on average.
This is shown in Figure 11.
6.7. Investing for 20 Years Now consider 20-year investment periods for the S&P 500 index. The earliest 20-year period we consider
started in January 1962. The last 20-year period started in December 1993 and ended in December 2013.
We do not merely consider investment periods that match the calendar years but consider all possible
starting dates. For example, the first investment period we consider started on January 2, 1962 and ended
20 years later. But we also consider the investment period that started on the following day, January 3,
1962 and ended 20 years later. Altogether we consider a total of 7,941 twenty-year investment periods
between January 1962 and December 2013.
The average annualized return for the S&P 500 over all these 20-year investment periods was about 11.4%.
There were significant differences in annualized return depending on when the investments were made,
but the annualized returns were much less extreme when investing for 20 years instead of just one year.

Layman’s Guide to Investing in the S&P 500
44
Worst 20 Year Period
The lowest annualized return was 6.1% which occurred in the 20 years from February 23, 1962 to 1982. The
starting price for the S&P 500 was $70.16 which increased to $111.51 twenty years later for a 59% gain,
which was further increased by dividends that were reinvested during the 20 years so the total gain was
226% corresponding to about 6.1% per year on average. This period is shown in Figure 13.
Figure 13: Comparison of the total return for the S&P 500 index, US government bonds and inflation as measured by the US CPI. Starting date is February 23, 1962 and investment period is 20 years.
1965 1970 1975 19801965 1970 1975 1980
0 %
50 %
100 %
150 %
200 %
250 %
300 % S&P 500
US Gov. Bond
Inflation CPI

Layman’s Guide to Investing in the S&P 500
45
Best 20 Year Period
The greatest annualized return was 18.2% which occurred in the 20 years from March 27, 1980 to 2000.
The starting price for the S&P 500 was about $98 which increased to $1,524 twenty years later for a 1,451%
gain, which was further increased by dividends that were reinvested during the 20 years so the total gain
was 2,731% corresponding to about 18.2% per year on average. This period is shown in Figure 14.
Figure 14: Comparison of the total return for the S&P 500 index, US government bonds and inflation as measured by the US CPI. Starting date is March 27, 1980 and investment period is 20 years.
1980 1985 1990 1995 20001980 1985 1990 1995 2000
0 %
500 %
1,000 %
1,500 %
2,000 %
2,500 %
S&P 500
US Gov. Bond
Inflation CPI

Layman’s Guide to Investing in the S&P 500
46
Average 20 Year Period
An example of a 20-year return that was very close to the average annualized return of 11.4%, occurred in
the 20 years from April 22, 1970 to 1990. The starting price for the S&P 500 was $84.27 which increased to
$331.05 twenty years later for a 293% gain, which was further increased by dividends reinvested during the
20 years so the total gain was almost 772% corresponding to about 11.4% per year on average. This period
is shown in Figure 15. Note that the annual return of 11.4% is an average for the entire 20-year period and
the S&P 500 was actually quite volatile during this period.
Figure 15: Comparison of the total return for the S&P 500 index, US government bonds and inflation as measured by the US CPI. Starting date is April 22, 1970 and investment period is 20 years.
Summary
The 20-year returns of the S&P 500 were 11.4% per year on average, but the annualized returns were
somewhat volatile and ranged between 6.1% in one 20-year period and 18.2% in another 20-year period.
Half of the 20-year periods had annualized returns between 8.6% and 13.5%.
6.7.1. Compared to Inflation
Now compare the S&P 500 returns to the inflation over all 20-year periods between 1962 and 2013. On
average, the S&P 500 returned 6.9% (i.e. percentage points) more than the inflation each year. The
S&P 500 outperformed inflation in all these 20-year periods.
1970 1975 1980 1985 19901970 1975 1980 1985 1990
0 %
200 %
400 %
600 %
800 %
S&P 500
US Gov. Bond
Inflation CPI

Layman’s Guide to Investing in the S&P 500
47
The smallest difference between the returns of the S&P 500 and the inflation occurred in the 20 years from
February 23, 1962, which was already mentioned above as the 20 years in which the S&P 500 had its lowest
annualized return of 6.1% per year. This is shown in Figure 13. During these 20 years the inflation was 5.9%
per year on average, thus giving an inflation-adjusted return of only 0.2% per year for the S&P 500.
Conversely, the S&P 500 outperformed inflation the most in the 20 years from March 27, 1980 to 2000,
which was already mentioned above as the 20 years in which the S&P 500 had its greatest historical 20-year
return of 18.2% per year. This is shown in Figure 14. During these 20 years the inflation was only 3.8% per
year so the inflation-adjusted return on the S&P 500 was 13.8% per year.
You may note that these inflation-adjusted returns of the S&P 500 are not calculated by subtracting the
inflation from the S&P 500 return. As mentioned in section 6.4.1, the correct way of calculating inflation-
adjusted returns is to use division rather than subtraction.
6.7.2. Compared to US Government Bonds
Now consider whether the S&P 500 or US government bonds were better investments for 20 year periods.
We consider the total return of the S&P 500 where the dividends are reinvested, and we consider US
government bonds with one-year maturity that are reinvested in new government bonds after each year.
On average, the S&P 500 returned 4.7% (i.e. percentage points) more than US government bonds per year,
when investing over 20-year periods. The return on the S&P 500 was greater than the return on
US government bonds in more than 98% of the 20-year periods.
The worst under-performance occurred in the 20 years from July 15, 1964 to 1984 during which the
S&P 500 returned 7% per year and at the same time US government bonds returned 7.5% per year on
average.
Conversely, the S&P 500 outperformed US government bonds the most in the 20 years from March 27,
1980 to 2000, which was already mentioned above as the 20 years in which the S&P 500 had its greatest
historical 20-year return of 18.2% per year, while US government bonds only returned 7.8% per year on
average.
6.8. Recovery Times There are different ways of calculating the time it takes for the S&P 500 to recover from losses. It was
shown above that the S&P 500 had losses in some 10-year periods but there were no losses in 20-year
periods. This suggests the time to recover from losses is somewhere between 10 and 20 years. However,
the periods were chosen to be exactly 10 or 20 years, so it is possible that the S&P 500 actually recovered
much sooner but then declined again.
This section considers the time it takes for the S&P 500 to recover from losses the first time and ignores
subsequent declines. It is assumed that dividends are reinvested in the S&P 500 and that there are no
taxes, otherwise the recovery times would be longer.
Between January 1962 and December 2013, 53% of the declines in the S&P 500 had recovered within 7
calendar days, 81% of the declines had recovered within 30 calendar days, 92% of the declines had
recovered within 90 calendar days, and 97% of the declines had recovered within a calendar year. The

Layman’s Guide to Investing in the S&P 500
48
longest recovery time was more than 6 years which is detailed below along with some of the other longest
recovery times for the S&P 500 between 1962 and 2013.
6.8.1. Between 2000 and 2006
The longest recovery time for the S&P 500 was when the so-called Dot-Com Bubble started to collapse on
September 1, 2000. It took more than 6 years before the S&P 500 had recovered on October 23, 2006 as
shown in Figure 16. This recovery time assumes the S&P 500 dividends were reinvested and there were no
taxes, otherwise the recovery time would have been even longer. In the meantime inflation was more than
16% as measured by the CPI. An investment in US government bonds with one-year maturity and
reinvesting after each year would have returned a total of almost 21% before taxes. So even though the
S&P 500 had recovered the lost dollar amount after 6 years, it would take even longer to make up for the
inflation or what could have been earned on US government bonds.
Figure 16: Comparison of the total return for the S&P 500 index, US government bonds and inflation as measured by the US CPI. The decline of the S&P 500 started on September 1, 2000 and it had recovered by October 23, 2006 if
dividends were reinvested.
2001 2002 2003 2004 2005 2006 20072001 2002 2003 2004 2005 2006 2007
-40 %
-20 %
0 %
20 %
S&P 500
US Gov. Bond
Inflation CPI
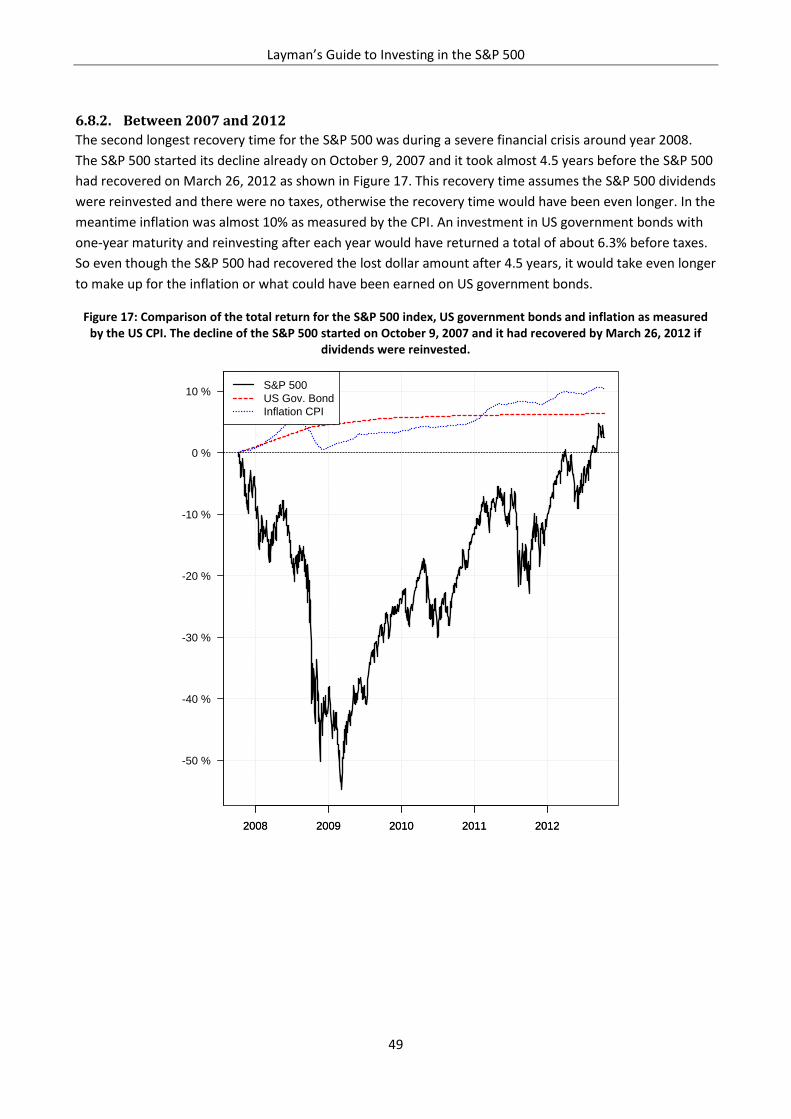
Layman’s Guide to Investing in the S&P 500
49
6.8.2. Between 2007 and 2012
The second longest recovery time for the S&P 500 was during a severe financial crisis around year 2008.
The S&P 500 started its decline already on October 9, 2007 and it took almost 4.5 years before the S&P 500
had recovered on March 26, 2012 as shown in Figure 17. This recovery time assumes the S&P 500 dividends
were reinvested and there were no taxes, otherwise the recovery time would have been even longer. In the
meantime inflation was almost 10% as measured by the CPI. An investment in US government bonds with
one-year maturity and reinvesting after each year would have returned a total of about 6.3% before taxes.
So even though the S&P 500 had recovered the lost dollar amount after 4.5 years, it would take even longer
to make up for the inflation or what could have been earned on US government bonds.
Figure 17: Comparison of the total return for the S&P 500 index, US government bonds and inflation as measured by the US CPI. The decline of the S&P 500 started on October 9, 2007 and it had recovered by March 26, 2012 if
dividends were reinvested.
2008 2009 2010 2011 20122008 2009 2010 2011 2012
-50 %
-40 %
-30 %
-20 %
-10 %
0 %
10 %S&P 500
US Gov. Bond
Inflation CPI
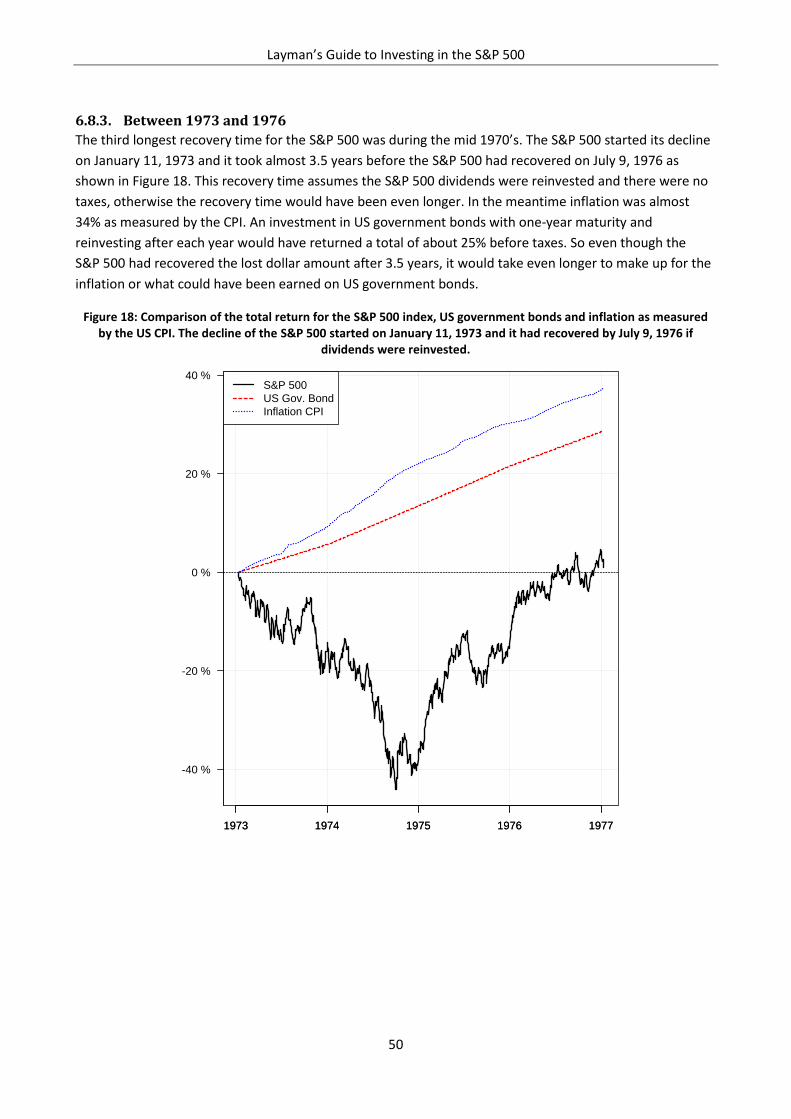
Layman’s Guide to Investing in the S&P 500
50
6.8.3. Between 1973 and 1976
The third longest recovery time for the S&P 500 was during the mid 1970’s. The S&P 500 started its decline
on January 11, 1973 and it took almost 3.5 years before the S&P 500 had recovered on July 9, 1976 as
shown in Figure 18. This recovery time assumes the S&P 500 dividends were reinvested and there were no
taxes, otherwise the recovery time would have been even longer. In the meantime inflation was almost
34% as measured by the CPI. An investment in US government bonds with one-year maturity and
reinvesting after each year would have returned a total of about 25% before taxes. So even though the
S&P 500 had recovered the lost dollar amount after 3.5 years, it would take even longer to make up for the
inflation or what could have been earned on US government bonds.
Figure 18: Comparison of the total return for the S&P 500 index, US government bonds and inflation as measured by the US CPI. The decline of the S&P 500 started on January 11, 1973 and it had recovered by July 9, 1976 if
dividends were reinvested.
1973 1974 1975 1976 19771973 1974 1975 1976 1977
-40 %
-20 %
0 %
20 %
40 %S&P 500
US Gov. Bond
Inflation CPI

Layman’s Guide to Investing in the S&P 500
51
6.8.4. Between 1969 and 1971
The fourth longest recovery time for the S&P 500 was around 1970. The S&P 500 started its decline on May
14, 1969 and it took almost 2 years before the S&P 500 had recovered on March 15, 1971 as shown in
Figure 19. This recovery time assumes the S&P 500 dividends were reinvested and there were no taxes,
otherwise the recovery time would have been even longer. In the meantime inflation was almost 10% as
measured by the CPI. An investment in US government bonds with one-year maturity and reinvesting after
each year would have returned a total of about 13% before taxes. So even though the S&P 500 had
recovered the lost dollar amount after almost 2 years, it would take even longer to make up for the
inflation or what could have been earned on US government bonds.
Figure 19: Comparison of the total return for the S&P 500 index, US government bonds and inflation as measured by the US CPI. The decline of the S&P 500 started on May 14, 1969 and it had recovered by March 15, 1971 if
dividends were reinvested.
1970 19711970 1971
-30 %
-20 %
-10 %
0 %
10 %
S&P 500
US Gov. Bond
Inflation CPI

Layman’s Guide to Investing in the S&P 500
52
6.9. Summary This section studied the historical returns of investing in the S&P 500 and reinvesting the dividends. We
considered different durations and all starting dates between January 1962 and December 2013. The
results are summarized in Table 1.
Table 1: Historical returns of the S&P 500 for investment periods of different lengths and all possible starting dates between January 1962 and December 2013. This table shows the best, average and worst annualized returns, as
well as the probability that the S&P 500 performed better than inflation and US government bonds.
Investment Periods
Annualized Return 1 Year 5 Years 10 Years 20 Years
Best 71.8% 31.4% 19.8% 18.2%
Average 11.2% 9.6% 10.1% 11.4%
Worst (46.8%) (8.1%) (4.0%) 6.1%
Better than Inflation 71% 67% 75% 100%
Better than US Gov. Bonds 70% 66% 74% 98%
In the short-term the S&P 500 experienced both huge losses and gains. In one particular year the S&P 500
lost (46.8%) and in another year it gained 71.8%. But as the investment period got longer, fewer losses
were experienced and the return got closer to 10-11% per year on average.
For one-year periods the S&P 500 performed better than inflation and US government bonds in 7 out of 10
years. The S&P 500 performed better than US government bonds in about 74% of the 10-year periods but
still experienced losses sometimes. For 20-year periods the S&P 500 experienced no losses and always
performed better than inflation while outperforming US government bonds in 98% of all 20-year periods.
The important thing to remember from this section is that anything can happen to the S&P 500 in the
short-term and that you should only invest in the S&P 500 if you can hold the investment for five years or
more. Losses can still occur for investment periods of several years but they are less likely and less extreme
compared to the amount you invested.

Layman’s Guide to Investing in the S&P 500
53
7. Monthly Investing The previous section studied the historical returns of the S&P 500 index, which were highly volatile with the
greatest one-year loss being almost (50%) and the greatest one-year gain being more than 70%. So the
return depends on the specific dates you buy and sell the S&P 500. If you were lucky, you would have
bought the S&P 500 when the price was very low and sold when the price was very high. But whether the
price is high or low cannot be determined in advance. So you could just as well have been unlucky and
bought the S&P 500 when its price was very high and sold when the price was very low.
Fortunately, there is a very simple and effective solution to this problem, which is to add to your
investment in the S&P 500 on a monthly basis. This is also the natural way of investing for a working person
who is saving a part of their monthly salary for retirement. Adding to your investment on a monthly basis
has several benefits over making a single investment in the S&P 500. You will sometimes invest in the
S&P 500 when the price is a bargain and sometimes when the price is too expensive, but by adding to your
investment at regular monthly intervals, you will get an average return that is close to optimal.
7.1. Example To demonstrate this principle, try and think of each monthly investment you make as a separate
investment. Assume you started investing in January 1993 and each month during the next 10 years you
made an additional investment in the S&P 500. You made the final investment in January 2003 after which
you would start to withdraw from the investments you made 10 years prior.
7.1.1. First Period
In January 2003 you would withdraw the amount you invested in January 1993 plus any returns on that
investment. During this 10-year period the price of the S&P 500 increased from about $435 to $909. With
dividends reinvested the total gain was 150%, corresponding to about 9.6% per year.
So if you had invested $100 in the S&P 500 in January 1993 and reinvested the dividends during the
following 10 years, then in January 2003 the investment would be worth about $250, when ignoring taxes.
7.1.2. Best Period
The best 10-year investment you would have made was in December 1994 where the S&P 500 price was
about $449 and 10 years later in December 2004 the price had increased to about $1,191. If dividends were
reinvested the total gain would be about 211%, corresponding to an annual gain of about 12%.
So if you had invested $100 in the S&P 500 in December 1994 and reinvested the dividends during the
following 10 years, then in December 2004 the investment would be worth about $311.
7.1.3. Worst Period
The worst 10-year investment you would have made was in March 1999 where the S&P 500 price was
about $1,236 and 10 years later in March 2009 the S&P 500 had fallen to about $701. If dividends were
reinvested the net loss would be about (32.4%), corresponding to an annual loss of (3.8%).
So if you had invested $100 in the S&P 500 in March 1999 and reinvested the dividends during the
following 10 years, then in March 2009 the investment would only be worth about $68.

Layman’s Guide to Investing in the S&P 500
54
7.1.4. Last Period
The last investment you would have made was in January 2003 where the S&P 500 price was about $909
and 10 years later in January 2013 the S&P 500 had increased to about $1,462. If dividends were reinvested
then the total gain would be about 96%, corresponding to an annual gain of almost 7%.
So if you had invested $100 in the S&P 500 in January 2003 and reinvested the dividends during the
following 10 years, then in January 2013 the investment would be worth about $196.
7.1.5. Average Return
In total, you would have made 121 monthly investments (12 months for each of the 10 years, plus an
additional month at the end). Some of these investments were really good with an annual return of 12%
and some were quite bad with an annual loss of almost (4%). But on average you would have earned 5.6%
per year on the money you invested. This may not seem like much when the long-term average return of
the S&P 500 with dividends reinvested was 9.7% per year. But the period between 1993 and 2013 was
chosen specifically for this demonstration because it included a historical bull market during which the
S&P 500 rose dramatically within a few years, and the period also included two of the worst crashes in the
history of the S&P 500. So even though it was an extremely volatile period in the history of the S&P 500,
you still managed to earn an average return of 5.6% per year, simply by adding to your investment every
month.
7.1.6. Optimal on Average
This average annual return of 5.6% is optimal in the sense that it was very close to the average return of the
S&P 500 for any 10-year period between 1993 and 2013. The reason that we got so close to the true
average for the period is that we added to our investment every month. If you had only invested once or
twice between 1993 and 2003 and held on to the investment for 10 years, then your return would have
been very susceptible to the extreme volatility of the S&P 500 during that period. You would have relied
entirely on luck in picking the investment period. You could have been unlucky and invested close to the
height of the bull-market in March 1999 when everyone was ecstatic and you could have sold 10 years later
at the bottom of the crash in March 2009 when everyone was depressed. You would have lost a substantial
part of your money. Instead, by adding to your investment in the S&P 500 on a monthly basis, you get an
average annual return that is as good as possible – unless you have a crystal ball that can predict the future.
7.2. Daily Investing You may wonder if you could do even better by adding to your investment in the S&P 500 on a daily basis.
If you can do this without paying any fees or commissions to a stock-broker or mutual fund, then it would
indeed bring your average return closer to the optimal average. But it is not really necessary.
In the example above, the average annual return was 5.58% when adding to the investment on a monthly
basis, while the average annual return was 5.56% when adding to the investment on a daily basis. In this
case, monthly investing had a tiny advantage of 0.02% in annual return, but it is a random effect and it
could just as well have been a tiny disadvantage. The important thing is that the two averages are very
close, which means that monthly investing is sufficient for achieving the benefits of averaging the returns.

Layman’s Guide to Investing in the S&P 500
55
7.3. Size of Monthly Investment If you invested $1 each month between January 1962 and December 2013 then you would have invested
$624 in total. But recall from section 3 that goods and services become more expensive over time due to
inflation, so $1 in 1962 does not have the same purchasing power as $1 in 2013. Similarly, your salary does
not remain the same over time even if you are doing the same job.
To better simulate the amounts you might have invested over many years, we will assume that the monthly
investment amount follows the inflation as measured by the CPI from section 3.1. This effectively means
that the monthly investment amount is constant when adjusting for inflation. Although the monthly
investment amount increases, the goods and services you could buy for that amount remains the same.
For example, if we invested $1 in January 1962 then we would invest $1.002 in February 1962 because the
CPI had increased about 0.2% during that month. In January 1963 we would invest $1.013 and in January
1964 we would invest $1.030 to match the increase in the CPI. Finally in December 2013 we would invest
$7.77 because inflation had caused prices of goods and services to increase to this level compared to $1 in
January 1962. In total, we would have invested almost $2,468 during these 624 months.
7.4. Long-Term Returns Figure 20 shows the cumulative value of adding to an investment in the S&P 500 every month between
January 1962 and December 2013. The investment amount follows the inflation as described above, so $1
was invested in January 1962 and by December 2013 the monthly investment amount had grown to $7.77.
Also shown for comparison is the value of making such monthly investments in US government bonds with
one year maturity and reinvesting the proceeds in new bonds. Also shown is the total amount invested.
From January 1962 to December 2013 there were 624 months and we invested a total amount of $2,468 in
the S&P 500 and reinvested the dividends through the years. By December 2013 the cumulative value of
the investment in the S&P 500 was about $34,566 which is about 14 times as much as the total amount we
had invested. Taxes are ignored here. Compare this to the investment in US government bonds which had
only grown to about $6,856 which is about 2.8 times the total amount we had invested through the years.
Because we added to the investment every month, the annualized return depends on which period we
consider. For example, the investment in the S&P 500 that was made in January 1962 returned about 9.6%
per year until December 2013, while the investment made in September 2000 only returned 3.2% per year
until December 2013, and the investment made in September 2013 returned about 10.3% until December
2013 corresponding to an annualized return of about 48%. On average, the annualized return was 10.4%
for all the periods ending in December 2013 and starting in some month between January 1962 and
November 2013.
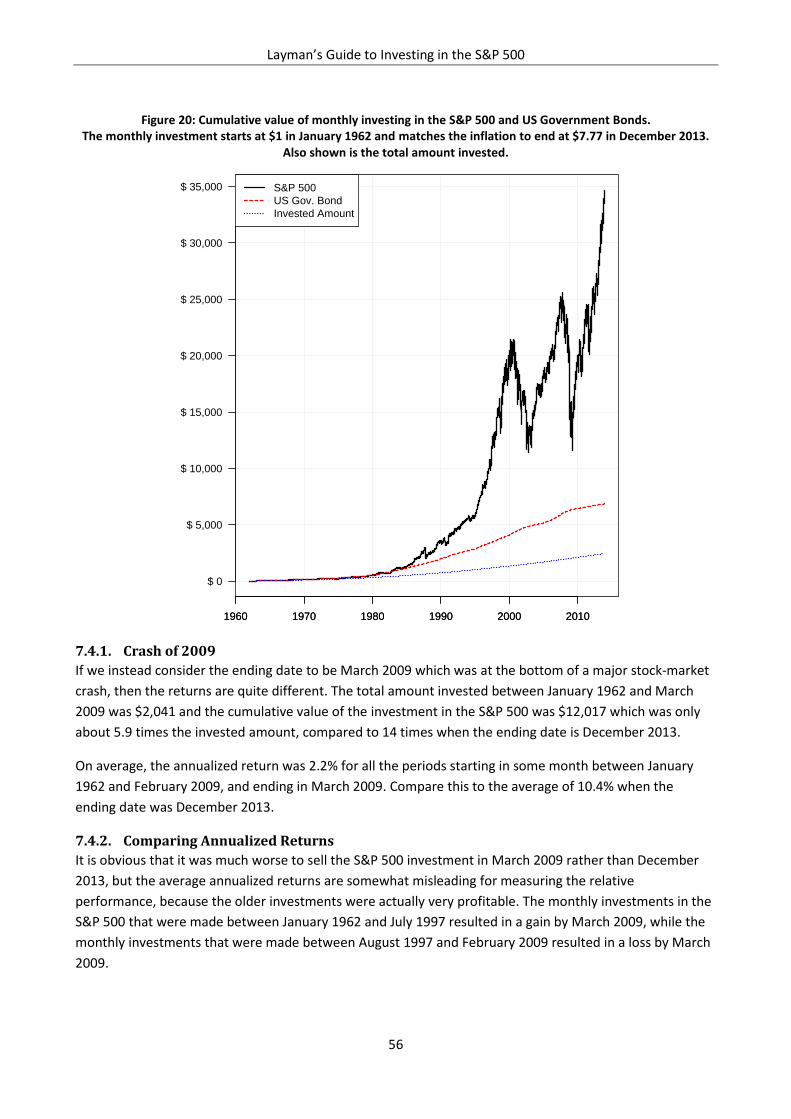
Layman’s Guide to Investing in the S&P 500
56
Figure 20: Cumulative value of monthly investing in the S&P 500 and US Government Bonds. The monthly investment starts at $1 in January 1962 and matches the inflation to end at $7.77 in December 2013.
Also shown is the total amount invested.
7.4.1. Crash of 2009
If we instead consider the ending date to be March 2009 which was at the bottom of a major stock-market
crash, then the returns are quite different. The total amount invested between January 1962 and March
2009 was $2,041 and the cumulative value of the investment in the S&P 500 was $12,017 which was only
about 5.9 times the invested amount, compared to 14 times when the ending date is December 2013.
On average, the annualized return was 2.2% for all the periods starting in some month between January
1962 and February 2009, and ending in March 2009. Compare this to the average of 10.4% when the
ending date was December 2013.
7.4.2. Comparing Annualized Returns
It is obvious that it was much worse to sell the S&P 500 investment in March 2009 rather than December
2013, but the average annualized returns are somewhat misleading for measuring the relative
performance, because the older investments were actually very profitable. The monthly investments in the
S&P 500 that were made between January 1962 and July 1997 resulted in a gain by March 2009, while the
monthly investments that were made between August 1997 and February 2009 resulted in a loss by March
2009.
1960 1970 1980 1990 2000 20101960 1970 1980 1990 2000 2010
$ 0
$ 5,000
$ 10,000
$ 15,000
$ 20,000
$ 25,000
$ 30,000
$ 35,000 S&P 500
US Gov. Bond
Invested Amount

Layman’s Guide to Investing in the S&P 500
57
For example, the annualized return between January 1962 and March 2009 was 8.2% per year which means
that $1 invested in January 1962 had grown to almost $42 by March 2009 if dividends were reinvested and
there were no taxes. The highest annualized return was 10.5% which was for the period between October
1974 and March 2009, so $1 dollar invested in October 1974 had grown to almost $31 by March 2009.
The worst annualized return was for the month between February and March 2009 where the S&P 500 lost
almost (15%), so $1 invested in February 2009 would only be worth about $0.85 a month later in March
2009. This corresponds to an annualized loss of almost (86%), so if the same rate of loss had continued for a
year then the $1 invested in February 2009 would only be worth $0.14 in February 2010. But the loss did
not continue and the S&P 500 started to recover after March 2009.
The average annualized return is somewhat misleading as a performance measure, because the single
month between February and March 2009 is given the same weight as any other period between January
1962 and March 2009. This obscures the fact that all investments made prior to July 1997 were actually
profitable by March 2009 in spite of the large crash, and more than half of those investments had an
annualized return of 8.1% or more. Because those investments had compounded for many years, their
returns were still much greater than the losses on the investments made between August 1997 and
February 2009. So by March 2009 the value of the S&P 500 investment was still 5.9 times greater than the
amount invested between January 1962 and March 2009.
7.5. Monthly Selling The purpose of adding to your investment in the S&P 500 on a monthly basis is to obtain a purchase price
that is decent on average. You will sometimes invest in the S&P 500 when it is cheap and sometimes when
it is expensive. You are unable to tell in advance whether the price is cheap or expensive, but you invest
every month at different prices so you will get a decent price on average, and you should therefore get a
decent return on average if you hold the investment for many years. But as demonstrated above, this
strategy can be severely thwarted if you sell at the bottom of a market crash. Fortunately there is a very
simple solution to this problem as well, which is to sell only a small part of your investment in the S&P 500
on a monthly basis instead of selling it all at once.
Of course, if you have invested on a monthly basis for many years and the S&P 500 is currently at a price-
level that gives you a good return overall, then you can sell the entire investment if you need the money.
But if the stock-market has crashed within the last few years then it is much better for you to only
withdraw the amount of money you need each month and wait for a recovery of the S&P 500. It is
therefore very important that you allocate your portfolio between the S&P 500 and US government bonds
so you can withstand a market crash that may last several years, without having to sell a large part of your
investment in the S&P 500 at the bottom of a crash because you need the money. This is discussed further
in section 9.
7.6. Recovery Times The most prolonged crash of the S&P 500 was described in section 6.8.1 and started on September 1, 2000.
The S&P 500 first recovered more than 6 years later on October 23, 2006, provided dividends were
reinvested and there were no taxes, otherwise it would have taken longer to recover.

Layman’s Guide to Investing in the S&P 500
58
Figure 21 shows the period from January 2000 to December 2005 when adding to your S&P 500 investment
every month. If you started investing $1 in January 2000 and increased the amount to match the inflation
you would have invested $1.10 in January 2004. The total amount invested in this period would have been
almost $52. By January 2004 you would have recovered the amount you had invested, which can be seen in
Figure 21 as the point where the invested amount crosses the cumulative value of the S&P 500 investment.
This is a recovery time of 3 years and 4 months. Note that this is almost half the time it took for the
S&P 500 to recover. The reason you recovered faster than the S&P 500 itself, is that you kept adding to
your investment every month during the collapse, thus lowering your average purchase price which was
then reached much sooner as the S&P 500 started to recover.
This shows that the recovery time may be substantially reduced if you start investing a few years prior to a
market crash and you keep adding to your investment every month during the crash. But if you had been
investing for many years prior to the crash, then your monthly additions would be so small in comparison
to the total amount that was already invested, that it would only have a minor effect on the recovery time.
Figure 21: Cumulative value of monthly investing in the S&P 500 and US Government Bonds. The monthly investment starts at $1 in January 2000 and matches the inflation each month.
Also shown is the total amount invested.
2000 2001 2002 2003 2004 20052000 2001 2002 2003 2004 2005
$ 0
$ 20
$ 40
$ 60
$ 80
S&P 500
US Gov. Bond
Invested Amount
Layman’s Guide to Investing in the S&P 500
59
7.7. Summary The S&P 500 can be extremely volatile and it is generally impossible to determine in advance whether the
current price is cheap or expensive. You could be unlucky and invest at the height of a bull market and sell
at the bottom of a crash so you would lose a substantial part of your money.
Fortunately there is a very simple solution to this problem, which is to add to your investment every month
over many years. You would sometimes buy the S&P 500 at cheap prices and sometimes at expensive
prices, but on average you would get a decent return on the investment if you hold it for many years.
Recovery Times
New investors have another significant advantage when adding to their S&P 500 investment on a monthly
basis. If you begin investing in the S&P 500 shortly before it crashes and you continue to add to your
investment every month, then you will recover much faster than the S&P 500 itself. This is because you are
investing more as the price of the S&P 500 goes lower, so your average purchase price is decreased and
your investment is therefore recovered faster when the S&P 500 eventually starts to recover.
For example, one of the most prolonged crashes in the history of the S&P 500 started in year 2000 and it
took more than 6 years before it had recovered. If you had started investing shortly before the crash began
and you continued to add to your investment every month during the following years, then you would have
recovered your investment after only 3 years and 4 months, simply by investing more each month and
hence lowering your average purchase price.
However, for people who have been investing in the S&P 500 for many years prior to a crash, making
monthly additions to the investment during a crash will only have a minor effect on the recovery time. This
is because the bulk of the investment was accumulated prior to the crash so the monthly additions are
negligible in comparison.
Monthly Selling
When selling your investment in the S&P 500 you already know what you paid when you made the
investment and hence what your return is so far. If the return is satisfactory and you need the money then
you can sell the entire investment. But you cannot know if the price of the S&P 500 will increase or
decrease after you sell it.
During the part of your life where you are working and saving up from your salary, you would add to your
investment in the S&P 500 every month. When you retire you could simply reverse the process and sell a
part of the investment every month. This way you would get a good return on average.
To avoid having to sell a large portion of your investment in the S&P 500 during a crash, it is also
recommended that you keep a part of your investment in US government bonds, which is discussed in
section 9.
Layman’s Guide to Investing in the S&P 500
60
8. Forecasting the S&P 500 The historical returns of the S&P 500 were studied in section 6. To forecast the future of the S&P 500 we
could just assume that the historical returns will continue. For 10-year investment periods the annualized
return of the S&P 500 had historically been about 10.1% on average, and the worst 10-year period had lost
(4.0%) per year and the best 10-year period had gained 19.8% per year. So if we were to invest in the
S&P 500 today and hold the investment for 10 years and reinvest the dividends during those years, we
might assume that the annualized returns would be somewhere between (4.0%) and 19.8% per year, but
probably much closer to the historical average of 10.1%.
There is another way of estimating the future return on the S&P 500, which is useful for assessing whether
the price of the S&P 500 is currently cheap or expensive.
8.1. P/Book The formula for estimating the future return of the S&P 500 uses the so-called P/Book or Price-to-Book
ratio of the S&P 500. This is the price of the S&P 500 divided by its so-called book-value, which is an
accounting measure of how much capital has been supplied by the shareholders and how much of the
companies’ earnings have been retained so as to fund their growth through time.
So the P/Book measures the current price of shares relative to how much capital shareholders have actually
supplied to the companies until now. You might think that these two numbers ought to be equal, but the
companies in the S&P 500 typically earn good returns on the shareholder capital, so new shareholders are
often willing to pay a higher price than the historical book-value of the shares.
8.2. Formula The annualized return of the S&P 500 over a 10-year period can be estimated from the P/Book value at the
time of the purchase. It is assumed that dividends are reinvested during the following 10 years and that
there are no taxes in doing this. This forecasting method was originally proposed in my other book [13].
The formula for forecasting the 10-year annualized return of the S&P 500 is:
Annualized Return = 23.4% – 4.9% x P/Book
Eq. 8-1
For example, if the P/Book of the S&P 500 is 1.5 then the annualized return of the S&P 500 for a 10 year
period is estimated to be about 16.05%, which is calculated as follows:
Annualized Return = 23.4% – 4.9% x P/Book = 23.4% – 4.9% x 1.5 ≈ 16.05%
If the P/Book is instead 2.5 then the annualized return is estimated to be about 11.15%. If the P/Book is 3.5
then the annualized return is estimated to be about 6.25%. If the P/Book is 5 then the annualized return is
estimated to be a loss of about (1.1%) per year.
Layman’s Guide to Investing in the S&P 500
61
8.3. Estimation Error The estimated future return of the S&P 500 is not perfect and the errors can be quite large. The formula
has been tested for all 10-year periods between January 1978 and December 2013 where the largest errors
were almost (6%) and +7% (percentage points).
For example, on January 8, 1982 the P/Book was 1.09 so the estimated 10-year return would be 18.1% as
calculated from Eq. 8-1:
Annualized Return = 23.4% – 4.9% x P/Book = 23.4% – 4.9% x 1.09 ≈ 18.1%
The actual 10-year return between January 8, 1982 and 1992 was 17.6% per year, so the estimated return
of 18.1% was quite good and only had a small error of (0.5%).
Another example is on January 12, 1990 where the P/Book was 2.31 so the estimated 10-year return was
12.1% as calculated from Eq. 8-1:
Annualized Return = 23.4% – 4.9% x P/Book = 23.4% – 4.9% x 2.31 ≈ 12.1%
However, the actual 10-year return between January 12, 1990 and 2000 was 18.3% per year, so the
estimated return of 12.1% had a large error of 6.2% (percentage points).
It is therefore important to take the estimation error into account when forecasting future returns. For
example, if the P/Book is 2.5 then the annualized return of the S&P 500 over the following 10 years is
estimated to be about 11.15% using the formula in Eq. 8-1. But the return could be as low as 5% or as high
as 18% per year because of estimation error. And there is no guarantee that future returns are even within
these margins of error as they are only known to hold for the period between 1978 and 2013.
For shorter investment periods of only a few years, the estimation errors are so large that the estimated
returns are practically useless.
8.4. Today’s P/Book Today’s P/Book ratio for the S&P 500 can be found on the following internet web-site:
www.spdrs.com/product/fund.seam?ticker=spy
At the time of this writing in early April 2015 the P/Book ratio is reported on that web-site to be 2.78. Using
Eq. 8-1 we then estimate the annualized return to be 9.8%. So if we invest in the S&P 500 at today’s price
and hold the investment for 10 years until April 2025, and we reinvest all dividends without having to pay
taxes, then the return is estimated to be about 9.8% per year on average. Because of estimation error, the
actual return could be much lower, perhaps only 4% per year, or much higher at maybe 17% per year.
You may note that the estimated return and error range is not much better than the historical average
return of 10.1% and a historical range of (4.0%) to 19.8% as described in section 6.6. But today’s P/Book
ratio of 2.78 is fairly close to the historical average of 2.42. If the P/Book had instead been much lower or
much higher, then Eq. 8-1 would estimate the future return to be either much higher or much lower, which
would be more revealing as to whether the S&P 500 is currently cheap or expensive. Examples of more
extreme P/Book ratios were given above and will also be discussed below.

Layman’s Guide to Investing in the S&P 500
62
8.5. Portfolio Allocation The forecasted return of the S&P 500 can be compared to the yield on US government bonds so as to
assess whether to invest in the S&P 500 or US government bonds.
Figure 22 shows the forecasted 10-year return of the S&P 500 for each day between January 1978 and
December 2013. The period is shorter than usual because the book-value is required when estimating the
future return of the S&P 500 using Eq. 8-1, and the book-value data for the S&P 500 is only available from
January 1978. Also shown in Figure 22 is the yield on US government bonds with 10-year maturity.
Figure 22: Forecasted 10-year return of the S&P 500 and the yield on US government bonds with 10-year maturity.
8.5.1. Examples
The period between March 10, 1997 and June 7, 2001 is marked in Figure 22 because the US government
bonds had higher yields than the forecasted return on the S&P 500.
For example, on March 10, 1997 the P/Book of the S&P 500 was 3.45 so the forecasted 10-year return was
6.5% per year, as calculated using Eq. 8-1. The actual return of the S&P 500 between March 10, 1997 and
2007 was 5.6% per year which was fairly close to the forecasted 6.5%. Compare this to US government
bonds with 10-year maturity which yielded 6.6% per year during these 10 years. So on March 10, 1997, it
was slightly better to invest in US government bonds with 10-year maturity instead of the S&P 500.
1980 1990 2000 20101980 1990 2000 2010
0 %
5 %
10 %
15 %
S&P 500 Forecasted 10-Year Return
US Gov. Bond Yield 10-Year Maturity

Layman’s Guide to Investing in the S&P 500
63
Consider another example. The highest P/Book for the S&P 500 was 5.17 and it was reached on March 23,
2000. The forecasted 10-year return for the S&P 500 was a loss of (1.9%) per year as calculated using Eq.
8-1. The actual return on the S&P 500 between March 23, 2000 and 2010 was a loss of (2.6%) per year. So
the forecasted loss was quite close to the actual loss. Compare this to US government bonds with 10-year
maturity which returned 6.1% per year during these 10 years. So on March 23, 2000, it would have been
much better to invest in US government bonds with 10-year maturity instead of the S&P 500.
8.5.2. Caveats
From these examples it may seem like a good idea to shift your entire portfolio into US government bonds
with 10-year maturity when the forecasted 10-year return of the S&P 500 is lower than the bond yield. But
there are a few caveats.
Firstly, the forecasted returns of the S&P 500 that are calculated using Eq. 8-1 are imprecise on the
historical data and may be even more imprecise in the future. Secondly, the forecasted returns are for 10-
year periods and do not predict what happens to the S&P 500 in between. Thirdly, you must buy
US government bonds with 10-year maturity to ensure you get the high yield for all 10 years. If you invest
and reinvest in bonds with only 1-year maturity then you may get a much lower yield if it decreases in the
future. But bonds with 10-year maturity are exposed to so-called interest rate risk where you can lose
substantial amounts of money if you sell the bonds prematurely and the interest rate has increased since
you bought the bonds; see the explanation in section 4.2.
8.5.3. Suggestions
For these reasons, it is suggested that you merely use the forecasted return of the S&P 500 as a rough
guide in deciding how much of your portfolio to invest in the S&P 500 and how much to invest in
US government bonds.
If the difference between the bond yield and forecasted return of the S&P 500 is small then perhaps you
should continue investing most of your portfolio in the S&P 500 because of the uncertainty of the
forecasted return. But if the bond yield is significantly larger than the forecasted return of the S&P 500, say,
5% (percentage points) or more, then you may consider shifting a significant part of your portfolio into
US government bonds with 10-year maturity, but only if you intend to own the bonds for the entire 10
years. Or you could merely make your new monthly investments in US government bonds with 10-year
maturity until the P/Book of the S&P 500 has decreased sufficiently so you can start making monthly
investments in the S&P 500 again.
8.6. Summary This section gave a simple formula for estimating the future return of the S&P 500. It may seem
contradictory that we are now trying to forecast the S&P 500 after having stated repeatedly in previous
sections that such forecasting is impossible. But it is important to understand that the forecast is limited to
10-year periods and can be quite imprecise at that. The forecast is mainly helpful in making a rough
assessment whether the S&P 500 is too expensive and if it might be better to invest in US government
bonds with 10-year maturity. The forecast does not predict exactly what happens to the S&P 500 during
those 10 years and how volatile it will be.
Layman’s Guide to Investing in the S&P 500
64
9. Portfolio Allocation and Rebalancing The S&P 500 had an average return of 9.7% per year between 1962 and 2013, but the S&P 500 can be very
volatile in the short-term with annual losses frequently exceeding (10%) and occasionally reaching almost
(50%). The worst loss in a single day was more than (20%) which occurred on October 19, 1987.
If you intend to invest for 10 years or more then you will typically get better end-results by being fully
invested in the S&P 500. But the short-term volatility can be dangerous if you need the money during a
stock-market crash, because you would be forced to sell at the worst possible time. The volatility can also
be emotionally stressful and cause you to act irrationally.
9.1. Portfolio Allocation To dampen the volatility of the S&P 500 you can divide your portfolio between the S&P 500 and
US government bonds. This way you get a portfolio that is likely to perform better than US government
bonds in the long-term, but with lower short-term volatility than a full investment in the S&P 500.
How much of your portfolio to invest in the S&P 500 and how much to invest in US government bonds
depends on three factors. First, for how many years are you going to invest? Second, how much money do
you think you may need in case of an emergency during the next few years? Third, how much volatility in
the value of your investment can you handle emotionally?
9.1.1. Example
The longer your time horizon is the more you can invest in the S&P 500. If your savings are currently
$100,000 and you want to invest for at least 10 years, but at the same time you want to be certain that you
always have $20,000 in case of an emergency, then you should invest the $20,000 in US government bonds
and the remaining $80,000 in the S&P 500. This is likely to give you the best long-term return – unless the
S&P 500 is currently overvalued as discussed in section 8.
9.1.2. No Perfect Allocation
It is impossible to determine the perfect allocation between the S&P 500 and US government bonds. The
S&P 500 could do well for 10 or 20 years with only minor crashes so you would forgo big profits if you only
had a small part of your portfolio invested in the S&P 500 during such a period.
But sometimes the S&P 500 crashes repeatedly within a single decade. For example, the S&P 500 started to
crash in September 2000 and had lost more than (40%) two years later and first recovered in October 2006.
Just a year later in October 2007 the S&P 500 started to crash again and this time it had lost more than
(50%) at the bottom in March 2009 and first recovered in March 2012. During both periods the US
economy also suffered and many people lost their jobs and homes. If you had been fully invested in the
S&P 500 during such a crash and you lost your job at the same time, then you would be forced to sell your
investment at the worst possible time, just so you could afford to pay your bills.
A major reason for investing a part of your portfolio in US government bonds is to protect yourself from
having to sell your investment in the S&P 500 during a crash.
Layman’s Guide to Investing in the S&P 500
65
9.2. Worst Loss You Can Tolerate When determining your portfolio allocation between the S&P 500 and US government bonds, it is helpful to
consider the worst loss you can tolerate emotionally. The pain from losing money is felt much more
strongly than the joy from winning similar amounts of money. You are likely to be overconfident about the
losses you can tolerate emotionally. A useful exercise is to imagine that you actually lose the money.
Imagine you wake up tomorrow and find that the stock-market has crashed and several years of your
savings are lost. How will you react? Will you get scared and sell the rest of your investment to avoid losing
that as well? Or will you invest more in the S&P 500 to take advantage of the lower prices?
9.2.1. Example
Imagine that you have saved $100,000 and you think you may need $20,000 in case of an emergency, so
you have invested $20,000 in US government bonds and the remaining $80,000 is invested in the S&P 500.
Now imagine the S&P 500 crashes (50%) as it did between 2007 and 2009, so your $80,000 investment in
the S&P 500 is suddenly only worth $40,000. If you had saved $4,000 per year on average, then it is 10
years worth of savings you lost when the stock-market crashed. Most people would be punch-drunk from
such a large loss and many would get so scared that they would sell the rest of the investment to avoid
losing more. So maybe you should invest less of your portfolio in the S&P 500 – but how much?
9.2.2. Rule of Thumb
The worst historical loss of the S&P 500 started in October 2007 and the loss reached about (55%) for a
short time in March 2009. If we assume that the worst future loss is (50%) then the rule of thumb is to
multiply the maximum amount you can tolerate losing by 2 and invest that amount in the S&P 500.
For example, if your savings are $100,000 and you believe you can tolerate losing $20,000 in a stock-market
crash that is hopefully recovered within a few years, then you multiply the $20,000 by 2 to get $40,000
which is the amount you should invest in the S&P 500. The remaining $60,000 should be invested in
US government bonds. If the stock-market crashes (50%) then you would lose $20,000 as you could tolerate
and your portfolio would be worth $80,000 in total. If the stock-market crashes more than (50%) then you
would lose more than $20,000.
It is impossible to predict how severe future stock-market crashes will be, but the worst historical loss was
about (55%) so a maximum loss of (50%) is a reasonable assumption that also makes the math easy.
9.3. Getting Older The portfolio allocation that is appropriate for you will change throughout your life. When you are young
and start saving for your retirement many years into the future, you may be able to invest a much larger
part of your portfolio in the S&P 500 because you can tolerate larger volatility in the value of your savings.
As you get older there will be less time before you need the retirement savings and you will be less tolerant
to volatility, so you should invest less in the S&P 500 and more in US government bonds.
You may have heard the rule of thumb to invest your age in bonds. For example, if you are 20 years old you
invest 20% of your portfolio in US government bonds and 80% in the S&P 500. If you are 50 years old you
invest 50% in bonds and 50% in stocks. If you are 80 years old you invest 80% in bonds and 20% in stocks.
Although this may work for some people, it is better to think in terms of how much money you may need in
the next few years in case of an emergency, and how much money you can emotionally tolerate losing, as

Layman’s Guide to Investing in the S&P 500
66
suggested above. Young people who have a family to support and do not have much money saved, may
find it too risky to invest almost everything in the S&P 500 because they may need some of the money for
an emergency, while elderly people who have large savings but modest needs may be able to tolerate more
volatility and therefore invest more of their portfolio in the S&P 500.
9.4. Rebalancing The S&P 500 is volatile which often causes your portfolio to divert from your desired allocation. A common
solution is to rebalance your portfolio once a year to get back to the desired allocation. You would sell a
part of your investment in the S&P 500 when it has gained more than US government bonds, and
conversely you would sell some of your bonds and invest more in the S&P 500 when it has decreased.
For example, assume your portfolio is worth $100,000 and is divided evenly between the S&P 500 and
US government bonds so you have $50,000 invested in each. If the S&P 500 gains 20% and the government
bonds only return 5% then your portfolio will consist of $60,000 invested in the S&P 500 and $52,500
invested in US government bonds for a total of $112,500. To get the portfolio back to the desired 50/50
allocation you would have to sell $3,750 of your investment in the S&P 500 and buy more US government
bonds so that $56,250 would be invested in each of the S&P 500 and US government bonds.
Now consider the opposite case in which the S&P 500 loses (20%) so the $50,000 invested in the S&P 500
becomes $40,000. If the US government bond gains 5% then the value of the bonds is $52,500 so the total
portfolio value is $92,500. To get the portfolio back to the desired 50/50 allocation you would have to sell
$6,250 of the bonds and invest the money in the S&P 500 so that $46,250 would be invested in each.
9.4.1. Historical Performance
The following are historical statistics for rebalancing with different allocations between the S&P 500 and
US government bonds with one-year maturity. Investment periods are 10 years. Taxes are ignored.
The portfolio’s volatility becomes lower as you invest more of your portfolio in US government bonds. But
this also causes the average long-term returns to be lower than for a full investment in the S&P 500.
100% Stock and 0% Bond
A full investment in the S&P 500 had an average return of 10.1% per year. The worst 10-year period had a
loss of (4.0%) per year, while the best 10-year period had a gain of 19.8% per year. See section 6.6.
75% Stock and 25% Bond
Rebalancing annually with 75% in the S&P 500 and 25% in US government bonds, had an average
annualized return of 9.4% for all 10-year periods between 1962 and 2013.
The worst 10-year period had a loss of (1.5%) per year, while the best 10-year period had a return of 16.9%
per year. Half of the annualized returns were between 6.0% and 13.2%.
This rebalancing performed better than the S&P 500 in about 33% of all 10-year periods and the
rebalancing performed better than US government bonds in about 76% of all 10-year periods.
This rebalancing had losses in about 20% of all one-year periods and the worst loss was (34.6%). Losses
were rare after 5 years of rebalancing as only 5% of all 5-year periods had losses and the worst loss was
(4.6%) per year. Less than 2% of all 10-year periods had losses and the worst loss was (1.5%) per year.

Layman’s Guide to Investing in the S&P 500
67
50% Stock and 50% Bond
Rebalancing annually with 50% in the S&P 500 and 50% in US government bonds, had an average
annualized return of 8.5% for all 10-year periods between 1962 and 2013.
The worst 10-year period had a return of 0.5% per year, while the best 10-year period had a return of
14.5% per year. Half of the annualized returns were between 5.7% and 11.7%.
This rebalancing performed better than the S&P 500 in about 31% of all 10-year periods and the
rebalancing performed better than US government bonds in about 78% of all 10-year periods.
This rebalancing had losses in about 15% of all one-year periods and the worst loss was (22.5%). Losses
were very rare after 5 years of rebalancing, as only 0.3% of all 5-year periods had losses with the worst loss
being (1.7%) per year, and only 0.2% of all 9-year periods had losses with the worst loss being (0.6%) per
year. None of the 10-year periods between 1962 and 2013 had any losses when rebalancing with a 50/50
allocation between the S&P 500 and US government bonds.
25% Stock and 75% Bond
Rebalancing annually with 25% in the S&P 500 and 75% in US government bonds, had an average
annualized return of 7.5% for all 10-year periods between 1962 and 2013.
The worst 10-year period had a return of 2.0% per year, and the best 10-year period had a return of 12.4%
per year. Half of the annualized returns were between 5.6% and 9.4%.
This rebalancing performed better than the S&P 500 in about 29% of all 10-year periods and the
rebalancing performed better than US government bonds in about 79% of all 10-year periods.
This rebalancing only had losses in about 6% of all one-year periods and the worst loss was (10.4%). Less
than 0.01% of all 4-year periods had losses and the worst loss was (0.1%) per year. This rebalancing did not
have any losses for investment periods of 5 years or more.
Summary
Table 2 summarizes these performance statistics for rebalancing between the S&P 500 and US government
bonds over 10 year investment periods and with different allocations between the S&P 500 and bonds.
Table 2: Historical returns for rebalancing between the S&P 500 and US government bonds with 1-year maturity. All 10-year periods between January 1962 and December 2013 are considered. Shown are the best, average and worst
annualized returns, as well as the probability that the rebalancing performed better than the S&P 500 and US government bonds after 10 years. Full investments in the S&P 500 and US government bonds are also shown.
Rebalancing Between S&P 500 and US Gov. Bonds
Annualized Return S&P 500 75% / 25% 50% / 50% 25% / 75% Gov. Bonds
Best 19.8% 16.9% 14.5% 12.4% 10.4%
Average 10.1% 9.4% 8.5% 7.5% 6.3%
Worst (4.0%) (1.5%) 0.5% 2.1% 1.8%
Better than S&P 500 - 33% 31% 29% 26%
Better than US Gov. Bonds 74% 76% 78% 79% -
Layman’s Guide to Investing in the S&P 500
68
9.5. Monthly Investing It was suggested in section 7 that you should add to your investment in the S&P 500 on a monthly basis.
This would give you a much better chance of getting a good return on average, and it would also recover
your investment much quicker if the stock-market were to crash shortly after you started investing.
If you divide your portfolio between the S&P 500 and US government bonds then the allocation ratio will
fluctuate over time because the S&P 500 is more volatile. You can use the monthly contributions to get
closer to your desired allocation instead of rebalancing the portfolio.
For example, assume your portfolio is worth $100,000 and is divided evenly between the S&P 500 and
US government bonds so you have $50,000 invested in each. If the S&P 500 gains 20% then your portfolio
will consist of $60,000 invested in the S&P 500. If the US government bonds return 5% then that part of
your portfolio is worth $52,500. Instead of selling some of the S&P 500 and buying more bonds you could
instead make your new monthly investments entirely in bonds to bring you closer to a 50/50 allocation.
Layman’s Guide to Investing in the S&P 500
69
9.6. Summary The S&P 500 can be highly volatile. In case you have an emergency and need the money you have invested
in the S&P 500, you might be forced to sell at the bottom of a crash. To avoid this you should divide your
portfolio between the S&P 500 and US government bonds with one-year maturity. The amount to invest in
government bonds is determined by how much money you think you might need in case of an emergency.
You can also consider how much of your portfolio’s value you can tolerate losing, which is then multiplied
by 2 to get the amount you should invest in the S&P 500. This assumes the future loss of the S&P 500 is at
most (50%) which is about the level of the worst historical crash. For example, if you can tolerate losing a
maximum of $20,000 in a stock-market crash that you hope will be recovered after a few years, then you
can invest up to $40,000 in the S&P 500 – provided your portfolio still has an investment in US government
bonds that is sufficient for your emergency funds.
Your portfolio allocation should be checked once a year where you consider if the allocation is still
appropriate for your future needs. The portfolio allocation will fluctuate over time because the S&P 500
fluctuates. You can then rebalance your portfolio to get back to an allocation that is appropriate for you.
The advantages of rebalancing your portfolio between the S&P 500 and US government bonds once a year,
is that the portfolio’s volatility is lower than with a full investment in the S&P 500. The rebalanced portfolio
also recovers more quickly from losses. The disadvantage is that if you invest for several years or decades,
then you will likely get a lower return on the rebalanced portfolio than on a full investment in the S&P 500.
It is generally suggested that you add to your investment in the S&P 500 on a monthly basis to get a better
return on average. This can also be used to adjust the portfolio allocation between the S&P 500 and
US government bonds. If the S&P 500 has recently decreased so it is now below your desired allocation,
you simply invest more in the S&P 500 with next month’s contribution, rather than rebalancing by selling
some of your portfolio’s bonds. This will gradually bring you closer to your target allocation each month.
Some stock-brokers and mutual funds can rebalance your portfolio automatically according to your desired
allocation. Some accounts can even change the allocation as you get older and want less volatility, these
are called Target Retirement Funds. It is important that the expense ratio is very low, otherwise you would
save a lot of money by rebalancing the portfolio yourself; see the explanation in section 5.5.1.
Portfolio rebalancing can also be adapted using the P/Book of the S&P 500, which is a more advanced topic
that is explored in my other book [13]. That book also shows how to minimize the tax payments when
rebalancing your portfolio, which is very important if you are investing in a taxable account.

Layman’s Guide to Investing in the S&P 500
70
10. Tax You can invest in the S&P 500 through an account that is taxable, or you can invest through a retirement
account where the tax is deferred until you retire. You should generally defer taxation as long as possible.
This allows the investment to grow much more through compounded returns over many years and will
result in a much greater after-tax return on the investment.
10.1. Example of Tax-Deferred Account Consider an example of a tax-deferred account. Assume you earn $100 and invest it in the S&P 500 through
a tax-deferred account so you do not pay income tax on the $100. Further assume that the price of the
S&P 500 increases 6% per year and you also get 3% in dividend per year. You do not pay tax on the
dividends because the investment is held in a tax-deferred account, so the total return on the S&P 500 is
9% per year. The dividends are reinvested in the S&P 500 each year. Over 40 years the $100 investment
grows to almost $3,141 for a profit of $3,041. You then withdraw the money and have to pay tax on both
the investment profit of $3,041 and the invested amount of $100 because you did not pay income tax on
the $100 before you invested it. If the tax rate is 25% then the tax is about $785 and the after-tax value of
your investment is almost $2,356.5
10.2. Example of Taxable Account Now consider what happens if you invest in a taxable account. Assume you first have to pay 25% income
tax on the $100 you earn from your job, so you can only invest $75 in the S&P 500. Further assume the
annual dividend on the S&P 500 is taxed at 5% so you only get 2.85% dividend return instead of 3%. The
dividend is reinvested in the S&P 500. The price return on the S&P 500 is assumed to be 6% per year so the
total return is 8.85% per year. Over 40 years the $75 investment grows to about $2,229 for a profit of
$2,154. When you sell the investment you only have to pay tax on the profit because the amount you
originally invested was already taxed. Assume the tax on the profit is only 10% because it is taxed as a long-
term capital gain, so the tax is $215 and the remaining profit is about $1,939. Add back the $75 that you
originally invested so the total after-tax value of your investment is $2,014. This is significantly lower than
the $2,356 that the investment would have been worth in the tax-deferred account described above.
Consider another scenario for the taxable account. Now the income tax is assumed to be only 10% so you
would invest $90 of your $100 salary. The return on the S&P 500 is assumed to be the same as before with
a price return of 6% and a dividend return of 3%. The dividends are taxed each year at 5% so the after-tax
dividend return is only 2.85% and the total return is then 8.85%. The pre-tax value after 40 years is $2,675
and subtracting a long-term capital gains tax of 10% on the $2,585 profit would give a total after-tax value
of about $2,417 which is slightly higher than the value of $2,356 in the tax-deferred account.
5 It is not necessary that you understand the formula for calculating the value of an investment in a tax-
deferred account, but in case you are curious the formula is:
Value After Tax = Invested Amount x (1 + Price Return + Dividend Return)Years x (1 – Tax Rate)
= $100 x (1 + 6% + 3%)40 x (1 – 25%) = $2,356
The formula for a taxable account is a bit more complicated.

Layman’s Guide to Investing in the S&P 500
71
10.3. Advantage of Deferred Tax As shown above, whether a tax-deferred or taxable account gives the highest return after decades of
investing, depends on your income tax at the time you make the investment, as well as future tax-rates for
capital gains and dividends. The tax laws will probably continue to change every few years so this is
impossible to predict.
But there is a general and significant advantage of deferring the tax which can be demonstrated with a
short example. Assume your salary is $100 and you invest it all in a tax-deferred account. The total return
on the S&P 500 is 9% per year. After 40 years the investment’s value is $3,141. If the tax-rate is 25% then
the after-tax value of the investment is $2,356.
Now consider an investment in a taxable account. Your salary of $100 is initially taxed as income at 25% so
only $75 is invested in the S&P 500. The total return of the S&P 500 is again 9% per year. We assume there
is no dividend tax so we only compare the effect of deferring the income tax and capital gains tax. After 40
years the $75 has grown to $2,356 before tax and we have to pay 25% tax on the $2,281 profit. The after-
tax value of the investment is $1,786 including the $75 we originally invested.
The value of the investment was $2,356 in the tax-deferred account and it was only $1,786 in the taxable
account, so the tax-deferred account returned almost 32% more than the taxable account. The tax rates
were assumed to be the same in both cases and the only difference was that the taxable account started
with a lower investment amount of $75 because income tax of $25 had to be paid first. If the $25 were
instead invested in the S&P 500 and the returns compounded at 9% per year for 40 years, then the $25
would grow to about $785. Paying 25% tax would leave about $589. So it was much more profitable to
defer the taxation and start with a larger investment amount. If there had been a dividend tax in the
taxable account, then the advantage of deferring the taxation would have been even greater.
10.4. General Advice The general advice is that you should try and defer taxation for as long as possible and preferably also avoid
paying dividend tax. Deferring the tax will allow the investment to grow much more through compounding
the returns over many years and this will result in a much greater after-tax return on the investment.
10.5. Account Types There are different kinds of tax-deferred accounts in USA, including traditional IRAs (Individual Retirement
Arrangements), Roth IRAs and 401(k) accounts. The terms and conditions of these accounts are likely to
change in the future.
One difference to consider is whether there is a penalty if you withdraw from the account before you
retire. If you think you may need some of the money before you retire, then you may consider investing
some of your money in an account that allows you to withdraw the money without a penalty. But this type
of account may also tax your salary before it is invested, which was shown above to under-perform a
completely tax-deferred account. A solution may be to invest in both types of accounts.
Khan Academy has brief tutorials on the similarities and differences between these accounts, and the IRS
has detailed information to help you select which type of account may be right for you:
www.irs.gov/Retirement-Plans

Layman’s Guide to Investing in the S&P 500
72
11. How Much to Invest How much you need to save and invest each month depends on several factors, including how many years
there are until you retire, how much money you will need when retired, how long you will live, and the
return you will earn on your portfolio during that time. This cannot be determined in advance and you
should use the accompanying spreadsheet for Microsoft Excel to experiment with different assumptions
and assess whether you are saving enough for your retirement:
www.hvass-labs.org/books/files/pedersen2015layman-sp500.xlsx
11.1. Example Assume you are now 35 years old and would like to retire when you are 65 years old. You expect to live
until you are 85 years old. If you currently do not have any savings then you have 30 years to accumulate
savings for 20 years of retirement. Assume you currently spend $10,000 per year on your housing costs,
food, transportation, entertainment, etc. and you would like to maintain that lifestyle when you retire. How
much do you need to save and invest each month in the S&P 500? This question cannot be answered
precisely but we can give an estimate using the spreadsheet above.
Saving Phase
Say you have decided to allocate your portfolio with 75% in the S&P 500 and 25% in US government bonds
with 1-year maturity, and you rebalance the portfolio each year. According to the historical statistics in
Table 2, this rebalancing strategy had an annualized return of about 9.4% when investing over 10-year
periods. Your investment period is much longer but we should generally be conservative in our
assumptions, so let us assume that your portfolio returns 9% per year. The return is assumed to be
constant every year, which is unrealistic and the reason why you should experiment with different returns
in these calculations, as will be done below.
You add to the investment on a monthly basis which will increase your chances of getting a good return on
average, as explained in section 7. The amount you invest follows the inflation, which is assumed to be 3%
per year. So if you invest $100 per month then it means you invest $1,200 in the first year and $1,236 in the
second year because of the inflation. In the 30th year you would invest $2,828 and after the 30th year you
would have invested a total of $57,090 while the portfolio would be worth $216,808.
Spending Phase
After 30 years you retire and start spending the money you previously saved. You are currently spending
$10,000 per month and you expect to have the same life-style 30 years from now so the living costs are
expected to be similar. Because inflation is assumed to be 3% per year, the $10,000 today corresponds to
$24,273 in 30 years. So you need to withdraw that amount from your savings in the first year of your
retirement and in the second year you withdraw $25,001 because inflation has added another 3%.
Furthermore, it is assumed you have invested in a tax-deferred account so you now have to pay tax when
you withdraw money from the account. If the tax-rate is 15% then you have to withdraw a total of $28,556
so you can pay $4,283 in tax and get $24,273 to spend. Withdrawing $28,556 from your portfolio brings the
portfolio value down to $188,252.

Layman’s Guide to Investing in the S&P 500
73
Because you no longer have any work income, you have decided to allocate your portfolio more
conservatively with only 25% invested in the S&P 500 and 75% invested in US government bonds with one-
year maturity. You rebalance the portfolio annually. According to the historical statistics in Table 2, the
average return was 7.5% for this rebalancing strategy, but let us be conservative and assume the return is
only 7% per year. This means your portfolio grows from $188,252 to $201,430 after the first year.
This procedure continues for a number of years and after 9 years the portfolio value has become negative
which means your entire savings would have been spent. But you needed money for 20 years of
retirement, so you have to change something in the retirement plan.
Revised Assumptions
There are 3 ways to extend your retirement savings: Either you save more each month while you are still
working, or you invest more of your portfolio in the S&P 500 so you get a higher return over time, provided
you can tolerate the short-term volatility, or you spend less money when you are retired.
In this example it was assumed that you only saved $1,200 per year which was very low compared to your
annual living costs of $10,000. If you instead saved $3,000 per year and increased the amount each year to
match the inflation, and you invested in a portfolio that returned 9% per year, then you would have
$542,021 after 30 years and this amount would last you 32 years in retirement.
What if the investment return in the saving phase was actually 8% instead of the assumed 9% and the
annual investment return in the spending phase was only 6% instead of the assumed 7%? It is easy to test
this scenario using the spreadsheet above, and we find that the portfolio would then be worth $458,124
after 30 years of saving and this would last you 21 years in retirement.
11.2. Summary Whether you are saving enough for your retirement depends on many unknown factors. You should
experiment with different assumptions using the spreadsheet above.
It is generally much better to start investing early in life because of the powerful effect of compounding
returns when investing for many decades. Even a small monthly investment in the S&P 500 will compound
into substantial amounts over decades of investing, so you should get started now.
It is also better to invest more than you think is necessary, if you can afford it. You may need more money
in your retirement than you currently anticipate, for example in case of unexpected medical costs. Knowing
that your retirement is well funded will put your mind at easy and also improve your quality of life today.

Layman’s Guide to Investing in the S&P 500
74
12. Other Aspects of Investing This section briefly discusses other aspects of investing that may be relevant to you.
12.1. Investing an Inheritance What should you do if you receive a large sum of money such as an inheritance or a lottery prize and you
want to invest it in the S&P 500, but you are concerned about losing a significant part of the money if the
stock-market crashes shortly after? The answer is to gradually invest the money in the S&P 500 on a
monthly basis. In the meantime you invest the money in US government bonds so they earn some interest.
The question is how many months you should do this before you are fully invested in the S&P 500?
As described in section 6.8, about 97% of all stock-market declines were recovered within a year, but
occasionally the S&P 500 would take several years to recover and the longest recovery time was more than
6 years. Furthermore, the S&P 500 can decline again after having recovered the first time so it is actually
possible to experience losses in the S&P 500 after 10 years.
The recovery time is shortened significantly when you are adding to your investment in the S&P 500 on a
monthly basis during a crash, as explained in section 7.6. For example, the crash that lasted more than 6
years only took 3 years and 4 months to recover when adding to the investment on a monthly basis.
It should be sufficient to gradually invest your inheritance in the S&P 500 on a monthly basis over the
course of 5 years. You may still experience significant losses during and after those 5 years because the
S&P 500 is so volatile. If you want extra safety then you can increase the period to 10 years. As you extend
the period it becomes increasingly unlikely that you will experience a loss on the original amount you
invested, but there is never a guarantee against losses and most of the time you will forgo a higher long-
term return on the S&P 500 for the safety of US government bonds.
12.2. Saving for Your Child’s Education If you want to save for your child’s education you have the same choices as when you save for yourself. You
can put the cash away for safe keeping under your pillow but inflation will severely erode the purchasing
power over time, as explained in section 3. Or you can put the money in a bank-account which should only
be considered if the interest is comparable to that on US government bonds, otherwise it is better to invest
the money in US government bonds. Or you can invest the money in the S&P 500.
If you start saving when your child is born and the money will first be needed 20 years later when the child
has become an adult, then the S&P 500 will most likely give you a significantly better return than
US government bonds, see section 6.7.2. Furthermore, if you add to the S&P 500 investment on a monthly
basis, then you are even more likely to get a good return over time, as explained in section 7.
Because the S&P 500 is very volatile, you should start shifting the child’s savings from the S&P 500 to
US government bonds when approaching the time that the money will be needed. A suggestion is to
gradually shift to US government bonds during the 5 years prior to the money will be needed – unless the
S&P 500 has recently crashed (30%) or more, in which case it may be better to wait a few years for a
recovery.

Layman’s Guide to Investing in the S&P 500
75
If you leave the child’s entire savings invested in the S&P 500 then you may be unlucky that a crash occurs
around the time that the money is needed and you would be forced to withdraw the money at the worst
possible time. If this should happen then you may want to withdraw only the amount of money needed
each month. This should minimize the losses until the S&P 500 has recovered. But you should try to avoid
this situation by starting to shift the investment from the S&P 500 to US government bonds a few years
before the money will be needed.
Vanguard
You can open an account for your child with the Vanguard Group that was mentioned previously. The
account can be setup to make regular monthly contributions from your own bank account to your child’s
savings account. There may be tax implications if you later want to switch the account to another financial
company, so you should investigate whether Vanguard’s account is appropriate for you and your child
before opening it. Vanguard’s internet web-site has up-to-date information:
www.vanguard.com
This is the second time I suggest you invest in the S&P 500 funds provided by the Vanguard Group. I should
mention that I am not employed by Vanguard nor do they pay me for this “advertisement” – unfortunately.
The reason is that Vanguard offers some of the lowest expense ratios for S&P 500 funds which is very
important for long-term investing, as explained in section 5.5.1. Furthermore, Vanguard has services that
will suit the needs of many different people and their staff will help you if you have any further questions.
12.3. Investing in Individual Companies You were previously warned against making investments in individual companies because you would most
likely lose money. Here are some considerations if you still want to invest a part of your portfolio in
individual companies.
Overall you should compare the risk and return characteristics of the individual company’s stock to that of
the S&P 500, so as to assess whether you are likely to get a better return when investing in that particular
company instead of the S&P 500. Section 6 described the historical returns of the S&P 500 which you may
assume will continue in the future although with great volatility in any given year. Section 8 gave a simple
formula for forecasting the 10-year return of the S&P 500 given its P/Book ratio, which is useful for
assessing roughly whether the S&P 500 is currently cheap or expensive. The forecasted return of the
S&P 500 should be compared to the return you believe you may earn on the individual company’s stock.
But the long-term return on the S&P 500 can be forecast because it is diversified in 500 different and large
companies, which gives more regularity and predictability over long periods of time. It is usually a lot more
complicated and much more imprecise to forecast the future return on any individual stock. Even life-long
experts such as Warren Buffett still get it wrong sometimes and end up losing a lot of money on bad
investments in individual stocks.
You should only invest in companies you feel confident will be prosperous long into the future. A relative of
mine knows very little about investing. Many years ago he invested in the Danish brewer Carlsberg because
he reasoned that people would always drink beer. He also liked to attend Carlsberg’s annual meetings
because they served a classic Danish soup with yellow peas. His first investment criterion was sensible as it
was based on his belief in the long-term viability of the company’s products. The second criterion was less
Layman’s Guide to Investing in the S&P 500
76
sensible, because many portions of yellow peas could have been purchased for the money that would be
lost if the stocks had been purchased at a too high price, which he had no way of determining in advance.
You are actually gambling if you cannot predict the long-term future of a company and assess whether the
stock is currently cheap or expensive. This means you should limit the investment to a small part of your
portfolio, probably no more than 2% of your portfolio. Furthermore, you should invest less than 10% of
your entire portfolio in individual companies, and you should be determined to own the stocks for at least
10 years or more. You may think 2% is a very small part of your portfolio to invest in a single company’s
stock. But it would be unwise to gamble your retirement savings on a single company when the S&P 500
offers perfectly good returns that are much more predictable in the long-term.
12.4. Investing in the Company You Work For The above discussion about investing in individual companies can be extended with the question whether
you should invest in the company you work for. You might think that because you are an insider you also
have unique insight about the company’s future. I would argue the opposite; that precisely because you are
an insider, you have a strongly biased view of the company’s future which blinds you to many perils.
Furthermore, if the company should experience declining sales and profits, something which is almost
impossible to predict even for insiders, the company’s stock will likely suffer, and at the same time you
could very well lose your job. Because you are now unemployed and need the money you had previously
invested, you are forced to sell the stock at a big loss. So it is a very bad idea to invest a large part of your
portfolio in the company you work for. A suggestion is again to limit the investment to 2% of your portfolio.
There are of course exceptions to this rule. You can afford to take risk if you are young and have no family
to support. It would still be foolish of you to invest a large part of your savings in an established company
when the S&P 500 offers you perfectly good long-term returns that are more predictable. But if you work
for a start-up company with great potential, then you may find it worth the risk to get a part of your salary
paid out in stock or stock options. But it is still a gamble as most start-ups fail and go bankrupt so the stock
becomes worthless. It is extremely rare that start-ups become empires such as Microsoft, Google or
Facebook where the early employees become rich from their stock options.
12.5. Growth & Value Funds There is a bewildering multitude of investment funds available today. Two prevalent types of funds that
you have probably heard about are so-called growth and value funds.
The S&P 500 covers about 80% of the entire US stock-market in terms of size. If you want significantly
different returns than the S&P 500 offers, then you must either invest in some of the small companies that
are not included in the S&P 500, or you must invest in some but not all of the companies in the S&P 500, or
you must weigh the companies differently in your portfolio.
Growth and value funds try to select stocks according to certain criteria. The funds’ managers have
compelling arguments about the advantages of both growth and value stocks. But the reality is that
sometimes the growth stocks perform better and sometimes the value stocks perform better. So the
problem is as usual to predict which category will perform best during the next few years. This is generally

Layman’s Guide to Investing in the S&P 500
77
impossible, so maybe you should invest in both growth and value stocks. But then you could just as well
have invested in the S&P 500 which already contains both categories of stocks.
Furthermore, you often pay a higher expense ratio for the growth and value funds compared to the
S&P 500 index fund. So even if the growth and value funds had a combined return similar to that of the
S&P 500, they will likely under-perform the S&P 500 if you invest in the funds for many years or decades.
The same is likely true for investment funds that employ other strategies. If you want to invest for many
years or decades then you are likely better off investing in an S&P 500 fund with a very low expense ratio.
12.6. Leverage Financial leverage is the use of borrowed money to increase the size of your investment. Leverage is also
called gearing. The price changes of the S&P 500 are magnified by your degree of leverage. For example, if
you have $100 and you borrow an additional $100 so you invest $200 in the S&P 500 then you have double
leverage. If the S&P 500 gains 20% and you have double leverage then your investment gains 40% instead.
Conversely, if the S&P 500 loses (20%) then your leveraged investment loses (40%). You also have to pay
borrowing costs which are ignored here for simplicity.
If you do not use leverage then your investment in the S&P 500 can only become worthless if the S&P 500
itself goes to zero, which means that all the stocks of the 500 largest companies in USA would have to
become worthless, something which is extremely unlikely to happen. But if you use leverage then you can
go bankrupt even if the S&P 500 does not go to zero. For example, if you have double leverage and the
S&P 500 loses (50%) then because of the leverage your investment loses (100%), that is, you lose
everything. If the S&P 500 loses more than (50%) then you owe money to the stock-broker who lent you
the money for making the leveraged investment. Although such large losses are rare, they do actually
happen. In October 2007 the S&P 500 was trading at $1,550 and less than two years later in March 2009
the S&P 500 had decreased to about $680 for a loss of (56%).
Once the value of your leveraged investment approaches zero, your stock-broker will demand you put up
more money, or the broker will sell the investment on your behalf so they do not take the risk of you being
unable to pay your debt to them. The broker will not let you wait for a recovery in your leveraged
investment.
If you use leverage then you cease to be a long-term investor and you instead become a short-term
speculator. You should not gamble with your retirement savings. A normal investment in the S&P 500
should give you a perfectly good return if you own it for many years, and especially if you can add to the
investment on a monthly basis, as explained in section 7.
12.7. Stop-Loss Orders Even if you could analyze and understand all previous stock-market crashes, you would likely not be able to
predict the next crash. Stock-market crashes are like a virus that keeps mutating and each crash has
different causes.
For example, the stock-market crash between 2000 and 2006 was due to a severe overvaluation of
internet-related companies. The euphoria had been growing for several years and eventually spread and
caused overvaluation of many other companies. The bubble burst and took more than 6 years to recover.

Layman’s Guide to Investing in the S&P 500
78
The crash in 2008 and 2009 was very different as it was not due to overvaluation of stocks. This time it was
a financial crisis that was caused by massive lending to homeowners who could only repay their loans if
their houses would continue to increase in price. This would be sufficient to cause a crisis by itself, but it
was super-charged by so-called financial derivatives which are highly complicated contracts between
financial institutions. The derivatives contracts were intended as insurance against problems in other
financial institutions, but instead caused the problems to spread very rapidly and infect all other financial
institutions thus threatening the entire economy. Very few people had predicted this would happen, or at
least not predicted the exact time it would happen.
If you want to protect your investment in the S&P 500 against big losses, then you must sell the investment
once the S&P 500 has reached the biggest loss you can tolerate. If you have invested in the S&P 500
through an Exchange Traded Fund (ETF) then your stock-broker can sell the shares automatically once your
tolerated loss is reached. This is known as a stop-loss order. If you have invested in a mutual fund then you
must sell the shares manually.
You can decide that the biggest loss you can tolerate is e.g. (15%) below your purchase price. This is called
the stop-price. If the S&P 500 drops below the stop-price then the investment is sold. This protects you
from bigger losses if the S&P 500 drops further. The problem comes when you have to reinvest the money
as the S&P 500 recovers. Because the S&P 500 is very volatile it can move across your stop-price many
times during a day. Not only do you have to sell or repurchase the S&P 500 shares each time the stop-price
is crossed, but you may not be able to do it exactly at the stop-price, so you would likely incur a small loss
each time. Over time these small losses will accumulate into a substantial loss. It is quite difficult to use
stop-loss orders in practice. My longer book on S&P 500 strategies goes into more details on this [13].
It is instead suggested that you allocate your portfolio between the S&P 500 and US government bonds
according to your future requirements for cash and your emotional tolerance for losses. For example, if you
can tolerate a loss of (25%) on your entire portfolio in the short-term that you would expect to earn back in
the long-term, then you would allocate half of your portfolio to the S&P 500 and half to US government
bonds. Historically, the largest annual loss of the S&P 500 was about (50%) so if this happens again then
your portfolio would only lose (25%) because only half of the portfolio was invested in the S&P 500. If you
fear that even greater losses are possible in the future, then you would allocate less of your portfolio to the
S&P 500. This is explained in more detail in section 9.
12.8. Psychology of Investing When the stock-market is doing well you may think that you can tolerate a lot more risk than you really
can. If you have invested in the S&P 500 and it doubles in value over a few years then you will of course be
very happy. You may even go on to think that you are wise and skilful to have invested at the right time.
You may become so confident in your ability to predict the future that you will invest your entire savings in
the S&P 500, and if you are taking it too far, you will invest for borrowed money as discussed above.
Losing money creates an even more powerful emotion than winning money. When the S&P 500 crashes –
and it surely will again, given enough time – and you then lose half of the money you have saved over your
entire life, then you are likely to become so shocked that you cannot think rationally. You may lose all faith
in the stock-market and your country, and sell your investment at the worst possible time.
Layman’s Guide to Investing in the S&P 500
79
The solution is to properly allocate and rebalance your portfolio between the S&P 500 and US government
bonds, as explained in section 9. This way you can withdraw some of the money invested in bonds if you
need them and comfortably wait until the S&P 500 recovers from the crash. Knowing that you have a
sufficient part of your savings in bonds that are guaranteed by the US government should put your mind at
ease and allow you to think more rationally.
The part of your portfolio invested in the S&P 500 will of course suffer during the crash, but you can take
comfort in knowing that all investors are suffering, and some are suffering a lot more than you because
they have either invested their entire savings in stocks, or they have used leverage, or they have invested in
risky stocks that have crashed even more than the S&P 500. Some people have even combined these
mistakes and invested for borrowed money in very risky stocks, and those people are now bankrupt.
During a stock-market crash you must think far ahead into the future and ask yourself what you think USA
will be like 10, 20 or 30 years from now. Will people still want to improve their lives by working hard? Will
the young people still want to get jobs so they can buy homes and cars and provide a good life for their
own children? Of course they will. So the question essentially becomes whether the US population will
decrease significantly, or whether natural disasters and war will devastate the US economy.
If you believe in the long-term future of USA then you should continue to add to your investment in the
S&P 500 on a monthly basis during a crash. This is not easy to do because everyone around you is panicking
and fleeing the stock-markets. If it makes you nervous to invest during a crash, then you should merely
lower the monthly investment to a level you feel comfortable with, so you can continue adding to the
investment every month. When the stock-market recovers a few years later, the monthly investments you
made during the bottom of the crash will be the best investments you have ever made. But you cannot
predict when the bottom is reached, which is why you have to add to the investment every month.
Layman’s Guide to Investing in the S&P 500
80
13. What Now? You have now read a lot of information and statistics. Perhaps you feel a bit uncertain about how to
proceed from here. These are the steps you have to go through now:
1. Determine how much of your portfolio to invest in the S&P 500 and how much in US government
bonds. If you want to invest for many years or decades then you will likely get a better return by
investing more of your portfolio in the S&P 500, but this also increases the volatility of your
portfolio. You should always keep some of your portfolio invested in US government bonds which
lowers the volatility of your portfolio and also serves as an emergency fund. See section 9.
2. You should add to your investment in the S&P 500 on a monthly basis because you are much more
likely to get a good return on average. It also causes your investment to recover more quickly in
case the stock-market crashes shortly after you have started investing. See section 7.
3. Determine how much money you need to save and invest each month to meet your retirement
goals. See section 11.
4. Determine the type of account you want to use, preferably a tax-deferred account. See section 10.
5. Find a mutual fund or Exchange Traded Fund that has very low expense ratios. See section 5.4.
6. Ask the mutual fund or stock-broker how to setup your account to automatically add to your
investment on a monthly basis. Double-check that they have very low fees and expense ratios.
7. Check your portfolio once a year. Assess whether the allocation between the S&P 500 and
US government bonds is still appropriate for you, or if you need to rebalance your portfolio.
It is impossible to give precise answers to some of these questions, including the key questions of how
much you need to save, and how much of your portfolio to invest in the S&P 500 and how much in
US government bonds. The important thing is to get started as soon as possible with your monthly
investments so you take advantage of compounding the returns over many years. If you are uncertain
about something then you should make the conservative or cautious choice. For example, if you cannot
decide whether you should invest 50% or only 25% of your portfolio in the S&P 500 then simply start with
the lower number because it is safer. You can then gradually increase your investment in the S&P 500 over
the following years, as you get more experience with how the value of your portfolio fluctuates and how
you react to losses. Godspeed!
Donations
This book is made available for free so it can benefit as many people as possible. But the book has been costly to produce as it required years of experience and months of research and writing. This work was
funded entirely by the author. Donations are used towards these expenses and to assess whether there is interest in more books like this.
If you found the book useful then please donate. The average donation is $10 but a small donation is
always better than no donation and even $1 is appreciated.
Click on the link to donate securely using PayPal.
www.Hvass-Labs.org/books

Layman’s Guide to Investing in the S&P 500
81
14. Foreign Investors This section is for foreigners who want to invest in the S&P 500. The section can be ignored by US investors.
14.1. Exchange Traded Funds Foreigners who want to invest in the S&P 500 may be able to buy the Exchange Traded Funds (ETFs)
described in section 5.4.2 which are traded on US stock exchanges and sometimes also available for
purchase through foreign stock-brokers.
In recent years, ETFs for the S&P 500 have also become available on non-US stock exchanges. For example,
Vanguard in Canada provides an ETF trading under the ticker symbol VFV and for the UK the ticker symbol
is VUSA, while SPDR provides ETFs trading under the ticker symbol SPY5 in several European countries.
14.2. Currency Risk The ETFs listed above are exposed to changes in the currency exchange rate between the US Dollar and the
foreign currency. The annual change in currency exchange rate can be much greater than the return on the
S&P 500, so a large gain on the S&P 500 could be offset by a large loss on the currency, and vice versa.
Between 1971 and 2015 the exchange rate between US and Canadian Dollars frequently changed as much
as ±10% within a year, and sometimes as much as ±30%. Similar changes were experienced between
US Dollar and British Pound Sterling (GBP), and between US Dollar and the Euro.
14.3. Currency-Hedged ETFs Changes in the currency exchange rate can be dampened by a so-called currency hedge. Several ETFs have
become available that invest in the S&P 500 and also hedge the currency exposure for non-US investors.
For example, Vanguard in Canada provides an ETF with the ticker symbol VSP which hedges for the
exchange rate between Canadian and US Dollars. The company BlackRock provides ETFs hedged for several
different currencies: XSP is their ETF hedged for Canadian Dollars, IGUS is hedged for British Pounds, IUSE is
hedged for the Euro, and IHVV is hedged for Australian Dollars. Note that some of these ETFs may
accumulate and reinvest the dividends rather than paying the dividends to investors. New ETFs are
introduced regularly and you should invest in the ETF with the lowest expense ratio.
Currency hedging does not eliminate currency fluctuations but merely dampens them. The effectiveness of
the hedge depends on the magnitude and direction of currency fluctuations as well as changes to the price
of the S&P 500. Furthermore, there may be hedging costs depending on the difference between the
interest rate in USA and the foreign country. My longer book explains this in more detail [13].
Currency hedging is useful for investors who are concerned about short-term currency fluctuations, or who
believe the US Dollar will soon decrease in value against the foreign currency. Because future currency
fluctuations are unpredictable and the hedging is imperfect and potentially costly to long-term investors, it
may be useful to hedge only a part of the portfolio. For example, half of the investment in the S&P 500 can
be made in a currency-hedged ETF and the remaining half can be made in an un-hedged ETF. The ratio
between hedged and un-hedged investments depends on the investor’s personal beliefs and tolerance for
future currency fluctuations.

Layman’s Guide to Investing in the S&P 500
82
14.4. Global Stock Indices Foreign investors should probably only invest a small part of their portfolio in the S&P 500 because of the
currency risk and the long-term cost of hedging. There are alternative stock indices available for nearly all
regions of the world, both for developed and emerging markets. A simple strategy is to invest in global
index-funds with very broad diversification and very low expense ratios. It may be possible to get better
returns from particular combinations of global index funds, but that would be a topic for another book.
14.5. US Government Bonds The purpose of investing in a bond is to get a return with little or no risk. Small private investors from
developed countries outside USA should generally not invest in US government bonds because the yield is
small compared to currency fluctuations, so you could lose much more on the currency than you would
gain from the bond yield itself. People from outside USA should instead consider investing in bonds from
their own government because it avoids the currency risks and there may also be tax advantages.
The exception is if you live in an unstable country where the government may not be able to repay the
bonds, or if you worry that the currency of your country may decrease significantly in value. Then you may
consider making a long-term investment in US government bonds. You should ask your bank or stock-
broker how to do this and ensure they only charge a very low fee for making the investment.

Layman’s Guide to Investing in the S&P 500
83
15. Bibliography
[1] W.E. Buffett. Letter to shareholders of Berkshire Hathaway for 2013. [Online].
http://www.berkshirehathaway.com/letters/2013ltr.pdf
[2] B. Graham and H.L. Butler Jr., "An Hour with Mr. Graham," CFA Research Foundation, pp. 33-41, 1977.
[3] B. Graham, "A Conversation with Benjamin Graham," Financial Analysts Journal, vol. 32, no. 5, pp. 20-
23, 1976.
[4] E.O. Thorp, Beat the Dealer: A Winning Strategy for the Game of Twenty-One.: Vintage, 1966.
[5] E.O. Thorp and S.T. Kassouf, Beat the Market: A Scientific Stock Market System.: Random House, 1967.
[6] E.O. Thorp, "Interview with Edward O. Thorp," Journal of Investment Consulting, vol. 12, no. 1, pp. 5-
14, 2011.
[7] US Department of Labor, Bureau of Labor Statistics. All Items Consumer Price Index for All Urban
Consumers (CPI-U), U.S. City Average. [Online]. http://www.bls.gov/cpi/data.htm
[8] US Federal Reserve. Government Bond Yields. [Online].
http://www.federalreserve.gov/releases/h15/data.htm
[9] S&P 500 Fact Sheet (Retrieved March 2015). [Online]. http://us.spindices.com/indices/equity/sp-500
[10] S&P 500 price data can be found e.g. at Yahoo Finance. [Online].
https://finance.yahoo.com/q/hp?s=%5EGSPC+Historical+Prices
[11] R.J. Shiller. Data from the book Irrational Exuberance. [Online].
http://www.econ.yale.edu/~shiller/data/ie_data.xls
[12] M.E.H. Pedersen, "Introduction to Share Buyback Valuation," Hvass Laboratories, Report HL-1301,
2013. [Online]. http://www.hvass-labs.org/people/magnus/publications/pedersen2013share-buyback-
intro.pdf
[13] M.E.H. Pedersen, "Strategies for Investing in the S&P 500," Hvass Laboratories, HL-1501, 2015.
[Online]. http://www.hvass-labs.org/books/

Layman’s Guide to Investing in the S&P 500
84
16. Revision History 2015, June 3: Added Table 1 and Table 2. Added section on ‘Reinvestment Risk’ to section 4.1.2.
Minor text revisions.
2015, April 29: First edition.