layouts: creating maps and figures using arcmap 1 gis for planetary mappers june 2012, planetary...
TRANSCRIPT
Layouts:Creating maps and figures
using ArcMap
1
GIS for Planetary Mappers
June 2012, Planetary Mappers Meeting
2
GIS for Planetary Mappers
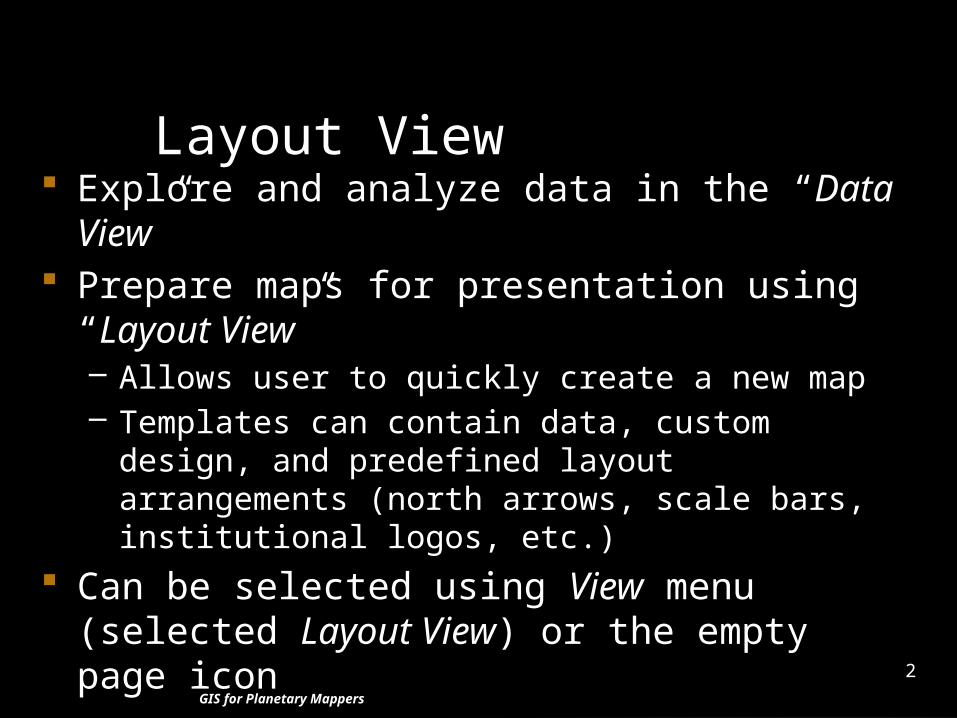
Layout View Explore and analyze data in the “Data View” Prepare maps for presentation using “Layout
View”– Allows user to quickly create a new map– Templates can contain data, custom design, and
predefined layout arrangements (north arrows, scale bars, institutional logos, etc.)
Can be selected using View menu (selected Layout View) or the empty page icon

3
GIS for Planetary Mappers
Layout View
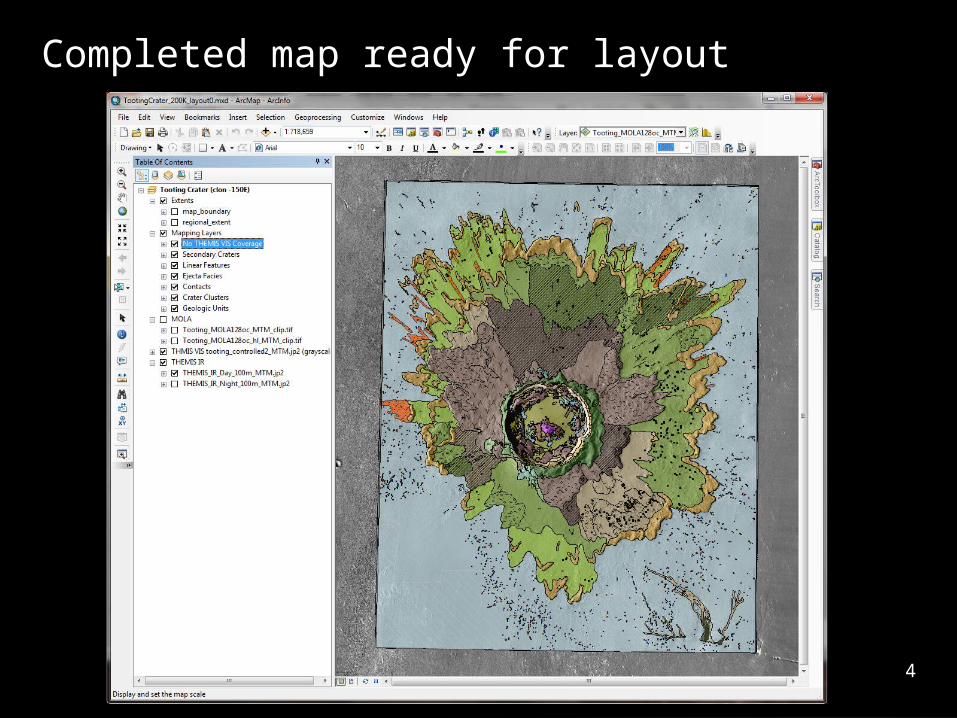
Completed map ready for layout
4

Virtual clip to map boundary
5
1) Open data frame properties
2) Data Frame Tab Clip OptionsAlso check “Clip Grids …”
3) “Specify Shape…”Outline of Features-select your boundaryfile. Note you can alsouse a selected graphic
optional but recommended

Switch from Data to Layout view
6
or
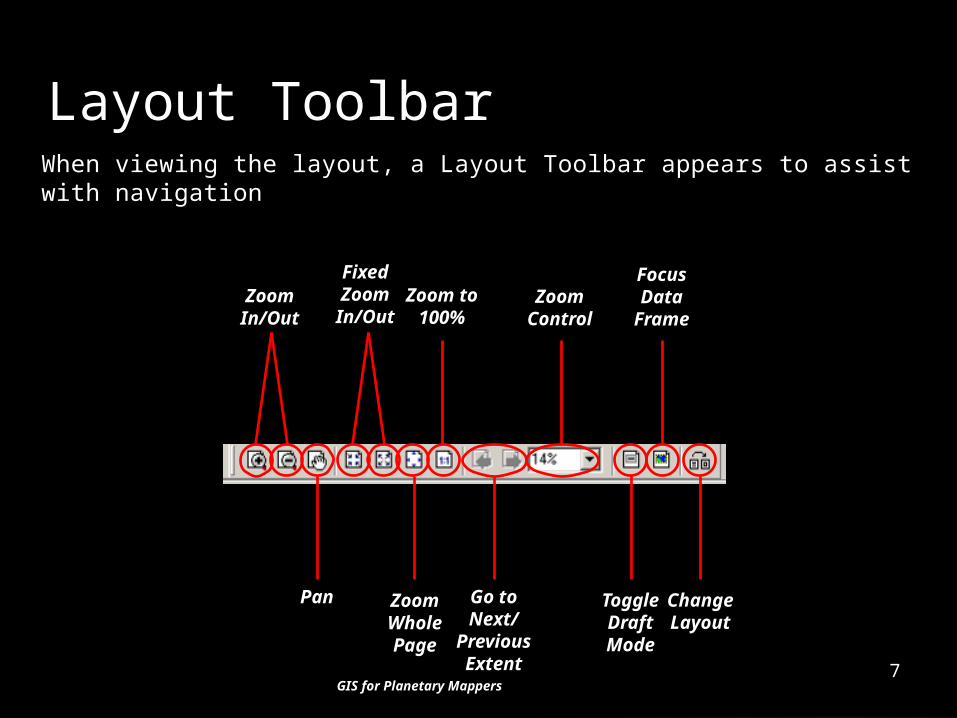
When viewing the layout, a Layout Toolbar appears to assist with navigation
GIS for Planetary Mappers
Layout Toolbar
ZoomIn/Out
FixedZoomIn/Out
Zoom to100%
ZoomControl
FocusData
Frame
Pan ZoomWholePage
Go toNext/
PreviousExtent
ToggleDraftMode
ChangeLayout
7
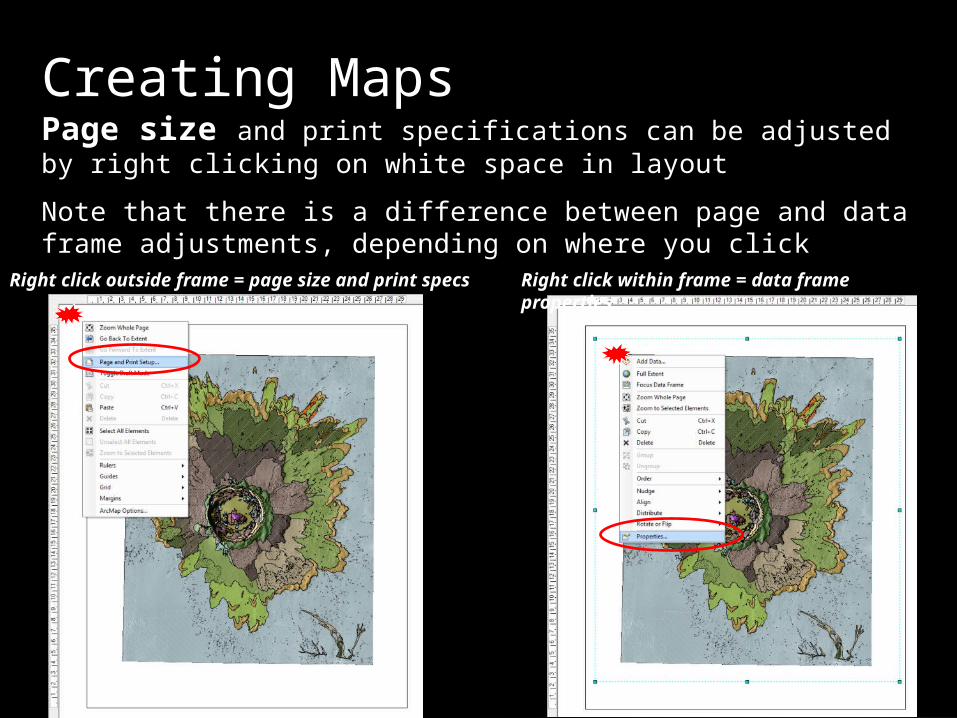
Page size and print specifications can be adjusted by right clicking on white space in layout
Note that there is a difference between page and data frame adjustments, depending on where you click
Creating Maps
Right click outside frame = page size and print specs Right click within frame = data frame properties

Creating Maps Data Frame PropertiesGeneral tab, set Reference Scale (e.g. 1:1M) to lock symbols and font sizes
To quickly change font or symbol sizes for a larger or smaller scaled figure, change this value to grow or shrink.

Creating MapsChanging Appearance of Frame
In this example, we will take the general appearance of the frame to add depth and character to the map
Select the “Frame” tab in Data Frame Properties dialog box
Under “Border”, select preferred from drop down
Under “Background”, select preferred from drop down
Under “Drop Shadow”, select preferred from drop down
Click “Apply” or “OK”– NOTE: “OK” applies the
change and closes the dialog box … the only difference
In this example, Border = Triple Line, Background = Yellow, and Drop Shadow = Gray; NOTE: These elements can be varied using parameters given above.
10
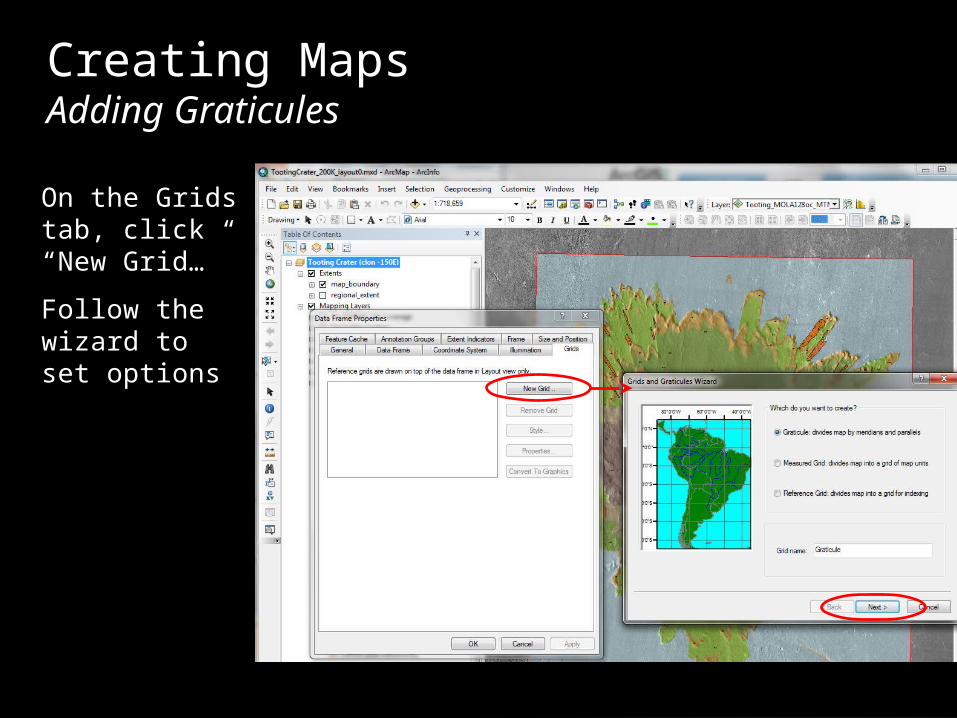
On the Grids tab, click “New Grid…”
Follow the wizard to set options
Creating MapsAdding Graticules

Change Graticule
settings. E.g.• change label fonts
• label intervals
• color
• rotated labels
• …
Creating MapsTweaking Graticules
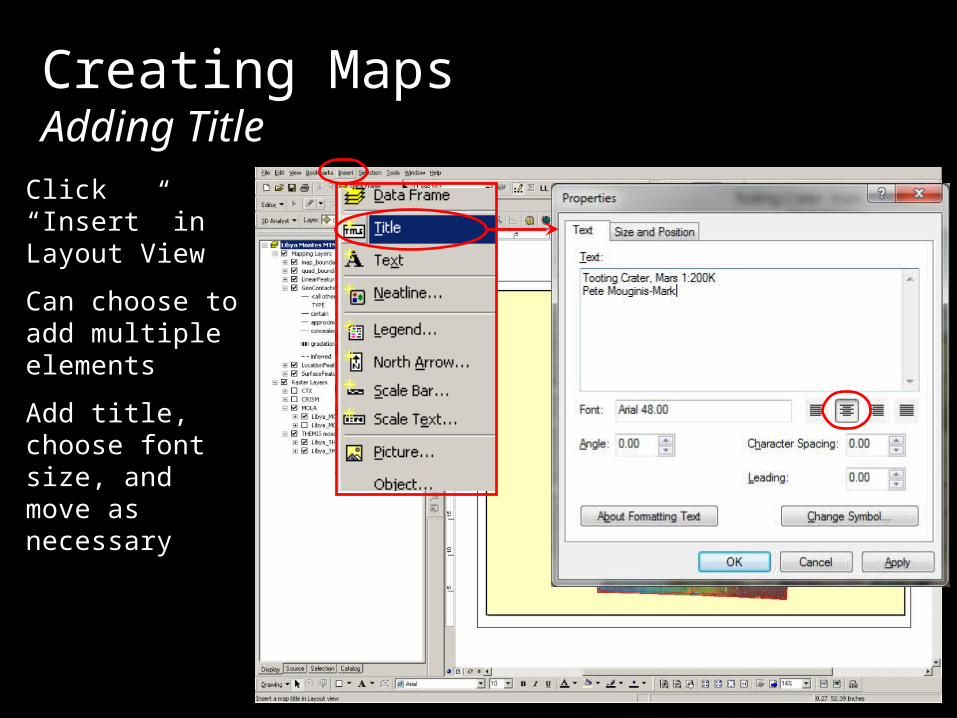
Click “Insert” in Layout View
Can choose to add multiple elements
Add title, choose font size, and move as necessary
Creating MapsAdding Title
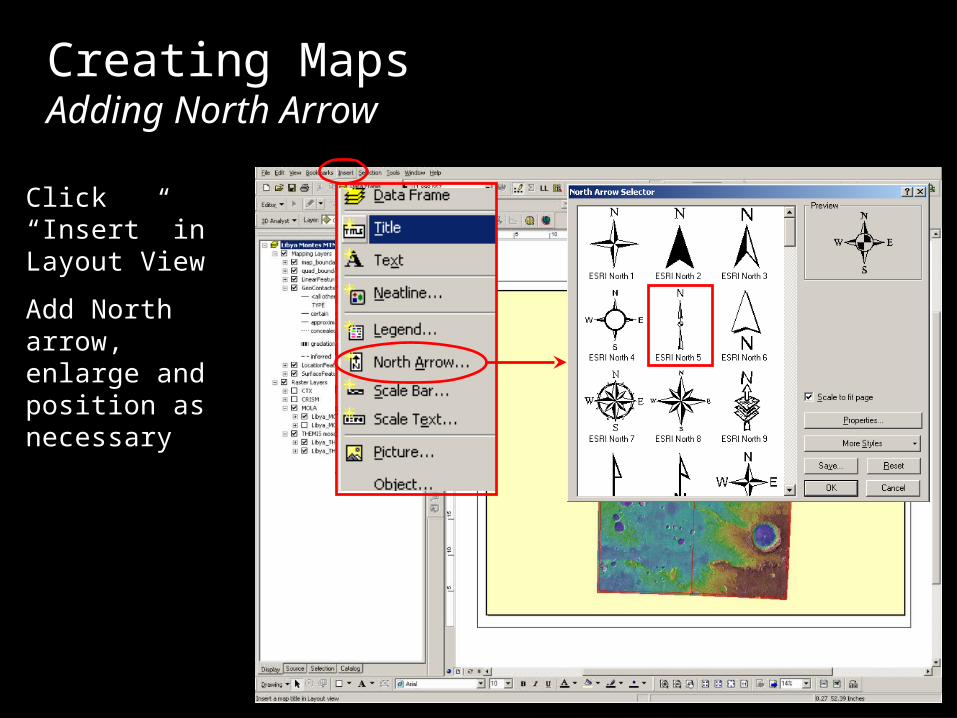
Click “Insert” in Layout View
Add North arrow, enlarge and position as necessary
Creating MapsAdding North Arrow

In Data Frame Tool bar,
Set a rotation or use interactive rotation
Now when adding in a North arrow on the rotated data frame, the arrow will be appropriately rotated. Good for single images.
Rotate Data FrameNorth arrow will follow

Click “Insert” in Layout View
Add scale bar, enlarge and position as necessary
Creating MapsAdding Scale Bar

Double click scale bar once it is added to Layout to change properties, such as number of divisions, units, and format
GIS for Planetary Mappers
Creating MapsTweaking Scale Bar
17

Click “Insert” in Layout View
Select the layers that should be represented on the layout
Click “Next”
Creating MapsAdding Legend

Legend “Wizard”Select relevant layers. Change specifics of legend.
Add border, color, and shadow. Change size of symbol patch. Change part spacing.

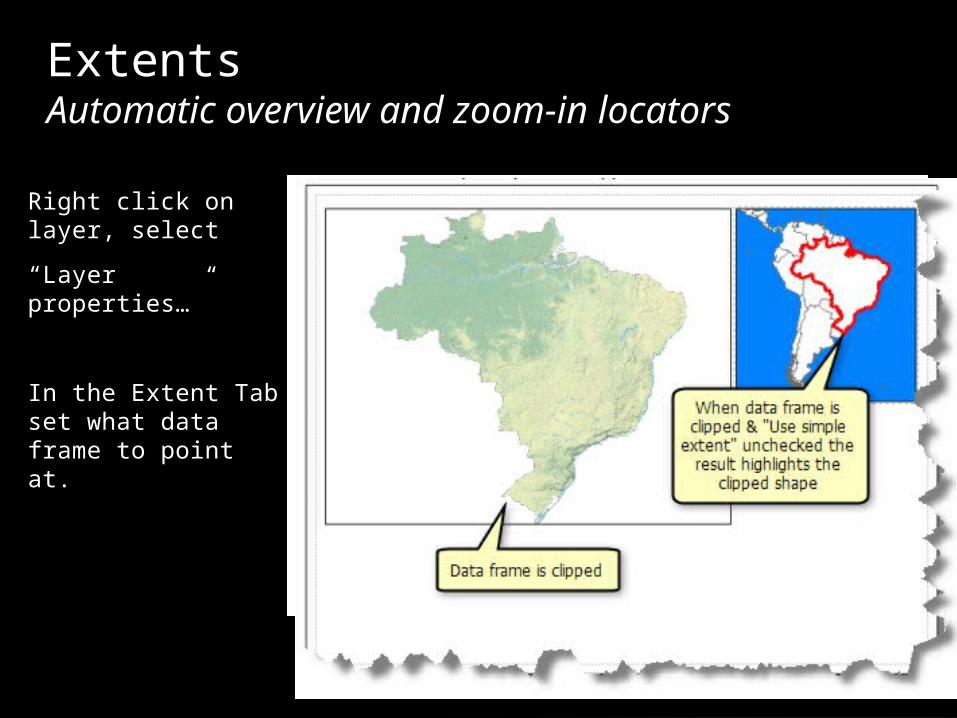
Right click on layer, select
“Layer properties…”
Options
Add descriptive unit label (E->ejecta)
Change unit color
Right click above units on “Symbol”, select “Properties for All Symbols…”, example remove outline for all units
Legendscleaning up legends

Right click on layer, select
“Layer properties…”
Options
Change order
Ctrl or shift select many units
Right click on selected group and “Move to Heading”, “New Heading…”
Legendscleaning up legends

Right click on layer, select
“Layer properties…”
Options to thin legend
Click on “Count”
Ctrl or shift select many symbology lines which are “0”
Click on “Remove”
Legendscleaning up legends
To backup symbologies before removing, right click on layer and “Save As Layer File…” Note: Layer File is not data just symbols!
Right click on layer, select
“Layer properties…”
In the Extent Tab set what data frame to point at.
ExtentsAutomatic overview and zoom-in locators

24
GIS for Planetary Mappers
Final LayoutExample

25
GIS for Planetary Mappers
Export to GeoPDF
Note you can also choose to export attributes to PDF. This will try to create
a geoPDF (for lat/lon and measurements) in Acrobat Reader.
For posters 200 dpi is usually good enough. For page size figure up this to 300 or higher (up to 600)

GIS for Planetary Mappers
Questions?
26
Additional resources (video tutorials)
• Making Better Map Layouts with ArcGIS - esri• http://www.youtube.com/watch?v=YihZzt_lHvE
• ArcGIS 10 Map Layout Demo in ArcMap - Washington College• http://www.youtube.com/watch?v=OQgM1510i0U
Others• Help - esri
• http://resources.arcgis.com/en/help/main/10.1/index.html#/What_is_a_page_layout/00s90000002z000000/
• Using Table in Layouts - esri • http://blogs.esri.com/esri/arcgis/2010/01/19/using-tables-in-an-arcmap-layout/
• JPL WMS used in demo: http://onmoon.jpl.nasa.gov/wms.cgi? (June 2012)