lbh 2.8% value 1 quantitative stock selection … · tfg 3.1% value avi 3.1% quality gln 3.0%...
TRANSCRIPT
09 March 2017
The disclaimer is available at the end of this document, and on our website: http://www.afrifocus.co.za
QUANTITATIVE STOCK SELECTION AND TOP 40 GUIDE
Afrifocus is a level 1 contributor with a BEE procurement level of 135%, and a registered member of JSE
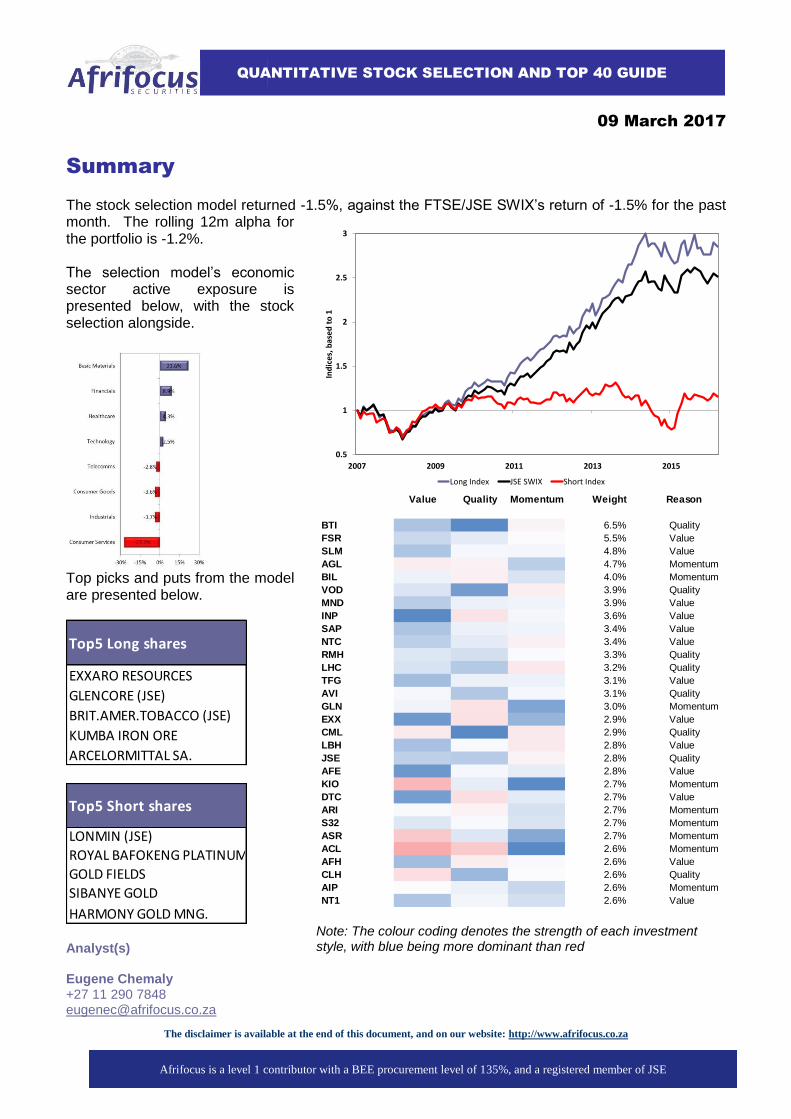
Note: The colour coding denotes the strength of each investment style, with blue being more dominant than red
0.5
1
1.5
2
2.5
3
2007 2009 2011 2013 2015
Ind
ice
s, b
ase
d t
o 1
Long Index JSE SWIX Short Index
Value Quality Momentum Weight Reason
BTI 6.5% Quality
FSR 5.5% Value
SLM 4.8% Value
AGL 4.7% Momentum
BIL 4.0% Momentum
VOD 3.9% Quality
MND 3.9% Value
INP 3.6% Value
SAP 3.4% Value
NTC 3.4% Value
RMH 3.3% Quality
LHC 3.2% Quality
TFG 3.1% Value
AVI 3.1% Quality
GLN 3.0% Momentum
EXX 2.9% Value
CML 2.9% Quality
LBH 2.8% Value
JSE 2.8% Quality
AFE 2.8% Value
KIO 2.7% Momentum
DTC 2.7% Value
ARI 2.7% Momentum
S32 2.7% Momentum
ASR 2.7% Momentum
ACL 2.6% Momentum
AFH 2.6% Value
CLH 2.6% Quality
AIP 2.6% Momentum
NT1 2.6% Value
Summary The stock selection model returned -1.5%, against the FTSE/JSE SWIX’s return of -1.5% for the past month. The rolling 12m alpha for the portfolio is -1.2%. The selection model’s economic sector active exposure is presented below, with the stock selection alongside.
Top picks and puts from the model are presented below.
Analyst(s) Eugene Chemaly +27 11 290 7848 [email protected]
Top5 Long shares
EXXARO RESOURCES
GLENCORE (JSE)
BRIT.AMER.TOBACCO (JSE)
KUMBA IRON ORE
ARCELORMITTAL SA.
Top5 Short shares
LONMIN (JSE)
ROYAL BAFOKENG PLATINUM
GOLD FIELDS
SIBANYE GOLD
HARMONY GOLD MNG.
1
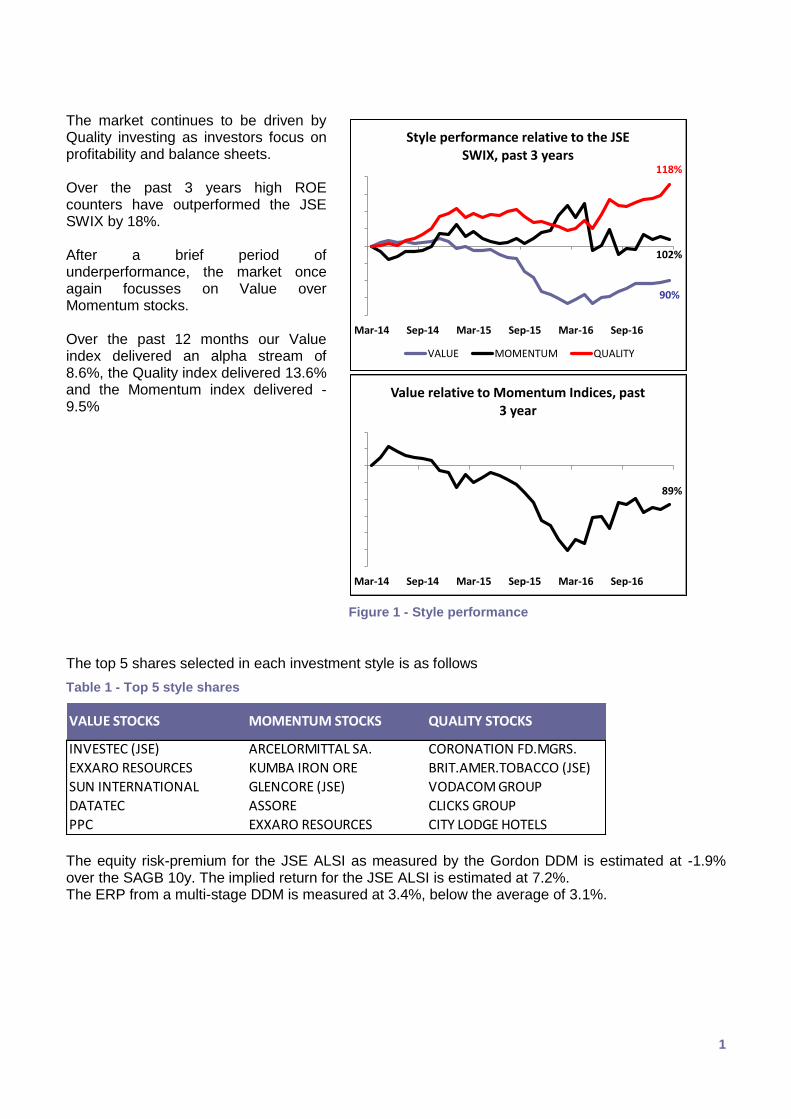
Figure 1 - Style performance
90%
102%
118%
Mar-14 Sep-14 Mar-15 Sep-15 Mar-16 Sep-16
Style performance relative to the JSE SWIX, past 3 years
VALUE MOMENTUM QUALITY
89%
Mar-14 Sep-14 Mar-15 Sep-15 Mar-16 Sep-16
Value relative to Momentum Indices, past 3 year
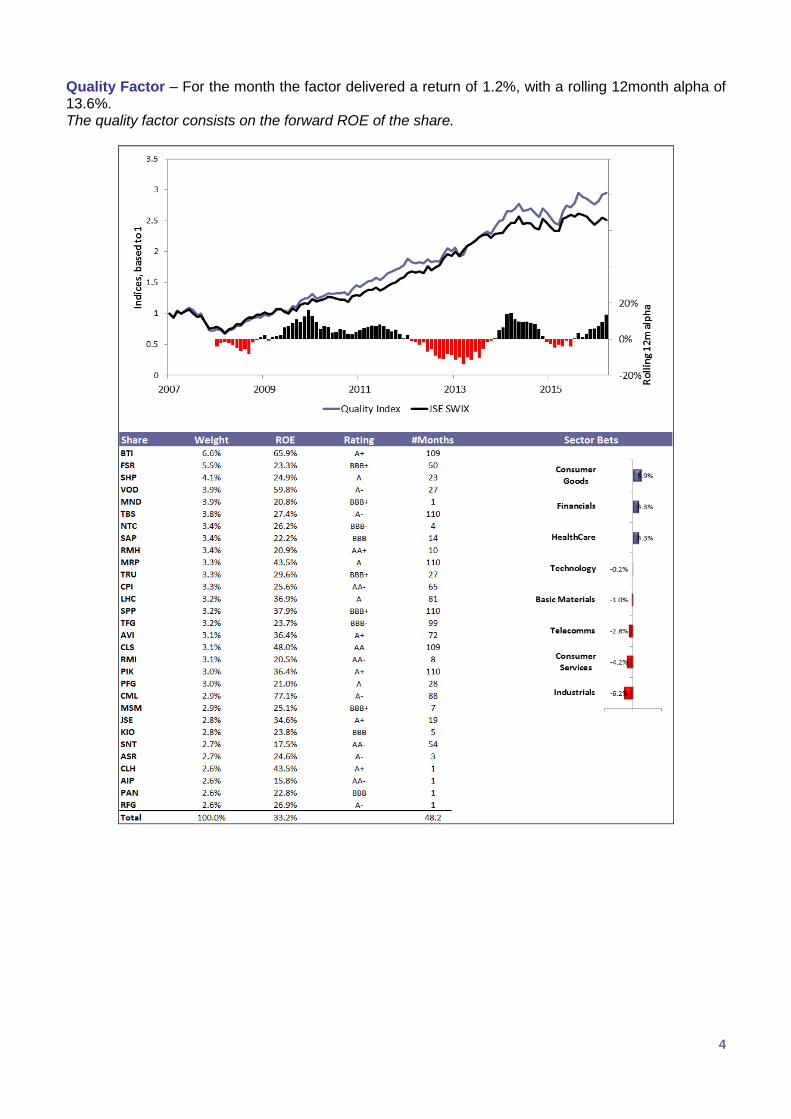
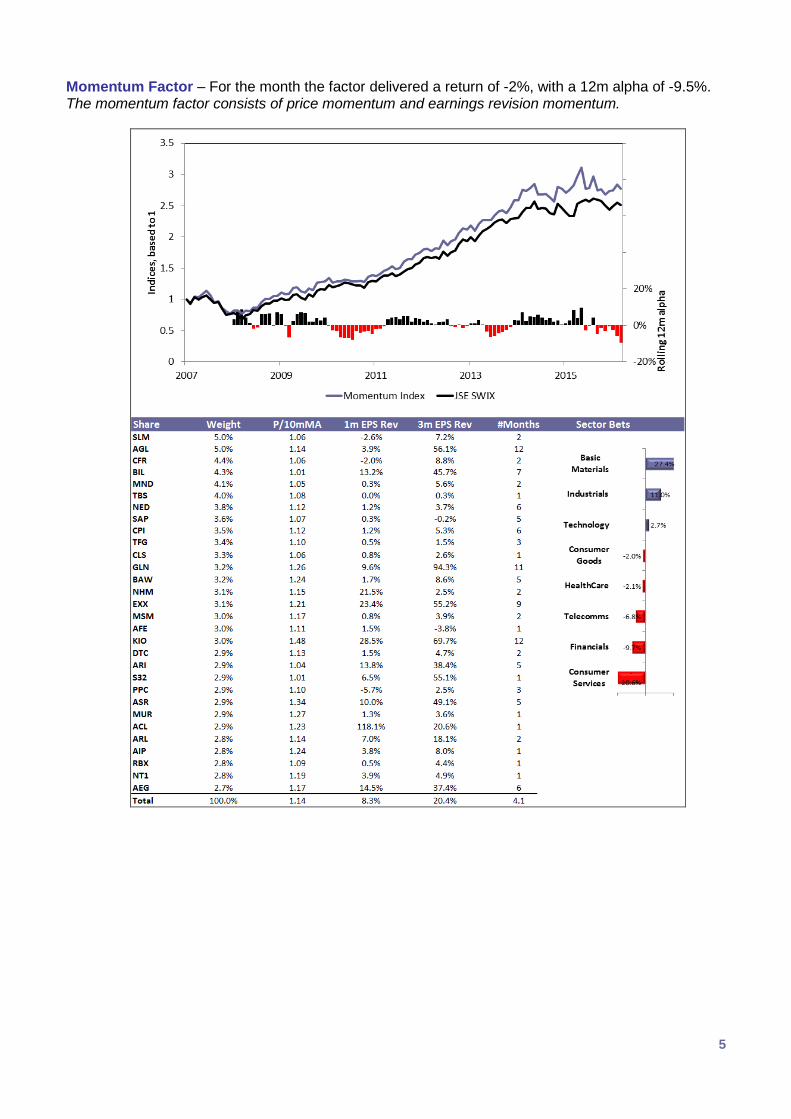
The market continues to be driven by Quality investing as investors focus on profitability and balance sheets. Over the past 3 years high ROE counters have outperformed the JSE SWIX by 18%. After a brief period of underperformance, the market once again focusses on Value over Momentum stocks. Over the past 12 months our Value index delivered an alpha stream of 8.6%, the Quality index delivered 13.6% and the Momentum index delivered -9.5%
The top 5 shares selected in each investment style is as follows
Table 1 - Top 5 style shares
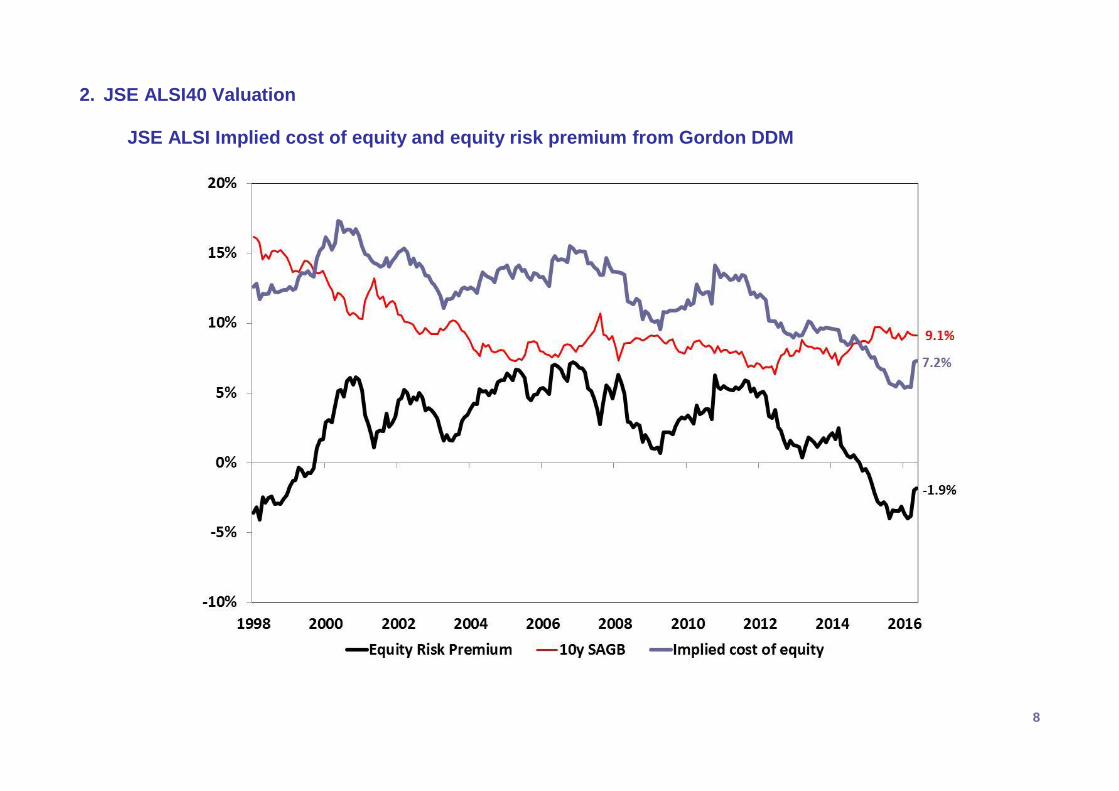
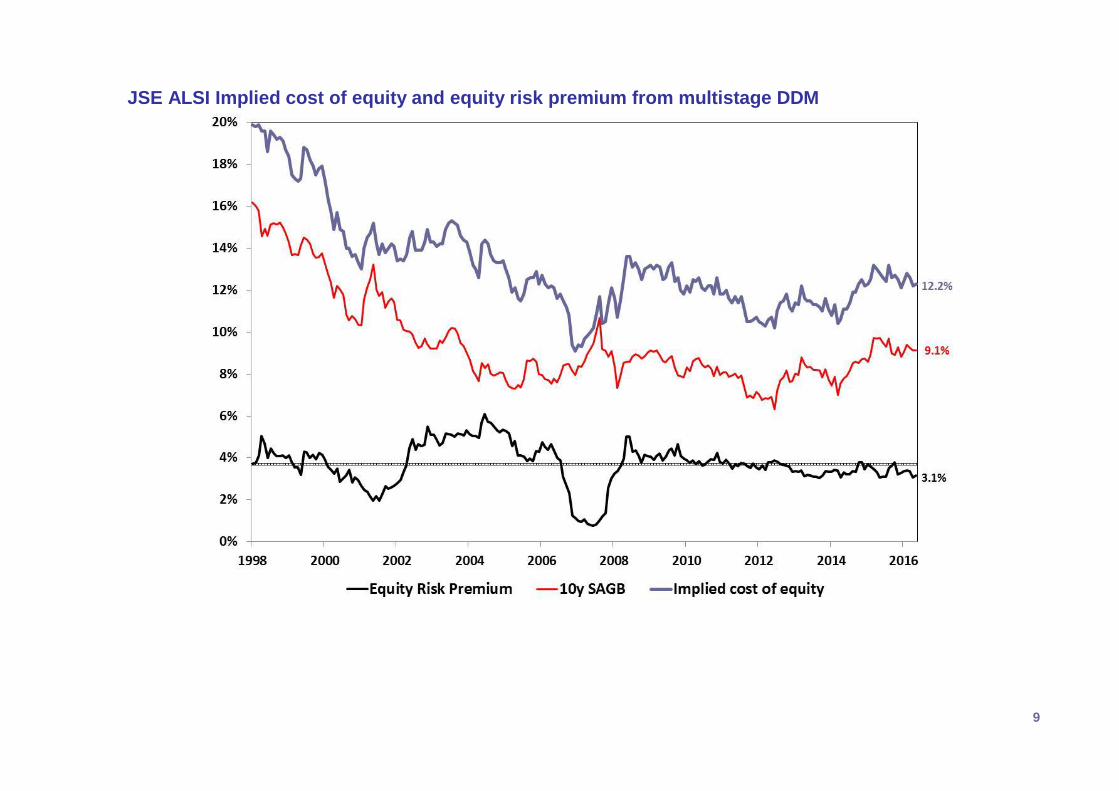
The equity risk-premium for the JSE ALSI as measured by the Gordon DDM is estimated at -1.9% over the SAGB 10y. The implied return for the JSE ALSI is estimated at 7.2%. The ERP from a multi-stage DDM is measured at 3.4%, below the average of 3.1%.
VALUE STOCKS MOMENTUM STOCKS QUALITY STOCKS
INVESTEC (JSE) ARCELORMITTAL SA. CORONATION FD.MGRS.
EXXARO RESOURCES KUMBA IRON ORE BRIT.AMER.TOBACCO (JSE)
SUN INTERNATIONAL GLENCORE (JSE) VODACOM GROUP
DATATEC ASSORE CLICKS GROUP
PPC EXXARO RESOURCES CITY LODGE HOTELS
2
Contents Page
1. Quantitative Stock Selection p.3
2. JSE ALSI40 Valuation p.8 JSE ALSI Implied cost of equity and equity risk premium P/NAV vs ROE plot PE vs 2year forecast EPS growth plot Dividend Yield vs 2year dividend growth plot Forward Ratings – PE, DYld, P/NAV, 2yCAGR, PEG Forward relative ratings – StdDev’s from mean
3. Top 40 Company Summary p.15
3
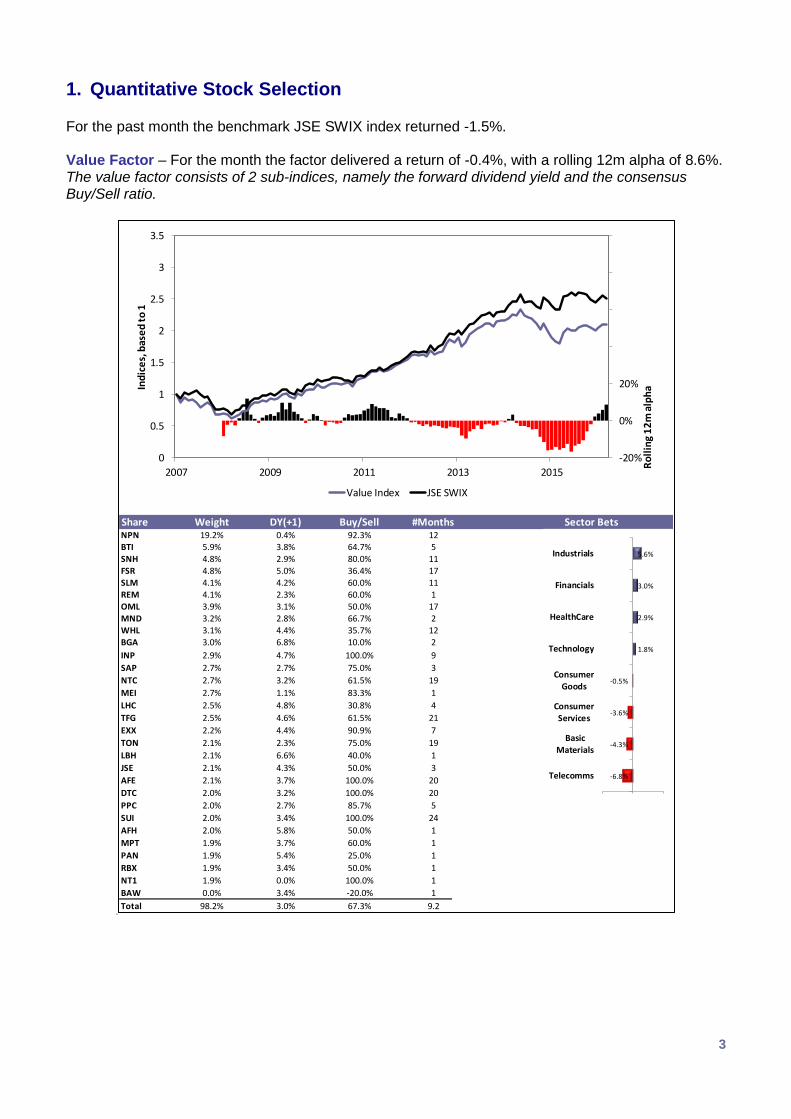
1. Quantitative Stock Selection For the past month the benchmark JSE SWIX index returned -1.5%. Value Factor – For the month the factor delivered a return of -0.4%, with a rolling 12m alpha of 8.6%. The value factor consists of 2 sub-indices, namely the forward dividend yield and the consensus Buy/Sell ratio.
Share Weight DY(+1) Buy/Sell #Months Sector BetsNPN 19.1% 0.4% 0.0% 11BTI 6.0% 3.8% 0.0% 4MTN 5.6% 6.3% 0.0% 78SNH 5.0% 3.3% 0.0% 10FSR 4.6% 5.0% 0.0% 16SLM 3.8% 4.3% 0.0% 10OML 3.8% 3.2% 0.0% 16MND 3.1% 2.9% 0.0% 1WHL 3.1% 4.5% 0.0% 11BGA 3.0% 6.7% 0.0% 1INP 2.9% 4.6% 0.0% 8NTC 2.7% 3.1% 0.0% 18SAP 2.6% 2.7% 0.0% 2RMH 2.6% 5.1% 0.0% 17LHC 2.4% 4.8% 0.0% 3TFG 2.4% 4.8% 0.0% 20EXX 2.1% 4.3% 0.0% 6TON 2.1% 2.9% 0.0% 18JSE 2.1% 4.5% 0.0% 2AFE 2.0% 3.8% NaN 19DTC 2.0% 3.4% 0.0% 19SUI 2.0% 3.1% 0.0% 23PPC 2.0% 2.3% 0.0% 4GND 1.9% 1.1% 0.0% 7AFH 1.9% 5.6% 0.0% 1MPT 1.9% 3.7% 0.0% 1RBX 1.9% 3.6% 0.0% 1GRF 1.8% 3.1% 0.0% 1NT1 1.8% 0.0% 0.0% 1PAN 0.0% 5.6% 0.0% 1Total 98.2% 3.2% 0.0% 13.2
-20%0%20%40%60%80%100%
00.511.522.533.5
2007 2009 2011 2013 2015 Rolling 12m alphaIndices, based to 1
Value Index JSE SWIX
-15% 0% 15%BasicMaterialsConsumerServicesTelecommsConsumerGoodsHealthCareTechnologyFinancialsIndustrials
Share Weight DY(+1) Buy/Sell #Months Sector BetsNPN 19.2% 0.4% 92.3% 12BTI 5.9% 3.8% 64.7% 5
SNH 4.8% 2.9% 80.0% 11FSR 4.8% 5.0% 36.4% 17
SLM 4.1% 4.2% 60.0% 11REM 4.1% 2.3% 60.0% 1
OML 3.9% 3.1% 50.0% 17MND 3.2% 2.8% 66.7% 2
WHL 3.1% 4.4% 35.7% 12BGA 3.0% 6.8% 10.0% 2
INP 2.9% 4.7% 100.0% 9
SAP 2.7% 2.7% 75.0% 3
NTC 2.7% 3.2% 61.5% 19
MEI 2.7% 1.1% 83.3% 1
LHC 2.5% 4.8% 30.8% 4
TFG 2.5% 4.6% 61.5% 21
EXX 2.2% 4.4% 90.9% 7
TON 2.1% 2.3% 75.0% 19
LBH 2.1% 6.6% 40.0% 1
JSE 2.1% 4.3% 50.0% 3
AFE 2.1% 3.7% 100.0% 20
DTC 2.0% 3.2% 100.0% 20
PPC 2.0% 2.7% 85.7% 5
SUI 2.0% 3.4% 100.0% 24
AFH 2.0% 5.8% 50.0% 1
MPT 1.9% 3.7% 60.0% 1
PAN 1.9% 5.4% 25.0% 1
RBX 1.9% 3.4% 50.0% 1
NT1 1.9% 0.0% 100.0% 1
BAW 0.0% 3.4% -20.0% 1
Total 98.2% 3.0% 67.3% 9.2
-20%
0%
20%
40%
60%
80%
100%
0
0.5
1
1.5
2
2.5
3
3.5
2007 2009 2011 2013 2015
Ro
llin
g 1
2m
alp
haIn
dic
es,
bas
ed
to
1
Value Index JSE SWIX
-6.8%
-4.3%
-3.6%
-0.5%
1.8%
2.9%
3.0%
5.6%
Telecomms
Basic
Materials
ConsumerServices
ConsumerGoods
Technology
HealthCare
Financials
Industrials
4
Quality Factor – For the month the factor delivered a return of 1.2%, with a rolling 12month alpha of 13.6%. The quality factor consists on the forward ROE of the share.
5
Momentum Factor – For the month the factor delivered a return of -2%, with a 12m alpha of -9.5%. The momentum factor consists of price momentum and earnings revision momentum.
6
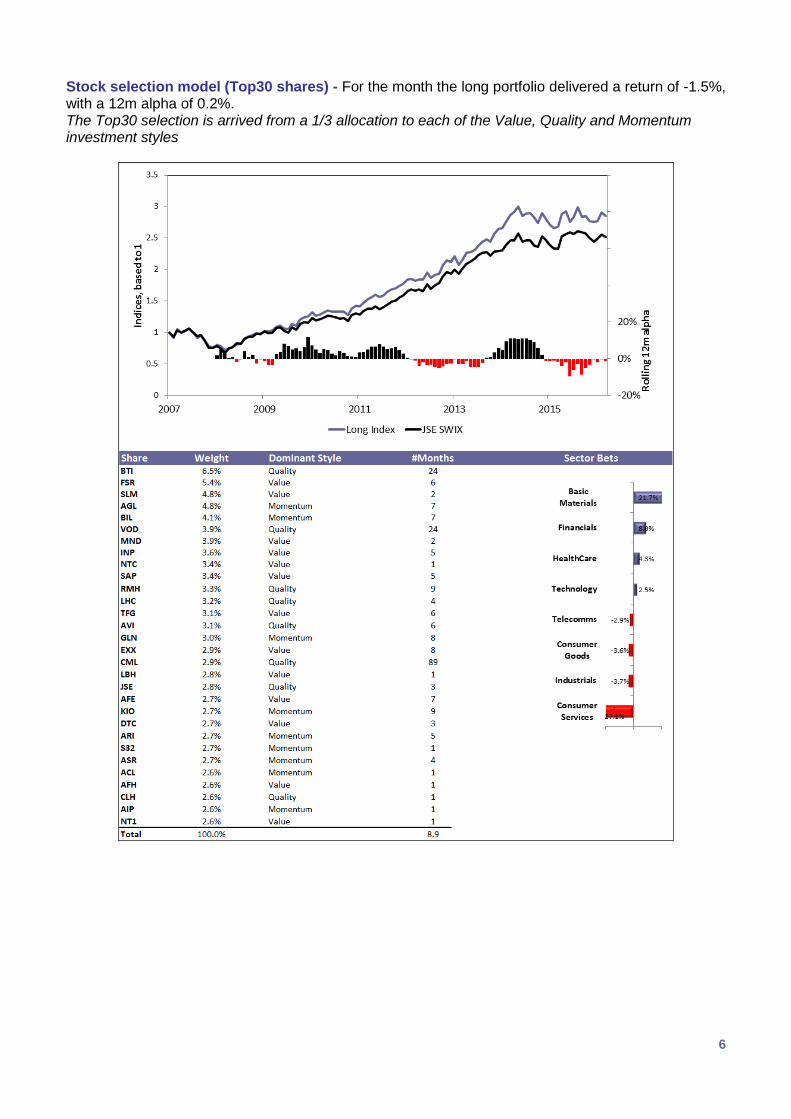
Stock selection model (Top30 shares) - For the month the long portfolio delivered a return of -1.5%, with a 12m alpha of 0.2%. The Top30 selection is arrived from a 1/3 allocation to each of the Value, Quality and Momentum investment styles
7
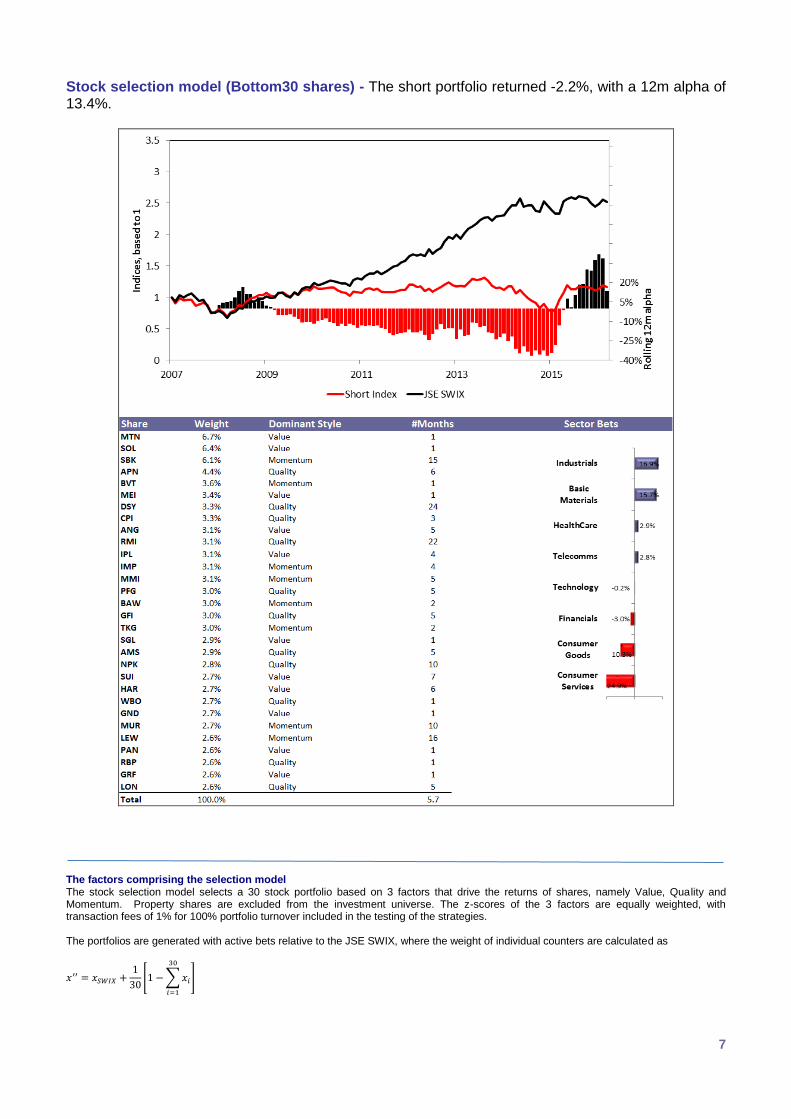
Stock selection model (Bottom30 shares) - The short portfolio returned -2.2%, with a 12m alpha of 13.4%.
The factors comprising the selection model The stock selection model selects a 30 stock portfolio based on 3 factors that drive the returns of shares, namely Value, Quality and Momentum. Property shares are excluded from the investment universe. The z-scores of the 3 factors are equally weighted, with transaction fees of 1% for 100% portfolio turnover included in the testing of the strategies. The portfolios are generated with active bets relative to the JSE SWIX, where the weight of individual counters are calculated as
𝑥′′ = 𝑥𝑆𝑊𝐼𝑋 +1
30[1 −∑𝑥𝑖
30
𝑖=1
]
8
2. JSE ALSI40 Valuation
JSE ALSI Implied cost of equity and equity risk premium from Gordon DDM
9
JSE ALSI Implied cost of equity and equity risk premium from multistage DDM
10
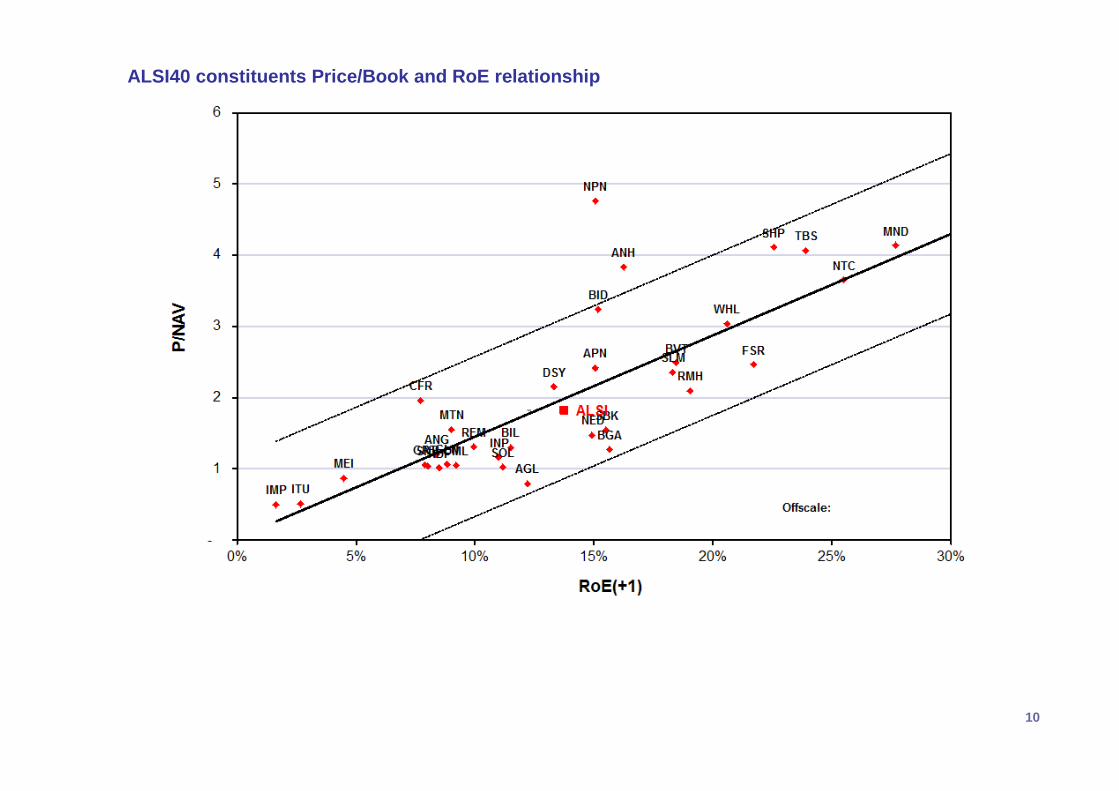
ALSI40 constituents Price/Book and RoE relationship
11
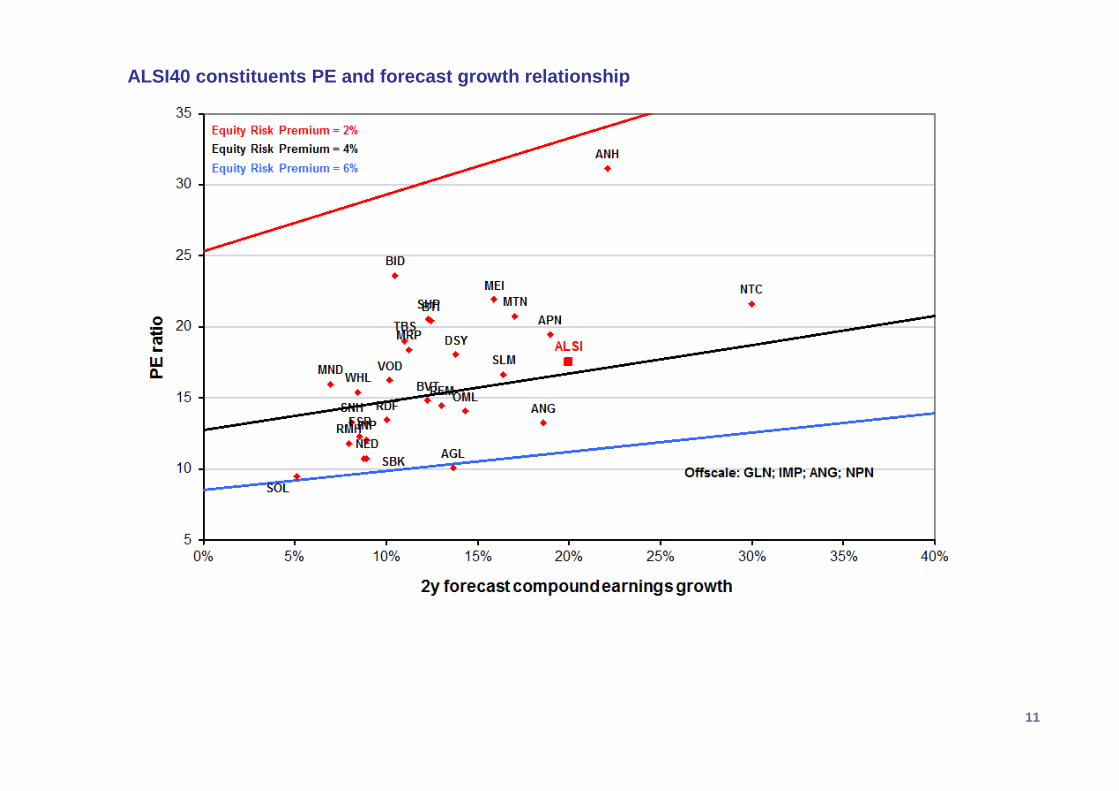
ALSI40 constituents PE and forecast growth relationship
12
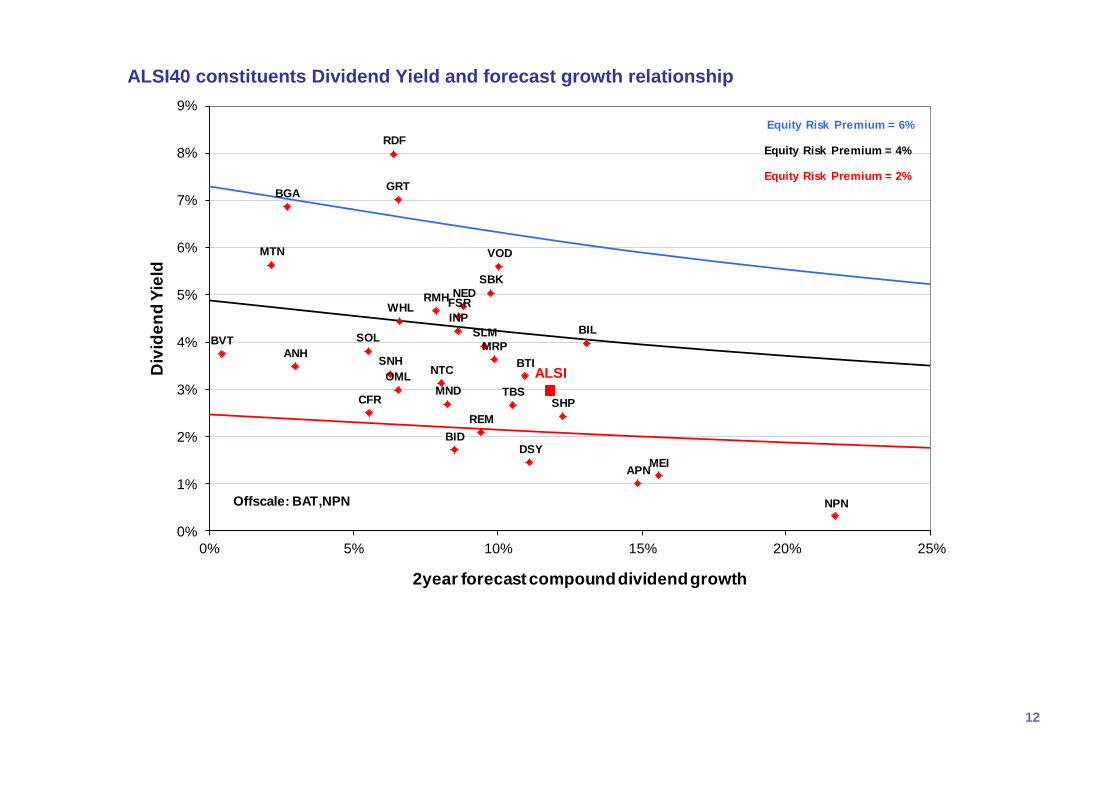
ALSI40 constituents Dividend Yield and forecast growth relationship
ANH
APN
BGA
BID
BIL
BTI
BVT
CFR
DSY
FSR
GRT
INP
MEI
MND
MRP
MTN
NED
NPN
NTCOML
RDF
REM
RMH
SBK
SHP
SLM
SNH
SOL
TBS
VOD
WHL
ALSI
0%
1%
2%
3%
4%
5%
6%
7%
8%
9%
0% 5% 10% 15% 20% 25%
Div
ide
nd
Yie
ld
2year forecast compound dividend growth
Equity Risk Premium = 2%
Equity Risk Premium = 4%
Equity Risk Premium = 6%
Offscale: BAT,NPN
13
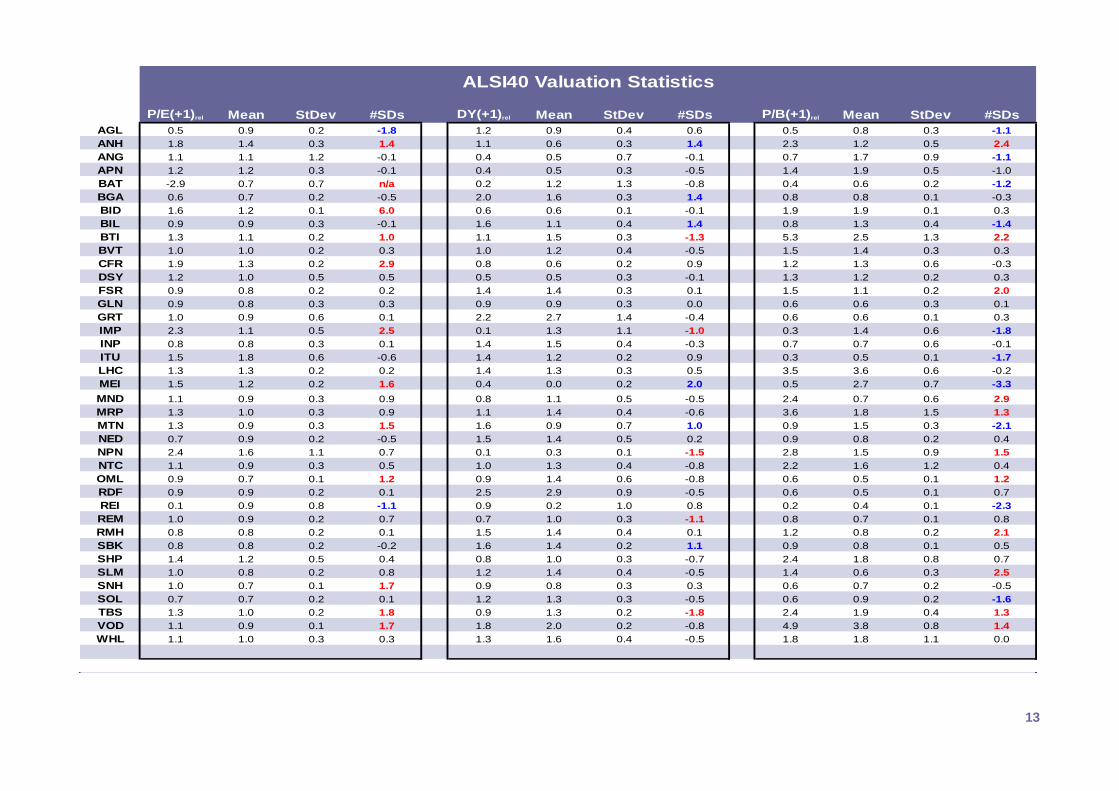
P/E(+1)rel Mean StDev #SDs DY(+1)rel Mean StDev #SDs P/B(+1)rel Mean StDev #SDs
AGL 0.5 0.9 0.2 -1.8 1.2 0.9 0.4 0.6 0.5 0.8 0.3 -1.1
ANH 1.8 1.4 0.3 1.4 1.1 0.6 0.3 1.4 2.3 1.2 0.5 2.4
ANG 1.1 1.1 1.2 -0.1 0.4 0.5 0.7 -0.1 0.7 1.7 0.9 -1.1
APN 1.2 1.2 0.3 -0.1 0.4 0.5 0.3 -0.5 1.4 1.9 0.5 -1.0
BAT -2.9 0.7 0.7 n/a 0.2 1.2 1.3 -0.8 0.4 0.6 0.2 -1.2
BGA 0.6 0.7 0.2 -0.5 2.0 1.6 0.3 1.4 0.8 0.8 0.1 -0.3
BID 1.6 1.2 0.1 6.0 0.6 0.6 0.1 -0.1 1.9 1.9 0.1 0.3
BIL 0.9 0.9 0.3 -0.1 1.6 1.1 0.4 1.4 0.8 1.3 0.4 -1.4
BTI 1.3 1.1 0.2 1.0 1.1 1.5 0.3 -1.3 5.3 2.5 1.3 2.2
BVT 1.0 1.0 0.2 0.3 1.0 1.2 0.4 -0.5 1.5 1.4 0.3 0.3
CFR 1.9 1.3 0.2 2.9 0.8 0.6 0.2 0.9 1.2 1.3 0.6 -0.3
DSY 1.2 1.0 0.5 0.5 0.5 0.5 0.3 -0.1 1.3 1.2 0.2 0.3
FSR 0.9 0.8 0.2 0.2 1.4 1.4 0.3 0.1 1.5 1.1 0.2 2.0
GLN 0.9 0.8 0.3 0.3 0.9 0.9 0.3 0.0 0.6 0.6 0.3 0.1
GRT 1.0 0.9 0.6 0.1 2.2 2.7 1.4 -0.4 0.6 0.6 0.1 0.3
IMP 2.3 1.1 0.5 2.5 0.1 1.3 1.1 -1.0 0.3 1.4 0.6 -1.8
INP 0.8 0.8 0.3 0.1 1.4 1.5 0.4 -0.3 0.7 0.7 0.6 -0.1
ITU 1.5 1.8 0.6 -0.6 1.4 1.2 0.2 0.9 0.3 0.5 0.1 -1.7
LHC 1.3 1.3 0.2 0.2 1.4 1.3 0.3 0.5 3.5 3.6 0.6 -0.2
MEI 1.5 1.2 0.2 1.6 0.4 0.0 0.2 2.0 0.5 2.7 0.7 -3.3
MND 1.1 0.9 0.3 0.9 0.8 1.1 0.5 -0.5 2.4 0.7 0.6 2.9
MRP 1.3 1.0 0.3 0.9 1.1 1.4 0.4 -0.6 3.6 1.8 1.5 1.3
MTN 1.3 0.9 0.3 1.5 1.6 0.9 0.7 1.0 0.9 1.5 0.3 -2.1
NED 0.7 0.9 0.2 -0.5 1.5 1.4 0.5 0.2 0.9 0.8 0.2 0.4
NPN 2.4 1.6 1.1 0.7 0.1 0.3 0.1 -1.5 2.8 1.5 0.9 1.5
NTC 1.1 0.9 0.3 0.5 1.0 1.3 0.4 -0.8 2.2 1.6 1.2 0.4
OML 0.9 0.7 0.1 1.2 0.9 1.4 0.6 -0.8 0.6 0.5 0.1 1.2
RDF 0.9 0.9 0.2 0.1 2.5 2.9 0.9 -0.5 0.6 0.5 0.1 0.7
REI 0.1 0.9 0.8 -1.1 0.9 0.2 1.0 0.8 0.2 0.4 0.1 -2.3
REM 1.0 0.9 0.2 0.7 0.7 1.0 0.3 -1.1 0.8 0.7 0.1 0.8
RMH 0.8 0.8 0.2 0.1 1.5 1.4 0.4 0.1 1.2 0.8 0.2 2.1
SBK 0.8 0.8 0.2 -0.2 1.6 1.4 0.2 1.1 0.9 0.8 0.1 0.5
SHP 1.4 1.2 0.5 0.4 0.8 1.0 0.3 -0.7 2.4 1.8 0.8 0.7
SLM 1.0 0.8 0.2 0.8 1.2 1.4 0.4 -0.5 1.4 0.6 0.3 2.5
SNH 1.0 0.7 0.1 1.7 0.9 0.8 0.3 0.3 0.6 0.7 0.2 -0.5
SOL 0.7 0.7 0.2 0.1 1.2 1.3 0.3 -0.5 0.6 0.9 0.2 -1.6
TBS 1.3 1.0 0.2 1.8 0.9 1.3 0.2 -1.8 2.4 1.9 0.4 1.3
VOD 1.1 0.9 0.1 1.7 1.8 2.0 0.2 -0.8 4.9 3.8 0.8 1.4
WHL 1.1 1.0 0.3 0.3 1.3 1.6 0.4 -0.5 1.8 1.8 1.1 0.0
ALSI40 Valuation Statistics
14
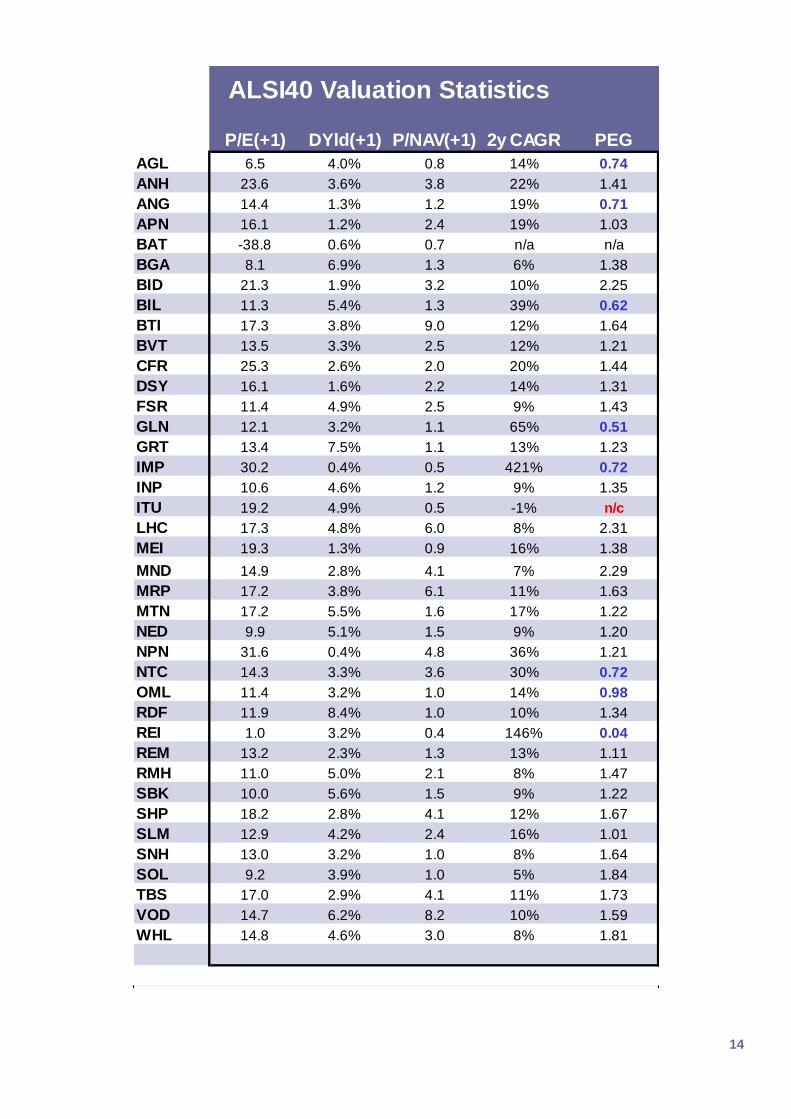
P/E(+1) DYld(+1) P/NAV(+1) 2y CAGR PEG
AGL 6.5 4.0% 0.8 14% 0.74
ANH 23.6 3.6% 3.8 22% 1.41
ANG 14.4 1.3% 1.2 19% 0.71
APN 16.1 1.2% 2.4 19% 1.03
BAT -38.8 0.6% 0.7 n/a n/a
BGA 8.1 6.9% 1.3 6% 1.38
BID 21.3 1.9% 3.2 10% 2.25
BIL 11.3 5.4% 1.3 39% 0.62
BTI 17.3 3.8% 9.0 12% 1.64
BVT 13.5 3.3% 2.5 12% 1.21
CFR 25.3 2.6% 2.0 20% 1.44
DSY 16.1 1.6% 2.2 14% 1.31
FSR 11.4 4.9% 2.5 9% 1.43
GLN 12.1 3.2% 1.1 65% 0.51
GRT 13.4 7.5% 1.1 13% 1.23
IMP 30.2 0.4% 0.5 421% 0.72
INP 10.6 4.6% 1.2 9% 1.35
ITU 19.2 4.9% 0.5 -1% n/c
LHC 17.3 4.8% 6.0 8% 2.31
MEI 19.3 1.3% 0.9 16% 1.38
MND 14.9 2.8% 4.1 7% 2.29
MRP 17.2 3.8% 6.1 11% 1.63
MTN 17.2 5.5% 1.6 17% 1.22
NED 9.9 5.1% 1.5 9% 1.20
NPN 31.6 0.4% 4.8 36% 1.21
NTC 14.3 3.3% 3.6 30% 0.72
OML 11.4 3.2% 1.0 14% 0.98
RDF 11.9 8.4% 1.0 10% 1.34
REI 1.0 3.2% 0.4 146% 0.04
REM 13.2 2.3% 1.3 13% 1.11
RMH 11.0 5.0% 2.1 8% 1.47
SBK 10.0 5.6% 1.5 9% 1.22
SHP 18.2 2.8% 4.1 12% 1.67
SLM 12.9 4.2% 2.4 16% 1.01
SNH 13.0 3.2% 1.0 8% 1.64
SOL 9.2 3.9% 1.0 5% 1.84
TBS 17.0 2.9% 4.1 11% 1.73
VOD 14.7 6.2% 8.2 10% 1.59
WHL 14.8 4.6% 3.0 8% 1.81
ALSI40 Valuation Statistics
15
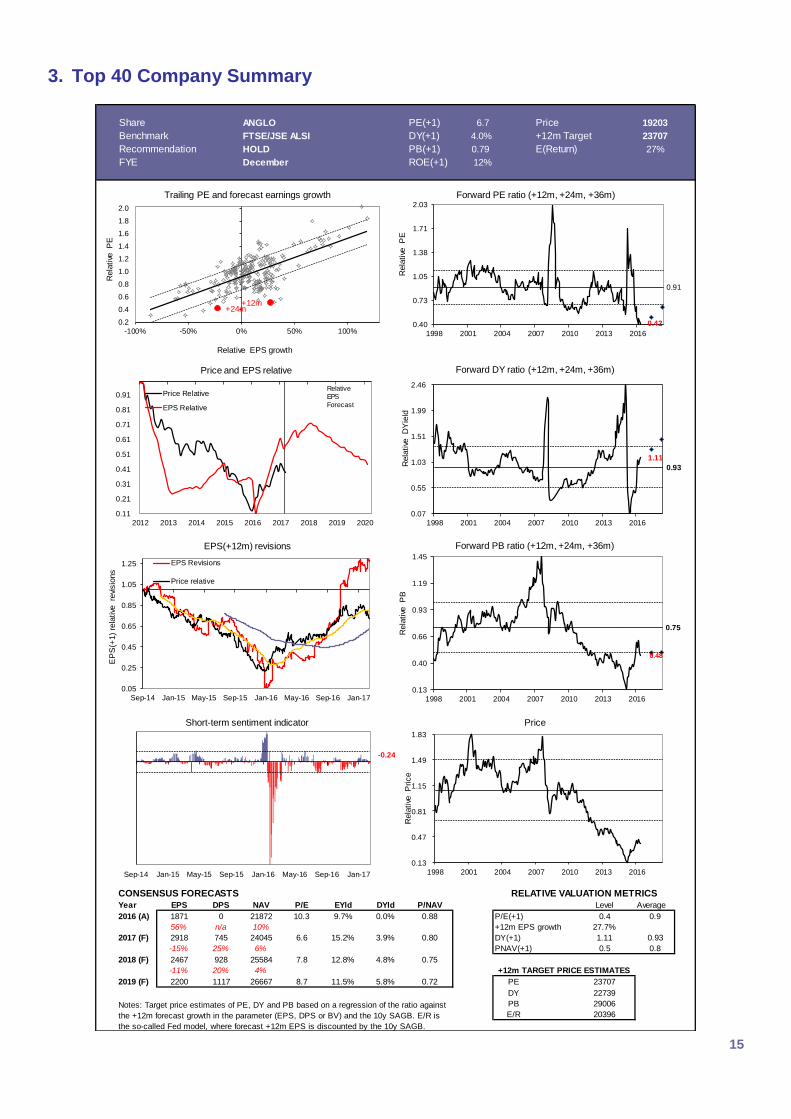
3. Top 40 Company Summary
Share ANGLO PE(+1) 6.7 Price 19203
Benchmark FTSE/JSE ALSI DY(+1) 4.0% +12m Target 23707
Recommendation HOLD PB(+1) 0.79 E(Return) 27%
FYE December ROE(+1) 12% Buy/Sell ratio 41%
CONSENSUS FORECASTS
Year EPS DPS NAV P/E EYld DYld P/NAV Level Average
2016 (A) 1871 0 21872 10.3 9.7% 0.0% 0.88 P/E(+1) 0.4 0.9
56% n/a 10% +12m EPS growth 27.7%
2017 (F) 2918 745 24045 6.6 15.2% 3.9% 0.80 DY(+1) 1.11 0.93
-15% 25% 6% PNAV(+1) 0.5 0.8
2018 (F) 2467 928 25584 7.8 12.8% 4.8% 0.75
-11% 20% 4%
2019 (F) 2200 1117 26667 8.7 11.5% 5.8% 0.72 PE 23707
DY 22739
PB 29006
E/R 20396Notes: Target price estimates of PE, DY and PB based on a regression of the ratio against
the +12m forecast growth in the parameter (EPS, DPS or BV) and the 10y SAGB. E/R is
the so-called Fed model, where forecast +12m EPS is discounted by the 10y SAGB.
+12m TARGET PRICE ESTIMATES
RELATIVE VALUATION METRICS
0.11
0.21
0.31
0.41
0.51
0.61
0.71
0.81
0.91
2012 2013 2014 2015 2016 2017 2018 2019 2020
Price and EPS relative
Price Relative
EPS Relative
+12m+24m
0.2
0.4
0.6
0.8
1.0
1.2
1.4
1.6
1.8
2.0
-100% -50% 0% 50% 100%
Rela
tive
P
E
Relative EPS growth
Trailing PE and forecast earnings growth
0.42
0.91
0.40
0.73
1.05
1.38
1.71
2.03
1998 2001 2004 2007 2010 2013 2016
Rela
tive
P
E
Forward PE ratio (+12m, +24m, +36m)
1.11
0.93
0.07
0.55
1.03
1.51
1.99
2.46
1998 2001 2004 2007 2010 2013 2016
Rela
tive
D
Yie
ld
Forward DY ratio (+12m, +24m, +36m)
Relative
EPS
Forecast
0.48
0.75
0.13
0.40
0.66
0.93
1.19
1.45
1998 2001 2004 2007 2010 2013 2016
Rela
tive
P
B
Forward PB ratio (+12m, +24m, +36m)
0.05
0.25
0.45
0.65
0.85
1.05
1.25
Sep-14 Jan-15 May-15 Sep-15 Jan-16 May-16 Sep-16 Jan-17
EP
S(+
1)
rela
tive
re
visio
ns
EPS(+12m) revisions
EPS Revisions
Price relative
0.13
0.47
0.81
1.15
1.49
1.83
1998 2001 2004 2007 2010 2013 2016
Rela
tive
P
rice
Price
-0.24
Sep-14 Jan-15 May-15 Sep-15 Jan-16 May-16 Sep-16 Jan-17
Short-term sentiment indicator

16
17
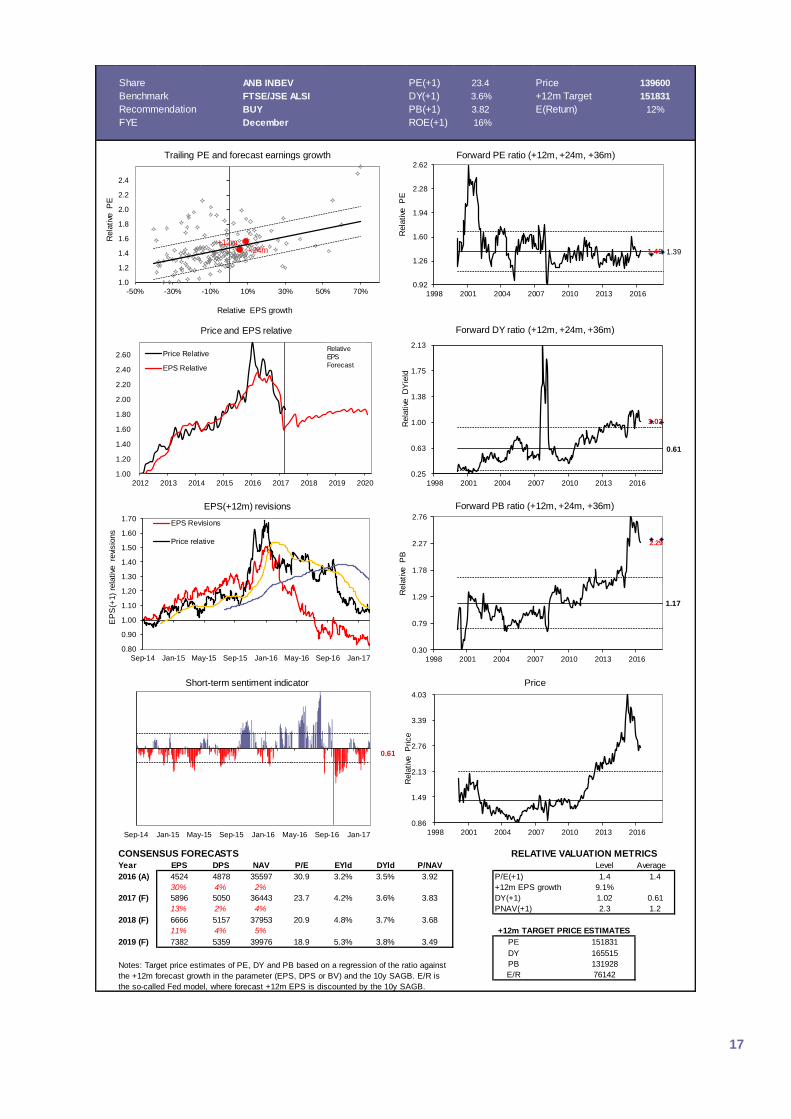
Share ANB INBEV PE(+1) 23.4 Price 139600
Benchmark FTSE/JSE ALSI DY(+1) 3.6% +12m Target 151831
Recommendation BUY PB(+1) 3.82 E(Return) 12%
FYE December ROE(+1) 16% Buy/Sell ratio #N/A
CONSENSUS FORECASTS
Year EPS DPS NAV P/E EYld DYld P/NAV Level Average
2016 (A) 4524 4878 35597 30.9 3.2% 3.5% 3.92 P/E(+1) 1.4 1.4
30% 4% 2% +12m EPS growth 9.1%
2017 (F) 5896 5050 36443 23.7 4.2% 3.6% 3.83 DY(+1) 1.02 0.61
13% 2% 4% PNAV(+1) 2.3 1.2
2018 (F) 6666 5157 37953 20.9 4.8% 3.7% 3.68
11% 4% 5%
2019 (F) 7382 5359 39976 18.9 5.3% 3.8% 3.49 PE 151831
DY 165515
PB 131928
E/R 76142Notes: Target price estimates of PE, DY and PB based on a regression of the ratio against
the +12m forecast growth in the parameter (EPS, DPS or BV) and the 10y SAGB. E/R is
the so-called Fed model, where forecast +12m EPS is discounted by the 10y SAGB.
+12m TARGET PRICE ESTIMATES
RELATIVE VALUATION METRICS
1.00
1.20
1.40
1.60
1.80
2.00
2.20
2.40
2.60
2012 2013 2014 2015 2016 2017 2018 2019 2020
Price and EPS relative
Price Relative
EPS Relative
+12m+24m
1.0
1.2
1.4
1.6
1.8
2.0
2.2
2.4
-50% -30% -10% 10% 30% 50% 70%
Rela
tive
P
E
Relative EPS growth
Trailing PE and forecast earnings growth
1.40 1.39
0.92
1.26
1.60
1.94
2.28
2.62
1998 2001 2004 2007 2010 2013 2016
Rela
tive
P
E
Forward PE ratio (+12m, +24m, +36m)
1.02
0.61
0.25
0.63
1.00
1.38
1.75
2.13
1998 2001 2004 2007 2010 2013 2016
Rela
tive
D
Yie
ld
Forward DY ratio (+12m, +24m, +36m)
Relative
EPS
Forecast
2.29
1.17
0.30
0.79
1.29
1.78
2.27
2.76
1998 2001 2004 2007 2010 2013 2016
Rela
tive
P
B
Forward PB ratio (+12m, +24m, +36m)
0.80
0.90
1.00
1.10
1.20
1.30
1.40
1.50
1.60
1.70
Sep-14 Jan-15 May-15 Sep-15 Jan-16 May-16 Sep-16 Jan-17
EP
S(+
1)
rela
tive
re
visio
ns
EPS(+12m) revisions
EPS Revisions
Price relative
0.86
1.49
2.13
2.76
3.39
4.03
1998 2001 2004 2007 2010 2013 2016
Rela
tive
P
rice
Price
0.61
Sep-14 Jan-15 May-15 Sep-15 Jan-16 May-16 Sep-16 Jan-17
Short-term sentiment indicator
18
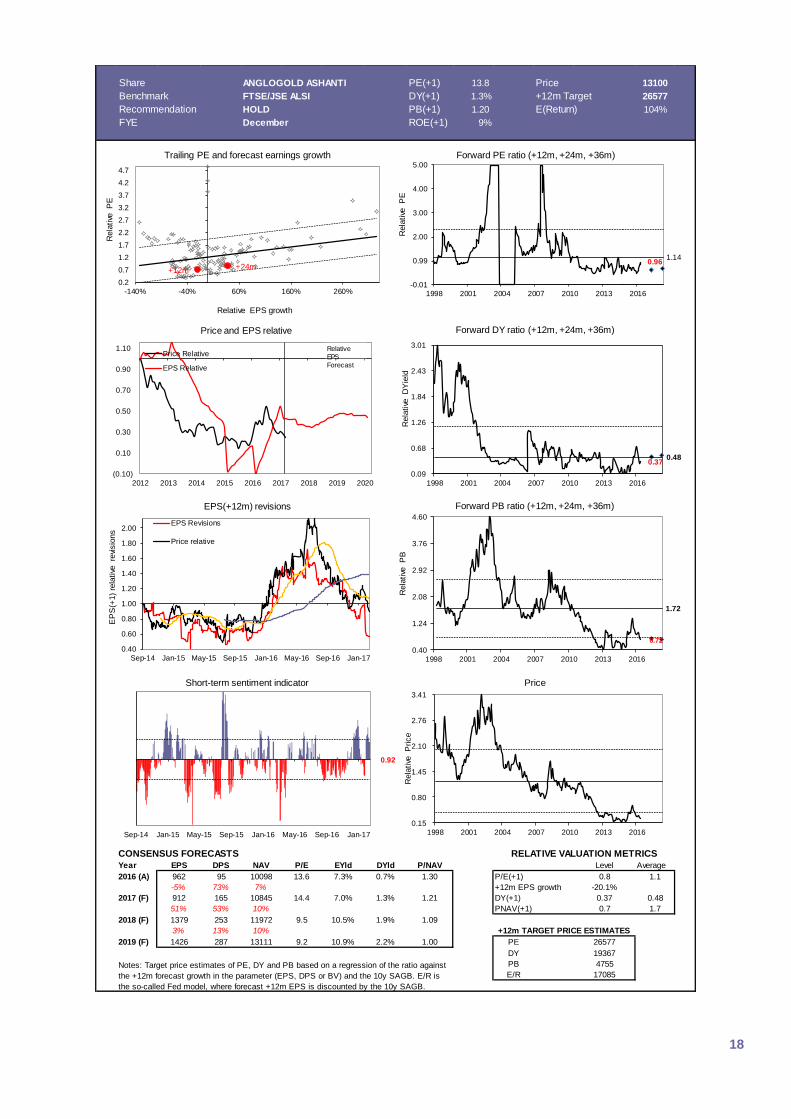
Share ANGLOGOLD ASHANTI PE(+1) 13.8 Price 13100
Benchmark FTSE/JSE ALSI DY(+1) 1.3% +12m Target 26577
Recommendation HOLD PB(+1) 1.20 E(Return) 104%
FYE December ROE(+1) 9% Buy/Sell ratio 25%
CONSENSUS FORECASTS
Year EPS DPS NAV P/E EYld DYld P/NAV Level Average
2016 (A) 962 95 10098 13.6 7.3% 0.7% 1.30 P/E(+1) 0.8 1.1
-5% 73% 7% +12m EPS growth -20.1%
2017 (F) 912 165 10845 14.4 7.0% 1.3% 1.21 DY(+1) 0.37 0.48
51% 53% 10% PNAV(+1) 0.7 1.7
2018 (F) 1379 253 11972 9.5 10.5% 1.9% 1.09
3% 13% 10%
2019 (F) 1426 287 13111 9.2 10.9% 2.2% 1.00 PE 26577
DY 19367
PB 4755
E/R 17085Notes: Target price estimates of PE, DY and PB based on a regression of the ratio against
the +12m forecast growth in the parameter (EPS, DPS or BV) and the 10y SAGB. E/R is
the so-called Fed model, where forecast +12m EPS is discounted by the 10y SAGB.
+12m TARGET PRICE ESTIMATES
RELATIVE VALUATION METRICS
(0.10)
0.10
0.30
0.50
0.70
0.90
1.10
2012 2013 2014 2015 2016 2017 2018 2019 2020
Price and EPS relative
Price Relative
EPS Relative
+12m +24m
0.2
0.7
1.2
1.7
2.2
2.7
3.2
3.7
4.2
4.7
-140% -40% 60% 160% 260%
Rela
tive
P
E
Relative EPS growth
Trailing PE and forecast earnings growth
0.961.14
-0.01
0.99
2.00
3.00
4.00
5.00
1998 2001 2004 2007 2010 2013 2016
Rela
tive
P
E
Forward PE ratio (+12m, +24m, +36m)
0.370.48
0.09
0.68
1.26
1.84
2.43
3.01
1998 2001 2004 2007 2010 2013 2016
Rela
tive
D
Yie
ld
Forward DY ratio (+12m, +24m, +36m)
Relative
EPS
Forecast
0.72
1.72
0.40
1.24
2.08
2.92
3.76
4.60
1998 2001 2004 2007 2010 2013 2016
Rela
tive
P
B
Forward PB ratio (+12m, +24m, +36m)
0.40
0.60
0.80
1.00
1.20
1.40
1.60
1.80
2.00
Sep-14 Jan-15 May-15 Sep-15 Jan-16 May-16 Sep-16 Jan-17
EP
S(+
1)
rela
tive
re
visio
ns
EPS(+12m) revisions
EPS Revisions
Price relative
0.15
0.80
1.45
2.10
2.76
3.41
1998 2001 2004 2007 2010 2013 2016
Rela
tive
P
rice
Price
0.92
Sep-14 Jan-15 May-15 Sep-15 Jan-16 May-16 Sep-16 Jan-17
Short-term sentiment indicator
19
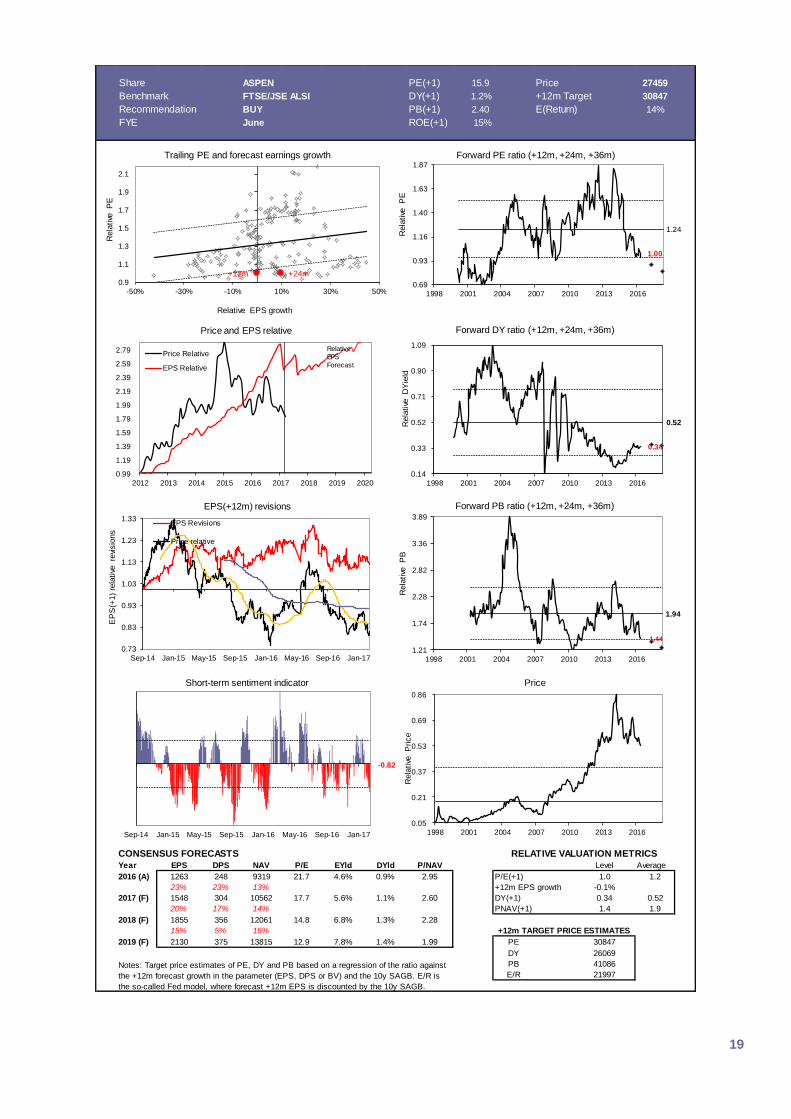
Share ASPEN PE(+1) 15.9 Price 27459
Benchmark FTSE/JSE ALSI DY(+1) 1.2% +12m Target 30847
Recommendation BUY PB(+1) 2.40 E(Return) 14%
FYE June ROE(+1) 15% Buy/Sell ratio 33%
CONSENSUS FORECASTS
Year EPS DPS NAV P/E EYld DYld P/NAV Level Average
2016 (A) 1263 248 9319 21.7 4.6% 0.9% 2.95 P/E(+1) 1.0 1.2
23% 23% 13% +12m EPS growth -0.1%
2017 (F) 1548 304 10562 17.7 5.6% 1.1% 2.60 DY(+1) 0.34 0.52
20% 17% 14% PNAV(+1) 1.4 1.9
2018 (F) 1855 356 12061 14.8 6.8% 1.3% 2.28
15% 5% 15%
2019 (F) 2130 375 13815 12.9 7.8% 1.4% 1.99 PE 30847
DY 26069
PB 41086
E/R 21997Notes: Target price estimates of PE, DY and PB based on a regression of the ratio against
the +12m forecast growth in the parameter (EPS, DPS or BV) and the 10y SAGB. E/R is
the so-called Fed model, where forecast +12m EPS is discounted by the 10y SAGB.
+12m TARGET PRICE ESTIMATES
RELATIVE VALUATION METRICS
0.99
1.19
1.39
1.59
1.79
1.99
2.19
2.39
2.59
2.79
2012 2013 2014 2015 2016 2017 2018 2019 2020
Price and EPS relative
Price Relative
EPS Relative
+12m +24m0.9
1.1
1.3
1.5
1.7
1.9
2.1
-50% -30% -10% 10% 30% 50%
Rela
tive
P
E
Relative EPS growth
Trailing PE and forecast earnings growth
1.00
1.24
0.69
0.93
1.16
1.40
1.63
1.87
1998 2001 2004 2007 2010 2013 2016
Rela
tive
P
E
Forward PE ratio (+12m, +24m, +36m)
0.34
0.52
0.14
0.33
0.52
0.71
0.90
1.09
1998 2001 2004 2007 2010 2013 2016
Rela
tive
D
Yie
ld
Forward DY ratio (+12m, +24m, +36m)
Relative
EPS
Forecast
1.44
1.94
1.21
1.74
2.28
2.82
3.36
3.89
1998 2001 2004 2007 2010 2013 2016
Rela
tive
P
B
Forward PB ratio (+12m, +24m, +36m)
0.73
0.83
0.93
1.03
1.13
1.23
1.33
Sep-14 Jan-15 May-15 Sep-15 Jan-16 May-16 Sep-16 Jan-17
EP
S(+
1)
rela
tive
re
visio
ns
EPS(+12m) revisions
EPS Revisions
Price relative
0.05
0.21
0.37
0.53
0.69
0.86
1998 2001 2004 2007 2010 2013 2016
Rela
tive
P
rice
Price
-0.82
Sep-14 Jan-15 May-15 Sep-15 Jan-16 May-16 Sep-16 Jan-17
Short-term sentiment indicator
20
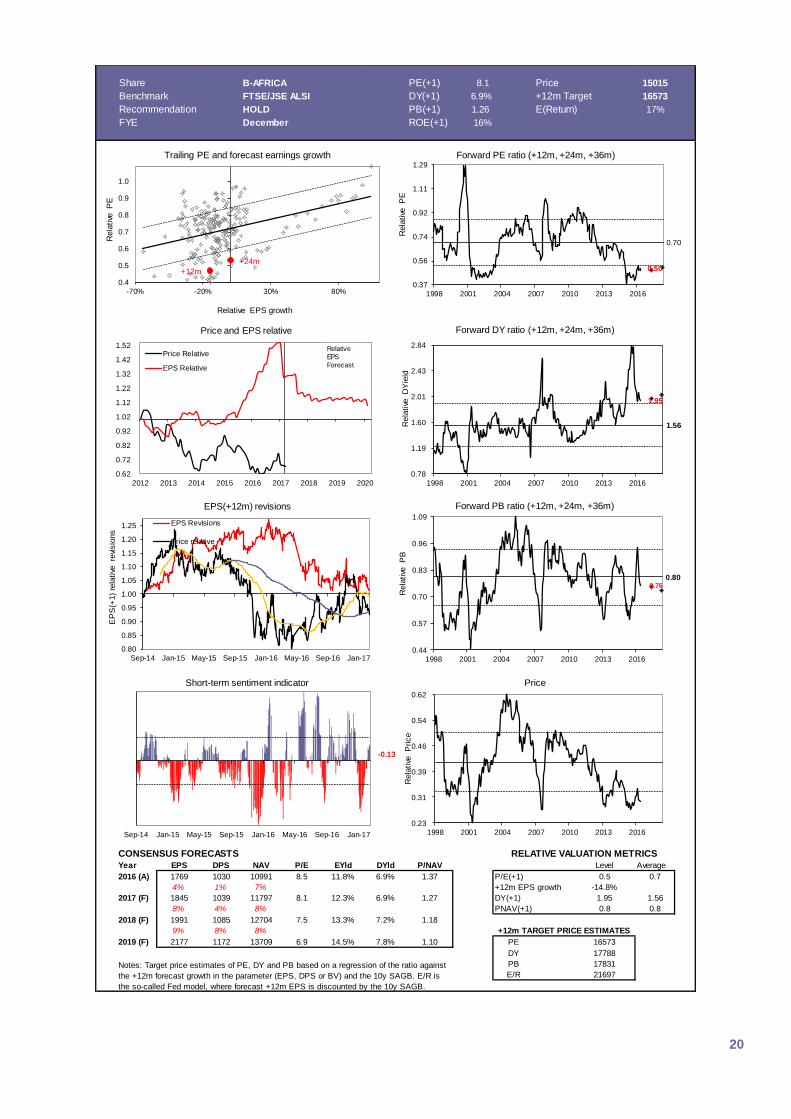
Share B-AFRICA PE(+1) 8.1 Price 15015
Benchmark FTSE/JSE ALSI DY(+1) 6.9% +12m Target 16573
Recommendation HOLD PB(+1) 1.26 E(Return) 17%
FYE December ROE(+1) 16% Buy/Sell ratio 73%
CONSENSUS FORECASTS
Year EPS DPS NAV P/E EYld DYld P/NAV Level Average
2016 (A) 1769 1030 10991 8.5 11.8% 6.9% 1.37 P/E(+1) 0.5 0.7
4% 1% 7% +12m EPS growth -14.8%
2017 (F) 1845 1039 11797 8.1 12.3% 6.9% 1.27 DY(+1) 1.95 1.56
8% 4% 8% PNAV(+1) 0.8 0.8
2018 (F) 1991 1085 12704 7.5 13.3% 7.2% 1.18
9% 8% 8%
2019 (F) 2177 1172 13709 6.9 14.5% 7.8% 1.10 PE 16573
DY 17788
PB 17831
E/R 21697Notes: Target price estimates of PE, DY and PB based on a regression of the ratio against
the +12m forecast growth in the parameter (EPS, DPS or BV) and the 10y SAGB. E/R is
the so-called Fed model, where forecast +12m EPS is discounted by the 10y SAGB.
+12m TARGET PRICE ESTIMATES
RELATIVE VALUATION METRICS
0.62
0.72
0.82
0.92
1.02
1.12
1.22
1.32
1.42
1.52
2012 2013 2014 2015 2016 2017 2018 2019 2020
Price and EPS relative
Price Relative
EPS Relative
+12m
+24m
0.4
0.5
0.6
0.7
0.8
0.9
1.0
-70% -20% 30% 80%
Rela
tive
P
E
Relative EPS growth
Trailing PE and forecast earnings growth
0.50
0.70
0.37
0.56
0.74
0.92
1.11
1.29
1998 2001 2004 2007 2010 2013 2016
Rela
tive
P
E
Forward PE ratio (+12m, +24m, +36m)
1.95
1.56
0.78
1.19
1.60
2.01
2.43
2.84
1998 2001 2004 2007 2010 2013 2016
Rela
tive
D
Yie
ld
Forward DY ratio (+12m, +24m, +36m)
Relative
EPS
Forecast
0.76 0.80
0.44
0.57
0.70
0.83
0.96
1.09
1998 2001 2004 2007 2010 2013 2016
Rela
tive
P
B
Forward PB ratio (+12m, +24m, +36m)
0.80
0.85
0.90
0.95
1.00
1.05
1.10
1.15
1.20
1.25
Sep-14 Jan-15 May-15 Sep-15 Jan-16 May-16 Sep-16 Jan-17
EP
S(+
1)
rela
tive
re
visio
ns
EPS(+12m) revisions
EPS Revisions
Price relative
0.23
0.31
0.39
0.46
0.54
0.62
1998 2001 2004 2007 2010 2013 2016
Rela
tive
P
rice
Price
-0.13
Sep-14 Jan-15 May-15 Sep-15 Jan-16 May-16 Sep-16 Jan-17
Short-term sentiment indicator
21
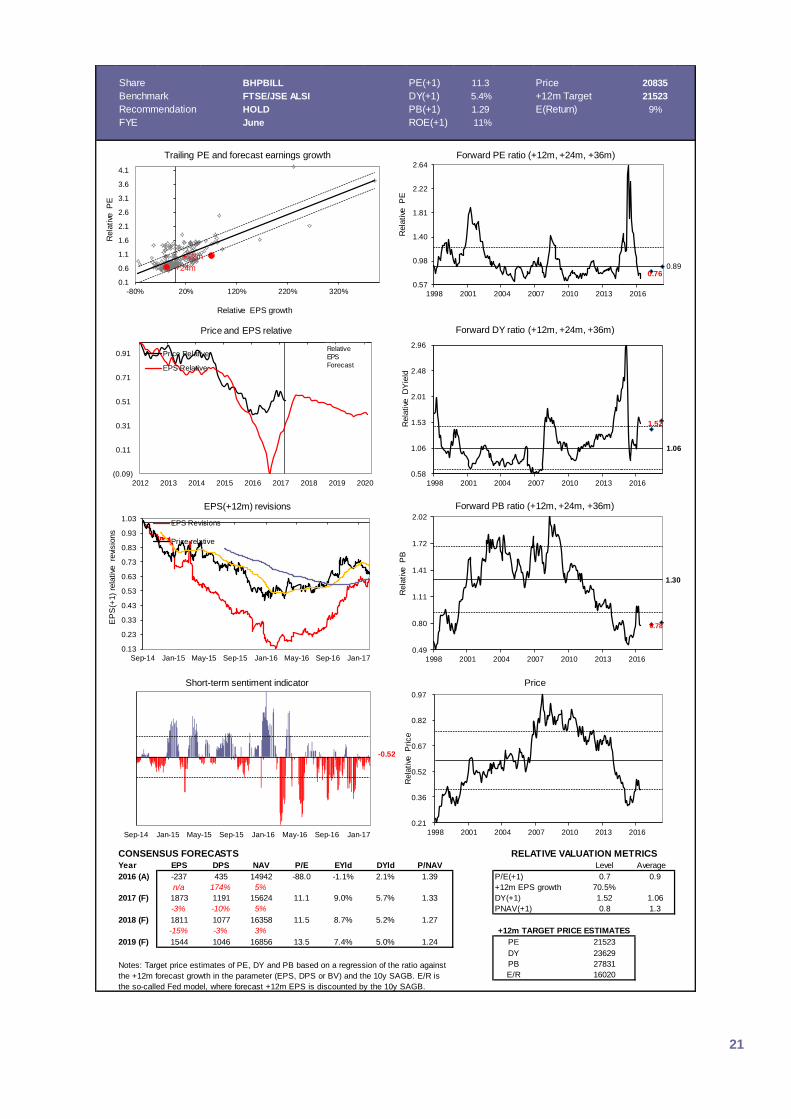
Share BHPBILL PE(+1) 11.3 Price 20835
Benchmark FTSE/JSE ALSI DY(+1) 5.4% +12m Target 21523
Recommendation HOLD PB(+1) 1.29 E(Return) 9%
FYE June ROE(+1) 11% Buy/Sell ratio 52%
CONSENSUS FORECASTS
Year EPS DPS NAV P/E EYld DYld P/NAV Level Average
2016 (A) -237 435 14942 -88.0 -1.1% 2.1% 1.39 P/E(+1) 0.7 0.9
n/a 174% 5% +12m EPS growth 70.5%
2017 (F) 1873 1191 15624 11.1 9.0% 5.7% 1.33 DY(+1) 1.52 1.06
-3% -10% 5% PNAV(+1) 0.8 1.3
2018 (F) 1811 1077 16358 11.5 8.7% 5.2% 1.27
-15% -3% 3%
2019 (F) 1544 1046 16856 13.5 7.4% 5.0% 1.24 PE 21523
DY 23629
PB 27831
E/R 16020Notes: Target price estimates of PE, DY and PB based on a regression of the ratio against
the +12m forecast growth in the parameter (EPS, DPS or BV) and the 10y SAGB. E/R is
the so-called Fed model, where forecast +12m EPS is discounted by the 10y SAGB.
+12m TARGET PRICE ESTIMATES
RELATIVE VALUATION METRICS
(0.09)
0.11
0.31
0.51
0.71
0.91
2012 2013 2014 2015 2016 2017 2018 2019 2020
Price and EPS relative
Price Relative
EPS Relative
+12m
+24m
0.1
0.6
1.1
1.6
2.1
2.6
3.1
3.6
4.1
-80% 20% 120% 220% 320%
Rela
tive
P
E
Relative EPS growth
Trailing PE and forecast earnings growth
0.760.89
0.57
0.98
1.40
1.81
2.22
2.64
1998 2001 2004 2007 2010 2013 2016
Rela
tive
P
E
Forward PE ratio (+12m, +24m, +36m)
1.52
1.06
0.58
1.06
1.53
2.01
2.48
2.96
1998 2001 2004 2007 2010 2013 2016
Rela
tive
D
Yie
ld
Forward DY ratio (+12m, +24m, +36m)
Relative
EPS
Forecast
0.78
1.30
0.49
0.80
1.11
1.41
1.72
2.02
1998 2001 2004 2007 2010 2013 2016
Rela
tive
P
B
Forward PB ratio (+12m, +24m, +36m)
0.13
0.23
0.33
0.43
0.53
0.63
0.73
0.83
0.93
1.03
Sep-14 Jan-15 May-15 Sep-15 Jan-16 May-16 Sep-16 Jan-17
EP
S(+
1)
rela
tive
re
visio
ns
EPS(+12m) revisions
EPS Revisions
Price relative
0.21
0.36
0.52
0.67
0.82
0.97
1998 2001 2004 2007 2010 2013 2016
Rela
tive
P
rice
Price
-0.52
Sep-14 Jan-15 May-15 Sep-15 Jan-16 May-16 Sep-16 Jan-17
Short-term sentiment indicator
22
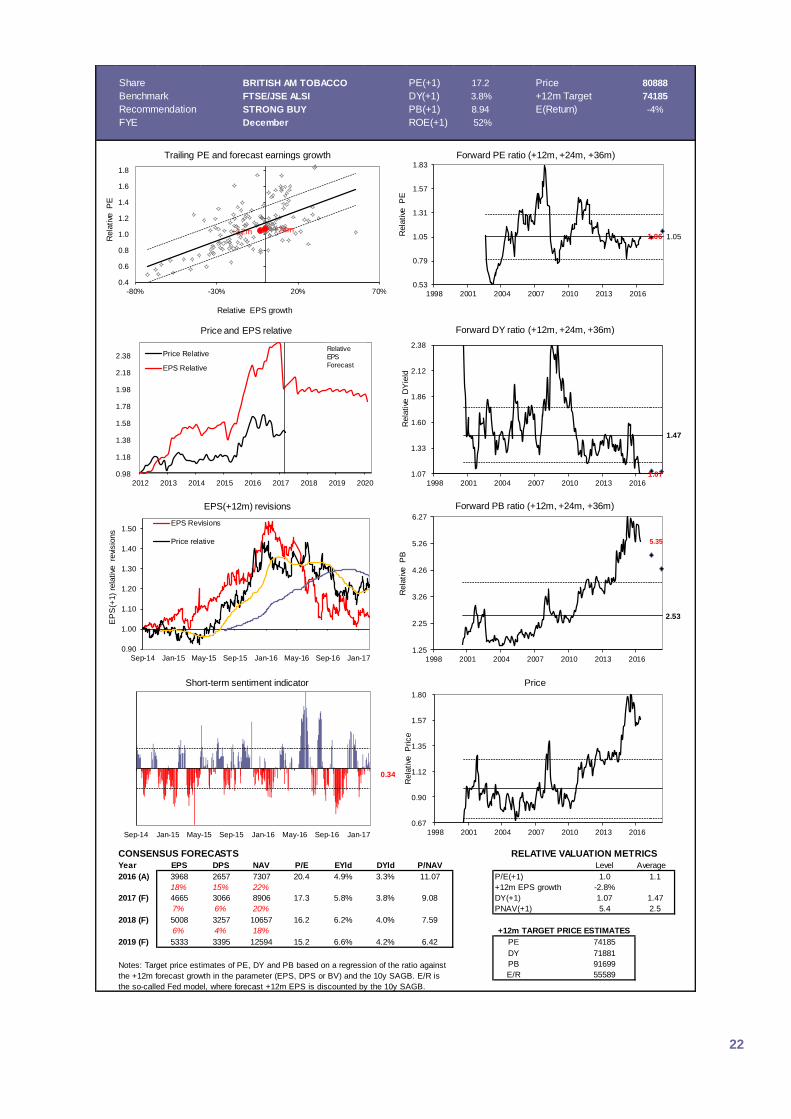
Share BRITISH AM TOBACCO PE(+1) 17.2 Price 80888
Benchmark FTSE/JSE ALSI DY(+1) 3.8% +12m Target 74185
Recommendation STRONG BUY PB(+1) 8.94 E(Return) -4%
FYE December ROE(+1) 52% Buy/Sell ratio 37%
CONSENSUS FORECASTS
Year EPS DPS NAV P/E EYld DYld P/NAV Level Average
2016 (A) 3968 2657 7307 20.4 4.9% 3.3% 11.07 P/E(+1) 1.0 1.1
18% 15% 22% +12m EPS growth -2.8%
2017 (F) 4665 3066 8906 17.3 5.8% 3.8% 9.08 DY(+1) 1.07 1.47
7% 6% 20% PNAV(+1) 5.4 2.5
2018 (F) 5008 3257 10657 16.2 6.2% 4.0% 7.59
6% 4% 18%
2019 (F) 5333 3395 12594 15.2 6.6% 4.2% 6.42 PE 74185
DY 71881
PB 91699
E/R 55589Notes: Target price estimates of PE, DY and PB based on a regression of the ratio against
the +12m forecast growth in the parameter (EPS, DPS or BV) and the 10y SAGB. E/R is
the so-called Fed model, where forecast +12m EPS is discounted by the 10y SAGB.
+12m TARGET PRICE ESTIMATES
RELATIVE VALUATION METRICS
0.98
1.18
1.38
1.58
1.78
1.98
2.18
2.38
2012 2013 2014 2015 2016 2017 2018 2019 2020
Price and EPS relative
Price Relative
EPS Relative
+12m +24m
0.4
0.6
0.8
1.0
1.2
1.4
1.6
1.8
-80% -30% 20% 70%
Rela
tive
P
E
Relative EPS growth
Trailing PE and forecast earnings growth
1.06 1.05
0.53
0.79
1.05
1.31
1.57
1.83
1998 2001 2004 2007 2010 2013 2016
Rela
tive
P
E
Forward PE ratio (+12m, +24m, +36m)
1.07
1.47
1.07
1.33
1.60
1.86
2.12
2.38
1998 2001 2004 2007 2010 2013 2016
Rela
tive
D
Yie
ld
Forward DY ratio (+12m, +24m, +36m)
Relative
EPS
Forecast
5.35
2.53
1.25
2.25
3.26
4.26
5.26
6.27
1998 2001 2004 2007 2010 2013 2016
Rela
tive
P
B
Forward PB ratio (+12m, +24m, +36m)
0.90
1.00
1.10
1.20
1.30
1.40
1.50
Sep-14 Jan-15 May-15 Sep-15 Jan-16 May-16 Sep-16 Jan-17
EP
S(+
1)
rela
tive
re
visio
ns
EPS(+12m) revisions
EPS Revisions
Price relative
0.67
0.90
1.12
1.35
1.57
1.80
1998 2001 2004 2007 2010 2013 2016
Rela
tive
P
rice
Price
0.34
Sep-14 Jan-15 May-15 Sep-15 Jan-16 May-16 Sep-16 Jan-17
Short-term sentiment indicator
23
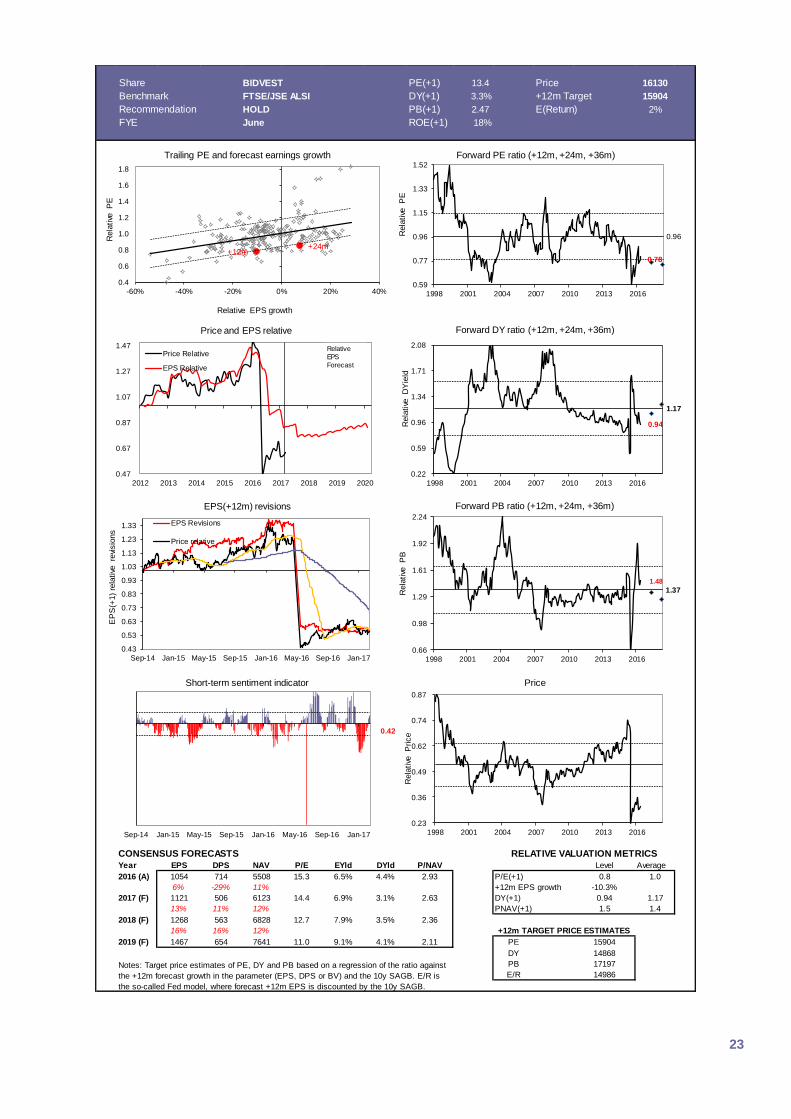
Share BIDVEST PE(+1) 13.4 Price 16130
Benchmark FTSE/JSE ALSI DY(+1) 3.3% +12m Target 15904
Recommendation HOLD PB(+1) 2.47 E(Return) 2%
FYE June ROE(+1) 18% Buy/Sell ratio 50%
CONSENSUS FORECASTS
Year EPS DPS NAV P/E EYld DYld P/NAV Level Average
2016 (A) 1054 714 5508 15.3 6.5% 4.4% 2.93 P/E(+1) 0.8 1.0
6% -29% 11% +12m EPS growth -10.3%
2017 (F) 1121 506 6123 14.4 6.9% 3.1% 2.63 DY(+1) 0.94 1.17
13% 11% 12% PNAV(+1) 1.5 1.4
2018 (F) 1268 563 6828 12.7 7.9% 3.5% 2.36
16% 16% 12%
2019 (F) 1467 654 7641 11.0 9.1% 4.1% 2.11 PE 15904
DY 14868
PB 17197
E/R 14986Notes: Target price estimates of PE, DY and PB based on a regression of the ratio against
the +12m forecast growth in the parameter (EPS, DPS or BV) and the 10y SAGB. E/R is
the so-called Fed model, where forecast +12m EPS is discounted by the 10y SAGB.
+12m TARGET PRICE ESTIMATES
RELATIVE VALUATION METRICS
0.47
0.67
0.87
1.07
1.27
1.47
2012 2013 2014 2015 2016 2017 2018 2019 2020
Price and EPS relative
Price Relative
EPS Relative
+12m+24m
0.4
0.6
0.8
1.0
1.2
1.4
1.6
1.8
-60% -40% -20% 0% 20% 40%
Rela
tive
P
E
Relative EPS growth
Trailing PE and forecast earnings growth
0.78
0.96
0.59
0.77
0.96
1.15
1.33
1.52
1998 2001 2004 2007 2010 2013 2016
Rela
tive
P
E
Forward PE ratio (+12m, +24m, +36m)
0.94
1.17
0.22
0.59
0.96
1.34
1.71
2.08
1998 2001 2004 2007 2010 2013 2016
Rela
tive
D
Yie
ld
Forward DY ratio (+12m, +24m, +36m)
Relative
EPS
Forecast
1.48
1.37
0.66
0.98
1.29
1.61
1.92
2.24
1998 2001 2004 2007 2010 2013 2016
Rela
tive
P
B
Forward PB ratio (+12m, +24m, +36m)
0.43
0.53
0.63
0.73
0.83
0.93
1.03
1.13
1.23
1.33
Sep-14 Jan-15 May-15 Sep-15 Jan-16 May-16 Sep-16 Jan-17
EP
S(+
1)
rela
tive
re
visio
ns
EPS(+12m) revisions
EPS Revisions
Price relative
0.23
0.36
0.49
0.62
0.74
0.87
1998 2001 2004 2007 2010 2013 2016
Rela
tive
P
rice
Price
0.42
Sep-14 Jan-15 May-15 Sep-15 Jan-16 May-16 Sep-16 Jan-17
Short-term sentiment indicator
24
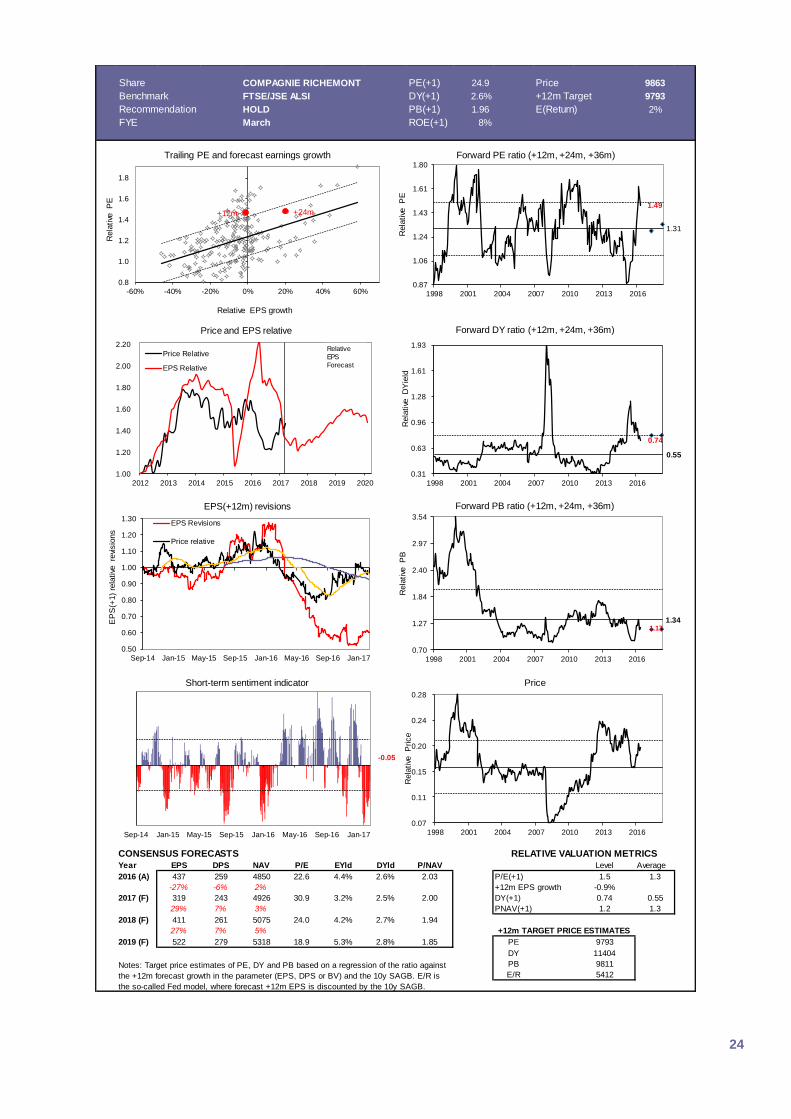
Share COMPAGNIE RICHEMONT PE(+1) 24.9 Price 9863
Benchmark FTSE/JSE ALSI DY(+1) 2.6% +12m Target 9793
Recommendation HOLD PB(+1) 1.96 E(Return) 2%
FYE March ROE(+1) 8% Buy/Sell ratio 48%
CONSENSUS FORECASTS
Year EPS DPS NAV P/E EYld DYld P/NAV Level Average
2016 (A) 437 259 4850 22.6 4.4% 2.6% 2.03 P/E(+1) 1.5 1.3
-27% -6% 2% +12m EPS growth -0.9%
2017 (F) 319 243 4926 30.9 3.2% 2.5% 2.00 DY(+1) 0.74 0.55
29% 7% 3% PNAV(+1) 1.2 1.3
2018 (F) 411 261 5075 24.0 4.2% 2.7% 1.94
27% 7% 5%
2019 (F) 522 279 5318 18.9 5.3% 2.8% 1.85 PE 9793
DY 11404
PB 9811
E/R 5412Notes: Target price estimates of PE, DY and PB based on a regression of the ratio against
the +12m forecast growth in the parameter (EPS, DPS or BV) and the 10y SAGB. E/R is
the so-called Fed model, where forecast +12m EPS is discounted by the 10y SAGB.
+12m TARGET PRICE ESTIMATES
RELATIVE VALUATION METRICS
1.00
1.20
1.40
1.60
1.80
2.00
2.20
2012 2013 2014 2015 2016 2017 2018 2019 2020
Price and EPS relative
Price Relative
EPS Relative
+12m +24m
0.8
1.0
1.2
1.4
1.6
1.8
-60% -40% -20% 0% 20% 40% 60%
Rela
tive
P
E
Relative EPS growth
Trailing PE and forecast earnings growth
1.49
1.31
0.87
1.06
1.24
1.43
1.61
1.80
1998 2001 2004 2007 2010 2013 2016
Rela
tive
P
E
Forward PE ratio (+12m, +24m, +36m)
0.74
0.55
0.31
0.63
0.96
1.28
1.61
1.93
1998 2001 2004 2007 2010 2013 2016
Rela
tive
D
Yie
ld
Forward DY ratio (+12m, +24m, +36m)
Relative
EPS
Forecast
1.17 1.34
0.70
1.27
1.84
2.40
2.97
3.54
1998 2001 2004 2007 2010 2013 2016
Rela
tive
P
B
Forward PB ratio (+12m, +24m, +36m)
0.50
0.60
0.70
0.80
0.90
1.00
1.10
1.20
1.30
Sep-14 Jan-15 May-15 Sep-15 Jan-16 May-16 Sep-16 Jan-17
EP
S(+
1)
rela
tive
re
visio
ns
EPS(+12m) revisions
EPS Revisions
Price relative
0.07
0.11
0.15
0.20
0.24
0.28
1998 2001 2004 2007 2010 2013 2016
Rela
tive
P
rice
Price
-0.05
Sep-14 Jan-15 May-15 Sep-15 Jan-16 May-16 Sep-16 Jan-17
Short-term sentiment indicator
25
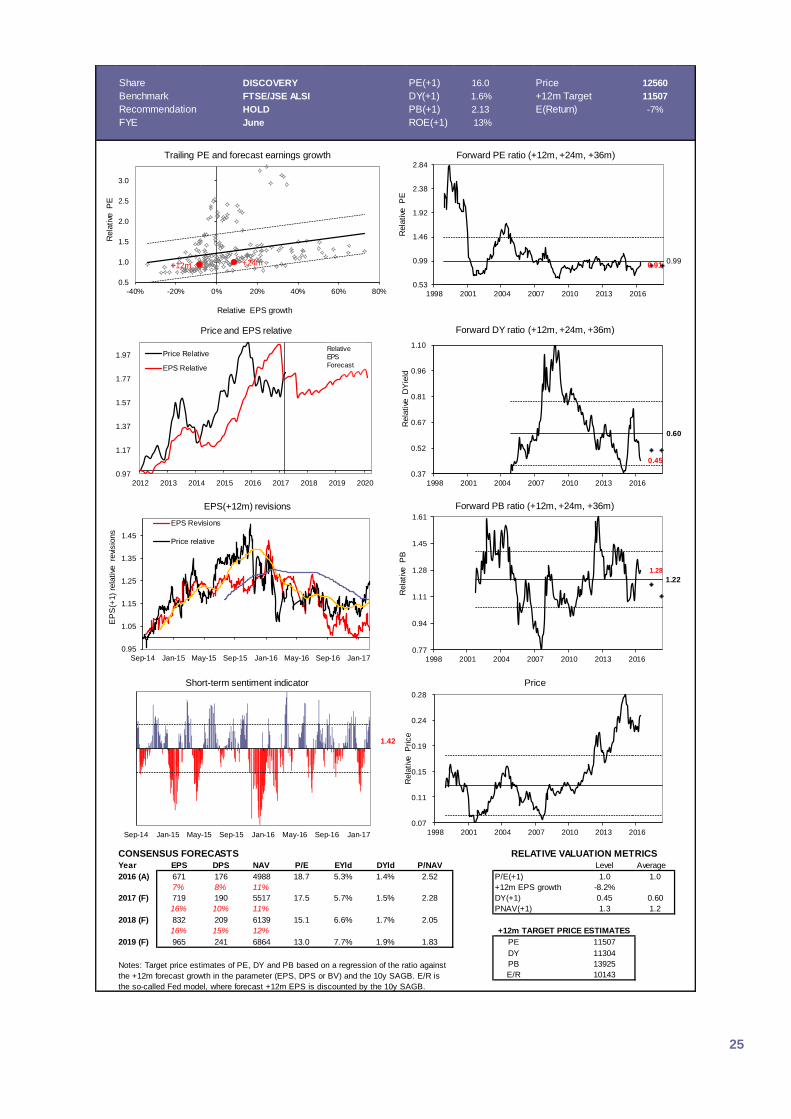
Share DISCOVERY PE(+1) 16.0 Price 12560
Benchmark FTSE/JSE ALSI DY(+1) 1.6% +12m Target 11507
Recommendation HOLD PB(+1) 2.13 E(Return) -7%
FYE June ROE(+1) 13% Buy/Sell ratio 40%
CONSENSUS FORECASTS
Year EPS DPS NAV P/E EYld DYld P/NAV Level Average
2016 (A) 671 176 4988 18.7 5.3% 1.4% 2.52 P/E(+1) 1.0 1.0
7% 8% 11% +12m EPS growth -8.2%
2017 (F) 719 190 5517 17.5 5.7% 1.5% 2.28 DY(+1) 0.45 0.60
16% 10% 11% PNAV(+1) 1.3 1.2
2018 (F) 832 209 6139 15.1 6.6% 1.7% 2.05
16% 15% 12%
2019 (F) 965 241 6864 13.0 7.7% 1.9% 1.83 PE 11507
DY 11304
PB 13925
E/R 10143Notes: Target price estimates of PE, DY and PB based on a regression of the ratio against
the +12m forecast growth in the parameter (EPS, DPS or BV) and the 10y SAGB. E/R is
the so-called Fed model, where forecast +12m EPS is discounted by the 10y SAGB.
+12m TARGET PRICE ESTIMATES
RELATIVE VALUATION METRICS
0.97
1.17
1.37
1.57
1.77
1.97
2012 2013 2014 2015 2016 2017 2018 2019 2020
Price and EPS relative
Price Relative
EPS Relative
+12m +24m
0.5
1.0
1.5
2.0
2.5
3.0
-40% -20% 0% 20% 40% 60% 80%
Rela
tive
P
E
Relative EPS growth
Trailing PE and forecast earnings growth
0.910.99
0.53
0.99
1.46
1.92
2.38
2.84
1998 2001 2004 2007 2010 2013 2016
Rela
tive
P
E
Forward PE ratio (+12m, +24m, +36m)
0.45
0.60
0.37
0.52
0.67
0.81
0.96
1.10
1998 2001 2004 2007 2010 2013 2016
Rela
tive
D
Yie
ld
Forward DY ratio (+12m, +24m, +36m)
Relative
EPS
Forecast
1.28
1.22
0.77
0.94
1.11
1.28
1.45
1.61
1998 2001 2004 2007 2010 2013 2016
Rela
tive
P
B
Forward PB ratio (+12m, +24m, +36m)
0.95
1.05
1.15
1.25
1.35
1.45
Sep-14 Jan-15 May-15 Sep-15 Jan-16 May-16 Sep-16 Jan-17
EP
S(+
1)
rela
tive
re
visio
ns
EPS(+12m) revisions
EPS Revisions
Price relative
0.07
0.11
0.15
0.19
0.24
0.28
1998 2001 2004 2007 2010 2013 2016
Rela
tive
P
rice
Price
1.42
Sep-14 Jan-15 May-15 Sep-15 Jan-16 May-16 Sep-16 Jan-17
Short-term sentiment indicator

26
Share FIRSTRAND PE(+1) 11.3 Price 5124
Benchmark FTSE/JSE ALSI DY(+1) 4.9% +12m Target 5475
Recommendation HOLD PB(+1) 2.45 E(Return) 12%
FYE June ROE(+1) 22% Buy/Sell ratio 64%
CONSENSUS FORECASTS
Year EPS DPS NAV P/E EYld DYld P/NAV Level Average
2016 (A) 399 226 1778 12.8 7.8% 4.4% 2.88 P/E(+1) 0.7 0.8
9% 6% 11% +12m EPS growth -11.2%
2017 (F) 434 240 1973 11.8 8.5% 4.7% 2.60 DY(+1) 1.38 1.41
8% 8% 11% PNAV(+1) 1.5 1.1
2018 (F) 467 259 2181 11.0 9.1% 5.1% 2.35
10% 12% 10%
2019 (F) 514 290 2405 10.0 10.0% 5.7% 2.13 PE 5475
DY 5317
PB 5701
E/R 5375Notes: Target price estimates of PE, DY and PB based on a regression of the ratio against
the +12m forecast growth in the parameter (EPS, DPS or BV) and the 10y SAGB. E/R is
the so-called Fed model, where forecast +12m EPS is discounted by the 10y SAGB.
+12m TARGET PRICE ESTIMATES
RELATIVE VALUATION METRICS
0.99
1.19
1.39
1.59
1.79
1.99
2.19
2012 2013 2014 2015 2016 2017 2018 2019 2020
Price and EPS relative
Price Relative
EPS Relative
+12m+24m
0.4
0.6
0.8
1.0
1.2
1.4
1.6
-60% -40% -20% 0% 20% 40% 60%
Rela
tive
P
E
Relative EPS growth
Trailing PE and forecast earnings growth
0.67
0.83
0.47
0.64
0.82
0.99
1.16
1.34
1998 2001 2004 2007 2010 2013 2016
Rela
tive
P
E
Forward PE ratio (+12m, +24m, +36m)
1.38 1.41
0.74
1.08
1.42
1.77
2.11
2.45
1998 2001 2004 2007 2010 2013 2016
Rela
tive
D
Yie
ld
Forward DY ratio (+12m, +24m, +36m)
Relative
EPS
Forecast
1.47
1.12
0.67
0.89
1.10
1.32
1.54
1.76
1998 2001 2004 2007 2010 2013 2016
Rela
tive
P
B
Forward PB ratio (+12m, +24m, +36m)
0.85
0.95
1.05
1.15
1.25
1.35
Sep-14 Jan-15 May-15 Sep-15 Jan-16 May-16 Sep-16 Jan-17
EP
S(+
1)
rela
tive
re
visio
ns
EPS(+12m) revisions
EPS Revisions
Price relative
0.04
0.06
0.08
0.10
0.12
0.13
1998 2001 2004 2007 2010 2013 2016
Rela
tive
P
rice
Price
0.48
Sep-14 Jan-15 May-15 Sep-15 Jan-16 May-16 Sep-16 Jan-17
Short-term sentiment indicator
27
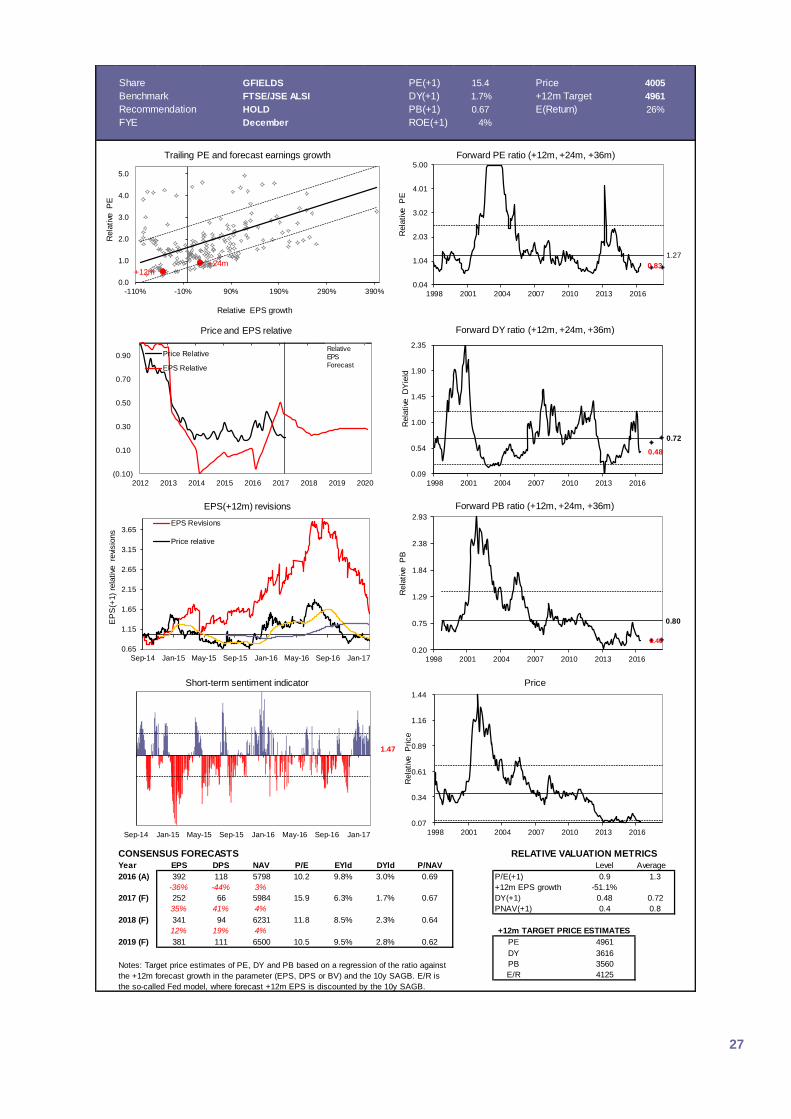
Share GFIELDS PE(+1) 15.4 Price 4005
Benchmark FTSE/JSE ALSI DY(+1) 1.7% +12m Target 4961
Recommendation HOLD PB(+1) 0.67 E(Return) 26%
FYE December ROE(+1) 4% Buy/Sell ratio 57%
CONSENSUS FORECASTS
Year EPS DPS NAV P/E EYld DYld P/NAV Level Average
2016 (A) 392 118 5798 10.2 9.8% 3.0% 0.69 P/E(+1) 0.9 1.3
-36% -44% 3% +12m EPS growth -51.1%
2017 (F) 252 66 5984 15.9 6.3% 1.7% 0.67 DY(+1) 0.48 0.72
35% 41% 4% PNAV(+1) 0.4 0.8
2018 (F) 341 94 6231 11.8 8.5% 2.3% 0.64
12% 19% 4%
2019 (F) 381 111 6500 10.5 9.5% 2.8% 0.62 PE 4961
DY 3616
PB 3560
E/R 4125Notes: Target price estimates of PE, DY and PB based on a regression of the ratio against
the +12m forecast growth in the parameter (EPS, DPS or BV) and the 10y SAGB. E/R is
the so-called Fed model, where forecast +12m EPS is discounted by the 10y SAGB.
+12m TARGET PRICE ESTIMATES
RELATIVE VALUATION METRICS
(0.10)
0.10
0.30
0.50
0.70
0.90
2012 2013 2014 2015 2016 2017 2018 2019 2020
Price and EPS relative
Price Relative
EPS Relative
+12m+24m
0.0
1.0
2.0
3.0
4.0
5.0
-110% -10% 90% 190% 290% 390%
Rela
tive
P
E
Relative EPS growth
Trailing PE and forecast earnings growth
0.83
1.27
0.04
1.04
2.03
3.02
4.01
5.00
1998 2001 2004 2007 2010 2013 2016
Rela
tive
P
E
Forward PE ratio (+12m, +24m, +36m)
0.48
0.72
0.09
0.54
1.00
1.45
1.90
2.35
1998 2001 2004 2007 2010 2013 2016
Rela
tive
D
Yie
ld
Forward DY ratio (+12m, +24m, +36m)
Relative
EPS
Forecast
0.40
0.80
0.20
0.75
1.29
1.84
2.38
2.93
1998 2001 2004 2007 2010 2013 2016
Rela
tive
P
B
Forward PB ratio (+12m, +24m, +36m)
0.65
1.15
1.65
2.15
2.65
3.15
3.65
Sep-14 Jan-15 May-15 Sep-15 Jan-16 May-16 Sep-16 Jan-17
EP
S(+
1)
rela
tive
re
visio
ns
EPS(+12m) revisions
EPS Revisions
Price relative
0.07
0.34
0.61
0.89
1.16
1.44
1998 2001 2004 2007 2010 2013 2016
Rela
tive
P
rice
Price
1.47
Sep-14 Jan-15 May-15 Sep-15 Jan-16 May-16 Sep-16 Jan-17
Short-term sentiment indicator
28
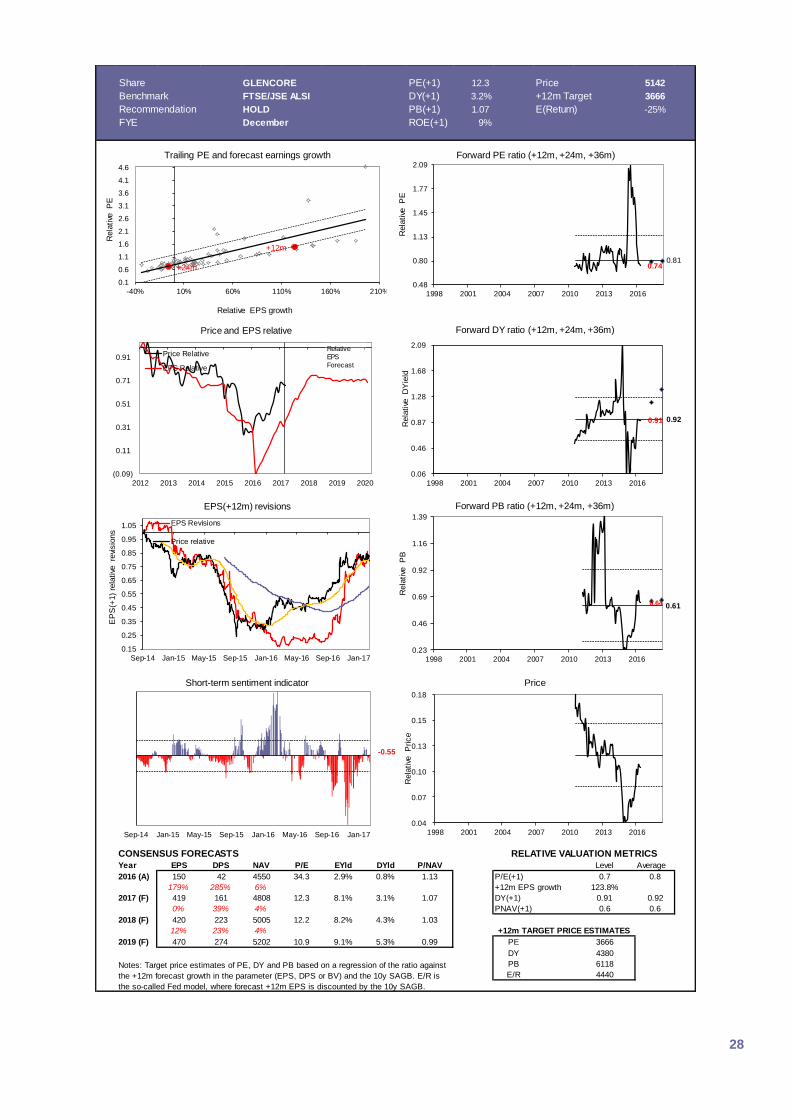
Share GLENCORE PE(+1) 12.3 Price 5142
Benchmark FTSE/JSE ALSI DY(+1) 3.2% +12m Target 3666
Recommendation HOLD PB(+1) 1.07 E(Return) -25%
FYE December ROE(+1) 9% Buy/Sell ratio 58%
CONSENSUS FORECASTS
Year EPS DPS NAV P/E EYld DYld P/NAV Level Average
2016 (A) 150 42 4550 34.3 2.9% 0.8% 1.13 P/E(+1) 0.7 0.8
179% 285% 6% +12m EPS growth 123.8%
2017 (F) 419 161 4808 12.3 8.1% 3.1% 1.07 DY(+1) 0.91 0.92
0% 39% 4% PNAV(+1) 0.6 0.6
2018 (F) 420 223 5005 12.2 8.2% 4.3% 1.03
12% 23% 4%
2019 (F) 470 274 5202 10.9 9.1% 5.3% 0.99 PE 3666
DY 4380
PB 6118
E/R 4440Notes: Target price estimates of PE, DY and PB based on a regression of the ratio against
the +12m forecast growth in the parameter (EPS, DPS or BV) and the 10y SAGB. E/R is
the so-called Fed model, where forecast +12m EPS is discounted by the 10y SAGB.
+12m TARGET PRICE ESTIMATES
RELATIVE VALUATION METRICS
(0.09)
0.11
0.31
0.51
0.71
0.91
2012 2013 2014 2015 2016 2017 2018 2019 2020
Price and EPS relative
Price Relative
EPS Relative
+12m
+24m
0.1
0.6
1.1
1.6
2.1
2.6
3.1
3.6
4.1
4.6
-40% 10% 60% 110% 160% 210%
Rela
tive
P
E
Relative EPS growth
Trailing PE and forecast earnings growth
0.740.81
0.48
0.80
1.13
1.45
1.77
2.09
1998 2001 2004 2007 2010 2013 2016
Rela
tive
P
E
Forward PE ratio (+12m, +24m, +36m)
0.91 0.92
0.06
0.46
0.87
1.28
1.68
2.09
1998 2001 2004 2007 2010 2013 2016
Rela
tive
D
Yie
ld
Forward DY ratio (+12m, +24m, +36m)
Relative
EPS
Forecast
0.64 0.61
0.23
0.46
0.69
0.92
1.16
1.39
1998 2001 2004 2007 2010 2013 2016
Rela
tive
P
B
Forward PB ratio (+12m, +24m, +36m)
0.15
0.25
0.35
0.45
0.55
0.65
0.75
0.85
0.95
1.05
Sep-14 Jan-15 May-15 Sep-15 Jan-16 May-16 Sep-16 Jan-17
EP
S(+
1)
rela
tive
re
visio
ns
EPS(+12m) revisions
EPS Revisions
Price relative
0.04
0.07
0.10
0.13
0.15
0.18
1998 2001 2004 2007 2010 2013 2016
Rela
tive
P
rice
Price
-0.55
Sep-14 Jan-15 May-15 Sep-15 Jan-16 May-16 Sep-16 Jan-17
Short-term sentiment indicator
29
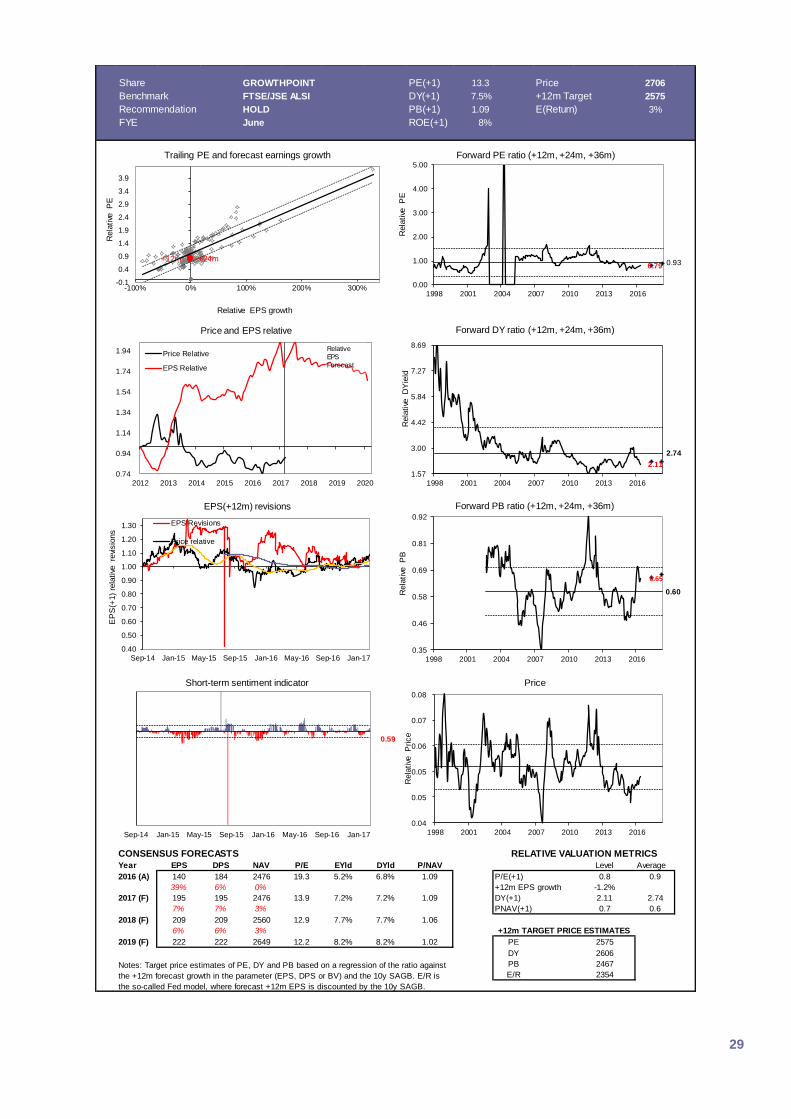
Share GROWTHPOINT PE(+1) 13.3 Price 2706
Benchmark FTSE/JSE ALSI DY(+1) 7.5% +12m Target 2575
Recommendation HOLD PB(+1) 1.09 E(Return) 3%
FYE June ROE(+1) 8% Buy/Sell ratio 80%
CONSENSUS FORECASTS
Year EPS DPS NAV P/E EYld DYld P/NAV Level Average
2016 (A) 140 184 2476 19.3 5.2% 6.8% 1.09 P/E(+1) 0.8 0.9
39% 6% 0% +12m EPS growth -1.2%
2017 (F) 195 195 2476 13.9 7.2% 7.2% 1.09 DY(+1) 2.11 2.74
7% 7% 3% PNAV(+1) 0.7 0.6
2018 (F) 209 209 2560 12.9 7.7% 7.7% 1.06
6% 6% 3%
2019 (F) 222 222 2649 12.2 8.2% 8.2% 1.02 PE 2575
DY 2606
PB 2467
E/R 2354Notes: Target price estimates of PE, DY and PB based on a regression of the ratio against
the +12m forecast growth in the parameter (EPS, DPS or BV) and the 10y SAGB. E/R is
the so-called Fed model, where forecast +12m EPS is discounted by the 10y SAGB.
+12m TARGET PRICE ESTIMATES
RELATIVE VALUATION METRICS
0.74
0.94
1.14
1.34
1.54
1.74
1.94
2012 2013 2014 2015 2016 2017 2018 2019 2020
Price and EPS relative
Price Relative
EPS Relative
+12m +24m
-0.1
0.4
0.9
1.4
1.9
2.4
2.9
3.4
3.9
-100% 0% 100% 200% 300%
Rela
tive
P
E
Relative EPS growth
Trailing PE and forecast earnings growth
0.79 0.93
0.00
1.00
2.00
3.00
4.00
5.00
1998 2001 2004 2007 2010 2013 2016
Rela
tive
P
E
Forward PE ratio (+12m, +24m, +36m)
2.11
2.74
1.57
3.00
4.42
5.84
7.27
8.69
1998 2001 2004 2007 2010 2013 2016
Rela
tive
D
Yie
ld
Forward DY ratio (+12m, +24m, +36m)
Relative
EPS
Forecast
0.65
0.60
0.35
0.46
0.58
0.69
0.81
0.92
1998 2001 2004 2007 2010 2013 2016
Rela
tive
P
B
Forward PB ratio (+12m, +24m, +36m)
0.40
0.50
0.60
0.70
0.80
0.90
1.00
1.10
1.20
1.30
Sep-14 Jan-15 May-15 Sep-15 Jan-16 May-16 Sep-16 Jan-17
EP
S(+
1)
rela
tive
re
visio
ns
EPS(+12m) revisions
EPS Revisions
Price relative
0.04
0.05
0.05
0.06
0.07
0.08
1998 2001 2004 2007 2010 2013 2016
Rela
tive
P
rice
Price
0.59
Sep-14 Jan-15 May-15 Sep-15 Jan-16 May-16 Sep-16 Jan-17
Short-term sentiment indicator
30
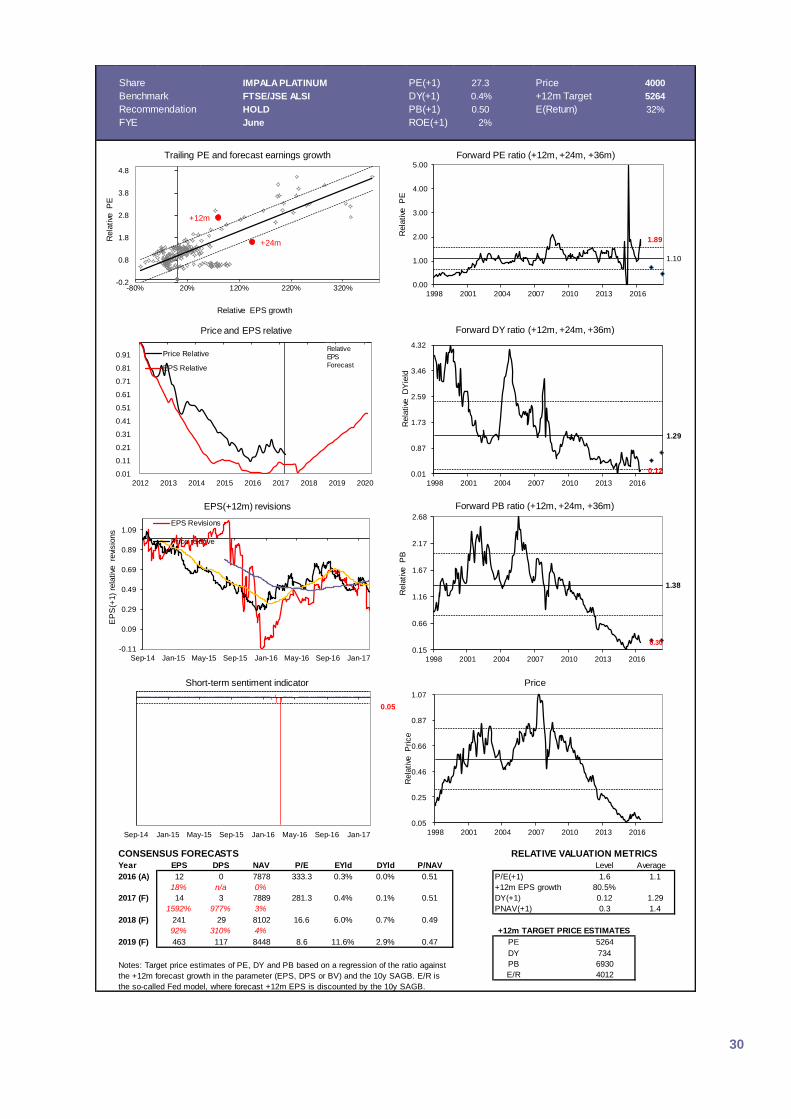
Share IMPALA PLATINUM PE(+1) 27.3 Price 4000
Benchmark FTSE/JSE ALSI DY(+1) 0.4% +12m Target 5264
Recommendation HOLD PB(+1) 0.50 E(Return) 32%
FYE June ROE(+1) 2% Buy/Sell ratio 46%
CONSENSUS FORECASTS
Year EPS DPS NAV P/E EYld DYld P/NAV Level Average
2016 (A) 12 0 7878 333.3 0.3% 0.0% 0.51 P/E(+1) 1.6 1.1
18% n/a 0% +12m EPS growth 80.5%
2017 (F) 14 3 7889 281.3 0.4% 0.1% 0.51 DY(+1) 0.12 1.29
1592% 977% 3% PNAV(+1) 0.3 1.4
2018 (F) 241 29 8102 16.6 6.0% 0.7% 0.49
92% 310% 4%
2019 (F) 463 117 8448 8.6 11.6% 2.9% 0.47 PE 5264
DY 734
PB 6930
E/R 4012Notes: Target price estimates of PE, DY and PB based on a regression of the ratio against
the +12m forecast growth in the parameter (EPS, DPS or BV) and the 10y SAGB. E/R is
the so-called Fed model, where forecast +12m EPS is discounted by the 10y SAGB.
+12m TARGET PRICE ESTIMATES
RELATIVE VALUATION METRICS
0.01
0.11
0.21
0.31
0.41
0.51
0.61
0.71
0.81
0.91
2012 2013 2014 2015 2016 2017 2018 2019 2020
Price and EPS relative
Price Relative
EPS Relative
+12m
+24m
-0.2
0.8
1.8
2.8
3.8
4.8
-80% 20% 120% 220% 320%
Rela
tive
P
E
Relative EPS growth
Trailing PE and forecast earnings growth
1.89
1.10
0.00
1.00
2.00
3.00
4.00
5.00
1998 2001 2004 2007 2010 2013 2016
Rela
tive
P
E
Forward PE ratio (+12m, +24m, +36m)
0.12
1.29
0.01
0.87
1.73
2.59
3.46
4.32
1998 2001 2004 2007 2010 2013 2016
Rela
tive
D
Yie
ld
Forward DY ratio (+12m, +24m, +36m)
Relative
EPS
Forecast
0.30
1.38
0.15
0.66
1.16
1.67
2.17
2.68
1998 2001 2004 2007 2010 2013 2016
Rela
tive
P
B
Forward PB ratio (+12m, +24m, +36m)
-0.11
0.09
0.29
0.49
0.69
0.89
1.09
Sep-14 Jan-15 May-15 Sep-15 Jan-16 May-16 Sep-16 Jan-17
EP
S(+
1)
rela
tive
re
visio
ns
EPS(+12m) revisions
EPS Revisions
Price relative
0.05
0.25
0.46
0.66
0.87
1.07
1998 2001 2004 2007 2010 2013 2016
Rela
tive
P
rice
Price
0.05
Sep-14 Jan-15 May-15 Sep-15 Jan-16 May-16 Sep-16 Jan-17
Short-term sentiment indicator
31
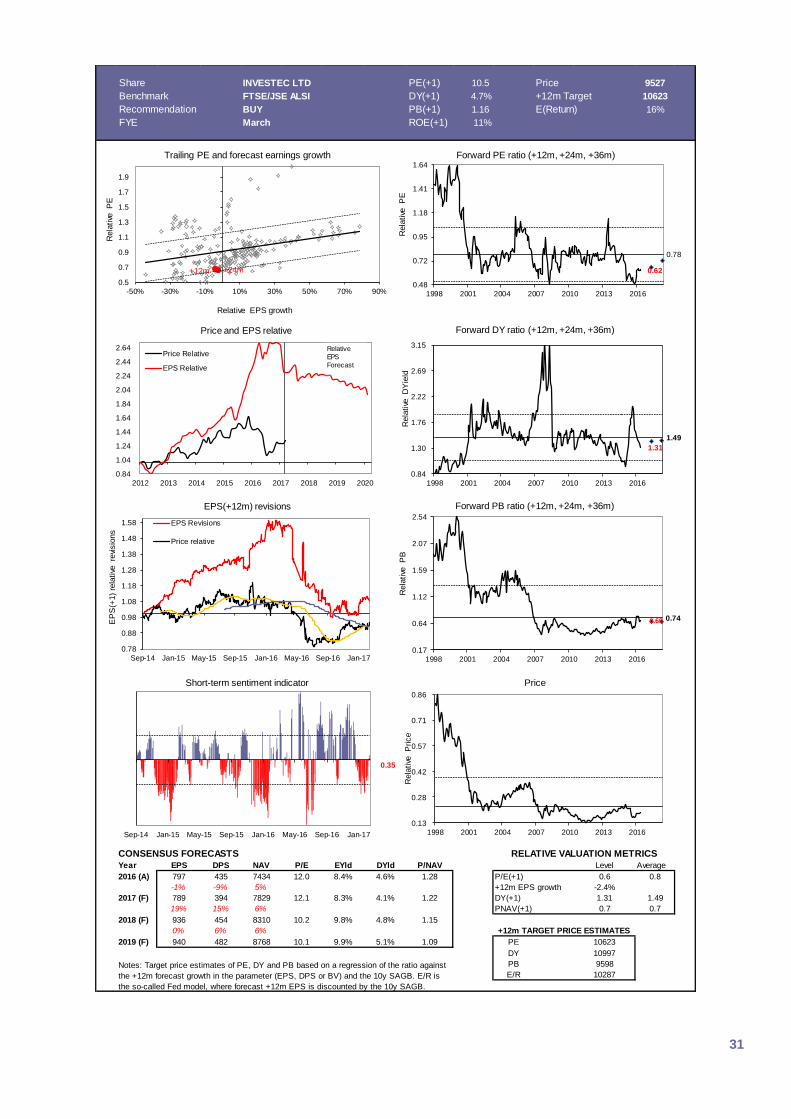
Share INVESTEC LTD PE(+1) 10.5 Price 9527
Benchmark FTSE/JSE ALSI DY(+1) 4.7% +12m Target 10623
Recommendation BUY PB(+1) 1.16 E(Return) 16%
FYE March ROE(+1) 11% Buy/Sell ratio 67%
CONSENSUS FORECASTS
Year EPS DPS NAV P/E EYld DYld P/NAV Level Average
2016 (A) 797 435 7434 12.0 8.4% 4.6% 1.28 P/E(+1) 0.6 0.8
-1% -9% 5% +12m EPS growth -2.4%
2017 (F) 789 394 7829 12.1 8.3% 4.1% 1.22 DY(+1) 1.31 1.49
19% 15% 6% PNAV(+1) 0.7 0.7
2018 (F) 936 454 8310 10.2 9.8% 4.8% 1.15
0% 6% 6%
2019 (F) 940 482 8768 10.1 9.9% 5.1% 1.09 PE 10623
DY 10997
PB 9598
E/R 10287Notes: Target price estimates of PE, DY and PB based on a regression of the ratio against
the +12m forecast growth in the parameter (EPS, DPS or BV) and the 10y SAGB. E/R is
the so-called Fed model, where forecast +12m EPS is discounted by the 10y SAGB.
+12m TARGET PRICE ESTIMATES
RELATIVE VALUATION METRICS
0.84
1.04
1.24
1.44
1.64
1.84
2.04
2.24
2.44
2.64
2012 2013 2014 2015 2016 2017 2018 2019 2020
Price and EPS relative
Price Relative
EPS Relative
+12m +24m
0.5
0.7
0.9
1.1
1.3
1.5
1.7
1.9
-50% -30% -10% 10% 30% 50% 70% 90%
Rela
tive
P
E
Relative EPS growth
Trailing PE and forecast earnings growth
0.62
0.78
0.48
0.72
0.95
1.18
1.41
1.64
1998 2001 2004 2007 2010 2013 2016
Rela
tive
P
E
Forward PE ratio (+12m, +24m, +36m)
1.31
1.49
0.84
1.30
1.76
2.22
2.69
3.15
1998 2001 2004 2007 2010 2013 2016
Rela
tive
D
Yie
ld
Forward DY ratio (+12m, +24m, +36m)
Relative
EPS
Forecast
0.69 0.74
0.17
0.64
1.12
1.59
2.07
2.54
1998 2001 2004 2007 2010 2013 2016
Rela
tive
P
B
Forward PB ratio (+12m, +24m, +36m)
0.78
0.88
0.98
1.08
1.18
1.28
1.38
1.48
1.58
Sep-14 Jan-15 May-15 Sep-15 Jan-16 May-16 Sep-16 Jan-17
EP
S(+
1)
rela
tive
re
visio
ns
EPS(+12m) revisions
EPS Revisions
Price relative
0.13
0.28
0.42
0.57
0.71
0.86
1998 2001 2004 2007 2010 2013 2016
Rela
tive
P
rice
Price
0.35
Sep-14 Jan-15 May-15 Sep-15 Jan-16 May-16 Sep-16 Jan-17
Short-term sentiment indicator
32
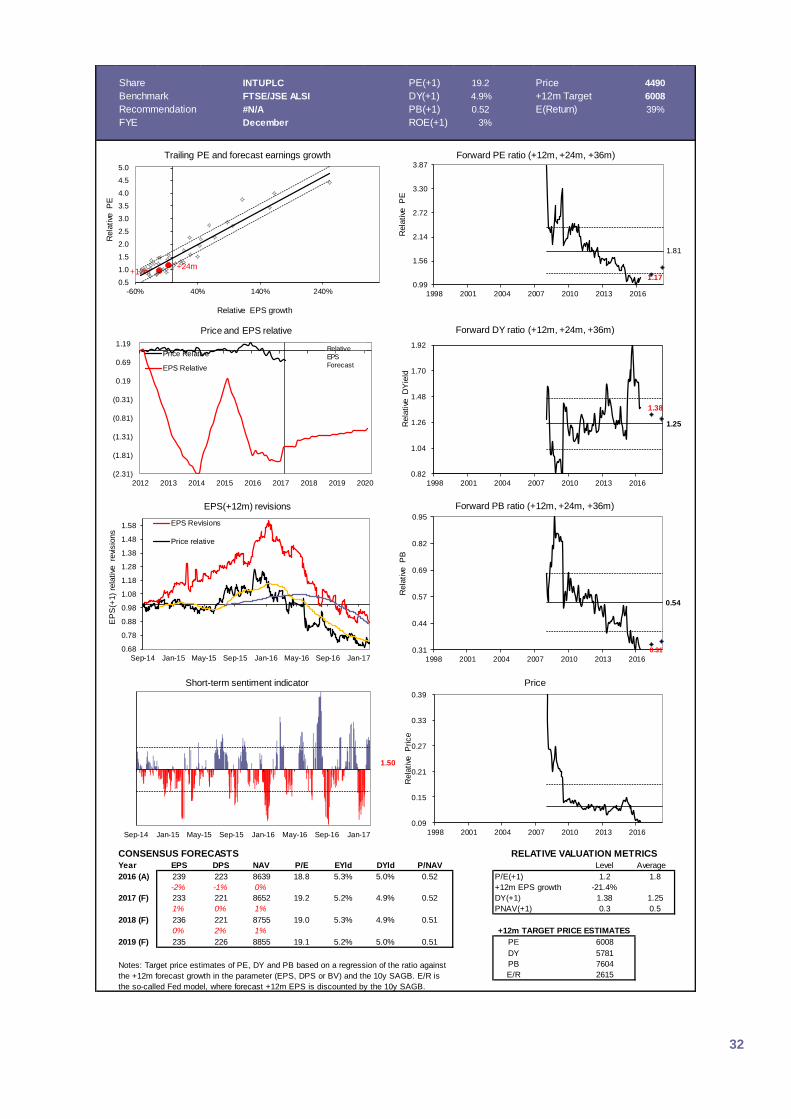
Share INTUPLC PE(+1) 19.2 Price 4490
Benchmark FTSE/JSE ALSI DY(+1) 4.9% +12m Target 6008
Recommendation #N/A PB(+1) 0.52 E(Return) 39%
FYE December ROE(+1) 3% Buy/Sell ratio n/a
CONSENSUS FORECASTS
Year EPS DPS NAV P/E EYld DYld P/NAV Level Average
2016 (A) 239 223 8639 18.8 5.3% 5.0% 0.52 P/E(+1) 1.2 1.8
-2% -1% 0% +12m EPS growth -21.4%
2017 (F) 233 221 8652 19.2 5.2% 4.9% 0.52 DY(+1) 1.38 1.25
1% 0% 1% PNAV(+1) 0.3 0.5
2018 (F) 236 221 8755 19.0 5.3% 4.9% 0.51
0% 2% 1%
2019 (F) 235 226 8855 19.1 5.2% 5.0% 0.51 PE 6008
DY 5781
PB 7604
E/R 2615Notes: Target price estimates of PE, DY and PB based on a regression of the ratio against
the +12m forecast growth in the parameter (EPS, DPS or BV) and the 10y SAGB. E/R is
the so-called Fed model, where forecast +12m EPS is discounted by the 10y SAGB.
+12m TARGET PRICE ESTIMATES
RELATIVE VALUATION METRICS
(2.31)
(1.81)
(1.31)
(0.81)
(0.31)
0.19
0.69
1.19
2012 2013 2014 2015 2016 2017 2018 2019 2020
Price and EPS relative
Price Relative
EPS Relative
+12m+24m
0.5
1.0
1.5
2.0
2.5
3.0
3.5
4.0
4.5
5.0
-60% 40% 140% 240%
Rela
tive
P
E
Relative EPS growth
Trailing PE and forecast earnings growth
1.17
1.81
0.99
1.56
2.14
2.72
3.30
3.87
1998 2001 2004 2007 2010 2013 2016
Rela
tive
P
E
Forward PE ratio (+12m, +24m, +36m)
1.38
1.25
0.82
1.04
1.26
1.48
1.70
1.92
1998 2001 2004 2007 2010 2013 2016
Rela
tive
D
Yie
ld
Forward DY ratio (+12m, +24m, +36m)
Relative
EPS
Forecast
0.31
0.54
0.31
0.44
0.57
0.69
0.82
0.95
1998 2001 2004 2007 2010 2013 2016
Rela
tive
P
B
Forward PB ratio (+12m, +24m, +36m)
0.68
0.78
0.88
0.98
1.08
1.18
1.28
1.38
1.48
1.58
Sep-14 Jan-15 May-15 Sep-15 Jan-16 May-16 Sep-16 Jan-17
EP
S(+
1)
rela
tive
re
visio
ns
EPS(+12m) revisions
EPS Revisions
Price relative
0.09
0.15
0.21
0.27
0.33
0.39
1998 2001 2004 2007 2010 2013 2016
Rela
tive
P
rice
Price
1.50
Sep-14 Jan-15 May-15 Sep-15 Jan-16 May-16 Sep-16 Jan-17
Short-term sentiment indicator
33
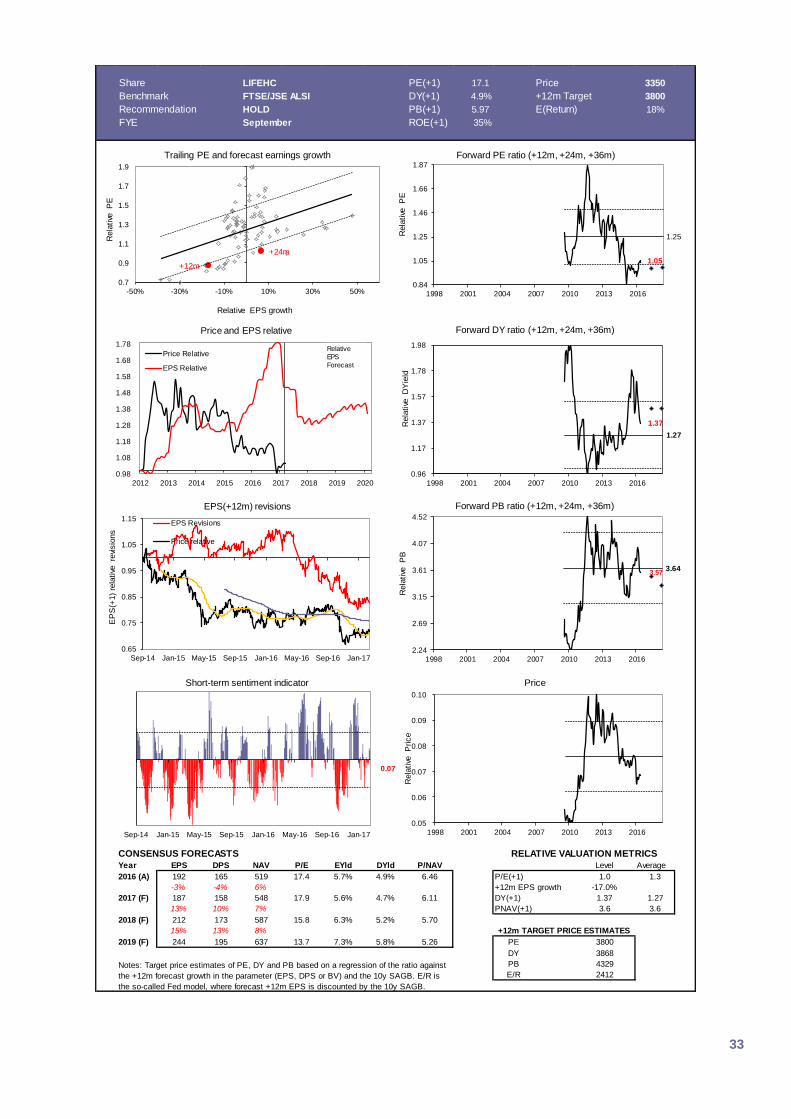
Share LIFEHC PE(+1) 17.1 Price 3350
Benchmark FTSE/JSE ALSI DY(+1) 4.9% +12m Target 3800
Recommendation HOLD PB(+1) 5.97 E(Return) 18%
FYE September ROE(+1) 35% Buy/Sell ratio 67%
CONSENSUS FORECASTS
Year EPS DPS NAV P/E EYld DYld P/NAV Level Average
2016 (A) 192 165 519 17.4 5.7% 4.9% 6.46 P/E(+1) 1.0 1.3
-3% -4% 6% +12m EPS growth -17.0%
2017 (F) 187 158 548 17.9 5.6% 4.7% 6.11 DY(+1) 1.37 1.27
13% 10% 7% PNAV(+1) 3.6 3.6
2018 (F) 212 173 587 15.8 6.3% 5.2% 5.70
15% 13% 8%
2019 (F) 244 195 637 13.7 7.3% 5.8% 5.26 PE 3800
DY 3868
PB 4329
E/R 2412Notes: Target price estimates of PE, DY and PB based on a regression of the ratio against
the +12m forecast growth in the parameter (EPS, DPS or BV) and the 10y SAGB. E/R is
the so-called Fed model, where forecast +12m EPS is discounted by the 10y SAGB.
+12m TARGET PRICE ESTIMATES
RELATIVE VALUATION METRICS
0.98
1.08
1.18
1.28
1.38
1.48
1.58
1.68
1.78
2012 2013 2014 2015 2016 2017 2018 2019 2020
Price and EPS relative
Price Relative
EPS Relative
+12m
+24m
0.7
0.9
1.1
1.3
1.5
1.7
1.9
-50% -30% -10% 10% 30% 50%
Rela
tive
P
E
Relative EPS growth
Trailing PE and forecast earnings growth
1.05
1.25
0.84
1.05
1.25
1.46
1.66
1.87
1998 2001 2004 2007 2010 2013 2016
Rela
tive
P
E
Forward PE ratio (+12m, +24m, +36m)
1.37
1.27
0.96
1.17
1.37
1.57
1.78
1.98
1998 2001 2004 2007 2010 2013 2016
Rela
tive
D
Yie
ld
Forward DY ratio (+12m, +24m, +36m)
Relative
EPS
Forecast
3.57 3.64
2.24
2.69
3.15
3.61
4.07
4.52
1998 2001 2004 2007 2010 2013 2016
Rela
tive
P
B
Forward PB ratio (+12m, +24m, +36m)
0.65
0.75
0.85
0.95
1.05
1.15
Sep-14 Jan-15 May-15 Sep-15 Jan-16 May-16 Sep-16 Jan-17
EP
S(+
1)
rela
tive
re
visio
ns
EPS(+12m) revisions
EPS Revisions
Price relative
0.05
0.06
0.07
0.08
0.09
0.10
1998 2001 2004 2007 2010 2013 2016
Rela
tive
P
rice
Price
0.07
Sep-14 Jan-15 May-15 Sep-15 Jan-16 May-16 Sep-16 Jan-17
Short-term sentiment indicator
34
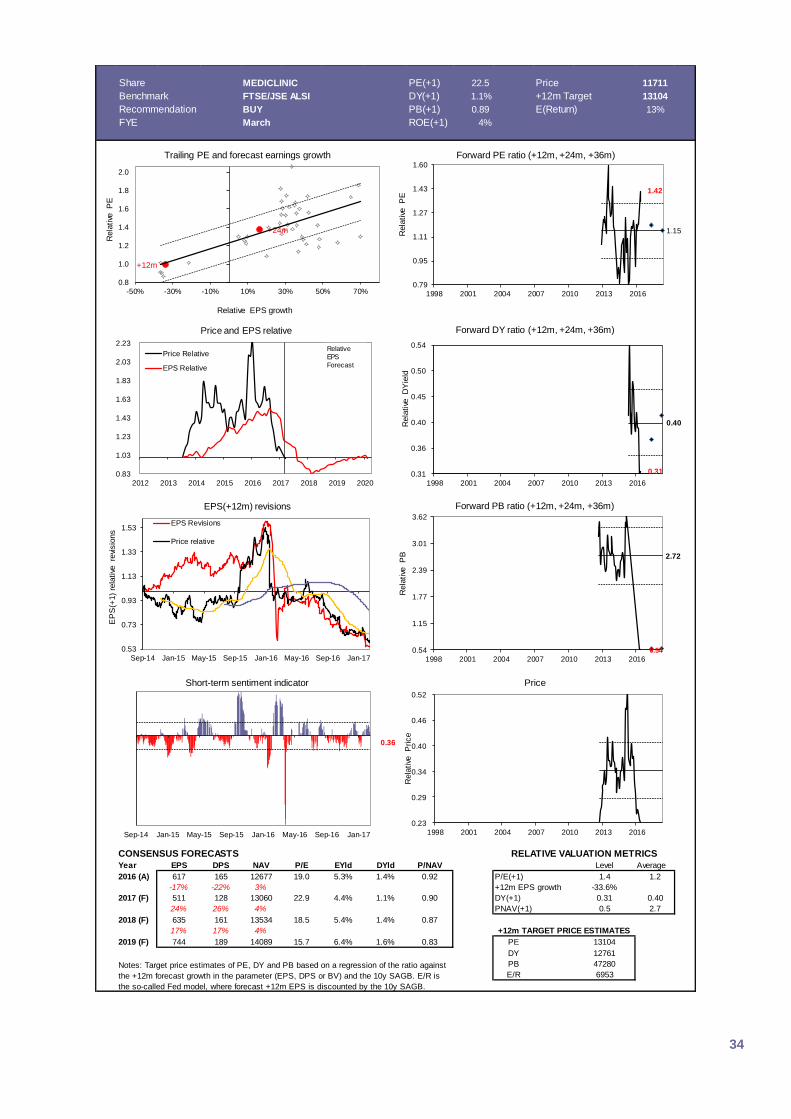
Share MEDICLINIC PE(+1) 22.5 Price 11711
Benchmark FTSE/JSE ALSI DY(+1) 1.1% +12m Target 13104
Recommendation BUY PB(+1) 0.89 E(Return) 13%
FYE March ROE(+1) 4% Buy/Sell ratio 50%
CONSENSUS FORECASTS
Year EPS DPS NAV P/E EYld DYld P/NAV Level Average
2016 (A) 617 165 12677 19.0 5.3% 1.4% 0.92 P/E(+1) 1.4 1.2
-17% -22% 3% +12m EPS growth -33.6%
2017 (F) 511 128 13060 22.9 4.4% 1.1% 0.90 DY(+1) 0.31 0.40
24% 26% 4% PNAV(+1) 0.5 2.7
2018 (F) 635 161 13534 18.5 5.4% 1.4% 0.87
17% 17% 4%
2019 (F) 744 189 14089 15.7 6.4% 1.6% 0.83 PE 13104
DY 12761
PB 47280
E/R 6953Notes: Target price estimates of PE, DY and PB based on a regression of the ratio against
the +12m forecast growth in the parameter (EPS, DPS or BV) and the 10y SAGB. E/R is
the so-called Fed model, where forecast +12m EPS is discounted by the 10y SAGB.
+12m TARGET PRICE ESTIMATES
RELATIVE VALUATION METRICS
0.83
1.03
1.23
1.43
1.63
1.83
2.03
2.23
2012 2013 2014 2015 2016 2017 2018 2019 2020
Price and EPS relative
Price Relative
EPS Relative
+12m
+24m
0.8
1.0
1.2
1.4
1.6
1.8
2.0
-50% -30% -10% 10% 30% 50% 70%
Rela
tive
P
E
Relative EPS growth
Trailing PE and forecast earnings growth
1.42
1.15
0.79
0.95
1.11
1.27
1.43
1.60
1998 2001 2004 2007 2010 2013 2016
Rela
tive
P
E
Forward PE ratio (+12m, +24m, +36m)
0.31
0.40
0.31
0.36
0.40
0.45
0.50
0.54
1998 2001 2004 2007 2010 2013 2016
Rela
tive
D
Yie
ld
Forward DY ratio (+12m, +24m, +36m)
Relative
EPS
Forecast
0.54
2.72
0.54
1.15
1.77
2.39
3.01
3.62
1998 2001 2004 2007 2010 2013 2016
Rela
tive
P
B
Forward PB ratio (+12m, +24m, +36m)
0.53
0.73
0.93
1.13
1.33
1.53
Sep-14 Jan-15 May-15 Sep-15 Jan-16 May-16 Sep-16 Jan-17
EP
S(+
1)
rela
tive
re
visio
ns
EPS(+12m) revisions
EPS Revisions
Price relative
0.23
0.29
0.34
0.40
0.46
0.52
1998 2001 2004 2007 2010 2013 2016
Rela
tive
P
rice
Price
0.36
Sep-14 Jan-15 May-15 Sep-15 Jan-16 May-16 Sep-16 Jan-17
Short-term sentiment indicator
35
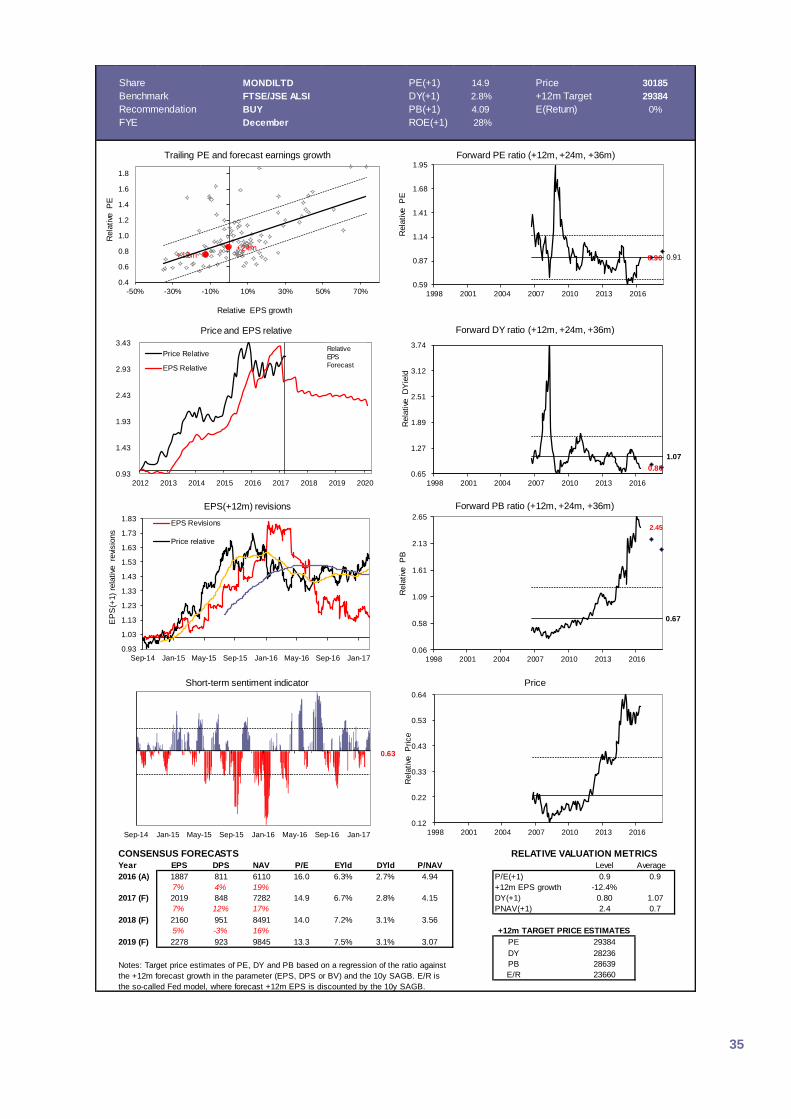
Share MONDILTD PE(+1) 14.9 Price 30185
Benchmark FTSE/JSE ALSI DY(+1) 2.8% +12m Target 29384
Recommendation BUY PB(+1) 4.09 E(Return) 0%
FYE December ROE(+1) 28% Buy/Sell ratio #N/A
CONSENSUS FORECASTS
Year EPS DPS NAV P/E EYld DYld P/NAV Level Average
2016 (A) 1887 811 6110 16.0 6.3% 2.7% 4.94 P/E(+1) 0.9 0.9
7% 4% 19% +12m EPS growth -12.4%
2017 (F) 2019 848 7282 14.9 6.7% 2.8% 4.15 DY(+1) 0.80 1.07
7% 12% 17% PNAV(+1) 2.4 0.7
2018 (F) 2160 951 8491 14.0 7.2% 3.1% 3.56
5% -3% 16%
2019 (F) 2278 923 9845 13.3 7.5% 3.1% 3.07 PE 29384
DY 28236
PB 28639
E/R 23660Notes: Target price estimates of PE, DY and PB based on a regression of the ratio against
the +12m forecast growth in the parameter (EPS, DPS or BV) and the 10y SAGB. E/R is
the so-called Fed model, where forecast +12m EPS is discounted by the 10y SAGB.
+12m TARGET PRICE ESTIMATES
RELATIVE VALUATION METRICS
0.93
1.43
1.93
2.43
2.93
3.43
2012 2013 2014 2015 2016 2017 2018 2019 2020
Price and EPS relative
Price Relative
EPS Relative
+12m+24m
0.4
0.6
0.8
1.0
1.2
1.4
1.6
1.8
-50% -30% -10% 10% 30% 50% 70%
Rela
tive
P
E
Relative EPS growth
Trailing PE and forecast earnings growth
0.90 0.91
0.59
0.87
1.14
1.41
1.68
1.95
1998 2001 2004 2007 2010 2013 2016
Rela
tive
P
E
Forward PE ratio (+12m, +24m, +36m)
0.80
1.07
0.65
1.27
1.89
2.51
3.12
3.74
1998 2001 2004 2007 2010 2013 2016
Rela
tive
D
Yie
ld
Forward DY ratio (+12m, +24m, +36m)
Relative
EPS
Forecast
2.45
0.67
0.06
0.58
1.09
1.61
2.13
2.65
1998 2001 2004 2007 2010 2013 2016
Rela
tive
P
B
Forward PB ratio (+12m, +24m, +36m)
0.93
1.03
1.13
1.23
1.33
1.43
1.53
1.63
1.73
1.83
Sep-14 Jan-15 May-15 Sep-15 Jan-16 May-16 Sep-16 Jan-17
EP
S(+
1)
rela
tive
re
visio
ns
EPS(+12m) revisions
EPS Revisions
Price relative
0.12
0.22
0.33
0.43
0.53
0.64
1998 2001 2004 2007 2010 2013 2016
Rela
tive
P
rice
Price
0.63
Sep-14 Jan-15 May-15 Sep-15 Jan-16 May-16 Sep-16 Jan-17
Short-term sentiment indicator
36
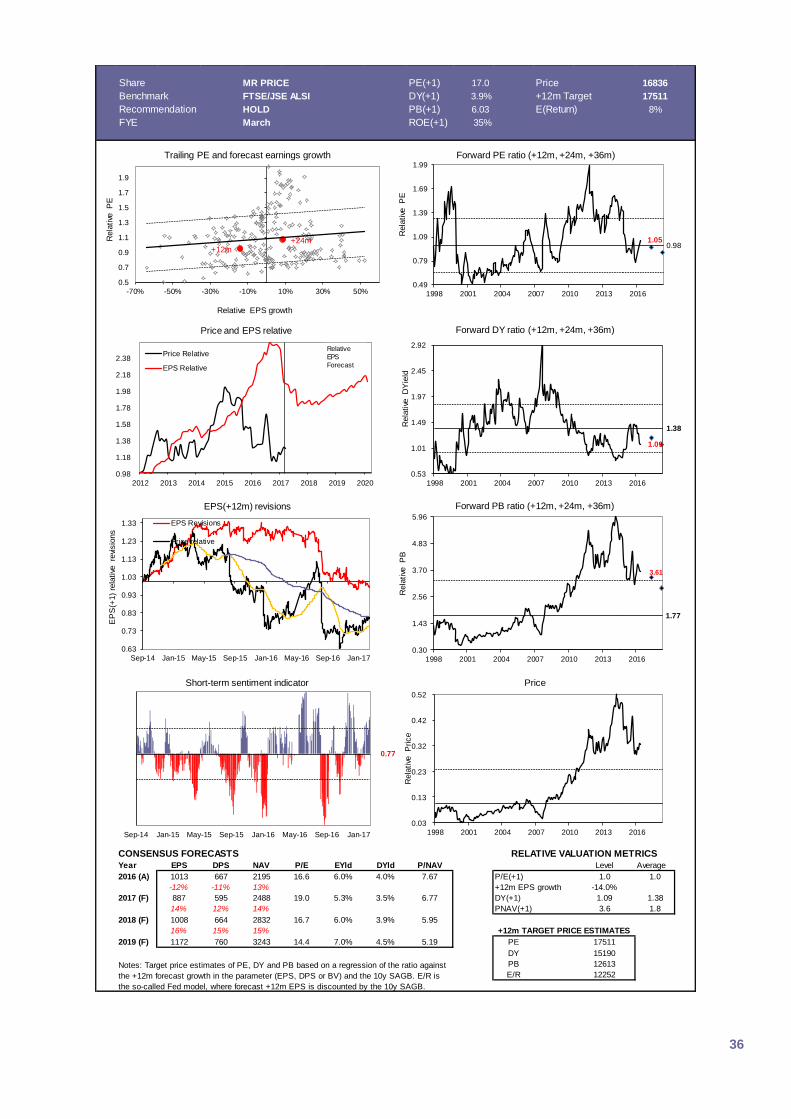
Share MR PRICE PE(+1) 17.0 Price 16836
Benchmark FTSE/JSE ALSI DY(+1) 3.9% +12m Target 17511
Recommendation HOLD PB(+1) 6.03 E(Return) 8%
FYE March ROE(+1) 35% Buy/Sell ratio 62%
CONSENSUS FORECASTS
Year EPS DPS NAV P/E EYld DYld P/NAV Level Average
2016 (A) 1013 667 2195 16.6 6.0% 4.0% 7.67 P/E(+1) 1.0 1.0
-12% -11% 13% +12m EPS growth -14.0%
2017 (F) 887 595 2488 19.0 5.3% 3.5% 6.77 DY(+1) 1.09 1.38
14% 12% 14% PNAV(+1) 3.6 1.8
2018 (F) 1008 664 2832 16.7 6.0% 3.9% 5.95
16% 15% 15%
2019 (F) 1172 760 3243 14.4 7.0% 4.5% 5.19 PE 17511
DY 15190
PB 12613
E/R 12252Notes: Target price estimates of PE, DY and PB based on a regression of the ratio against
the +12m forecast growth in the parameter (EPS, DPS or BV) and the 10y SAGB. E/R is
the so-called Fed model, where forecast +12m EPS is discounted by the 10y SAGB.
+12m TARGET PRICE ESTIMATES
RELATIVE VALUATION METRICS
0.98
1.18
1.38
1.58
1.78
1.98
2.18
2.38
2012 2013 2014 2015 2016 2017 2018 2019 2020
Price and EPS relative
Price Relative
EPS Relative
+12m+24m
0.5
0.7
0.9
1.1
1.3
1.5
1.7
1.9
-70% -50% -30% -10% 10% 30% 50%
Rela
tive
P
E
Relative EPS growth
Trailing PE and forecast earnings growth
1.050.98
0.49
0.79
1.09
1.39
1.69
1.99
1998 2001 2004 2007 2010 2013 2016
Rela
tive
P
E
Forward PE ratio (+12m, +24m, +36m)
1.09
1.38
0.53
1.01
1.49
1.97
2.45
2.92
1998 2001 2004 2007 2010 2013 2016
Rela
tive
D
Yie
ld
Forward DY ratio (+12m, +24m, +36m)
Relative
EPS
Forecast
3.61
1.77
0.30
1.43
2.56
3.70
4.83
5.96
1998 2001 2004 2007 2010 2013 2016
Rela
tive
P
B
Forward PB ratio (+12m, +24m, +36m)
0.63
0.73
0.83
0.93
1.03
1.13
1.23
1.33
Sep-14 Jan-15 May-15 Sep-15 Jan-16 May-16 Sep-16 Jan-17
EP
S(+
1)
rela
tive
re
visio
ns
EPS(+12m) revisions
EPS Revisions
Price relative
0.03
0.13
0.23
0.32
0.42
0.52
1998 2001 2004 2007 2010 2013 2016
Rela
tive
P
rice
Price
0.77
Sep-14 Jan-15 May-15 Sep-15 Jan-16 May-16 Sep-16 Jan-17
Short-term sentiment indicator
37
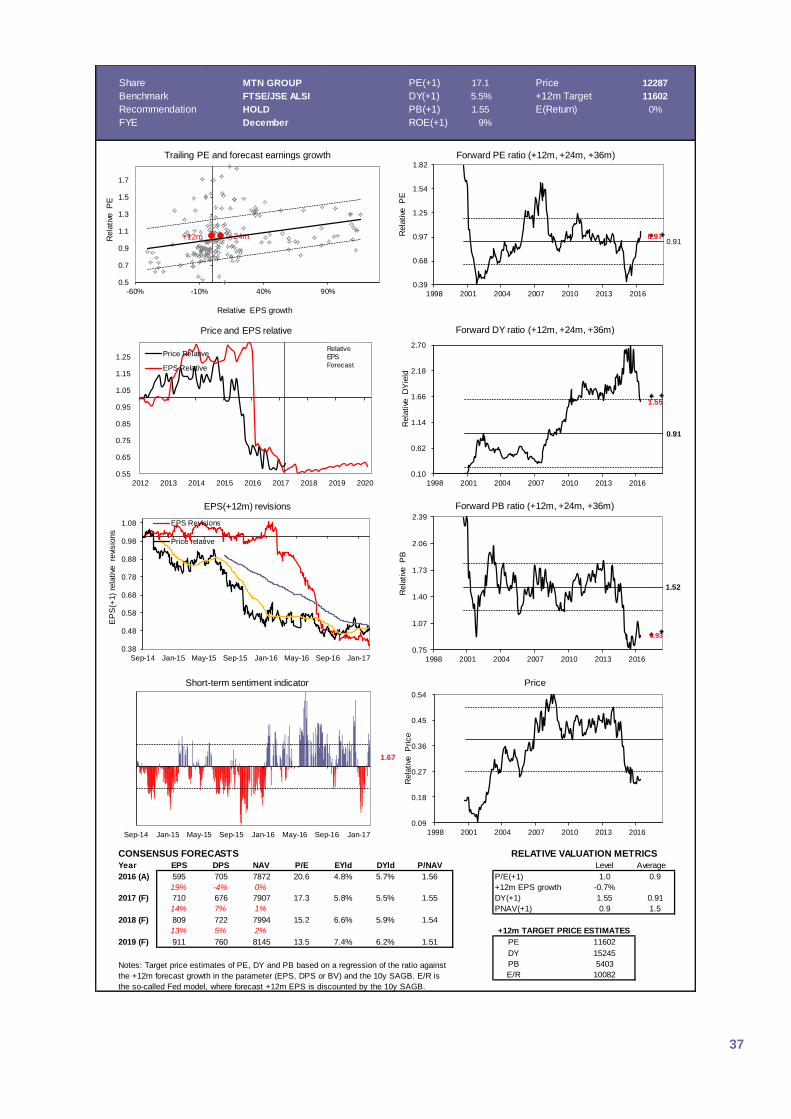
Share MTN GROUP PE(+1) 17.1 Price 12287
Benchmark FTSE/JSE ALSI DY(+1) 5.5% +12m Target 11602
Recommendation HOLD PB(+1) 1.55 E(Return) 0%
FYE December ROE(+1) 9% Buy/Sell ratio 31%
CONSENSUS FORECASTS
Year EPS DPS NAV P/E EYld DYld P/NAV Level Average
2016 (A) 595 705 7872 20.6 4.8% 5.7% 1.56 P/E(+1) 1.0 0.9
19% -4% 0% +12m EPS growth -0.7%
2017 (F) 710 676 7907 17.3 5.8% 5.5% 1.55 DY(+1) 1.55 0.91
14% 7% 1% PNAV(+1) 0.9 1.5
2018 (F) 809 722 7994 15.2 6.6% 5.9% 1.54
13% 5% 2%
2019 (F) 911 760 8145 13.5 7.4% 6.2% 1.51 PE 11602
DY 15245
PB 5403
E/R 10082Notes: Target price estimates of PE, DY and PB based on a regression of the ratio against
the +12m forecast growth in the parameter (EPS, DPS or BV) and the 10y SAGB. E/R is
the so-called Fed model, where forecast +12m EPS is discounted by the 10y SAGB.
+12m TARGET PRICE ESTIMATES
RELATIVE VALUATION METRICS
0.55
0.65
0.75
0.85
0.95
1.05
1.15
1.25
2012 2013 2014 2015 2016 2017 2018 2019 2020
Price and EPS relative
Price Relative
EPS Relative
+12m +24m
0.5
0.7
0.9
1.1
1.3
1.5
1.7
-60% -10% 40% 90%
Rela
tive
P
E
Relative EPS growth
Trailing PE and forecast earnings growth
0.970.91
0.39
0.68
0.97
1.25
1.54
1.82
1998 2001 2004 2007 2010 2013 2016
Rela
tive
P
E
Forward PE ratio (+12m, +24m, +36m)
1.55
0.91
0.10
0.62
1.14
1.66
2.18
2.70
1998 2001 2004 2007 2010 2013 2016
Rela
tive
D
Yie
ld
Forward DY ratio (+12m, +24m, +36m)
Relative
EPS
Forecast
0.93
1.52
0.75
1.07
1.40
1.73
2.06
2.39
1998 2001 2004 2007 2010 2013 2016
Rela
tive
P
B
Forward PB ratio (+12m, +24m, +36m)
0.38
0.48
0.58
0.68
0.78
0.88
0.98
1.08
Sep-14 Jan-15 May-15 Sep-15 Jan-16 May-16 Sep-16 Jan-17
EP
S(+
1)
rela
tive
re
visio
ns
EPS(+12m) revisions
EPS Revisions
Price relative
0.09
0.18
0.27
0.36
0.45
0.54
1998 2001 2004 2007 2010 2013 2016
Rela
tive
P
rice
Price
1.67
Sep-14 Jan-15 May-15 Sep-15 Jan-16 May-16 Sep-16 Jan-17
Short-term sentiment indicator
38
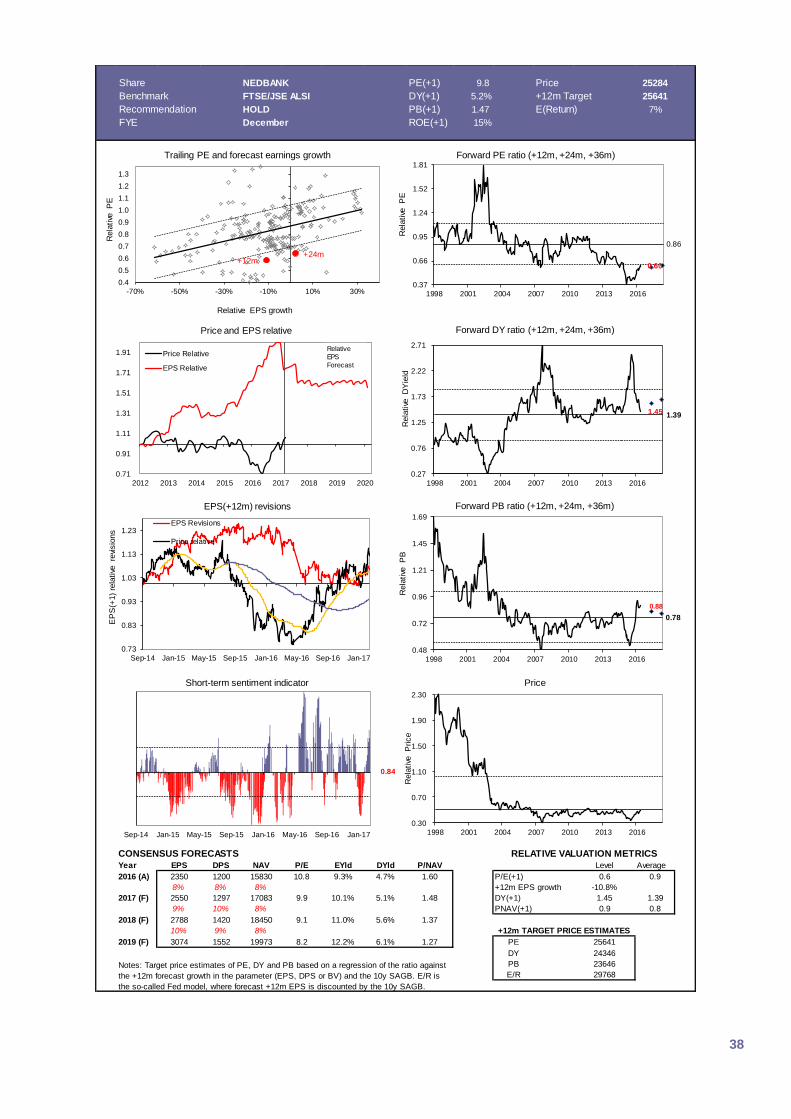
Share NEDBANK PE(+1) 9.8 Price 25284
Benchmark FTSE/JSE ALSI DY(+1) 5.2% +12m Target 25641
Recommendation HOLD PB(+1) 1.47 E(Return) 7%
FYE December ROE(+1) 15% Buy/Sell ratio 82%
CONSENSUS FORECASTS
Year EPS DPS NAV P/E EYld DYld P/NAV Level Average
2016 (A) 2350 1200 15830 10.8 9.3% 4.7% 1.60 P/E(+1) 0.6 0.9
8% 8% 8% +12m EPS growth -10.8%
2017 (F) 2550 1297 17083 9.9 10.1% 5.1% 1.48 DY(+1) 1.45 1.39
9% 10% 8% PNAV(+1) 0.9 0.8
2018 (F) 2788 1420 18450 9.1 11.0% 5.6% 1.37
10% 9% 8%
2019 (F) 3074 1552 19973 8.2 12.2% 6.1% 1.27 PE 25641
DY 24346
PB 23646
E/R 29768Notes: Target price estimates of PE, DY and PB based on a regression of the ratio against
the +12m forecast growth in the parameter (EPS, DPS or BV) and the 10y SAGB. E/R is
the so-called Fed model, where forecast +12m EPS is discounted by the 10y SAGB.
+12m TARGET PRICE ESTIMATES
RELATIVE VALUATION METRICS
0.71
0.91
1.11
1.31
1.51
1.71
1.91
2012 2013 2014 2015 2016 2017 2018 2019 2020
Price and EPS relative
Price Relative
EPS Relative
+12m+24m
0.4
0.5
0.6
0.7
0.8
0.9
1.0
1.1
1.2
1.3
-70% -50% -30% -10% 10% 30%
Rela
tive
P
E
Relative EPS growth
Trailing PE and forecast earnings growth
0.60
0.86
0.37
0.66
0.95
1.24
1.52
1.81
1998 2001 2004 2007 2010 2013 2016
Rela
tive
P
E
Forward PE ratio (+12m, +24m, +36m)
1.45 1.39
0.27
0.76
1.25
1.73
2.22
2.71
1998 2001 2004 2007 2010 2013 2016
Rela
tive
D
Yie
ld
Forward DY ratio (+12m, +24m, +36m)
Relative
EPS
Forecast
0.88
0.78
0.48
0.72
0.96
1.21
1.45
1.69
1998 2001 2004 2007 2010 2013 2016
Rela
tive
P
B
Forward PB ratio (+12m, +24m, +36m)
0.73
0.83
0.93
1.03
1.13
1.23
Sep-14 Jan-15 May-15 Sep-15 Jan-16 May-16 Sep-16 Jan-17
EP
S(+
1)
rela
tive
re
visio
ns
EPS(+12m) revisions
EPS Revisions
Price relative
0.30
0.70
1.10
1.50
1.90
2.30
1998 2001 2004 2007 2010 2013 2016
Rela
tive
P
rice
Price
0.84
Sep-14 Jan-15 May-15 Sep-15 Jan-16 May-16 Sep-16 Jan-17
Short-term sentiment indicator
39
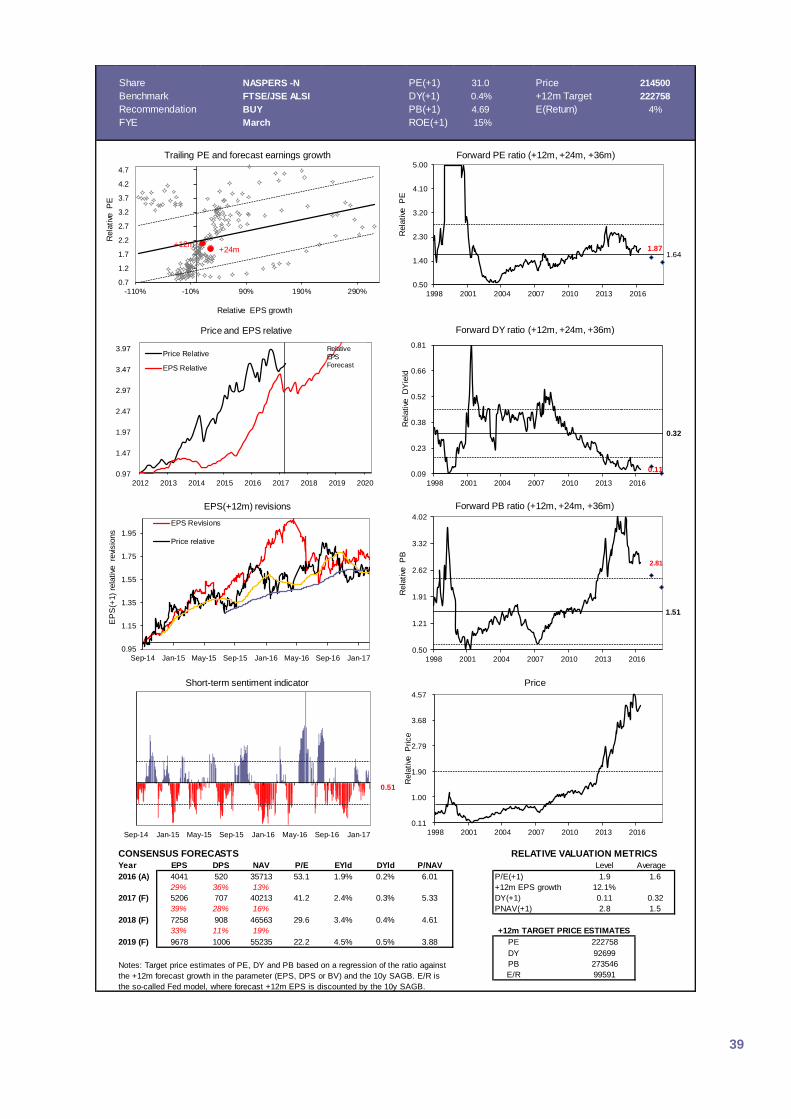
Share NASPERS -N PE(+1) 31.0 Price 214500
Benchmark FTSE/JSE ALSI DY(+1) 0.4% +12m Target 222758
Recommendation BUY PB(+1) 4.69 E(Return) 4%
FYE March ROE(+1) 15% Buy/Sell ratio 7%
CONSENSUS FORECASTS
Year EPS DPS NAV P/E EYld DYld P/NAV Level Average
2016 (A) 4041 520 35713 53.1 1.9% 0.2% 6.01 P/E(+1) 1.9 1.6
29% 36% 13% +12m EPS growth 12.1%
2017 (F) 5206 707 40213 41.2 2.4% 0.3% 5.33 DY(+1) 0.11 0.32
39% 28% 16% PNAV(+1) 2.8 1.5
2018 (F) 7258 908 46563 29.6 3.4% 0.4% 4.61
33% 11% 19%
2019 (F) 9678 1006 55235 22.2 4.5% 0.5% 3.88 PE 222758
DY 92699
PB 273546
E/R 99591Notes: Target price estimates of PE, DY and PB based on a regression of the ratio against
the +12m forecast growth in the parameter (EPS, DPS or BV) and the 10y SAGB. E/R is
the so-called Fed model, where forecast +12m EPS is discounted by the 10y SAGB.
+12m TARGET PRICE ESTIMATES
RELATIVE VALUATION METRICS
0.97
1.47
1.97
2.47
2.97
3.47
3.97
2012 2013 2014 2015 2016 2017 2018 2019 2020
Price and EPS relative
Price Relative
EPS Relative
+12m+24m
0.7
1.2
1.7
2.2
2.7
3.2
3.7
4.2
4.7
-110% -10% 90% 190% 290%
Rela
tive
P
E
Relative EPS growth
Trailing PE and forecast earnings growth
1.871.64
0.50
1.40
2.30
3.20
4.10
5.00
1998 2001 2004 2007 2010 2013 2016
Rela
tive
P
E
Forward PE ratio (+12m, +24m, +36m)
0.11
0.32
0.09
0.23
0.38
0.52
0.66
0.81
1998 2001 2004 2007 2010 2013 2016
Rela
tive
D
Yie
ld
Forward DY ratio (+12m, +24m, +36m)
Relative
EPS
Forecast
2.81
1.51
0.50
1.21
1.91
2.62
3.32
4.02
1998 2001 2004 2007 2010 2013 2016
Rela
tive
P
B
Forward PB ratio (+12m, +24m, +36m)
0.95
1.15
1.35
1.55
1.75
1.95
Sep-14 Jan-15 May-15 Sep-15 Jan-16 May-16 Sep-16 Jan-17
EP
S(+
1)
rela
tive
re
visio
ns
EPS(+12m) revisions
EPS Revisions
Price relative
0.11
1.00
1.90
2.79
3.68
4.57
1998 2001 2004 2007 2010 2013 2016
Rela
tive
P
rice
Price
0.51
Sep-14 Jan-15 May-15 Sep-15 Jan-16 May-16 Sep-16 Jan-17
Short-term sentiment indicator
40
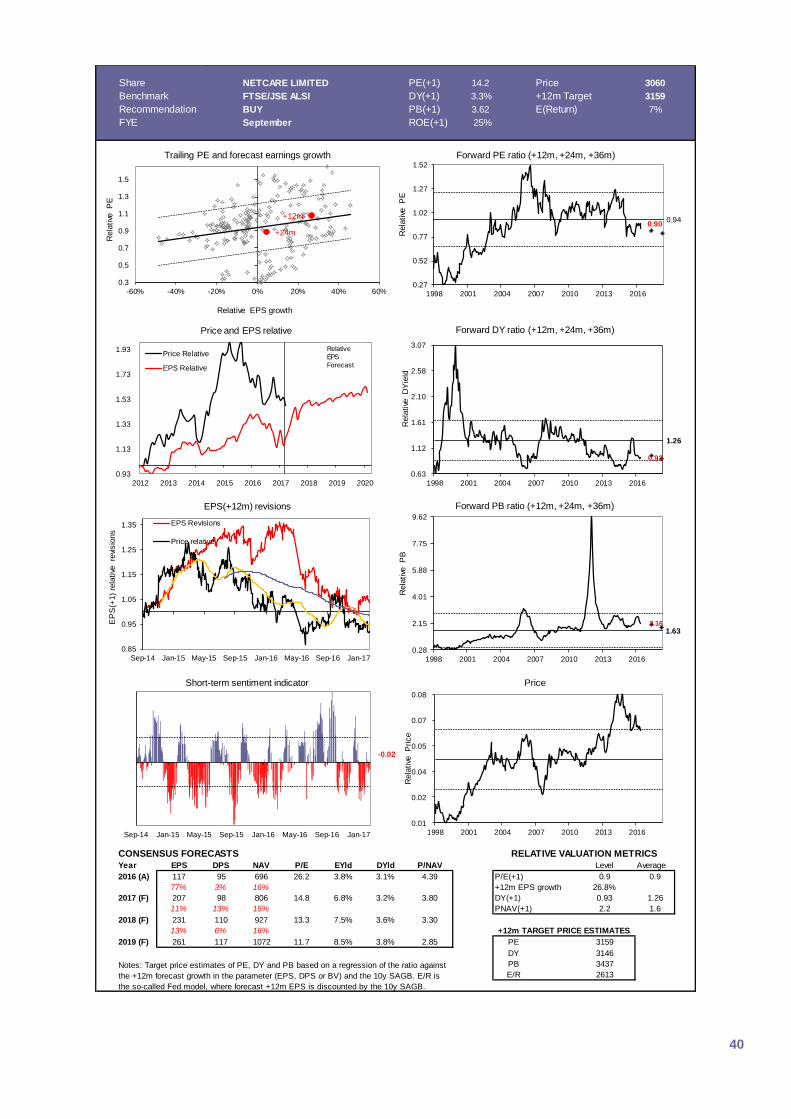
Share NETCARE LIMITED PE(+1) 14.2 Price 3060
Benchmark FTSE/JSE ALSI DY(+1) 3.3% +12m Target 3159
Recommendation BUY PB(+1) 3.62 E(Return) 7%
FYE September ROE(+1) 25% Buy/Sell ratio 8%
CONSENSUS FORECASTS
Year EPS DPS NAV P/E EYld DYld P/NAV Level Average
2016 (A) 117 95 696 26.2 3.8% 3.1% 4.39 P/E(+1) 0.9 0.9
77% 3% 16% +12m EPS growth 26.8%
2017 (F) 207 98 806 14.8 6.8% 3.2% 3.80 DY(+1) 0.93 1.26
11% 13% 15% PNAV(+1) 2.2 1.6
2018 (F) 231 110 927 13.3 7.5% 3.6% 3.30
13% 6% 16%
2019 (F) 261 117 1072 11.7 8.5% 3.8% 2.85 PE 3159
DY 3146
PB 3437
E/R 2613Notes: Target price estimates of PE, DY and PB based on a regression of the ratio against
the +12m forecast growth in the parameter (EPS, DPS or BV) and the 10y SAGB. E/R is
the so-called Fed model, where forecast +12m EPS is discounted by the 10y SAGB.
+12m TARGET PRICE ESTIMATES
RELATIVE VALUATION METRICS
0.93
1.13
1.33
1.53
1.73
1.93
2012 2013 2014 2015 2016 2017 2018 2019 2020
Price and EPS relative
Price Relative
EPS Relative
+12m
+24m
0.3
0.5
0.7
0.9
1.1
1.3
1.5
-60% -40% -20% 0% 20% 40% 60%
Rela
tive
P
E
Relative EPS growth
Trailing PE and forecast earnings growth
0.900.94
0.27
0.52
0.77
1.02
1.27
1.52
1998 2001 2004 2007 2010 2013 2016
Rela
tive
P
E
Forward PE ratio (+12m, +24m, +36m)
0.93
1.26
0.63
1.12
1.61
2.10
2.58
3.07
1998 2001 2004 2007 2010 2013 2016
Rela
tive
D
Yie
ld
Forward DY ratio (+12m, +24m, +36m)
Relative
EPS
Forecast
2.16 1.63
0.28
2.15
4.01
5.88
7.75
9.62
1998 2001 2004 2007 2010 2013 2016
Rela
tive
P
B
Forward PB ratio (+12m, +24m, +36m)
0.85
0.95
1.05
1.15
1.25
1.35
Sep-14 Jan-15 May-15 Sep-15 Jan-16 May-16 Sep-16 Jan-17
EP
S(+
1)
rela
tive
re
visio
ns
EPS(+12m) revisions
EPS Revisions
Price relative
0.01
0.02
0.04
0.05
0.07
0.08
1998 2001 2004 2007 2010 2013 2016
Rela
tive
P
rice
Price
-0.02
Sep-14 Jan-15 May-15 Sep-15 Jan-16 May-16 Sep-16 Jan-17
Short-term sentiment indicator
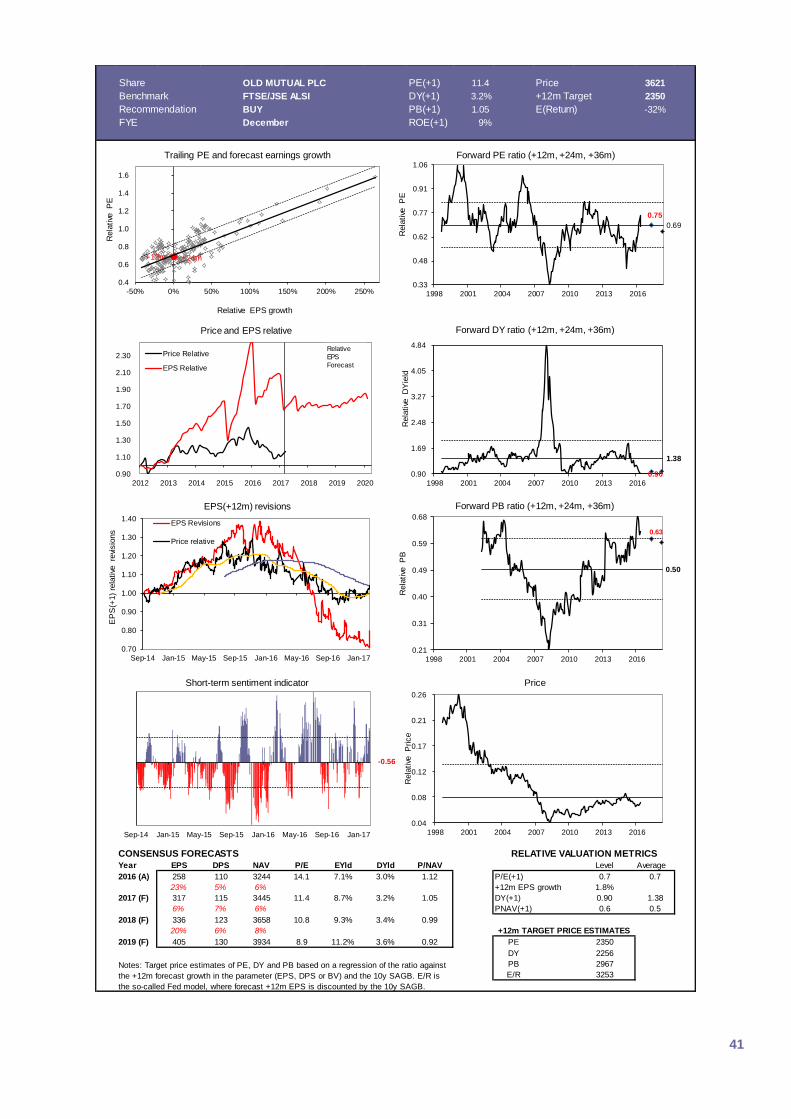
41
Share OLD MUTUAL PLC PE(+1) 11.4 Price 3621
Benchmark FTSE/JSE ALSI DY(+1) 3.2% +12m Target 2350
Recommendation BUY PB(+1) 1.05 E(Return) -32%
FYE December ROE(+1) 9% Buy/Sell ratio 75%
CONSENSUS FORECASTS
Year EPS DPS NAV P/E EYld DYld P/NAV Level Average
2016 (A) 258 110 3244 14.1 7.1% 3.0% 1.12 P/E(+1) 0.7 0.7
23% 5% 6% +12m EPS growth 1.8%
2017 (F) 317 115 3445 11.4 8.7% 3.2% 1.05 DY(+1) 0.90 1.38
6% 7% 6% PNAV(+1) 0.6 0.5
2018 (F) 336 123 3658 10.8 9.3% 3.4% 0.99
20% 6% 8%
2019 (F) 405 130 3934 8.9 11.2% 3.6% 0.92 PE 2350
DY 2256
PB 2967
E/R 3253Notes: Target price estimates of PE, DY and PB based on a regression of the ratio against
the +12m forecast growth in the parameter (EPS, DPS or BV) and the 10y SAGB. E/R is
the so-called Fed model, where forecast +12m EPS is discounted by the 10y SAGB.
+12m TARGET PRICE ESTIMATES
RELATIVE VALUATION METRICS
0.90
1.10
1.30
1.50
1.70
1.90
2.10
2.30
2012 2013 2014 2015 2016 2017 2018 2019 2020
Price and EPS relative
Price Relative
EPS Relative
+12m +24m
0.4
0.6
0.8
1.0
1.2
1.4
1.6
-50% 0% 50% 100% 150% 200% 250%
Rela
tive
P
E
Relative EPS growth
Trailing PE and forecast earnings growth
0.75
0.69
0.33
0.48
0.62
0.77
0.91
1.06
1998 2001 2004 2007 2010 2013 2016
Rela
tive
P
E
Forward PE ratio (+12m, +24m, +36m)
0.90
1.38
0.90
1.69
2.48
3.27
4.05
4.84
1998 2001 2004 2007 2010 2013 2016
Rela
tive
D
Yie
ld
Forward DY ratio (+12m, +24m, +36m)
Relative
EPS
Forecast
0.63
0.50
0.21
0.31
0.40
0.49
0.59
0.68
1998 2001 2004 2007 2010 2013 2016
Rela
tive
P
B
Forward PB ratio (+12m, +24m, +36m)
0.70
0.80
0.90
1.00
1.10
1.20
1.30
1.40
Sep-14 Jan-15 May-15 Sep-15 Jan-16 May-16 Sep-16 Jan-17
EP
S(+
1)
rela
tive
re
visio
ns
EPS(+12m) revisions
EPS Revisions
Price relative
0.04
0.08
0.12
0.17
0.21
0.26
1998 2001 2004 2007 2010 2013 2016
Rela
tive
P
rice
Price
-0.56
Sep-14 Jan-15 May-15 Sep-15 Jan-16 May-16 Sep-16 Jan-17
Short-term sentiment indicator
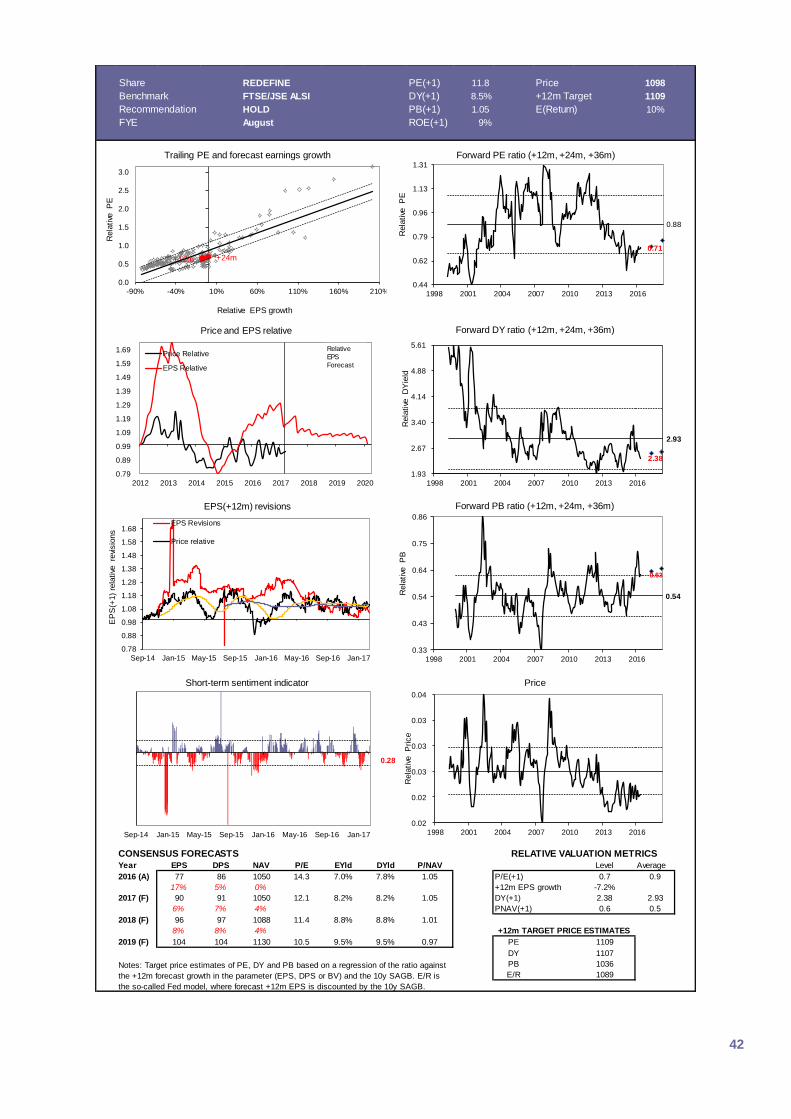
42
Share REDEFINE PE(+1) 11.8 Price 1098
Benchmark FTSE/JSE ALSI DY(+1) 8.5% +12m Target 1109
Recommendation HOLD PB(+1) 1.05 E(Return) 10%
FYE August ROE(+1) 9% Buy/Sell ratio 67%
CONSENSUS FORECASTS
Year EPS DPS NAV P/E EYld DYld P/NAV Level Average
2016 (A) 77 86 1050 14.3 7.0% 7.8% 1.05 P/E(+1) 0.7 0.9
17% 5% 0% +12m EPS growth -7.2%
2017 (F) 90 91 1050 12.1 8.2% 8.2% 1.05 DY(+1) 2.38 2.93
6% 7% 4% PNAV(+1) 0.6 0.5
2018 (F) 96 97 1088 11.4 8.8% 8.8% 1.01
8% 8% 4%
2019 (F) 104 104 1130 10.5 9.5% 9.5% 0.97 PE 1109
DY 1107
PB 1036
E/R 1089Notes: Target price estimates of PE, DY and PB based on a regression of the ratio against
the +12m forecast growth in the parameter (EPS, DPS or BV) and the 10y SAGB. E/R is
the so-called Fed model, where forecast +12m EPS is discounted by the 10y SAGB.
+12m TARGET PRICE ESTIMATES
RELATIVE VALUATION METRICS
0.79
0.89
0.99
1.09
1.19
1.29
1.39
1.49
1.59
1.69
2012 2013 2014 2015 2016 2017 2018 2019 2020
Price and EPS relative
Price Relative
EPS Relative
+12m +24m
0.0
0.5
1.0
1.5
2.0
2.5
3.0
-90% -40% 10% 60% 110% 160% 210%
Rela
tive
P
E
Relative EPS growth
Trailing PE and forecast earnings growth
0.71
0.88
0.44
0.62
0.79
0.96
1.13
1.31
1998 2001 2004 2007 2010 2013 2016
Rela
tive
P
E
Forward PE ratio (+12m, +24m, +36m)
2.38
2.93
1.93
2.67
3.40
4.14
4.88
5.61
1998 2001 2004 2007 2010 2013 2016
Rela
tive
D
Yie
ld
Forward DY ratio (+12m, +24m, +36m)
Relative
EPS
Forecast
0.63
0.54
0.33
0.43
0.54
0.64
0.75
0.86
1998 2001 2004 2007 2010 2013 2016
Rela
tive
P
B
Forward PB ratio (+12m, +24m, +36m)
0.78
0.88
0.98
1.08
1.18
1.28
1.38
1.48
1.58
1.68
Sep-14 Jan-15 May-15 Sep-15 Jan-16 May-16 Sep-16 Jan-17
EP
S(+
1)
rela
tive
re
visio
ns
EPS(+12m) revisions
EPS Revisions
Price relative
0.02
0.02
0.03
0.03
0.03
0.04
1998 2001 2004 2007 2010 2013 2016
Rela
tive
P
rice
Price
0.28
Sep-14 Jan-15 May-15 Sep-15 Jan-16 May-16 Sep-16 Jan-17
Short-term sentiment indicator
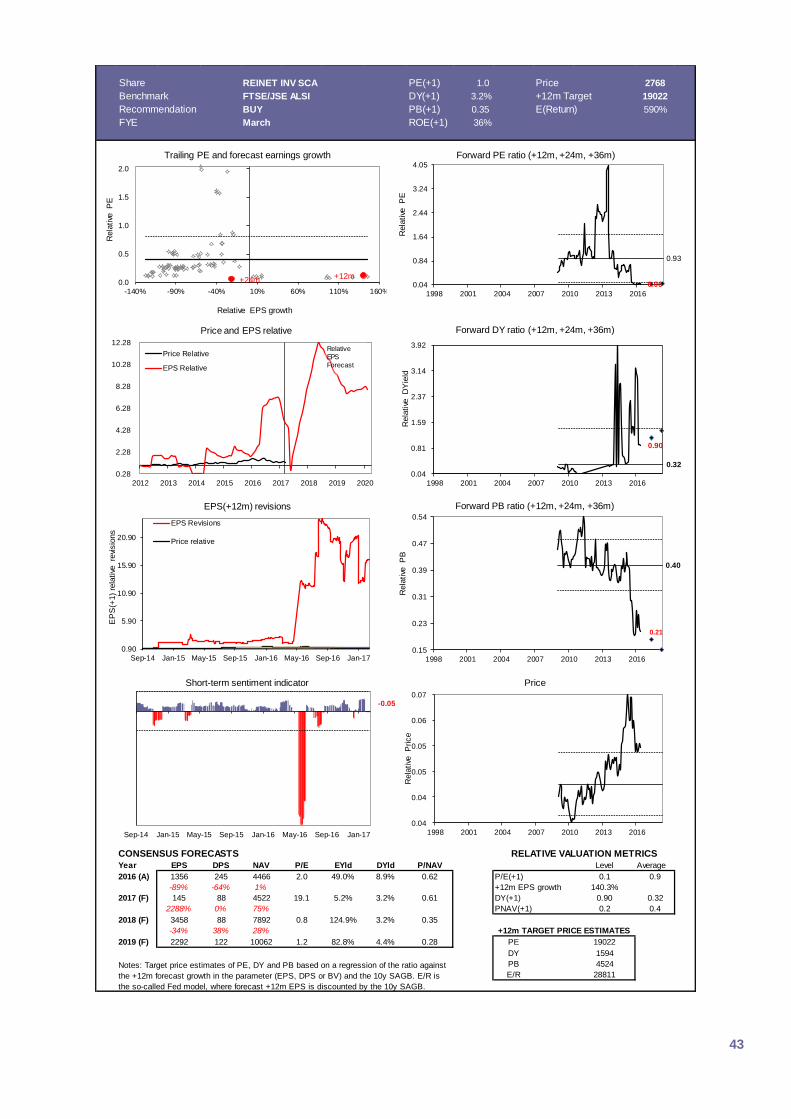
43
Share REINET INV SCA PE(+1) 1.0 Price 2768
Benchmark FTSE/JSE ALSI DY(+1) 3.2% +12m Target 19022
Recommendation BUY PB(+1) 0.35 E(Return) 590%
FYE March ROE(+1) 36% Buy/Sell ratio 67%
CONSENSUS FORECASTS
Year EPS DPS NAV P/E EYld DYld P/NAV Level Average
2016 (A) 1356 245 4466 2.0 49.0% 8.9% 0.62 P/E(+1) 0.1 0.9
-89% -64% 1% +12m EPS growth 140.3%
2017 (F) 145 88 4522 19.1 5.2% 3.2% 0.61 DY(+1) 0.90 0.32
2288% 0% 75% PNAV(+1) 0.2 0.4
2018 (F) 3458 88 7892 0.8 124.9% 3.2% 0.35
-34% 38% 28%
2019 (F) 2292 122 10062 1.2 82.8% 4.4% 0.28 PE 19022
DY 1594
PB 4524
E/R 28811Notes: Target price estimates of PE, DY and PB based on a regression of the ratio against
the +12m forecast growth in the parameter (EPS, DPS or BV) and the 10y SAGB. E/R is
the so-called Fed model, where forecast +12m EPS is discounted by the 10y SAGB.
+12m TARGET PRICE ESTIMATES
RELATIVE VALUATION METRICS
0.28
2.28
4.28
6.28
8.28
10.28
12.28
2012 2013 2014 2015 2016 2017 2018 2019 2020
Price and EPS relative
Price Relative
EPS Relative
+12m+24m0.0
0.5
1.0
1.5
2.0
-140% -90% -40% 10% 60% 110% 160%
Rela
tive
P
E
Relative EPS growth
Trailing PE and forecast earnings growth
0.06
0.93
0.04
0.84
1.64
2.44
3.24
4.05
1998 2001 2004 2007 2010 2013 2016
Rela
tive
P
E
Forward PE ratio (+12m, +24m, +36m)
0.90
0.32
0.04
0.81
1.59
2.37
3.14
3.92
1998 2001 2004 2007 2010 2013 2016
Rela
tive
D
Yie
ld
Forward DY ratio (+12m, +24m, +36m)
Relative
EPS
Forecast
0.21
0.40
0.15
0.23
0.31
0.39
0.47
0.54
1998 2001 2004 2007 2010 2013 2016
Rela
tive
P
B
Forward PB ratio (+12m, +24m, +36m)
0.90
5.90
10.90
15.90
20.90
Sep-14 Jan-15 May-15 Sep-15 Jan-16 May-16 Sep-16 Jan-17
EP
S(+
1)
rela
tive
re
visio
ns
EPS(+12m) revisions
EPS Revisions
Price relative
0.04
0.04
0.05
0.05
0.06
0.07
1998 2001 2004 2007 2010 2013 2016
Rela
tive
P
rice
Price
-0.05
Sep-14 Jan-15 May-15 Sep-15 Jan-16 May-16 Sep-16 Jan-17
Short-term sentiment indicator
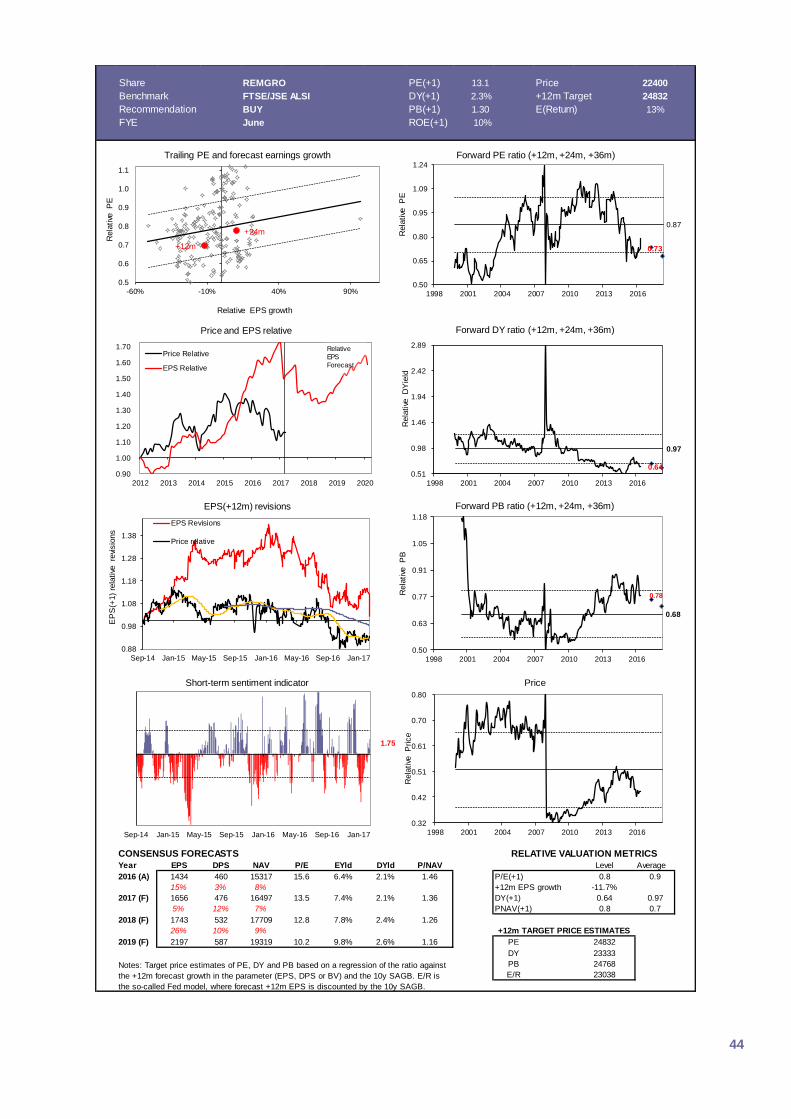
44
Share REMGRO PE(+1) 13.1 Price 22400
Benchmark FTSE/JSE ALSI DY(+1) 2.3% +12m Target 24832
Recommendation BUY PB(+1) 1.30 E(Return) 13%
FYE June ROE(+1) 10% Buy/Sell ratio 40%
CONSENSUS FORECASTS
Year EPS DPS NAV P/E EYld DYld P/NAV Level Average
2016 (A) 1434 460 15317 15.6 6.4% 2.1% 1.46 P/E(+1) 0.8 0.9
15% 3% 8% +12m EPS growth -11.7%
2017 (F) 1656 476 16497 13.5 7.4% 2.1% 1.36 DY(+1) 0.64 0.97
5% 12% 7% PNAV(+1) 0.8 0.7
2018 (F) 1743 532 17709 12.8 7.8% 2.4% 1.26
26% 10% 9%
2019 (F) 2197 587 19319 10.2 9.8% 2.6% 1.16 PE 24832
DY 23333
PB 24768
E/R 23038Notes: Target price estimates of PE, DY and PB based on a regression of the ratio against
the +12m forecast growth in the parameter (EPS, DPS or BV) and the 10y SAGB. E/R is
the so-called Fed model, where forecast +12m EPS is discounted by the 10y SAGB.
+12m TARGET PRICE ESTIMATES
RELATIVE VALUATION METRICS
0.90
1.00
1.10
1.20
1.30
1.40
1.50
1.60
1.70
2012 2013 2014 2015 2016 2017 2018 2019 2020
Price and EPS relative
Price Relative
EPS Relative
+12m
+24m
0.5
0.6
0.7
0.8
0.9
1.0
1.1
-60% -10% 40% 90%
Rela
tive
P
E
Relative EPS growth
Trailing PE and forecast earnings growth
0.73
0.87
0.50
0.65
0.80
0.95
1.09
1.24
1998 2001 2004 2007 2010 2013 2016
Rela
tive
P
E
Forward PE ratio (+12m, +24m, +36m)
0.64
0.97
0.51
0.98
1.46
1.94
2.42
2.89
1998 2001 2004 2007 2010 2013 2016
Rela
tive
D
Yie
ld
Forward DY ratio (+12m, +24m, +36m)
Relative
EPS
Forecast
0.78
0.68
0.50
0.63
0.77
0.91
1.05
1.18
1998 2001 2004 2007 2010 2013 2016
Rela
tive
P
B
Forward PB ratio (+12m, +24m, +36m)
0.88
0.98
1.08
1.18
1.28
1.38
Sep-14 Jan-15 May-15 Sep-15 Jan-16 May-16 Sep-16 Jan-17
EP
S(+
1)
rela
tive
re
visio
ns
EPS(+12m) revisions
EPS Revisions
Price relative
0.32
0.42
0.51
0.61
0.70
0.80
1998 2001 2004 2007 2010 2013 2016
Rela
tive
P
rice
Price
1.75
Sep-14 Jan-15 May-15 Sep-15 Jan-16 May-16 Sep-16 Jan-17
Short-term sentiment indicator
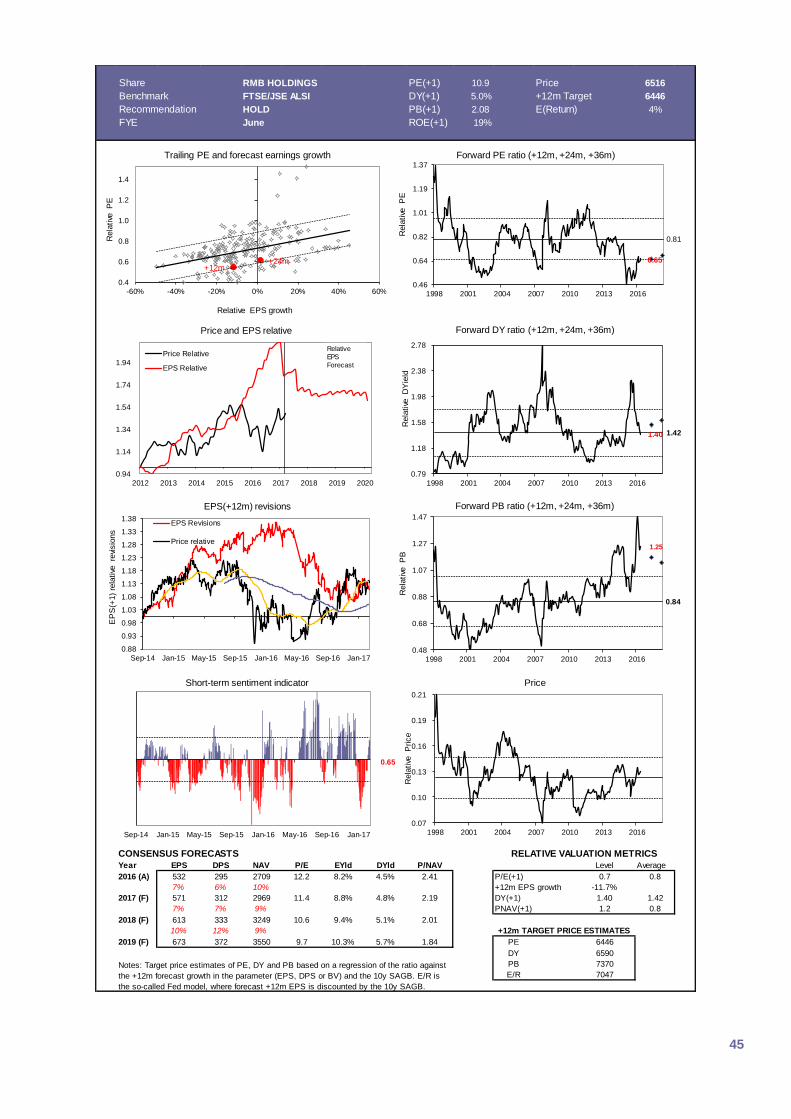
45
Share RMB HOLDINGS PE(+1) 10.9 Price 6516
Benchmark FTSE/JSE ALSI DY(+1) 5.0% +12m Target 6446
Recommendation HOLD PB(+1) 2.08 E(Return) 4%
FYE June ROE(+1) 19% Buy/Sell ratio 33%
CONSENSUS FORECASTS
Year EPS DPS NAV P/E EYld DYld P/NAV Level Average
2016 (A) 532 295 2709 12.2 8.2% 4.5% 2.41 P/E(+1) 0.7 0.8
7% 6% 10% +12m EPS growth -11.7%
2017 (F) 571 312 2969 11.4 8.8% 4.8% 2.19 DY(+1) 1.40 1.42
7% 7% 9% PNAV(+1) 1.2 0.8
2018 (F) 613 333 3249 10.6 9.4% 5.1% 2.01
10% 12% 9%
2019 (F) 673 372 3550 9.7 10.3% 5.7% 1.84 PE 6446
DY 6590
PB 7370
E/R 7047Notes: Target price estimates of PE, DY and PB based on a regression of the ratio against
the +12m forecast growth in the parameter (EPS, DPS or BV) and the 10y SAGB. E/R is
the so-called Fed model, where forecast +12m EPS is discounted by the 10y SAGB.
+12m TARGET PRICE ESTIMATES
RELATIVE VALUATION METRICS
0.94
1.14
1.34
1.54
1.74
1.94
2012 2013 2014 2015 2016 2017 2018 2019 2020
Price and EPS relative
Price Relative
EPS Relative
+12m+24m
0.4
0.6
0.8
1.0
1.2
1.4
-60% -40% -20% 0% 20% 40% 60%
Rela
tive
P
E
Relative EPS growth
Trailing PE and forecast earnings growth
0.65
0.81
0.46
0.64
0.82
1.01
1.19
1.37
1998 2001 2004 2007 2010 2013 2016
Rela
tive
P
E
Forward PE ratio (+12m, +24m, +36m)
1.40 1.42
0.79
1.18
1.58
1.98
2.38
2.78
1998 2001 2004 2007 2010 2013 2016
Rela
tive
D
Yie
ld
Forward DY ratio (+12m, +24m, +36m)
Relative
EPS
Forecast
1.25
0.84
0.48
0.68
0.88
1.07
1.27
1.47
1998 2001 2004 2007 2010 2013 2016
Rela
tive
P
B
Forward PB ratio (+12m, +24m, +36m)
0.88
0.93
0.98
1.03
1.08
1.13
1.18
1.23
1.28
1.33
1.38
Sep-14 Jan-15 May-15 Sep-15 Jan-16 May-16 Sep-16 Jan-17
EP
S(+
1)
rela
tive
re
visio
ns
EPS(+12m) revisions
EPS Revisions
Price relative
0.07
0.10
0.13
0.16
0.19
0.21
1998 2001 2004 2007 2010 2013 2016
Rela
tive
P
rice
Price
0.65
Sep-14 Jan-15 May-15 Sep-15 Jan-16 May-16 Sep-16 Jan-17
Short-term sentiment indicator
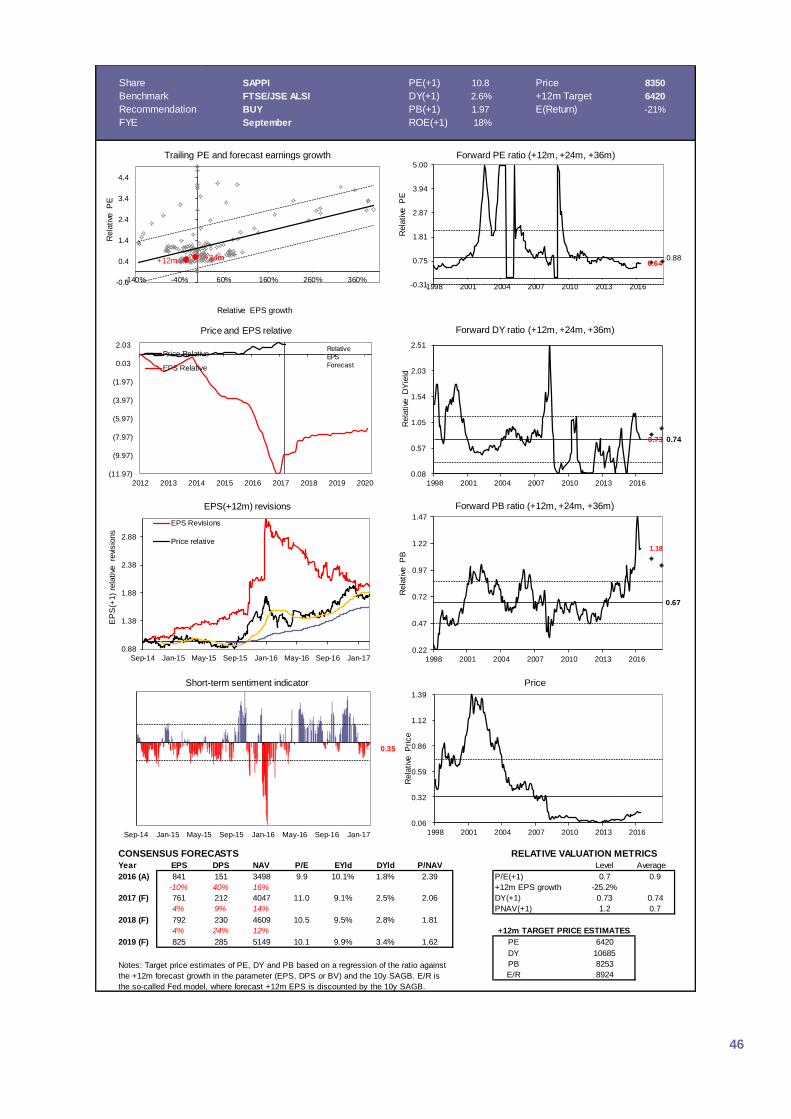
46
Share SAPPI PE(+1) 10.8 Price 8350
Benchmark FTSE/JSE ALSI DY(+1) 2.6% +12m Target 6420
Recommendation BUY PB(+1) 1.97 E(Return) -21%
FYE September ROE(+1) 18% Buy/Sell ratio 20%
CONSENSUS FORECASTS
Year EPS DPS NAV P/E EYld DYld P/NAV Level Average
2016 (A) 841 151 3498 9.9 10.1% 1.8% 2.39 P/E(+1) 0.7 0.9
-10% 40% 16% +12m EPS growth -25.2%
2017 (F) 761 212 4047 11.0 9.1% 2.5% 2.06 DY(+1) 0.73 0.74
4% 9% 14% PNAV(+1) 1.2 0.7
2018 (F) 792 230 4609 10.5 9.5% 2.8% 1.81
4% 24% 12%
2019 (F) 825 285 5149 10.1 9.9% 3.4% 1.62 PE 6420
DY 10685
PB 8253
E/R 8924Notes: Target price estimates of PE, DY and PB based on a regression of the ratio against
the +12m forecast growth in the parameter (EPS, DPS or BV) and the 10y SAGB. E/R is
the so-called Fed model, where forecast +12m EPS is discounted by the 10y SAGB.
+12m TARGET PRICE ESTIMATES
RELATIVE VALUATION METRICS
(11.97)
(9.97)
(7.97)
(5.97)
(3.97)
(1.97)
0.03
2.03
2012 2013 2014 2015 2016 2017 2018 2019 2020
Price and EPS relative
Price Relative
EPS Relative
+12m +24m
-0.6
0.4
1.4
2.4
3.4
4.4
-140% -40% 60% 160% 260% 360%
Rela
tive
P
E
Relative EPS growth
Trailing PE and forecast earnings growth
0.640.88
-0.31
0.75
1.81
2.87
3.94
5.00
1998 2001 2004 2007 2010 2013 2016
Rela
tive
P
E
Forward PE ratio (+12m, +24m, +36m)
0.73 0.74
0.08
0.57
1.05
1.54
2.03
2.51
1998 2001 2004 2007 2010 2013 2016
Rela
tive
D
Yie
ld
Forward DY ratio (+12m, +24m, +36m)
Relative
EPS
Forecast
1.18
0.67
0.22
0.47
0.72
0.97
1.22
1.47
1998 2001 2004 2007 2010 2013 2016
Rela
tive
P
B
Forward PB ratio (+12m, +24m, +36m)
0.88
1.38
1.88
2.38
2.88
Sep-14 Jan-15 May-15 Sep-15 Jan-16 May-16 Sep-16 Jan-17
EP
S(+
1)
rela
tive
re
visio
ns
EPS(+12m) revisions
EPS Revisions
Price relative
0.06
0.32
0.59
0.86
1.12
1.39
1998 2001 2004 2007 2010 2013 2016
Rela
tive
P
rice
Price
0.35
Sep-14 Jan-15 May-15 Sep-15 Jan-16 May-16 Sep-16 Jan-17
Short-term sentiment indicator
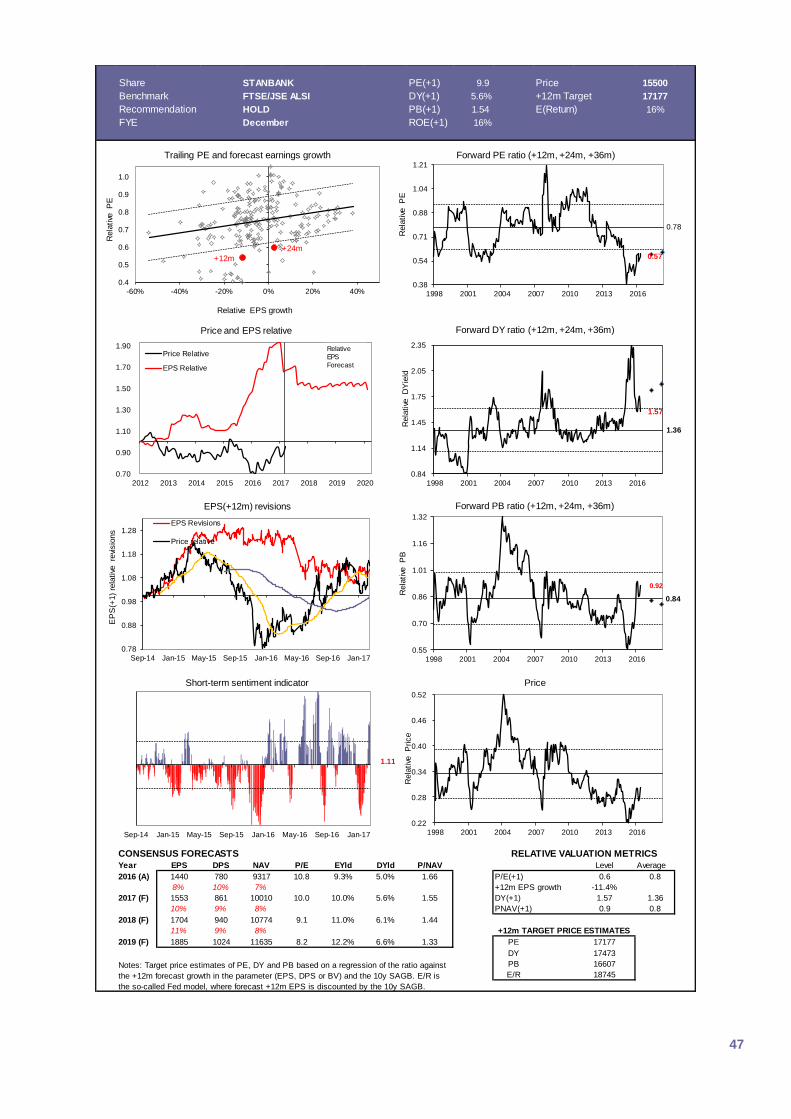
47
Share STANBANK PE(+1) 9.9 Price 15500
Benchmark FTSE/JSE ALSI DY(+1) 5.6% +12m Target 17177
Recommendation HOLD PB(+1) 1.54 E(Return) 16%
FYE December ROE(+1) 16% Buy/Sell ratio 0%
CONSENSUS FORECASTS
Year EPS DPS NAV P/E EYld DYld P/NAV Level Average
2016 (A) 1440 780 9317 10.8 9.3% 5.0% 1.66 P/E(+1) 0.6 0.8
8% 10% 7% +12m EPS growth -11.4%
2017 (F) 1553 861 10010 10.0 10.0% 5.6% 1.55 DY(+1) 1.57 1.36
10% 9% 8% PNAV(+1) 0.9 0.8
2018 (F) 1704 940 10774 9.1 11.0% 6.1% 1.44
11% 9% 8%
2019 (F) 1885 1024 11635 8.2 12.2% 6.6% 1.33 PE 17177
DY 17473
PB 16607
E/R 18745Notes: Target price estimates of PE, DY and PB based on a regression of the ratio against
the +12m forecast growth in the parameter (EPS, DPS or BV) and the 10y SAGB. E/R is
the so-called Fed model, where forecast +12m EPS is discounted by the 10y SAGB.
+12m TARGET PRICE ESTIMATES
RELATIVE VALUATION METRICS
0.70
0.90
1.10
1.30
1.50
1.70
1.90
2012 2013 2014 2015 2016 2017 2018 2019 2020
Price and EPS relative
Price Relative
EPS Relative
+12m
+24m
0.4
0.5
0.6
0.7
0.8
0.9
1.0
-60% -40% -20% 0% 20% 40%
Rela
tive
P
E
Relative EPS growth
Trailing PE and forecast earnings growth
0.57
0.78
0.38
0.54
0.71
0.88
1.04
1.21
1998 2001 2004 2007 2010 2013 2016
Rela
tive
P
E
Forward PE ratio (+12m, +24m, +36m)
1.57
1.36
0.84
1.14
1.45
1.75
2.05
2.35
1998 2001 2004 2007 2010 2013 2016
Rela
tive
D
Yie
ld
Forward DY ratio (+12m, +24m, +36m)
Relative
EPS
Forecast
0.92
0.84
0.55
0.70
0.86
1.01
1.16
1.32
1998 2001 2004 2007 2010 2013 2016
Rela
tive
P
B
Forward PB ratio (+12m, +24m, +36m)
0.78
0.88
0.98
1.08
1.18
1.28
Sep-14 Jan-15 May-15 Sep-15 Jan-16 May-16 Sep-16 Jan-17
EP
S(+
1)
rela
tive
re
visio
ns
EPS(+12m) revisions
EPS Revisions
Price relative
0.22
0.28
0.34
0.40
0.46
0.52
1998 2001 2004 2007 2010 2013 2016
Rela
tive
P
rice
Price
1.11
Sep-14 Jan-15 May-15 Sep-15 Jan-16 May-16 Sep-16 Jan-17
Short-term sentiment indicator
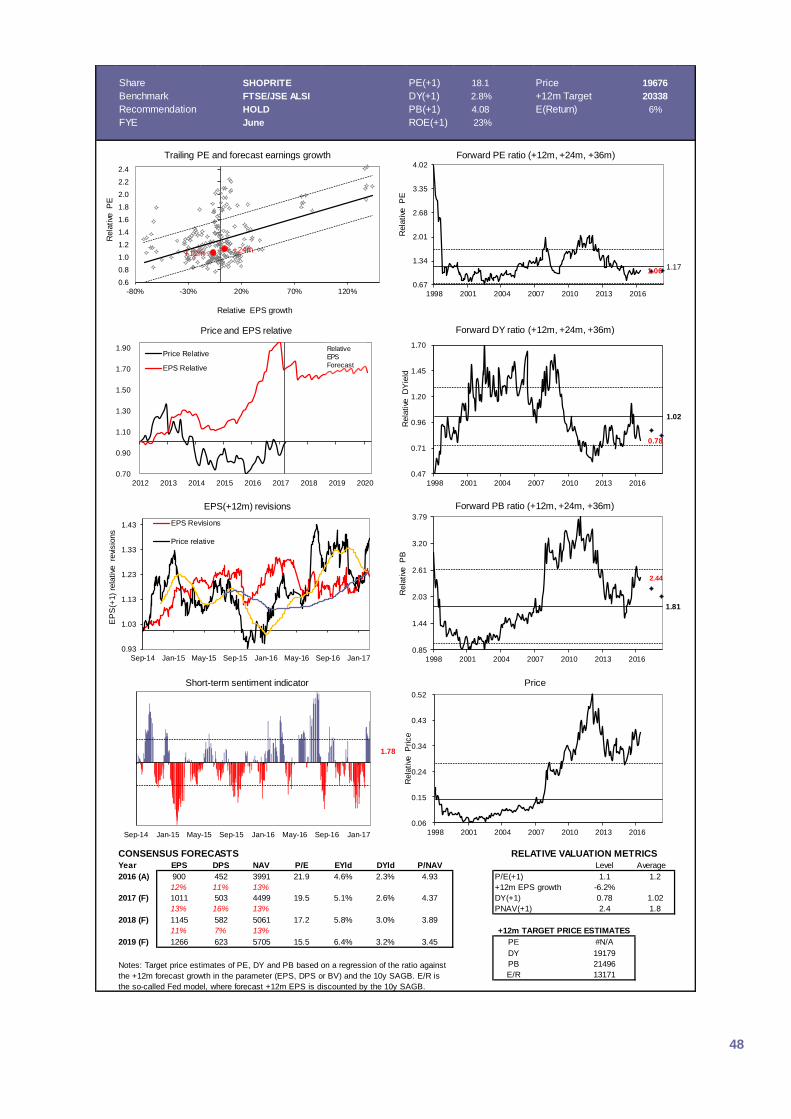
48
Share SHOPRITE PE(+1) 18.1 Price 19676
Benchmark FTSE/JSE ALSI DY(+1) 2.8% +12m Target 20338
Recommendation HOLD PB(+1) 4.08 E(Return) 6%
FYE June ROE(+1) 23% Buy/Sell ratio 43%
CONSENSUS FORECASTS
Year EPS DPS NAV P/E EYld DYld P/NAV Level Average
2016 (A) 900 452 3991 21.9 4.6% 2.3% 4.93 P/E(+1) 1.1 1.2
12% 11% 13% +12m EPS growth -6.2%
2017 (F) 1011 503 4499 19.5 5.1% 2.6% 4.37 DY(+1) 0.78 1.02
13% 16% 13% PNAV(+1) 2.4 1.8
2018 (F) 1145 582 5061 17.2 5.8% 3.0% 3.89
11% 7% 13%
2019 (F) 1266 623 5705 15.5 6.4% 3.2% 3.45 PE #N/A
DY 19179
PB 21496
E/R 13171Notes: Target price estimates of PE, DY and PB based on a regression of the ratio against
the +12m forecast growth in the parameter (EPS, DPS or BV) and the 10y SAGB. E/R is
the so-called Fed model, where forecast +12m EPS is discounted by the 10y SAGB.
+12m TARGET PRICE ESTIMATES
RELATIVE VALUATION METRICS
0.70
0.90
1.10
1.30
1.50
1.70
1.90
2012 2013 2014 2015 2016 2017 2018 2019 2020
Price and EPS relative
Price Relative
EPS Relative
+12m +24m
0.6
0.8
1.0
1.2
1.4
1.6
1.8
2.0
2.2
2.4
-80% -30% 20% 70% 120%
Rela
tive
P
E
Relative EPS growth
Trailing PE and forecast earnings growth
1.061.17
0.67
1.34
2.01
2.68
3.35
4.02
1998 2001 2004 2007 2010 2013 2016
Rela
tive
P
E
Forward PE ratio (+12m, +24m, +36m)
0.78
1.02
0.47
0.71
0.96
1.20
1.45
1.70
1998 2001 2004 2007 2010 2013 2016
Rela
tive
D
Yie
ld
Forward DY ratio (+12m, +24m, +36m)
Relative
EPS
Forecast
2.44
1.81
0.85
1.44
2.03
2.61
3.20
3.79
1998 2001 2004 2007 2010 2013 2016
Rela
tive
P
B
Forward PB ratio (+12m, +24m, +36m)
0.93
1.03
1.13
1.23
1.33
1.43
Sep-14 Jan-15 May-15 Sep-15 Jan-16 May-16 Sep-16 Jan-17
EP
S(+
1)
rela
tive
re
visio
ns
EPS(+12m) revisions
EPS Revisions
Price relative
0.06
0.15
0.24
0.34
0.43
0.52
1998 2001 2004 2007 2010 2013 2016
Rela
tive
P
rice
Price
1.78
Sep-14 Jan-15 May-15 Sep-15 Jan-16 May-16 Sep-16 Jan-17
Short-term sentiment indicator
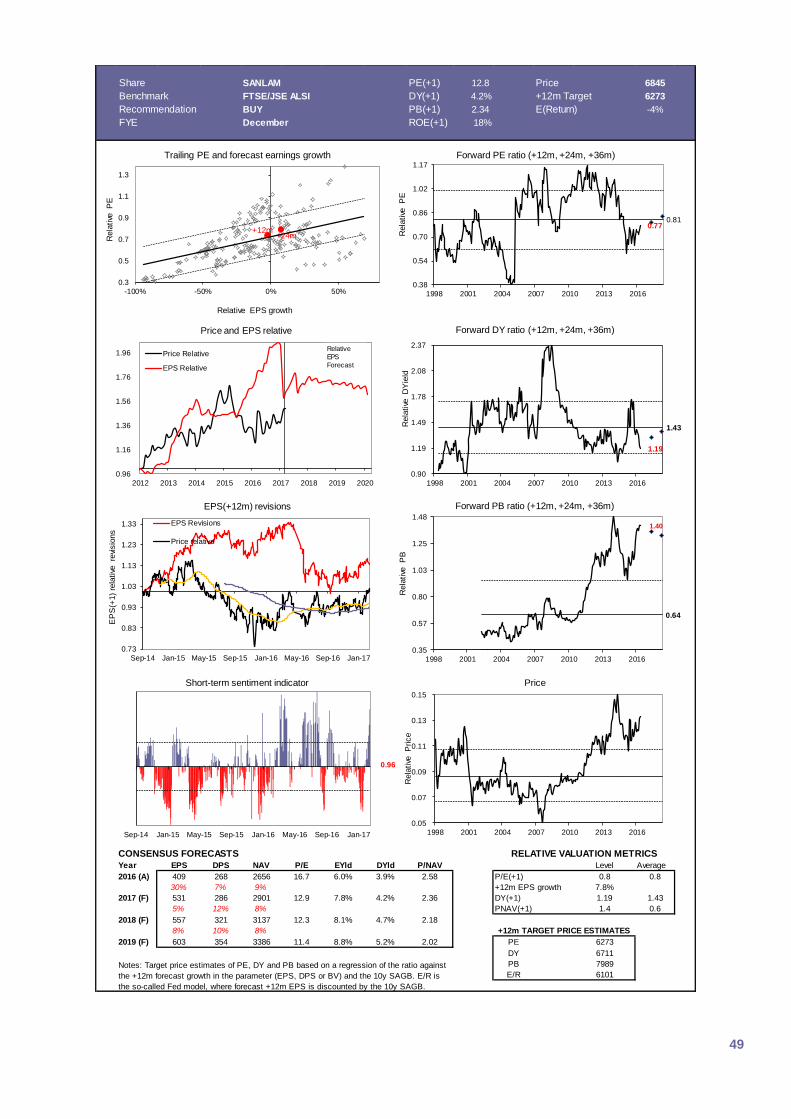
49
Share SANLAM PE(+1) 12.8 Price 6845
Benchmark FTSE/JSE ALSI DY(+1) 4.2% +12m Target 6273
Recommendation BUY PB(+1) 2.34 E(Return) -4%
FYE December ROE(+1) 18% Buy/Sell ratio 60%
CONSENSUS FORECASTS
Year EPS DPS NAV P/E EYld DYld P/NAV Level Average
2016 (A) 409 268 2656 16.7 6.0% 3.9% 2.58 P/E(+1) 0.8 0.8
30% 7% 9% +12m EPS growth 7.8%
2017 (F) 531 286 2901 12.9 7.8% 4.2% 2.36 DY(+1) 1.19 1.43
5% 12% 8% PNAV(+1) 1.4 0.6
2018 (F) 557 321 3137 12.3 8.1% 4.7% 2.18
8% 10% 8%
2019 (F) 603 354 3386 11.4 8.8% 5.2% 2.02 PE 6273
DY 6711
PB 7989
E/R 6101Notes: Target price estimates of PE, DY and PB based on a regression of the ratio against
the +12m forecast growth in the parameter (EPS, DPS or BV) and the 10y SAGB. E/R is
the so-called Fed model, where forecast +12m EPS is discounted by the 10y SAGB.
+12m TARGET PRICE ESTIMATES
RELATIVE VALUATION METRICS
0.96
1.16
1.36
1.56
1.76
1.96
2012 2013 2014 2015 2016 2017 2018 2019 2020
Price and EPS relative
Price Relative
EPS Relative
+12m+24m
0.3
0.5
0.7
0.9
1.1
1.3
-100% -50% 0% 50%
Rela
tive
P
E
Relative EPS growth
Trailing PE and forecast earnings growth
0.770.81
0.38
0.54
0.70
0.86
1.02
1.17
1998 2001 2004 2007 2010 2013 2016
Rela
tive
P
E
Forward PE ratio (+12m, +24m, +36m)
1.19
1.43
0.90
1.19
1.49
1.78
2.08
2.37
1998 2001 2004 2007 2010 2013 2016
Rela
tive
D
Yie
ld
Forward DY ratio (+12m, +24m, +36m)
Relative
EPS
Forecast
1.40
0.64
0.35
0.57
0.80
1.03
1.25
1.48
1998 2001 2004 2007 2010 2013 2016
Rela
tive
P
B
Forward PB ratio (+12m, +24m, +36m)
0.73
0.83
0.93
1.03
1.13
1.23
1.33
Sep-14 Jan-15 May-15 Sep-15 Jan-16 May-16 Sep-16 Jan-17
EP
S(+
1)
rela
tive
re
visio
ns
EPS(+12m) revisions
EPS Revisions
Price relative
0.05
0.07
0.09
0.11
0.13
0.15
1998 2001 2004 2007 2010 2013 2016
Rela
tive
P
rice
Price
0.96
Sep-14 Jan-15 May-15 Sep-15 Jan-16 May-16 Sep-16 Jan-17
Short-term sentiment indicator
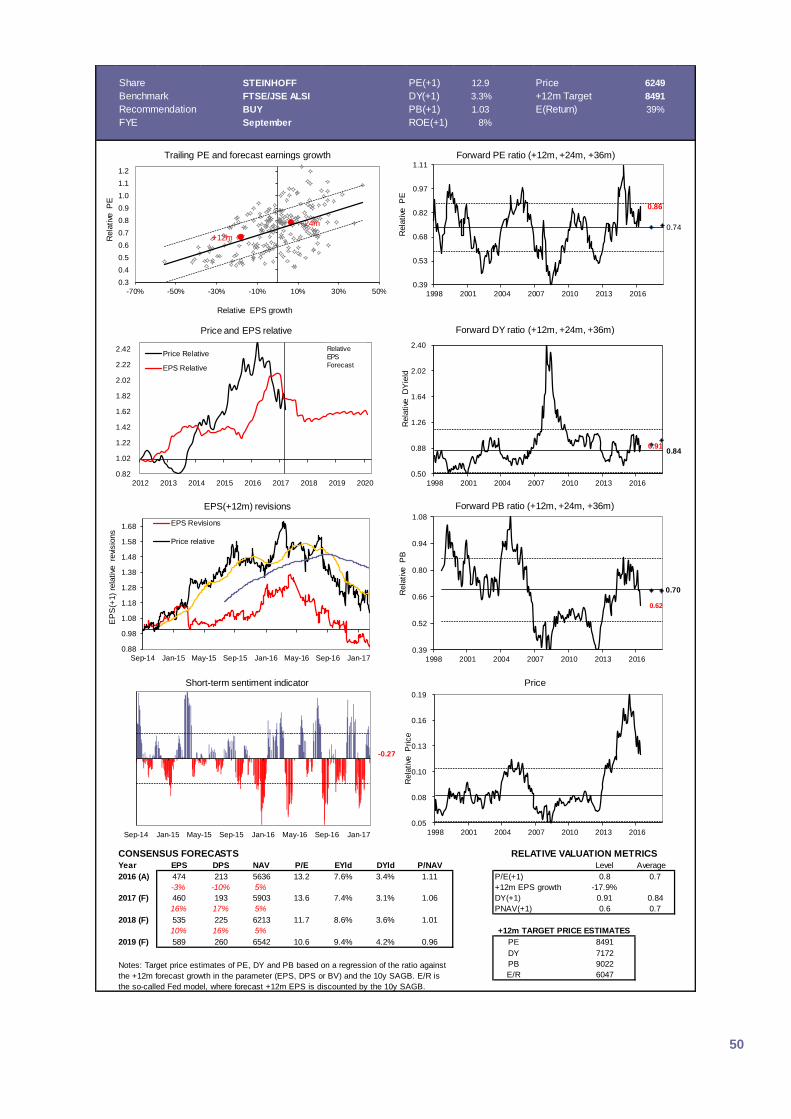
50
Share STEINHOFF PE(+1) 12.9 Price 6249
Benchmark FTSE/JSE ALSI DY(+1) 3.3% +12m Target 8491
Recommendation BUY PB(+1) 1.03 E(Return) 39%
FYE September ROE(+1) 8% Buy/Sell ratio 33%
CONSENSUS FORECASTS
Year EPS DPS NAV P/E EYld DYld P/NAV Level Average
2016 (A) 474 213 5636 13.2 7.6% 3.4% 1.11 P/E(+1) 0.8 0.7
-3% -10% 5% +12m EPS growth -17.9%
2017 (F) 460 193 5903 13.6 7.4% 3.1% 1.06 DY(+1) 0.91 0.84
16% 17% 5% PNAV(+1) 0.6 0.7
2018 (F) 535 225 6213 11.7 8.6% 3.6% 1.01
10% 16% 5%
2019 (F) 589 260 6542 10.6 9.4% 4.2% 0.96 PE 8491
DY 7172
PB 9022
E/R 6047Notes: Target price estimates of PE, DY and PB based on a regression of the ratio against
the +12m forecast growth in the parameter (EPS, DPS or BV) and the 10y SAGB. E/R is
the so-called Fed model, where forecast +12m EPS is discounted by the 10y SAGB.
+12m TARGET PRICE ESTIMATES
RELATIVE VALUATION METRICS
0.82
1.02
1.22
1.42
1.62
1.82
2.02
2.22
2.42
2012 2013 2014 2015 2016 2017 2018 2019 2020
Price and EPS relative
Price Relative
EPS Relative
+12m
+24m
0.3
0.4
0.5
0.6
0.7
0.8
0.9
1.0
1.1
1.2
-70% -50% -30% -10% 10% 30% 50%
Rela
tive
P
E
Relative EPS growth
Trailing PE and forecast earnings growth
0.86
0.74
0.39
0.53
0.68
0.82
0.97
1.11
1998 2001 2004 2007 2010 2013 2016
Rela
tive
P
E
Forward PE ratio (+12m, +24m, +36m)
0.910.84
0.50
0.88
1.26
1.64
2.02
2.40
1998 2001 2004 2007 2010 2013 2016
Rela
tive
D
Yie
ld
Forward DY ratio (+12m, +24m, +36m)
Relative
EPS
Forecast
0.62
0.70
0.39
0.52
0.66
0.80
0.94
1.08
1998 2001 2004 2007 2010 2013 2016
Rela
tive
P
B
Forward PB ratio (+12m, +24m, +36m)
0.88
0.98
1.08
1.18
1.28
1.38
1.48
1.58
1.68
Sep-14 Jan-15 May-15 Sep-15 Jan-16 May-16 Sep-16 Jan-17
EP
S(+
1)
rela
tive
re
visio
ns
EPS(+12m) revisions
EPS Revisions
Price relative
0.05
0.08
0.10
0.13
0.16
0.19
1998 2001 2004 2007 2010 2013 2016
Rela
tive
P
rice
Price
-0.27
Sep-14 Jan-15 May-15 Sep-15 Jan-16 May-16 Sep-16 Jan-17
Short-term sentiment indicator
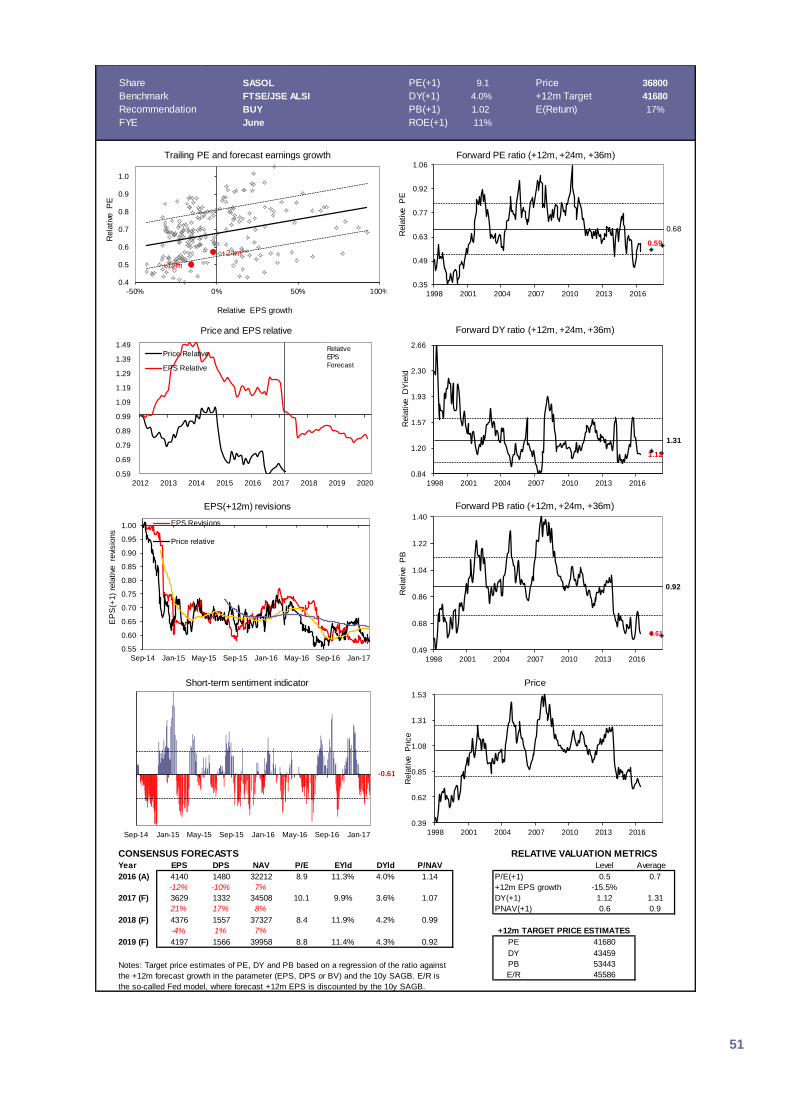
51
Share SASOL PE(+1) 9.1 Price 36800
Benchmark FTSE/JSE ALSI DY(+1) 4.0% +12m Target 41680
Recommendation BUY PB(+1) 1.02 E(Return) 17%
FYE June ROE(+1) 11% Buy/Sell ratio 33%
CONSENSUS FORECASTS
Year EPS DPS NAV P/E EYld DYld P/NAV Level Average
2016 (A) 4140 1480 32212 8.9 11.3% 4.0% 1.14 P/E(+1) 0.5 0.7
-12% -10% 7% +12m EPS growth -15.5%
2017 (F) 3629 1332 34508 10.1 9.9% 3.6% 1.07 DY(+1) 1.12 1.31
21% 17% 8% PNAV(+1) 0.6 0.9
2018 (F) 4376 1557 37327 8.4 11.9% 4.2% 0.99
-4% 1% 7%
2019 (F) 4197 1566 39958 8.8 11.4% 4.3% 0.92 PE 41680
DY 43459
PB 53443
E/R 45586Notes: Target price estimates of PE, DY and PB based on a regression of the ratio against
the +12m forecast growth in the parameter (EPS, DPS or BV) and the 10y SAGB. E/R is
the so-called Fed model, where forecast +12m EPS is discounted by the 10y SAGB.
+12m TARGET PRICE ESTIMATES
RELATIVE VALUATION METRICS
0.59
0.69
0.79
0.89
0.99
1.09
1.19
1.29
1.39
1.49
2012 2013 2014 2015 2016 2017 2018 2019 2020
Price and EPS relative
Price Relative
EPS Relative
+12m
+24m
0.4
0.5
0.6
0.7
0.8
0.9
1.0
-50% 0% 50% 100%
Rela
tive
P
E
Relative EPS growth
Trailing PE and forecast earnings growth
0.59
0.68
0.35
0.49
0.63
0.77
0.92
1.06
1998 2001 2004 2007 2010 2013 2016
Rela
tive
P
E
Forward PE ratio (+12m, +24m, +36m)
1.12
1.31
0.84
1.20
1.57
1.93
2.30
2.66
1998 2001 2004 2007 2010 2013 2016
Rela
tive
D
Yie
ld
Forward DY ratio (+12m, +24m, +36m)
Relative
EPS
Forecast
0.61
0.92
0.49
0.68
0.86
1.04
1.22
1.40
1998 2001 2004 2007 2010 2013 2016
Rela
tive
P
B
Forward PB ratio (+12m, +24m, +36m)
0.55
0.60
0.65
0.70
0.75
0.80
0.85
0.90
0.95
1.00
Sep-14 Jan-15 May-15 Sep-15 Jan-16 May-16 Sep-16 Jan-17
EP
S(+
1)
rela
tive
re
visio
ns
EPS(+12m) revisions
EPS Revisions
Price relative
0.39
0.62
0.85
1.08
1.31
1.53
1998 2001 2004 2007 2010 2013 2016
Rela
tive
P
rice
Price
-0.61
Sep-14 Jan-15 May-15 Sep-15 Jan-16 May-16 Sep-16 Jan-17
Short-term sentiment indicator
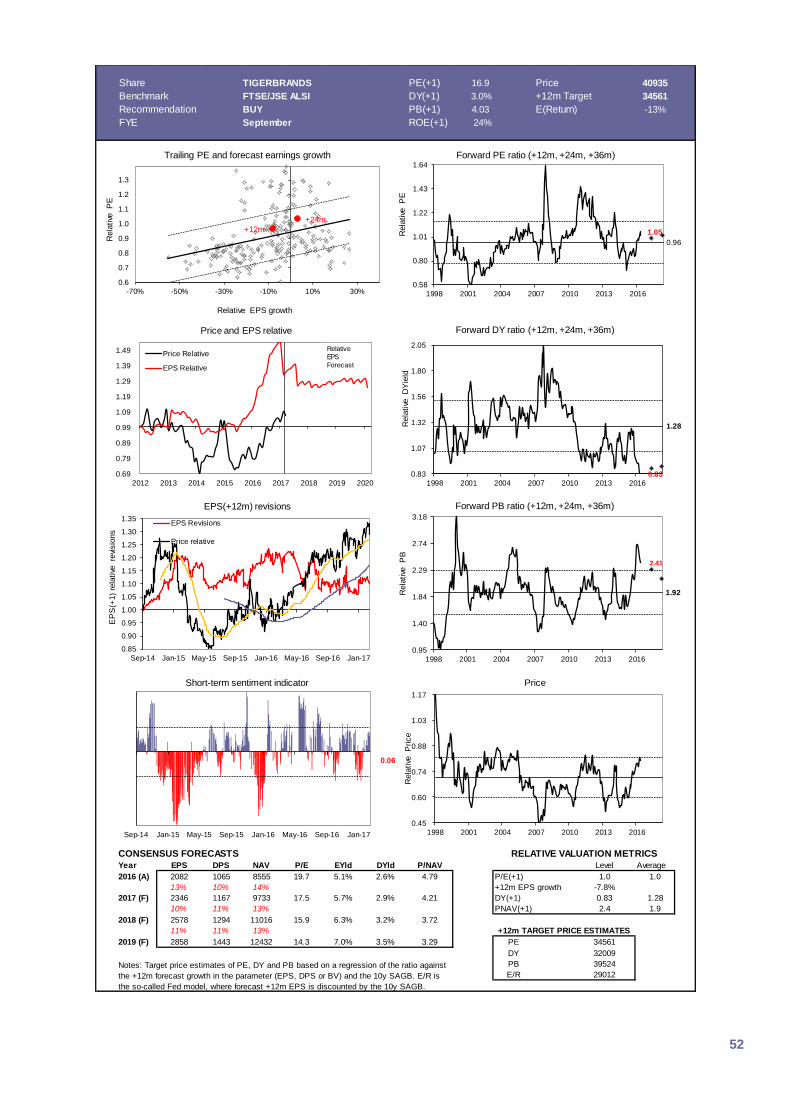
52
Share TIGERBRANDS PE(+1) 16.9 Price 40935
Benchmark FTSE/JSE ALSI DY(+1) 3.0% +12m Target 34561
Recommendation BUY PB(+1) 4.03 E(Return) -13%
FYE September ROE(+1) 24% Buy/Sell ratio 30%
CONSENSUS FORECASTS
Year EPS DPS NAV P/E EYld DYld P/NAV Level Average
2016 (A) 2082 1065 8555 19.7 5.1% 2.6% 4.79 P/E(+1) 1.0 1.0
13% 10% 14% +12m EPS growth -7.8%
2017 (F) 2346 1167 9733 17.5 5.7% 2.9% 4.21 DY(+1) 0.83 1.28
10% 11% 13% PNAV(+1) 2.4 1.9
2018 (F) 2578 1294 11016 15.9 6.3% 3.2% 3.72
11% 11% 13%
2019 (F) 2858 1443 12432 14.3 7.0% 3.5% 3.29 PE 34561
DY 32009
PB 39524
E/R 29012Notes: Target price estimates of PE, DY and PB based on a regression of the ratio against
the +12m forecast growth in the parameter (EPS, DPS or BV) and the 10y SAGB. E/R is
the so-called Fed model, where forecast +12m EPS is discounted by the 10y SAGB.
+12m TARGET PRICE ESTIMATES
RELATIVE VALUATION METRICS
0.69
0.79
0.89
0.99
1.09
1.19
1.29
1.39
1.49
2012 2013 2014 2015 2016 2017 2018 2019 2020
Price and EPS relative
Price Relative
EPS Relative
+12m
+24m
0.6
0.7
0.8
0.9
1.0
1.1
1.2
1.3
-70% -50% -30% -10% 10% 30%
Rela
tive
P
E
Relative EPS growth
Trailing PE and forecast earnings growth
1.05
0.96
0.58
0.80
1.01
1.22
1.43
1.64
1998 2001 2004 2007 2010 2013 2016
Rela
tive
P
E
Forward PE ratio (+12m, +24m, +36m)
0.83
1.28
0.83
1.07
1.32
1.56
1.80
2.05
1998 2001 2004 2007 2010 2013 2016
Rela
tive
D
Yie
ld
Forward DY ratio (+12m, +24m, +36m)
Relative
EPS
Forecast
2.41
1.92
0.95
1.40
1.84
2.29
2.74
3.18
1998 2001 2004 2007 2010 2013 2016
Rela
tive
P
B
Forward PB ratio (+12m, +24m, +36m)
0.85
0.90
0.95
1.00
1.05
1.10
1.15
1.20
1.25
1.30
1.35
Sep-14 Jan-15 May-15 Sep-15 Jan-16 May-16 Sep-16 Jan-17
EP
S(+
1)
rela
tive
re
visio
ns
EPS(+12m) revisions
EPS Revisions
Price relative
0.45
0.60
0.74
0.88
1.03
1.17
1998 2001 2004 2007 2010 2013 2016
Rela
tive
P
rice
Price
0.06
Sep-14 Jan-15 May-15 Sep-15 Jan-16 May-16 Sep-16 Jan-17
Short-term sentiment indicator
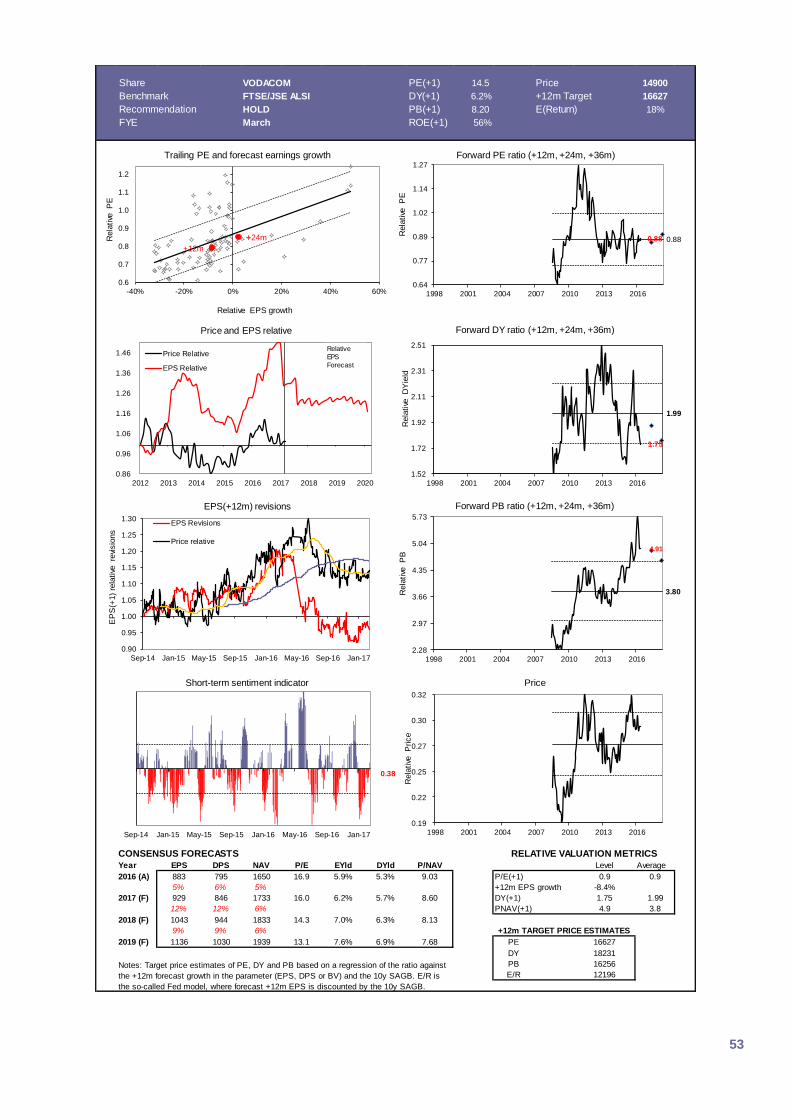
53
Share VODACOM PE(+1) 14.5 Price 14900
Benchmark FTSE/JSE ALSI DY(+1) 6.2% +12m Target 16627
Recommendation HOLD PB(+1) 8.20 E(Return) 18%
FYE March ROE(+1) 56% Buy/Sell ratio 44%
CONSENSUS FORECASTS
Year EPS DPS NAV P/E EYld DYld P/NAV Level Average
2016 (A) 883 795 1650 16.9 5.9% 5.3% 9.03 P/E(+1) 0.9 0.9
5% 6% 5% +12m EPS growth -8.4%
2017 (F) 929 846 1733 16.0 6.2% 5.7% 8.60 DY(+1) 1.75 1.99
12% 12% 6% PNAV(+1) 4.9 3.8
2018 (F) 1043 944 1833 14.3 7.0% 6.3% 8.13
9% 9% 6%
2019 (F) 1136 1030 1939 13.1 7.6% 6.9% 7.68 PE 16627
DY 18231
PB 16256
E/R 12196Notes: Target price estimates of PE, DY and PB based on a regression of the ratio against
the +12m forecast growth in the parameter (EPS, DPS or BV) and the 10y SAGB. E/R is
the so-called Fed model, where forecast +12m EPS is discounted by the 10y SAGB.
+12m TARGET PRICE ESTIMATES
RELATIVE VALUATION METRICS
0.86
0.96
1.06
1.16
1.26
1.36
1.46
2012 2013 2014 2015 2016 2017 2018 2019 2020
Price and EPS relative
Price Relative
EPS Relative
+12m
+24m
0.6
0.7
0.8
0.9
1.0
1.1
1.2
-40% -20% 0% 20% 40% 60%
Rela
tive
P
E
Relative EPS growth
Trailing PE and forecast earnings growth
0.88 0.88
0.64
0.77
0.89
1.02
1.14
1.27
1998 2001 2004 2007 2010 2013 2016
Rela
tive
P
E
Forward PE ratio (+12m, +24m, +36m)
1.75
1.99
1.52
1.72
1.92
2.11
2.31
2.51
1998 2001 2004 2007 2010 2013 2016
Rela
tive
D
Yie
ld
Forward DY ratio (+12m, +24m, +36m)
Relative
EPS
Forecast
4.91
3.80
2.28
2.97
3.66
4.35
5.04
5.73
1998 2001 2004 2007 2010 2013 2016
Rela
tive
P
B
Forward PB ratio (+12m, +24m, +36m)
0.90
0.95
1.00
1.05
1.10
1.15
1.20
1.25
1.30
Sep-14 Jan-15 May-15 Sep-15 Jan-16 May-16 Sep-16 Jan-17
EP
S(+
1)
rela
tive
re
visio
ns
EPS(+12m) revisions
EPS Revisions
Price relative
0.19
0.22
0.25
0.27
0.30
0.32
1998 2001 2004 2007 2010 2013 2016
Rela
tive
P
rice
Price
0.38
Sep-14 Jan-15 May-15 Sep-15 Jan-16 May-16 Sep-16 Jan-17
Short-term sentiment indicator
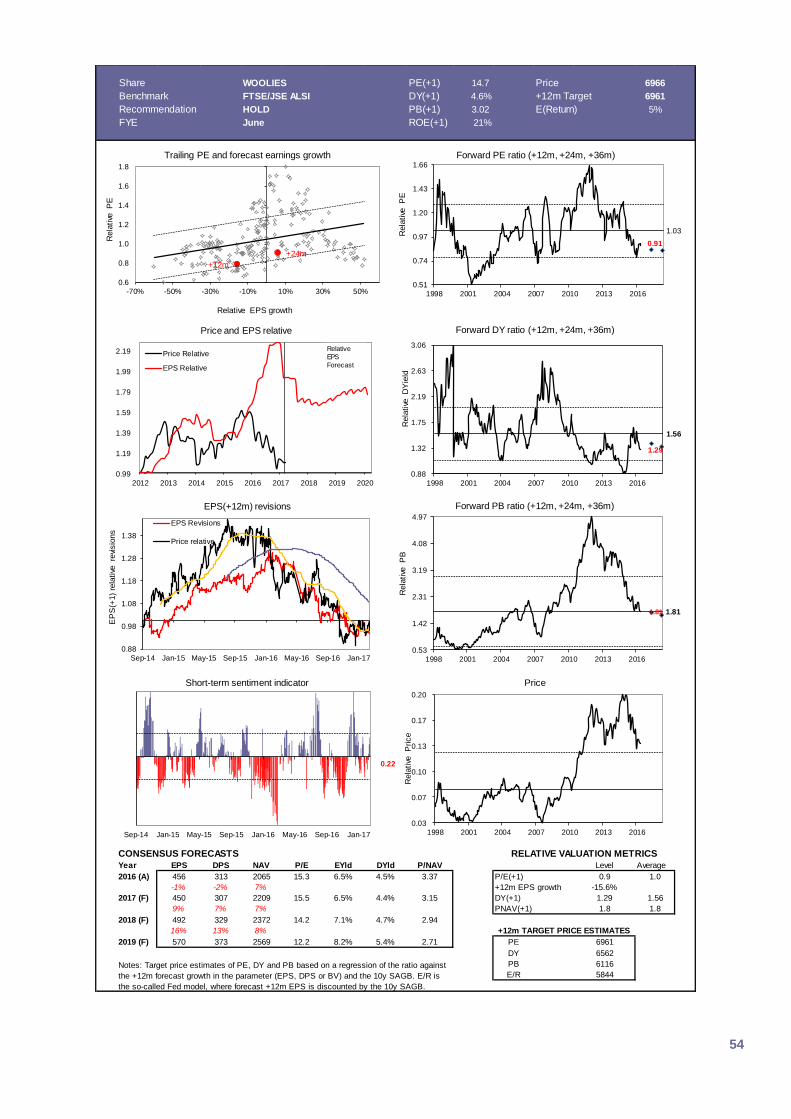
54
Share WOOLIES PE(+1) 14.7 Price 6966
Benchmark FTSE/JSE ALSI DY(+1) 4.6% +12m Target 6961
Recommendation HOLD PB(+1) 3.02 E(Return) 5%
FYE June ROE(+1) 21% Buy/Sell ratio 29%
CONSENSUS FORECASTS
Year EPS DPS NAV P/E EYld DYld P/NAV Level Average
2016 (A) 456 313 2065 15.3 6.5% 4.5% 3.37 P/E(+1) 0.9 1.0
-1% -2% 7% +12m EPS growth -15.6%
2017 (F) 450 307 2209 15.5 6.5% 4.4% 3.15 DY(+1) 1.29 1.56
9% 7% 7% PNAV(+1) 1.8 1.8
2018 (F) 492 329 2372 14.2 7.1% 4.7% 2.94
16% 13% 8%
2019 (F) 570 373 2569 12.2 8.2% 5.4% 2.71 PE 6961
DY 6562
PB 6116
E/R 5844Notes: Target price estimates of PE, DY and PB based on a regression of the ratio against
the +12m forecast growth in the parameter (EPS, DPS or BV) and the 10y SAGB. E/R is
the so-called Fed model, where forecast +12m EPS is discounted by the 10y SAGB.
+12m TARGET PRICE ESTIMATES
RELATIVE VALUATION METRICS
0.99
1.19
1.39
1.59
1.79
1.99
2.19
2012 2013 2014 2015 2016 2017 2018 2019 2020
Price and EPS relative
Price Relative
EPS Relative
+12m
+24m
0.6
0.8
1.0
1.2
1.4
1.6
1.8
-70% -50% -30% -10% 10% 30% 50%
Rela
tive
P
E
Relative EPS growth
Trailing PE and forecast earnings growth
0.91
1.03
0.51
0.74
0.97
1.20
1.43
1.66
1998 2001 2004 2007 2010 2013 2016
Rela
tive
P
E
Forward PE ratio (+12m, +24m, +36m)
1.29
1.56
0.88
1.32
1.75
2.19
2.63
3.06
1998 2001 2004 2007 2010 2013 2016
Rela
tive
D
Yie
ld
Forward DY ratio (+12m, +24m, +36m)
Relative
EPS
Forecast
1.81 1.81
0.53
1.42
2.31
3.19
4.08
4.97
1998 2001 2004 2007 2010 2013 2016
Rela
tive
P
B
Forward PB ratio (+12m, +24m, +36m)
0.88
0.98
1.08
1.18
1.28
1.38
Sep-14 Jan-15 May-15 Sep-15 Jan-16 May-16 Sep-16 Jan-17
EP
S(+
1)
rela
tive
re
visio
ns
EPS(+12m) revisions
EPS Revisions
Price relative
0.03
0.07
0.10
0.13
0.17
0.20
1998 2001 2004 2007 2010 2013 2016
Rela
tive
P
rice
Price
0.22
Sep-14 Jan-15 May-15 Sep-15 Jan-16 May-16 Sep-16 Jan-17
Short-term sentiment indicator

55
Sandton Cape Town Durban
Afrifocus House, 31B Impala Rd Chislehurston, Sandton 2196 Tel: +27 11 290-7800 Fax: +27 11 290-7878
Ground Floor, North Wing Great Westerford 240 Main Road, Rondebosch Cape Town 7441 Tel: +27 21 528-9900
Suite 119, 1st Floor, II Palazzo 5 Zenith Dr, Umhlanga Rocks 4320 Tel: +27 31 584-6491 Fax: +27 31 584-6847
Disclaimer
This publication has been issued by CIC. It is confidential and is for use of Afrifocus, CIC, GSN North America and/or the affiliates of the aforementioned and their clients only. It shall not be reproduced in part or in whole without the express permission of the aforementioned parties. The information contained herein has been obtained from sources CIC believe to be reliable, but neither CIC nor any of its affiliates accept responsibility for any loss or liability arising from the use hereof, neither does CIC or its affiliates make any representation as to the accuracy or completeness of any information contained herein. Any opinions, forecasts or estimates herein constitute a judgement as at the date of this publication. There is no assurance that future results or events will be consistent with such opinions, forecasts or estimates. Past performance should not be taken as an indication or guarantee of future performance and accordingly no representation or warranty, express or implied is made regarding future performance. The information in this report and the report itself is subject to change without notice. The research report as well as any other related documents may be incomplete, condensed and/or may not contain all material information regarding the subject of the research and/or its group companies (including subsidiaries): its accuracy cannot therefore be guaranteed. There is no obligation on CIC or its affiliates to update this research report or any of the information, opinions, forecasts or estimates contained herein. The inventories of CIC, its affiliates, directors or staff may from time to time include the securities mentioned in this report. A black-out period is stipulated, running from the date of the beginning of drafting of the research memorandum until 3 months after its publication, during which time the financial analyst/s compiling such report is refrained from trading on their own account in shares in relation with the issuers and sectors they are monitoring CIC or its affiliates may have issued other reports that are inconsistent with, and reach different conclusions to, the information presented in this report. Such reports reflect the different assumptions, views and analytical methods from the analysts who prepared them. The value of any security mentioned in this report may rise as well as fall. Foreign currency denominated securities may be subject to exchange rate fluctuations that may have a positive or negative impact on the value, price or income of any such securities. Certain transactions, including those involving derivative instruments, can give rise to substantial risk and are not suitable to all investors. This report does not provide implicit or explicit advice and should not be construed as to do so. Specifically, it does not take into account the objectives, financial situation or needs of any person or institution. Investors should not act or forebear to do anything on the basis of this report. Before entering into any arrangement or transaction, investors must consider if it is appropriate given their unique circumstances and seek financial advice where needed. CIC and Afrifocus have concluded a Research Distribution Agreement that gives CIC exclusive distribution in Europe, the US and Canada of the Afrifocus and its affiliates’ research product. Distribution of the Afrifocus and its affiliates research product in Europe, the US and Canada can be made directly or via its subsidiary GSN North America, Inc or ESN European Securities Network LLP members to its actual and potential customers. For the US territory and Canada, GSN North America, Inc and CIC, a member of ESN, have signed an agreement that gives GSN North America, Inc exclusive distribution rights for these Territories. The product will be distributed in these Territories under the GSN North America brand. Afrifocus Securities (Pty) Ltd, is a member of and, is regulated by, the JSE (Johannesburg Stock Exchange). CM-CIC Market Solutions is a business unit of CIC (Crédit Industriel et Commercial), Groupe CM11-CIC, is an ACPR registered credit institution. CIC is a member of the European Securities Network LLP (“ESN”) and regulated by AMF (Autorité des Marchés Financiers française). CIC is located at 6 avenue de Provence, 75452 Paris Cedex 09, France GSN North America is a US broker dealer regulated by FINRA and SIPC. CIC is a majority shareholder of GSN North America, Inc. Others shareholders of GSN North America are Banca Akros Spa and Beka Finance. GSN North America, Inc is a mere distributor of Afrifocus or its affiliate’s research product only to its
professional clients.).