lca report addendum - about bank of america...iso-conformant lca report lca comparison of bank of...
TRANSCRIPT

LCA REPORT ADDENDUM LCA COMPARISON OF BANK OF
AMERICA’S ELECTRONIC AND
PAPER STATEMENTS
CLIENT: BANK OF AMERICA
VERSION 1
CONFIDENTIAL
DATE: NOVEMBER 13, 2018
WSP USA
4840 PEARL EAST CIRCLE, SUITE 300W
BOULDER, CO 80301
USA
PHONE: +1 303-551-0933
WSP.COM
Comparative LCA of Electronic and Paper Statements
Bank of America
WSP USA
November 13, 2018
Page i

ISO-CONFORMANT LCA REPORT
LCA Comparison of Bank of America’s Electronic and Paper Statements
CLIENT
Bank of America
100 North Tryon St.
NC1-007-15-22
Charlotte, NC 28255
USA
CLIENT CONTACTS
WSP
WSP USA
4840 Pearl East Circle, Suite 300W
Boulder, CO 80301
USA
Tel: +1 303-551-0933
WSP CONTACTS
Julie Sinistore, PhD
Eric Christensen
Jessica Lab
Comparative LCA of Electronic and Paper Statements
Bank of America
WSP USA
November 13, 2018
Page ii

TABLE OF CONTENTS
A D D E N D U M E X E C U T I V E S U M M A R Y .......................................................................1
1 SUMMARY OF REVISIONS TO PAPER PRODUCTION ENERGY ......................5
1.1 Material Production for Statements and Envelopes 5
2 ADDENDUM LIFE CYCLE IMPACT ASSESSMENT ..............................................6
2.1 Summary of results 6
2.2 LCIA Results 6
3 ADDENDUM LIFE CYCLE INTERPRETATION ...................................................11
3.1 Sensitivity Analysis 11
3.2 Identification of Relevant Findings 13
3.3 Conclusions 14
3.4 Limitations and Assumptions 15
4 ADDENDUM REFERENCES ......................................................................................16
5 ADDENDUM CRITICAL REVIEW STATEMENT .................................................18
E X E C U T I V E S U M M A R Y ....................................................................................................21
6 GOAL OF THE STUDY ................................................................................................26
6.1 Reasons for Carrying out the Study 26
6.2 Intended Applications 26
6.3 Target Audience 26
6.4 Comparative Assertion for Public Disclosure 26
7 SCOPE OF THE STUDY ..............................................................................................27
7.1 Function 27
7.2 Functional Unit 27
7.3 System Boundary 27
7.4 Energy and Material Consumption 31
7.5 Energy Production 31
7.6 Cut-off Criteria 31
Comparative LCA of Electronic and Paper Statements
Bank of America
WSP USA
July 17, 2018
Page iii

8 LIFE CYCLE INVENTORY ANALYSIS ...................................................................33
8.1 Data Collection Procedures 33
8.2 Unit Processes 41
8.3 Calculation Procedures 41
8.4 Data Validation 41
8.5 Sensitivity Analysis 41
9 LIFE CYCLE IMPACT ASSESSMENT .....................................................................44
9.1 LCIA Procedures and Calculations 44
9.2 LCIA Results 44
9.3 LCIA Results Limitations Relative to DEFINED Goals 50
9.4 Impact Categories and Indicators Considered 51
9.5 Description of Practitioner Value Choices 51
9.6 Statement of Relativity 51
10 LIFE CYCLE INTERPRETATION ............................................................................52
10.1 Data Quality Assessment 52
10.2 Sensitivity Analysis 54
10.3 Identification of Relevant Findings 57
10.4 Conclusions 59
10.5 Limitations and Assumptions 59
11 REFERENCES ...............................................................................................................60
12 CRITICAL REVIEW STATEMENT ..........................................................................62
Comparative LCA of Electronic and Paper Statements
Bank of America
WSP USA
July 17, 2018
Page iv

TABLES
Addendum Table 1: Greenhouse gas emissions by life cycle phase by statement type, per statement 7
Addendum Table 2: Comparison of Paper GHG emissions from four sources, per kg of paper 10
Addendum Table 3: GHG emissions and BWC difference between paper and online statement based on percent of online
statements printed 11
Addendum Table 4: GHG emissions and BWC difference between paper and online statement based on the no shredding
and recycling case 12
Addendum Table 5: GHG emissions and BWC difference between paper and online statement based on the high internet
electricity case 13
Table 1: Mass of paper from mill to DFS 34
Table 2: Ink weight 35
Table 3: Paper statement inputs 36
Table 4: USPS transportation paths 36
Table 5: Disposal rates and methods 37
Table 6: Internet electricity adjustment calculations 37
Table 7: Energy use per viewing device 39
Table 8: Transportation required for materials to print an online statement 40
Table 9: Printer energy by type 40
Table 10: End of life of printed statements 41
Table 11: Scenarios for online statements 42
Table 12: Greenhouse gas emissions by life cycle phase by statement type, per statement 45
Table 13: BWC results by life cycle phase by statement type, per statement 48
Table 14: Impact categories, units and methods 51
Table 15: Data quality evaluation 52
Table 16: Comparison of Paper GHG emissions from four sources, per kg of paper 54
Table 17: GHG emissions and BWC difference between paper and online statement based on percent of online statements
printed 55
Table 18: GHG emissions impact per online statement print scenarios 56
Table 19: BWC impact per online statement print scenarios 56
Table 20: GHG emissions and BWC difference between paper and online statement based on the no shredding and
recycling case 56
Table 21: GHG emissions and BWC difference between paper and online statement based on the high internet electricity
case 57
Comparative LCA of Electronic and Paper Statements
Bank of America
WSP USA
July 17, 2018
Page v

FIGURES
Addendum Figure 1: Relative greenhouse gas contribution per life cycle phase for paper statements, per statement 8
Addendum Figure 2: Relative greenhouse gas contribution per life cycle phase for online statements, per statement 8
Addendum Figure 3: Paper production greenhouse gas emissions, per paper statement 9
Addendum Figure 4: GHG emissions difference between paper and online statements across sensitivity analyses 11
Figure 5: Process Maps 30
Figure 6: Relative greenhouse gas contribution per life cycle phase for paper statements, per statement 46
Figure 7: Relative greenhouse gas contribution per life cycle phase for online statements, per statement 46
Figure 8: Paper production greenhouse gas emissions, per paper statement 47
Figure 9: Relative BWC contribution per life cycle phase for paper statements, per statement 49
Figure 10: Relative BWC contribution per life cycle phase for online statements, per statement 49
Figure 11: Paper production BWC, per paper statement 50
Figure 12: GHG emissions difference between paper and online statements across sensitivity analyses 55
Figure 13: BWC difference between paper and online statement across sensitivity analyses 55
Comparative LCA of Electronic and Paper Statements
Bank of America
WSP USA
July 17, 2018
Page vi

ADDENDUM EXECUTIVE SUMMARYBank of America sought understanding of the relative GHG emission and water impacts of delivering bank statements electronically
and by paper copy with the intention to communicate these insights internally and externally. This study was conducted to meet the
requests of the bank’s stakeholders who are interested in the GHG emission and water impacts associated with delivering statements
electronically and in paper format through the mail. Online banking (OLB) is becoming increasingly popular and many customers
have opted to receive statements only electronically. The question of which statement delivery method reduces GHG emissions and
water consumption arises often both internally at the bank and externally from customers. Many other institutions that deliver
information both electronically and in paper format have made assertions about which method of delivery is environmentally
preferable with varying levels of substantiation.
Bank of America recognizes that the comparative GHG emissions and water impacts from paper versus electronic statements
depend greatly on the specifics of the production, transportation, use, and disposal systems. Therefore, the company commissioned
this study to determine the difference in GHG emissions and water consumption from the life cycle of their company’s specific
statement delivery systems. This study was conducted to support a comparative assertion for public disclosure. The comparison is
not on an absolute basis, but rather the difference in GHG emissions and water consumption between the two statement delivery
methods. The study focuses only on Bank of America’s statement production and delivery methods and is not intended to be
generalized through comparisons of electronic and paper delivery of information from any other institution. The study is limited
only to Bank of America’s checking, savings, home loan, credit card, and investment account statements and, thus, does not
consider products with equal or comparable functionality produced by other institutions.1 After completing the original study, one
mill that contributes the most paper to the statement paper considered in this study reduced the amount of coal it consumed on-site
to zero and replaced it with natural gas. Therefore, the results and analysis have been updated in this addendum to account for this
change.
The primary finding of this cradle-to-grave life cycle assessment is that, based on the assumptions in this study, available data, and
under a scenario where 25% of customers print their online statements at home, the reduction in GHG emissions between paper and
online statements is estimated to be 67 g CO2e and the reduction in blue water consumption (BWC) is 0.25 gallons of water per
statement (see Figure ES1: Reduction in greenhouse gas emissions and BWC per statement realized by using electronic versus
paper statements). If all of Bank of America statements mailed in a year (551 million statements) were delivered online instead of
mailed as paper statements, this would result in a reduction of approximately 37,000 metric tons of GHG emissions and 136 million
gallons of blue water consumed when using electronic instead of paper delivery. This is approximately equivalent to the GHG
emissions from the electricity use in 5,500 United States homes in a year (USEPA, 2017) and the water contained in 206 Olympic
swimming pools. This amounts to 0.001% of the GHG emissions emitted in the United States in 2015 (EPA, 2017) and 0.0001% of
the water use in the United States in 2010 (USGS, 2010). This is equal to 3% of GHG emissions and 6% of water use from Bank of
America’s 2016 global operations (Bank of America Corporation, 2016).2 In terms of paper savings, if all of Bank of America
statements mailed in a year (551 million statements) were delivered online instead of mailed as paper statements, the reduction in
total paper would be 7,915 metric tons of paper if 100% of online statements were printed at home, and 13,080 metric tons of paper
if 25% of online statements were printed at home.
1 Statements do not include related communications relative to these products such as regulatory information or advertisements.
2 Shifting from paper statements to online would not actually reduce direct Bank of America’s emissions or water use by these percentages, but this
is for a point of comparison.
Comparative LCA of Electronic and Paper Statements
Bank of America
WSP USA
July 17, 2018
Page 1

Figure ES1: Reduction in greenhouse gas emissions and BWC per statement realized by using electronic versus paper statements
80 0.40
67
nt
nt
ee mm 60 0.30 tete tata 0.25 SS / / n
n
oo titi 40 0.20
duc
duc
ee
R Re C
2 WO 20 0.10
g C
Bl
ga
- 0.00
Absolute Reduction
GHG Reduction / Statement BWC Reduction / Statement
Several sensitivity analyses around the assumed percentage of at-home printed statements were evaluated as a part of this study.
Even in the worst-case scenario, in which 100% of customers view their statements for 15 minutes online (as a conservative
estimate), then download, print and dispose of their online statement, the reduction in GHG emissions and BWC compared to paper
statement delivery remains, though it is reduced to a difference of 41 g CO2e and 0.10 gallons of water per statement, respectively.
Three additional sensitivity analyses were conducted to test the sensitivity of the results and conclusions to the chosen sys tem
boundary, and assumptions about internet electricity and end of life treatment of paper. These analyses demonstrated that the overall
results of the study were not sensitive to these assumptions and the conclusion that online statements reduce GHG emissions and
BWC remains unchanged even with the shift from coal to natural gas at the paper mill that contributed the most statement paper
considered in this study. The reduction in GHG emissions compared to the original study is 8%.
Within the system boundaries considered in this study, the primary driver of GHG emissions and BWC for the paper statement is
paper production. For the online statement, the primary driver of GHG emissions and BWC is at-home printing in the sensitivity
analyses in which 100%, 50%, and 25% of customers print their statement at home. The primary driver of GHG emissions and
BWC is the customer’s device electricity consumption in the sensitivity analyses in which 0% of customers print their statement at
home.
Regardless of the percent of customers that print their statements at home, and with the reduced coal inputs to paper production, the
finding that online statements reduce GHG emissions and BWC compared to paper statements holds true, only the magnitude of the
reduction changes. If all of Bank of America’s statements for checking, savings, home loan, credit card, and investment accounts
were delivered electronically, significant reductions in GHG emissions and water consumption would be achieved. Furthermore,
encouraging customers not to print statements at home would result in additional reductions in GHG emissions and BWC.
Comparative LCA of Electronic and Paper Statements
Bank of America
WSP USA
July 17, 2018
Page 2

ASSESSMENT SUMMARY
Cradle-to-Grave Comparative Life Cycle Assessment
Bank of America Electronic and Paper Statements
Parameter Description
Company Name
and
Contact Information
Study Commissioner:
Bank of America
Global Environmental Group 100 North Tryon St.
NC1-007-15-22
Charlotte, NC 28255
Contact: [email protected]
Study Practitioners:
WSP USA
Julie Sinistore
Eric Christensen [email protected]
Jessica Lab
Standards Used ISO 14040 2006: Environmental management – Life cycle assessment – Principals and framework
ISO 14044 2006: Environmental management – Life cycle assessment – Requirements and
guidelines
ISO 14046:2014 standard Environmental management – Water footprint – Principles,
requirements and guidelines
ISO 14064-3 standard Greenhouse gases – Part 3: Specification with guidance for the validation of greenhouse gas assertions.
The study has been conducted according to the requirements of these International Standards.
Product Name The products under study are bank statements delivered in paper and electronic format for the following account types: savings and checking accounts, credit cards, home loans, and
investment accounts.
Product Description The function of a statement is to deliver information about the status of an account such as the balance, history of transactions, and need for payment. Statements are delivered at a rate of one
per month, per account type, to a customer.
Functional Unit
(study basis)
The function of the statement is to provide information about an account to the account-holder. Regardless of paper or electronic delivery, the statement contains the same information. The
functional unit of this study is one statement. The average statement is 2.5 pages according to
Bank of America.
Temporal Boundary Production volumes and energy consumption data were collected from Bank of America’s document fulfilment services, paper manufacturing partners, and online banking based on
annualized data from 2015-2016. Paper data were collected based on 2015 paper production.
Secondary data from the GaBi® databases have a validity range between 2009 and 2016. The
time period in which the results should be considered valid is five years from the publication date of the study.
Country/Region of
Product Consumption
Bank of America primarily distributes statements in the United States to United States customers. Approximately 0.7% of all statements are printed for mailing internationally. Since
this is less than 1% of all statements, only United States mailing is considered within the system
boundary of this study.
Version and Date of Issue Version 1: 11/13/2018
Comparative LCA of Electronic and Paper Statements
Bank of America
WSP USA
July 17, 2018
Page 3
GLOSSARY OF TERMS
ADMT: Air Dry Metric Ton
BDMT: Bone Dry Metric Ton
BWC: Blue Water Consumption
DFS: Document Fulfillment Services
EOL: End of Life
EPA: Environmental Protection Agency
FDIC: Federal Deposit Insurance Corporation
GHG: Greenhouse Gas emissions
GWP: Global Warming Potential
IP: Internet Protocol
IPCC: Intergovernmental Panel on Climate Change
kWh: kilowatt hour
LCA: Life Cycle Assessment
LCI: Life Cycle Inventory
LCIA: Life Cycle Impact Assessment
MT: Metric Ton
MWh: Megawatt hour
OLB: Online Banking
PC: Personal Computer
USEPA: United States Environmental Protection Agency
USGS: United States Geological Survey
USLCI: United States Life Cycle Inventory
USPS: United States Postal Service
Comparative LCA of Electronic and Paper Statements
Bank of America
WSP USA
November 13, 2018
Page 4

1 SUMMARY OF REVISIONS TO PAPER
PRODUCTION ENERGY To quantify energy and material inputs and outputs, WSP collected primary data from Bank of America and its primary paper
production partner. The majority of statement paper (99.2%) produced for the bank comes from three of the partner’s mills. The
mill that contributes the most paper to the statement paper considered in this study reduced the amount of coal it consumed on-site
to zero and replaced it with natural gas. This resulted in a significant reduction in the paper mill’s direct GHG emissions, therefore,
this addendum analysis was undertaken to evaluate if this shift from coal to natural gas would affect the original results of the study.
Primary activity and inventory data have been collected for three facilities operated by the primary paper partner. This incl udes the
transportation of materials to the mill, all mill energy and activities, co-products of production, and transport of final paper rolls to
DFS. The bank has two DFS facilities in two confidential locations in the United States. None of these other data from the paper
mills has been changed in this analysis; only the reduction in coal and increase in natural gas at one of the paper mills is assessed in
this addendum analysis and report.
1.1 MATERIAL PRODUCTION FOR STATEMENTS AND
ENVELOPES
The raw data for the production of paper for each paper mill were provided to WSP directly from the paper company. The primary
data inputs included the fuels, wood, and chemicals for the paper. Table 6 in the Appendix shows the total paper production inputs
for all three mills normalized by the percentage of paper provided to Bank of America from each mill with updated data from the
one mill that shifted from coal to natural gas on-site. Secondary data on logging were included in the datasets sourced from GaBi
on wood production. These secondary datasets included all activities related to logging. Outputs of the paper production process
are shown in Table 12 in the Appendix. The percentage of paper supplied per mill was provided directly from the paper company.
The paper company provided the transportation distance traveled and method that each paper production input material travels to
produce the paper per mill. Total distance travelled was calculated by multiplying the provided distance per load by the number of
loads per year. Because the number of loads per year was only provided for one of the three mills, the distance travelled per
weight was calculated per transportation method. This intensity was then applied to the other two mills to calculate distance
travel ed per transportation method. Table 13 shows the aggregated transportation data normalized by the percentage of paper
provided to Bank of America’s DFS locations from each mill.
Comparative LCA of Electronic and Paper Statements
Bank of America
WSP USA
July 17, 2018
Page 5

2 ADDENDUM LIFE CYCLE IMPACT
ASSESSMENT
2.1 SUMMARY OF RESULTS
LCIA was carried out using characterization factors programmed into GaBi ts®. The two impact categories considered in this
assessment are greenhouse gas emissions (GHG emissions) and blue water consumption (BWC). The Intergovernmental Panel on
Climate Change’s (IPCC) Fifth Assessment Report (AR5) 100-year time-scale excluding biogenic carbon (IPCC AR5 GWP 100
excl. biogen) method was used for quantifying GHG emissions and it is measured in carbon dioxide equivalents (g CO2e). GHG
emissions are referred to as global warming potential (GWP) in GaBi®. These category indicators are internationally accepted. Blue
water refers to surface and ground water only and excludes rain water which is green water. The GaBi BWC characterization
method was used to quantify blue water in this study and it is measured in volume of water (liters or gallons of water).3 These
metrics are mid-point assessment methods. Characterization factor methodology for factors available in GaBi® can be found on the
GaBi website.4
The justification for why these impact categories have been selected, and other have been omitted, stems from the goal of the study
as communicated by the commissioner of the study. Bank of America sought understanding of the relative GHG emission and water
impacts of delivering bank statements electronically and by paper copy with the intention to communicate these insights internally
and externally. The rationale for this is that the study was undertaken to meet the requests of the bank’s stakeholders who are
interested in the GHG emission and water impacts associated with delivering statements electronically and in paper format through
the mail. Therefore, other impact categories are considered outside of the scope of the study because they do not serve to achieve
the goal set forth by the commissioner of the study. The results below are based on the scenario in which 25% of customers view
the statement for 15 minutes and download and print the statement, and the remaining 75% view the statement online for 15 minutes
and do not print.
The results that follow reflect the updated inputs to the paper production process with a shift from coal to natural gas at one of the
paper mills that provided the majority of paper considered in this study.
2.2 LCIA RESULTS
The GaBi ts® software calculates the LCIA results in its balance function and computes the environmental impact results according
to pre-defined characterization methods in the selected LCIA methodology.
2.2.1 GREENHOUSE GAS EMISSIONS
The GHG emissions reduction from switching from a paper statement to an online statement, as characterized by the IPCC AR5
characterization factors for GWP 100, is 67 g CO2e per statement. This assumes that the statement length is 2.5 pages on average.
Also, the baseline of comparison for the following results assumes that 25% of customers print statements at home.
3 Blue water refers to surface and ground water only (excluding rain water, green water). Rain water is typically excluded from the assessment of
freshwater consumption and one focuses on BWC only, as this is the relevant part which can be assessed with current impact assessment methods.
4 http://www.gabi-software.com/international/support/gabi/gabi-lcia-documentation/
Comparative LCA of Electronic and Paper Statements
Bank of America
WSP USA
July 17, 2018
Page 6

The contribution of each life cycle phase to the total GHG emissions per statement type is given in Addendum Table 1, Addendum Figure 1, and Addendum Figure 2.
Addendum Table 1: Greenhouse gas emissions by life cycle phase by statement type, per statement
g CO2e /
Statement
Statement
Generated and
Stored
Paper
Production
Transport
from Mill to
BAC
Printing by
BAC
USPS
Transport
Internet
Electricity
Customer
Device
Electricity
At-home
Printing End of Life
Paper
Statement
Common – not
modeled 46.76 7.30 6.99 4.31 N/A N/A N/A 15.08
Online
Statement
Common – not
modeled N/A N/A N/A N/A 0.36 4.74 6.75 1.73
Note: Paper production only includes the GHG impacts for producing Bank of America’s statement paper. At-home printing includes the GHG impacts from producing the paper that
statements are printed at home.
Comparative LCA of Electronic and Paper Statements
Bank of America
WSP USA
November 13, 2018
Page 7

Addendum Figure 1: Relative greenhouse gas contribution per life cycle phase for paper statements, per statement
Paper
Production
58%
Transport from
Mill to BAC
9%
Printing by BAC
9%
USPS Transport
5%
End of Life
19%
Addendum Figure 2: Relative greenhouse gas contribution per life cycle phase for online statements, per statement
Internet Electricity
2%
Customer
Device
Electricity
35%
At-home
Printing
50%
End of Life
13%
Comparative LCA of Electronic and Paper Statements
Bank of America
WSP USA
November 13, 2018
Page 8

For the paper statement, the largest contributor to GHG emissions is paper production. Addendum Figure 3 shows the contributions
to paper production, with purchased energy making up the majority of the impacts.
Addendum Figure 3: Paper production greenhouse gas emissions, per paper statement
Minerals +
Chemicals
28%
Purchased
Energy
53%
Transportation
0%
Wood + Fiber
5%
Process Water
14%
Wastewater
Treatment
0%
Comparative LCA of Electronic and Paper Statements
Bank of America
WSP USA
July 17, 2018
Page 9
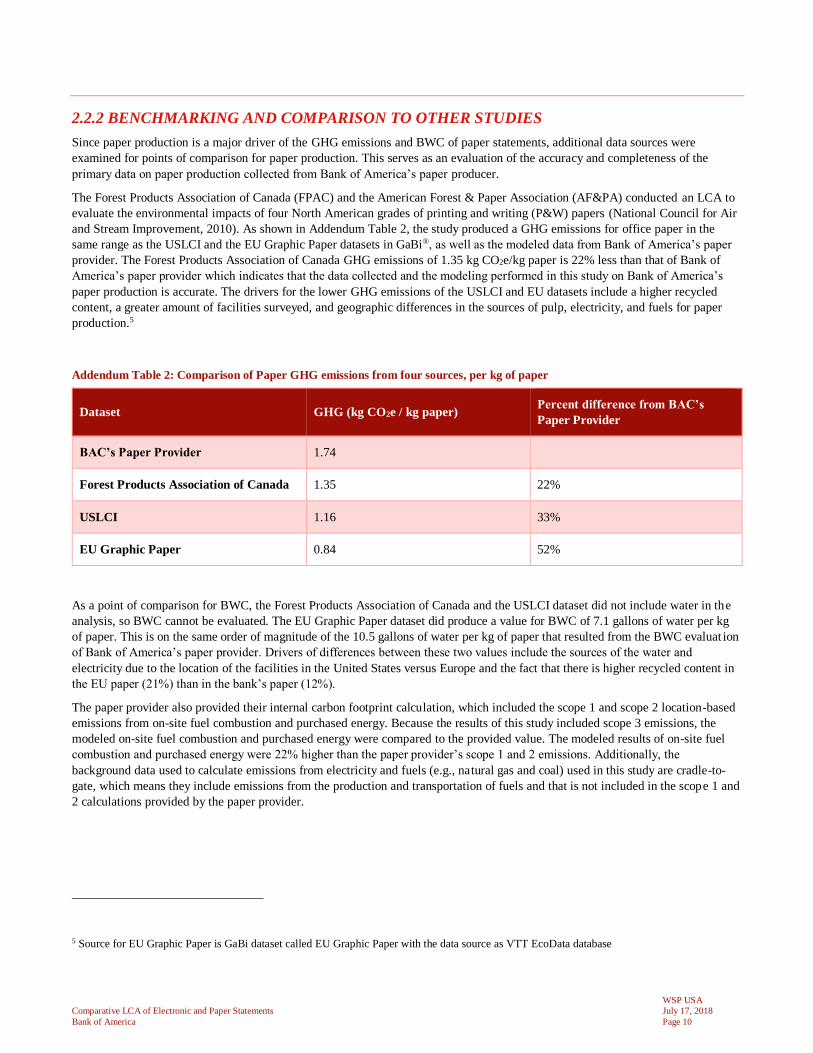
2.2.2 BENCHMARKING AND COMPARISON TO OTHER STUDIES
Since paper production is a major driver of the GHG emissions and BWC of paper statements, additional data sources were
examined for points of comparison for paper production. This serves as an evaluation of the accuracy and completeness of the
primary data on paper production collected from Bank of America’s paper producer.
The Forest Products Association of Canada (FPAC) and the American Forest & Paper Association (AF&PA) conducted an LCA to
evaluate the environmental impacts of four North American grades of printing and writing (P&W) papers (National Council for Air
and Stream Improvement, 2010). As shown in Addendum Table 2, the study produced a GHG emissions for office paper in the
same range as the USLCI and the EU Graphic Paper datasets in GaBi®, as well as the modeled data from Bank of America’s paper
provider. The Forest Products Association of Canada GHG emissions of 1.35 kg CO2e/kg paper is 22% less than that of Bank of
America’s paper provider which indicates that the data collected and the modeling performed in this study on Bank of America’s
paper production is accurate. The drivers for the lower GHG emissions of the USLCI and EU datasets include a higher recycled
content, a greater amount of facilities surveyed, and geographic differences in the sources of pulp, electricity, and fuels for paper
production.5
Addendum Table 2: Comparison of Paper GHG emissions from four sources, per kg of paper
Dataset GHG (kg CO2e / kg paper) Percent difference from BAC’s
Paper Provider
BAC’s Paper Provider 1.74
Forest Products Association of Canada 1.35 22%
USLCI 1.16 33%
EU Graphic Paper 0.84 52%
As a point of comparison for BWC, the Forest Products Association of Canada and the USLCI dataset did not include water in the
analysis, so BWC cannot be evaluated. The EU Graphic Paper dataset did produce a value for BWC of 7.1 gallons of water per kg
of paper. This is on the same order of magnitude of the 10.5 gallons of water per kg of paper that resulted from the BWC evaluat ion
of Bank of America’s paper provider. Drivers of differences between these two values include the sources of the water and
electricity due to the location of the facilities in the United States versus Europe and the fact that there is higher recycled content in
the EU paper (21%) than in the bank’s paper (12%).
The paper provider also provided their internal carbon footprint calculation, which included the scope 1 and scope 2 location-based
emissions from on-site fuel combustion and purchased energy. Because the results of this study included scope 3 emissions, the
modeled on-site fuel combustion and purchased energy were compared to the provided value. The modeled results of on-site fuel
combustion and purchased energy were 22% higher than the paper provider’s scope 1 and 2 emissions. Additionally, the
background data used to calculate emissions from electricity and fuels (e.g., natural gas and coal) used in this study are cradle-to-
gate, which means they include emissions from the production and transportation of fuels and that is not included in the scope 1 and
2 calculations provided by the paper provider.
5 Source for EU Graphic Paper is GaBi dataset called EU Graphic Paper with the data source as VTT EcoData database
Comparative LCA of Electronic and Paper Statements
Bank of America
WSP USA
July 17, 2018
Page 10

3 ADDENDUM LIFE CYCLE INTERPRETATION
3.1 SENSITIVITY ANALYSIS
3.1.1 PERCENT OF ONLINE STATEMENTS PRINTED AT HOME
To evaluate the impact of the assumptions around customer behavior with online statements, four sensitivity analyses were
developed based on the conservative assumption that the customer views the statement for at least 15 minutes online and then, in
some cases, chooses to download, print and then shred the statement. The resulting difference between the GHG emissions and
BWC of the paper statement and the online statement in these four sensitivity analyses is summarized in Addendum Table 3. The
value represented in the results section of the report (25% print) is highlighted in bold. Even if 100% of customers download and
print an online statement, the online statement reduces GHG emissions and BWC by 41 g CO2e and 0.10 gallons of water per
statement respectively. The linear relationship between increased at-home printing and decreased difference in the GHG emissions
and BWC between paper and online statements is illustrated in Addendum Figure 4. The primary driver of GHG emissions and
BWC in the 100%, 50%, and 25% print sensitivity analyses is the at-home printing of the statement. In the 0% sensitivity analysis,
the GHG emissions and BWC associated with the electricity used by the customer’s device was the largest source of impacts,
mainly because no printing is done in the 0% print scenario.
Addendum Table 3: GHG emissions and BWC difference between paper and online statement based on percent of online
statements printed
Sensitivity case GHG difference (g CO2e/statement) BWC difference (gallons water/statement)
100% print 41 0.10
50% print 58 0.20
25% print 67 0.25
0% print 75 0.30
Addendum Figure 4: GHG emissions difference between paper and online statements across sensitivity analyses
40
50
60
70
80
0% 25% 50% 75% 100%
g C
O2e
Dif
fere
nce
/ S
tate
men
t
Percent of Statements Printed
Comparative LCA of Electronic and Paper Statements
Bank of America
WSP USA
July 17, 2018
Page 11

3.1.2 SYSTEM BOUNDARY SENSITIVITY TO NO SHREDDING AND RECYCLING ONLINE
AND PAPER STATEMENTS
To test the sensitivity of the selected system boundary to assumptions, a sensitivity analyses was conducted on the EOL
assumptions for paper both from paper statements and online statements printed at home. The base case for this study assumed that
all paper and printed online statements were shredded, and thus could not be recycled. This sensitivity analysis assumes that no
shredding occurs for either paper or printed online statements, but that standard United States recycling rates apply. The results
from this sensitivity analysis are showed in Addendum Table 4. The difference in GHG emissions and BWC between paper and
online statements increases moderately by 2 g CO2e/statements and by 0.03 gallons of water/statement. This sensitivity analysis
shows that not shredding and recycling do not change the overall conclusion that online statements reduce GHG emissions and
BWC compared to paper statements.
Addendum Table 4: GHG emissions and BWC difference between paper and online statement based on the no shredding and
recycling case
Sensitivity Case GHG difference (g CO2e/statement) BWC difference (gallons water/statement)
No Shredding and Recycling Case 69 0.28
Base Case 67 0.25
3.1.3 SYSTEM BOUNDARY SENSITIVITY TO INTERNET HARDWARE AND SOFTWARE
To test the sensitivity of the system boundary to the selected boundary, another sensitivity analyses was conducted on the exclusion
of the hardware and software of the internet from the online statement system boundary. The study Malmodin, 2014, supporting
materials, calculated the GHG emissions from the production and use of internet hardware based on the global emission factor for
electricity (Malmodin, 2014). The global electricity GHG emissions factor is on par with that of the United States (study global =
0.6 kg CO2e/kWh & US eGRID average mix = 0.585 kg CO2e from GaBi)). The results shown in Figure 4C of Malmodin, 2014
present the impacts assuming global electricity. Table S6.1.2. in Malmodin 2014 gives the values used to make Figure 4C and for
the electricity impacts, the transmission and core network contributes 2.5 kg CO2e while the manufacturing of the equipment
contributes 0.3 kg CO2e. Therefore, the GHG emissions from hardware is 12% of the GHG emissions from the electricity used. This
analysis tested the sensitivity of the results to the impacts of producing the equipment by increasing the electricity b y 12% to
account for increased GHG emissions and water consumption for internet hardware and software.
It is well-known that electronics manufacturing requires a significant amount of ultra-pure water for the washing steps for
microchips and this drives the water impacts of electronics. It is difficult, however, to find a similar water impact for a finished
electronic device like a server. Instead, the BWC of 34 different ICs (various die sizes, package types, and tech nodes) from GaBi
were examined to ensure that the BWC from increasing electricity could proxy the increased BWC from producing the hardware.
On average, the GHG emissions for an IC are 2.3 kg CO2e/IC and the BWC is 10.2 kg water/IC. As mentioned before, the US
eGRID average mix GHG emissions are 0.585 kg CO2e/kWh. The water consumption embedded in power is not insignificant
though. For the US eGRID mix, BWC is 3.43 kg water/kWh. Comparing per IC and per kWh are not appropriate, but, therefore, the
primary energy demand for an IC from GaBi (9.4 kWh) was used to normalize the GHG emissions and BWC. If normalized to a per
kWh energy demand basis for producing an IC, then the BWC for ICs is 1.09 kg water/kWh which is a lower BWC/kWh than that
of grid energy, therefore, increasing the electricity assumption in the model by 12% will provide a conservative estimate for the
water consumption of the hardware.
As a result of increasing the electricity intensity of the internet by 12%, there was only a minor decrease in the GHG and BWC
difference between the paper statement and the online statement where 25% of customers print their statement at home. The
difference in GHG emissions and BWC between paper and online statements decreases slightly by 0.05 g CO2e/statements and by
0.0001 gallons of water/statement. Therefore, the system is not sensitive to the inclusion of internet hardware and software.
Comparative LCA of Electronic and Paper Statements
Bank of America
WSP USA
July 17, 2018
Page 12

3.1.4 SYSTEM BOUNDARY SENSITIVITY TO INCREASED INTERNET ELECTRICITY
This sensitivity analysis used the unadjusted electricity intensity of the internet from 2012 since the base case adjusted this value for
2016 data by decreasing it 30% per year, with a resulting electricity intensity of the internet of 1.73 kWh/GB instead of the 2012
value of 7.2 kWh/GB. This sensitivity analysis shows that the difference in paper statements to online statements (where 25% of
customers print at home) decreased slightly from the base case (Addendum Table 5). That is to say that the increase in internet
electricity caused the online statement GHG emissions and BWC to increase so the absolute difference between the paper and
online statements decreased. Therefore, the results of the study are not sensitive to internet electricity.
Addendum Table 5: GHG emissions and BWC difference between paper and online statement based on the high internet electricity
case
Sensitivity Analysis GHG difference (g CO2e/statement) BWC difference (gallons water/statement)
Increased Internet Electricity 66 0.24
Base Case 67 0.25
3.2 IDENTIFICATION OF RELEVANT FINDINGS
Based on the results of this cradle-to-grave life cycle assessment, there are appreciable reductions in the GHG emissions and BWC
of a paper and electronic statement. With the assumptions in this study, the available data and under the scenario in which 25% of
customers print their online statements, the difference in GHG emissions from paper to online statements is estimated to be 67 g
CO2e and the reduction in BWC is 0.25 gallons of water per statement. If all of Bank of America statements mailed in a year (551
million statements) were delivered online instead of mailed as paper statements, this would result in a reduction of approximately
37,000 metric tons of GHG emissions and 136 million gallons of blue water consumed when using electronic instead of paper
delivery. This is approximately equivalent to the GHG emissions from 5,500 United States homes in a year (USEPA, Greenhouse
Gas Equivalencies Calculator, 2017) and the water contained in approximately 206 Olympic swimming pools. This amounts to
0.001% of the GHG emissions emitted in the United States in 2015 (USEPA, 2015) and 0.0001% of the water use in the United
States in 2010 (USGS, 2010). This is equal to 3% of GHG emissions and 6% of water use from Bank of America’s 2016 global
operations (Bank of America Corporation, 2016).6 In terms of paper savings, if all of Bank of America statements mailed in a year
(551 million statements) were delivered online instead of mailed as paper statements, the reduction in total paper would be 7,915
metric tons of paper if 100% of online statements were printed at-home, and 13,080 metric tons of paper if 25% of online statements
were printed at home.
Several sensitivity analyses were evaluated as a part of this study (see Section 3.1). The first sensitivity analysis was on the assumed
percentage of at-home printed statements. Even in the worst-case scenario, in which 100% of customers view their statements for 15
minutes online, then download, print and dispose of their online statement, the reduction in GHG emissions and BWC compared to
paper statement delivery remains, though it is reduced to 41 g CO2e and 0.10 gallons of water per statement, respectively. If all of
Bank of America’s statements were delivered online and were 100% printed at home, instead of by printed mail, in this sensitivity
analysis, the reduction in GHG emissions and BWC would still be 23,000 metric tons of CO2e and 55 million gallons of water
annually.
The second sensitivity analysis tested the assumption that all paper statements, whether mailed or printed at home, are shredded. In
this analysis, no statements are shredded, which means that the paper could be recycled according to standard United States
recycling rates. The difference in GHG emissions and BWC between paper and online statements increases moderately by 2 g
6 Shifting from paper statements to online would not actually reduce Bank of America’s direct emissions or water use by these percentages, but this
is for a point of comparison.
Comparative LCA of Electronic and Paper Statements
Bank of America
WSP USA
July 17, 2018
Page 13

CO2e/statements and by 0.03 gallons of water/statement. This sensitivity analysis shows that not shredding and recycling do not
change the overall conclusion that online statements reduce GHG emissions and BWC compared to paper statements.
The third sensitivity analysis focused on capturing the embodied GHG emissions and BWC of the internet hardware and software.
As a result of expanding the system boundary to include these impacts, there was only a minor decrease in the GHG and BWC
difference between the paper statement and the online statement where 25% of customers print their statement at home. The
difference in GHG emissions and BWC between paper and online statements decreases slightly by 0.05 g CO2e/statements and by
0.0001 gallons of water/statement. Therefore, the system is not sensitive to the inclusion of internet hardware and software.
The fourth sensitivity analysis tested the assumption that internet electricity efficiency increased over time by increasing the
assumed electricity for the internet to 7.2 kWh/GB from 1.73 kWh/GB. This sensitivity analysis shows that the difference in paper
statements to online statements (where 25% of customers print at home) decreased slightly from the base case. That is to say that
the increase in internet electricity caused the online statement GHG emissions and BWC to increase so the absolute difference
between the paper and online statements decreased. Therefore, the results of the study are not sensitive to internet electri city.
These four sensitivity analyses demonstrated that the overall results of the study were not sensitive to these assumptions and the
conclusion that online statements reduce GHG emissions and BWC remains unchanged.
It is also notable that the impacts of printing online statements at home are 30% lower than that of mailed paper statements. The
reasons for this are two-fold. First, the mailed statement includes two envelopes (the outer envelope that the statement is mailed in
and the inner reply envelope) which are not included in online delivery of statements. The mass of these two envelopes is
approximately equal to that of the statement itself which means that the online statement requires half the total mass of paper that
the mailed paper statement requires. Second, the paper produced for Bank of America has higher GHG emissions per statement than
the standard dataset paper modeled for at home printing (as noted in Table 21). As noted in section 10.1.2, the drivers for the lower
GHG emissions from the at-home printing paper include a higher recycled content, a greater amount of facilities surveyed, and
geographic differences in the sources of pulp, electricity, and fuels for paper production. The paper the bank sources is not available
to the general public for purchase, therefore, it is not reasonable to assume the same paper is used to print at home as is used to print
the mailed statements.
Within the system boundaries considered in this study, the primary driver of GHG emissions and BWC for the paper statement is
paper production. Table 17 shows the GHG impacts per phase for the different printing scenarios for online statements.
For the online statement, the primary driver of GHG emissions and BWC is the at-home printing by the customer’s viewing device
in the sensitivity analyses in which 100%, 50%, and 25% of customers print their statements at home. The primary driver of GHG
emissions and BWC in the 0% at-home printing sensitivity analysis was the customer device electricity consumption.
3.3 CONCLUSIONS
Regardless of the percent of customers that print their statements at home, and even with the shift from coal to natural gas at the
paper mill that contributed the most paper to Bank of America’s paper supply, the finding that online statements reduce GHG
emissions and BWC compared to paper statements holds true, only the magnitude of the reduction changes. The reduction in GHG
emissions magnitude from the original study is 8%. If all of Bank of America’s statements for checking, savings, home loan, credit
card, and investment accounts were delivered electronically, significant reductions in GHG emissions and water consumption would
be achieved. Furthermore, encouraging customers not to print statements at-home would result in additional reductions in GHG
emissions and BWC.
This study also identified paper production as a primary driver of GHG emissions and BWC in the printing statement system.
Printing, transportation, and statement end-of-life did not contribute heavily to paper statement GHG emissions or BWC within the
system boundaries considered. Within paper production, the major driver of GHG emissions was purchased energy followed by
minerals and chemicals. Efforts to reduce the GHG emissions of paper should therefore be focused in these areas. The primary
driver of BWC from paper production was the total process water even though significant efforts are made to recover and recycle
water within the paper production facilities. For the online statements, the primary driver of GHG emissions and BWC was at-home
printing, which includes paper and ink transportation and distribution, paper production, and the electricity from the printer. The
percent of customers who print online statements at home is currently unknown and outside of the control of Bank of America.
Further studies on this topic could attempt to quantify how many customers who receive online statements download and print
them. This could be accomplished with a voluntary customer survey.
Comparative LCA of Electronic and Paper Statements
Bank of America
WSP USA
July 17, 2018
Page 14

3.4 LIMITATIONS AND ASSUMPTIONS
The results of this study are limited to Bank of America checking, savings, home loan, credit card, and investment account
statements and, thus, do not consider products with equal or comparable functionality produced by other institutions. The results of
this study, therefore, can only be applied to Bank of America statements of this type. The primary assumption in this study was on
the customer viewing and printing behavior with respect to online statements. The sensitivity analyses evaluated in this study did
demonstrate that the magnitude of the GHG emissions and BWC difference between online and paper statements is sensitive to this
assumption, but that the conclusion that online statements reduce GHG emissions and BWC compared to paper statements does not
change. Therefore, the results of this study are not limited by this assumption. The study did not evaluate additional impact
categories such as other impacts to air and water quality. This introduces a limitation on the utility of the results in driving internal
decision making as such decision-making may be based only on the statement-delivery method’s impacts on GHG emissions and
BWC. The study also did not include the impacts of user devices due to the cut-off criteria applied. Since less than 1% of device use
is attributable to statement-viewing, the impact on the results is likely minimal.
Comparative LCA of Electronic and Paper Statements
Bank of America
WSP USA
July 17, 2018
Page 15

4 ADDENDUM REFERENCES Aslan, J., Mayers, K., Koomey, J. G., & France, C. (2017, August). Electricity Intensity of Internet Data Transmission: Untangling
the Estimates. Journal of Industrial Ecology, Online Version of Record published before inclusion in an issue, doi:
10.1111/jiec.12630.
Ativa® 12-Sheet Micro-Cut Shredder, C184-E. (n.d.). Retrieved 05 2017, from Office Depot:
http://www.officedepot.com/a/products/770578/Ativa-12-Sheet-Micro-Cut-Shredder/
Bank of America Corporation. (2016). Environmental, Social & Governance Performance Data Summary. Retrieved 10 2017, from
https://about.bankofamerica.com/assets/pdf/Bank-of-America-2016-ESG-Performance-Data-Summary.pdf#page=2
Coroama, V. C., & Hilty, L. M. (2014, February). Assessing Internet energy intensity: A review of methods and results.
Environmental Impact Assessment Review, 45, 63-68. Retrieved from http://publicationslist.org/data/lorenz.hilty/ref-
218/2014_Coroama_Hilty_Assessing_Internet_Energy_Intensity_AAM.pdf
Darrow, B. (2016, June 9). Retrieved 12 2017, from http://fortune.com/2016/06/09/pc-sales-are-worse-than-you-think/
EPA. (2016). Advancing Sustainable Materials Management: 2014 Tables and Figures. Retrieved 06 2017, from
https://www.epa.gov/sites/production/files/2016-11/documents/2014_smm_tablesfigures_508.pdf
EPA. (2017). Inventory of U.S Greenhouse Gas Emissions and Sinks: 1990-2015. Retrieved 09 2017, from
https://www.epa.gov/sites/production/files/2017-02/documents/2017_complete_report.pdf
Epstein, Z. (2014, 05 29). Horrifying chart reveals how much time we spend staring at screens each day. Retrieved 12 2017, from
BGR.com: http://bgr.com/2014/05/29/smartphone-computer-usage-study-chart/
Estimating Appliance and Home Electronic Energy Use. (2017, 03). Retrieved from Energy Saver:
https://energy.gov/energysaver/estimating-appliance-and-home-electronic-energy-use
How a Letter Travels. (n.d.). Retrieved 11 2016, from USPS: https://about.usps.com/publications/pub100/pub100_078.htm
Inkjet Cartridge Volumes and Page Yields. (2017, 06). Retrieved from Inksell.com: http://www.inksell.com/ipd-inkvolumes.html
ISO. (2006). ISO 14040: environmental management—life cycle assessment—principles and framework. International Organization
for Standardization, Geneva, Switzerland.
ISO. (2006). ISO 14044: environmental management—life cycle assessment, life cycle impact assessment. International
Organization for Standardization, Geneva, Switzerland.
Le Pochat, S., Berthoud, F., Gaborit, M., & Mary, T. (2010). Comparative LCA of a digital invoice versus a paper invoice. EVEA.
Malmodin, J. L. (2014). Life Cycle Assessment of ICT: Carbon Footprint and Operational Electricity Use from the. Journal of
Industrial Ecology, 18(6).
Miller, J. D. (2017, 07 31). Senior Vice President, Newark Operations Group Manager. (L. Shpritz, Interviewer)
Moberg, A., Borggren, C., Finnveden, G., & Tyskeng, S. (2008). Effects of a total change from paper invoicing to electronic
invoicing in Sweden. A screening life cycle assessment focusing on greenhouse gas emissions and. Stockholm: KTH Centre for
Sustainable Communications. Retrieved 11 2016, from http://www.diva-portal.org/smash/get/diva2:355958/FULLTEXT01.pdfat
National Council for Air and Stream Improvement, I. (. (2010). Printing & Writing Papers Life-Cycle Assessment. Retrieved 11
2017, from http://www.afandpa.org/docs/default-source/default-document-library/lca-executive-summary.pdf
Paper Shredding: Tips and Recycling info. (2016). Retrieved 12 2017, from Ecocycle.org: http://ecocycle.org/shred
Rosenbaum, R., Bachmann, T., Gold, L., Huijbregts, A., Jolliet, O., Juraske, R., . . . Hauschild, M. (2008). USEtox—the UNEP-
SETAC toxicity model: recommended characterisation factors for human toxicity and freshwater ecotoxicity in life cycle impact
assessment. International Journal of Life Cycle Assessment, 13, 534-546.
Technology Knowledge. (n.d.). Retrieved January 9, 2018, from Highspeedbackbone.net:
http://static.highspeedbackbone.net/html/Choosing-Printer-article.html
thinkstep AG: LBP-GaBi. (2016). GaBi Software System. Leinfelden_Echterdingen / Germany: University of Stuttgart.
Comparative LCA of Electronic and Paper Statements
Bank of America
WSP USA
July 17, 2018
Page 16
Trollinger, V. (2016, February 9). How Much Energy Does My Phone Charger Use? Retrieved 11 2016, from Bounce Energy:
http://www.bounceenergy.com/blog/2016/02/how-much-energy-does-this-appliance-use-phone-charger/
USEPA. (2015). Inventory of U.S. Greenhouse Gas Emissions and Sinks. Retrieved from Greenhouse Gas Emissions:
https://www.epa.gov/ghgemissions/inventory-us-greenhouse-gas-emissions-and-sinks
USEPA. (2017, September). Greenhouse gas equivalences calculator. Retrieved 10 2017, from EPA.gov:
https://www.epa.gov/energy/greenhouse-gas-equivalencies-calculator
USEPA. (2017). Greenhouse Gas Equivalencies Calculator. Retrieved from United States Environmental Protection Agency
Energy and the Environment: https://www.epa.gov/sites/production/files/widgets/ghg_calc/calculator.html#energy
USGS. (2010). Water use in the United States. Retrieved from Total water use: https://water.usgs.gov/watuse/wuto.html
Watt Finders Guide LG&E. (n.d.). Retrieved 11 2016, from LG&E and KU 2017: https://lge-
ku.com/sites/default/files/documents/watt_finders_guide.pdf
Comparative LCA of Electronic and Paper Statements
Bank of America
WSP USA
July 17, 2018
Page 17

5 ADDENDUM CRITICAL REVIEW
STATEMENT
Review of the Report (Dated July 2, 2018) “LCA Report Addendum: Comparison of Bank of America’s Electronic and Paper
Statements,” Conducted by WSP USA
Review Statement Prepared by the Critical Review Panel:
Arpad Horvath (Chair), Lise Laurin, Richard Venditti
July 17, 2018
The Critical Review Panel has completed the review of the report named above, which is an addendum to the report reviewed by
this same Panel (entitled “Comparison of Bank of America’s Electronic and Paper Statements”) in January 2018. The review has
found that the conclusions from the January 2018 review continue to hold, specifically:
• the methods used to carry out the LCA appear to be scientifically and technically valid,
• the interpretations of the results are defensible, the report is transparent concerning the study steps.
This review statement only applies to the report named above, dated July 2, 2018, but not to any other versions, derivative reports,
excerpts, press releases, and similar.
Arpad Horvath Lise Laurin
Richard Venditti
Comparative LCA of Electronic and Paper Statements
Bank of America
WSP USA
July 17, 2018
Page 18

LCA REPORT
LCA COMPARISON OF BANK OF
AMERICA’S ELECTRONIC AND
PAPER STATEMENTS
Client: Bank of America
VERSION 2
CONFIDENTIAL
DATE: JANUARY 22 2018
WSP USA
4840 PEARL EAST CIRCLE, SUITE 300W
BOULDER, CO 80301
USA
PHONE: +1 303-551-0933
WSP.COM
Comparative LCA of Electronic and Paper Statements
Bank of America
WSP USA
July 17, 2018
Page 19

WSP CONTACTS
Julie Sinistore, PhD
Eric Christensen
Jessica Lab
ISO-CONFORMANT LCA REPORT
LCA Comparison of Bank of America’s Electronic and Paper Statements
CLIENT
Bank of America
100 North Tryon St.
NC1-007-15-22
Charlotte, NC 28255
USA
CLIENT CONTACTS
WSP
WSP USA
4840 Pearl East Circle, Suite 300W
Boulder, CO 80301
USA
Tel: +1 303-551-0933
WSP CONTACTS
Julie Sinistore, PhD
Eric Christensen
Jessica Lab
Comparative LCA of Electronic and Paper Statements
Bank of America
WSP USA
July 17, 2018
Page 20
EXECUTIVE SUMMARYBank of America sought understanding of the relative GHG emission and water impacts of delivering bank statements electronically
and by paper copy with the intention to communicate these insights internally and externally. This study was conducted to meet the
requests of the bank’s stakeholders who are interested in the GHG emission and water impacts associated with delivering statements
electronically and in paper format through the mail. Online banking (OLB) is becoming increasingly popular and many customers
have opted to receive statements only electronically. The question of which statement delivery method reduces GHG emissions and
water consumption arises often both internally at the bank and externally from customers. Many other institutions that deliver
information both electronically and in paper format have made assertions about which method of delivery is environmentally
preferable with varying levels of substantiation.
Bank of America recognizes that the comparative GHG emissions and water impacts from paper versus electronic statements
depend greatly on the specifics of the production, transportation, use, and disposal systems. Therefore, the company commissioned
this study to determine the difference in GHG emissions and water consumption from the life cycle of their company’s specific
statement delivery systems. This study was conducted to support a comparative assertion for public disclosure. The comparison is
not on an absolute basis, but rather the difference in GHG emissions and water consumption between the two statement delivery
methods. The study focuses only on Bank of America’s statement production and delivery methods and is not intended to be
generalized through comparisons of electronic and paper delivery of information from any other institution. The study is limited
only to Bank of America’s checking, savings, home loan, credit card, and investment account statements and, thus, does not
consider products with equal or comparable functionality produced by other institutions.7
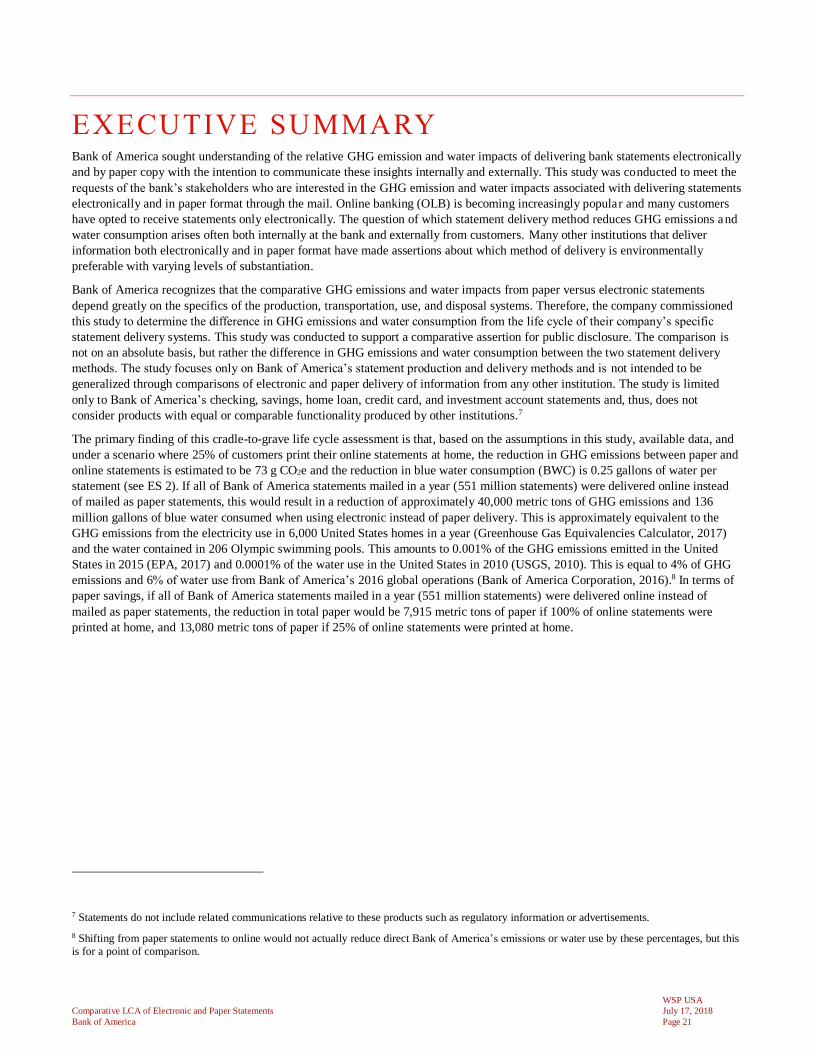
The primary finding of this cradle-to-grave life cycle assessment is that, based on the assumptions in this study, available data, and
under a scenario where 25% of customers print their online statements at home, the reduction in GHG emissions between paper and
online statements is estimated to be 73 g CO2e and the reduction in blue water consumption (BWC) is 0.25 gallons of water per
statement (see ES 2). If all of Bank of America statements mailed in a year (551 million statements) were delivered online instead
of mailed as paper statements, this would result in a reduction of approximately 40,000 metric tons of GHG emissions and 136
million gallons of blue water consumed when using electronic instead of paper delivery. This is approximately equivalent to the
GHG emissions from the electricity use in 6,000 United States homes in a year (Greenhouse Gas Equivalencies Calculator, 2017)
and the water contained in 206 Olympic swimming pools. This amounts to 0.001% of the GHG emissions emitted in the United
States in 2015 (EPA, 2017) and 0.0001% of the water use in the United States in 2010 (USGS, 2010). This is equal to 4% of GHG
emissions and 6% of water use from Bank of America’s 2016 global operations (Bank of America Corporation, 2016).8 In terms of
paper savings, if all of Bank of America statements mailed in a year (551 million statements) were delivered online instead of
mailed as paper statements, the reduction in total paper would be 7,915 metric tons of paper if 100% of online statements were
printed at home, and 13,080 metric tons of paper if 25% of online statements were printed at home.
7 Statements do not include related communications relative to these products such as regulatory information or advertisements.
8 Shifting from paper statements to online would not actually reduce direct Bank of America’s emissions or water use by these percentages, but this
is for a point of comparison.
Comparative LCA of Electronic and Paper Statements
Bank of America
WSP USA
July 17, 2018
Page 21

ES 2: Reduction in greenhouse gas emissions and BWC per statement realized by using electronic versus paper statements
73
0.25
0.00
0.10
0.20
0.30
0.40
-
20
40
60
80
Absolute Reduction
gal
BW
C R
educt
ion /
Sta
tem
ent
g C
O2e
Red
uct
ion /
Sta
tem
ent
GHG Reduction / Statement BWC Reduction / Statement
Several sensitivity analyses around the assumed percentage of at-home printed statements were evaluated as a part of this study.
Even in the worst-case scenario, in which 100% of customers view their statements for 15 minutes online (as a conservative
estimate), then download, print and dispose of their online statement, the reduction in GHG emissions and BWC compared to paper
statement delivery remains, though it is reduced to a difference of 48 g CO2e and 0.10 gallons of water per statement, respectively.
Three additional sensitivity analyses were conducted to test the sensitivity of the results and conclusions to the chosen system
boundary, and assumptions about internet electricity and end of life treatment of paper. These analyses demonstrated that the overall
results of the study were not sensitive to these assumptions and the conclusion that online statements reduce GHG emissions and
BWC remains unchanged.
Within the system boundaries considered in this study, the primary driver of GHG emissions and BWC for the paper statement is
paper production. For the online statement, the primary driver of GHG emissions and BWC is at-home printing in the sensitivity
analyses in which 100%, 50%, and 25% of customers print their statement at home. The primary driver of GHG emissions and
BWC is the customer’s device electricity consumption in the sensitivity analyses in which 0% of customers print their statement at
home.
Regardless of the percent of customers that print their statements at home, the finding that online statements reduce GHG emissions
and BWC compared to paper statements holds true, only the magnitude of the reduction changes. If all of Bank of America’s
statements for checking, savings, home loan, credit card, and investment accounts were delivered electronically, significant
reductions in GHG emissions and water consumption would be achieved. Furthermore, encouraging customers not to print
statements at home would result in additional reductions in GHG emissions and BWC.
Comparative LCA of Electronic and Paper Statements
Bank of America
WSP USA
July 17, 2018
Page 22

ASSESSMENT SUMMARY
Cradle-to-Grave Comparative Life Cycle Assessment
Bank of America Electronic and Paper Statements
Parameter Description
Company Name
and
Contact Information
Study Commissioner:
Bank of America Global Environmental Group
100 North Tryon St.
NC1-007-20-05
Charlotte, NC 28255
Contact:
Study Practitioners:
WSP USA
Julie Sinistore
Eric Christensen
Jessica Lab
Standards Used ISO 14040 2006: Environmental management – Life cycle assessment – Principals and framework
ISO 14044 2006: Environmental management – Life cycle assessment – Requirements and
guidelines
ISO 14046:2014 standard Environmental management – Water footprint – Principles,
requirements and guidelines
ISO 14064-3 standard Greenhouse gases – Part 3: Specification with guidance for the
validation of greenhouse gas assertions.
The study has been conducted according to the requirements of these International
Standards.
Product Name The products under study are bank statements delivered in paper and electronic format for
the following account types: savings and checking accounts, credit cards, home loans, and investment accounts.
Product Description The function of a statement is to deliver information about the status of an account such as the balance, history of transactions, and need for payment. Statements are delivered at a rate
of one per month, per account type, to a customer.
Functional Unit
(study basis)
The function of the statement is to provide information about an account to the account-holder. Regardless of paper or electronic delivery, the statement contains the same
information. The functional unit of this study is one statement. The average statement is 2.5
pages according to Bank of America.
Comparative LCA of Electronic and Paper Statements
Bank of America
WSP USA
July 17, 2018
Page 23

Temporal Boundary Production volumes and energy consumption data were collected from Bank of America’s document fulfilment services, paper manufacturing partners, and online banking based on
annualized data from 2015-2016. Paper data were collected based on 2015 paper production.
Secondary data from the GaBi® databases have a validity range between 2009 and 2016. The
time period in which the results should be considered valid is five years from the publication date of the study.
Country/Region of
Product Consumption
Bank of America primarily distributes statements in the United States to United States customers. Approximately 0.7% of all statements are printed for mailing internationally.
Since this is less than 1% of all statements, only United States mailing is considered within
the system boundary of this study.
Version and Date of Issue Version 2: 1/22/2018
Comparative LCA of Electronic and Paper Statements
Bank of America
WSP USA
July 17, 2018
Page 24

GLOSSARY OF TERMS
ADMT: Air Dry Metric Ton
BDMT: Bone Dry Metric Ton
BWC: Blue Water Consumption
DFS: Document Fulfillment Services
EOL: End of Life
EPA: Environmental Protection Agency
FDIC: Federal Deposit Insurance Corporation
GHG: Greenhouse Gas emissions
GWP: Global Warming Potential
IP: Internet Protocol
IPCC: Intergovernmental Panel on Climate Change
kWh: kilowatt hour
LCA: Life Cycle Assessment
LCI: Life Cycle Inventory
LCIA: Life Cycle Impact Assessment
MT: Metric Ton
MWh: Megawatt hour
OLB: Online Banking
PC: Personal Computer
USEPA: United States Environmental Protection Agency
USGS: United States Geological Survey
USLCI: United States Life Cycle Inventory
USPS: United States Postal Service
Comparative LCA of Electronic and Paper Statements
Bank of America
WSP USA
July 17, 2018
Page 25

6 GOAL OF THE STUDY Bank of America commissioned WSP USA to develop a Life Cycle Assessment (LCA) using GaBi ts9 data to calculate the
difference in greenhouse gas (GHG) emissions and water consumption between electronic and paper delivery of statements for its
banking products. These include savings and checking accounts, credit cards, home loans, and investment accounts.
The goal of this study is to determine the difference in GHG emissions and water consumption between the two statement delivery
formats, not to determine the absolute values of these impacts for each statement delivery method. This study is specific onl y to
Bank of America’s operations and paper supply chain and cannot be applied to that of other institutions.
6.1 REASONS FOR CARRYING OUT THE STUDY
Bank of America sought understanding of the relative GHG emission and water impacts of delivering bank statements electronically
and by paper copy with the intention to communicate these insights internally and externally. This study was conducted to meet the
requests of the bank’s stakeholders who are interested in the GHG emission and water impacts associated with delivering statements
electronically and in paper format through the mail. Online banking (OLB) is becoming increasingly popular and many customers
have opted to receive statements only electronically. The question of which statement delivery method reduces GHG emissions and
water consumption arises often both internally at the bank and externally from customers. Many other institutions that deliver
information both electronically and in paper format have made assertions about which method of delivery is environmentally
preferable with varying levels of substantiation. Bank of America recognizes that the comparative GHG emissions and water
impacts from paper versus electronic statements depend greatly on the specifics of the production, transportation, use, and disposal
systems. Therefore, the company commissioned this study to determine the difference in GHG emissions and water consumption
from the life cycle of their company’s specific statement delivery systems.
6.2 INTENDED APPLICATIONS
■ To provide useful environmental information to customers to help inform their choice of electronic or paper statement delivery;
■ To inform internal discussions within Bank of America on the comparative environmental impacts of the two statement
delivery methods so that they may improve the company’s environmental performance.
6.3 TARGET AUDIENCE
The study results are prepared primarily for Bank of America’s internal use and will be communicated externally through a
summary version of this study that will be made available on the bank’s website.
6.4 COMPARATIVE ASSERTION FOR PUBLIC DISCLOSURE
This study was conducted to support a comparative assertion for public disclosure. The comparison is not on an absolute basis, but
rather the difference in GHG emissions and water consumption between the two statement delivery methods. The study focuses
only on Bank of America’s statement production and delivery methods and is not intended to be generalized through comparisons
of electronic and paper delivery of information from any other institution. The study is limited only to Bank of America’s checking,
savings, home loan, credit card, and investment account statements and, thus, does not consider products with equal or comparable
functionality produced by other institutions.
9 Modeling for all systems in this study were conducted in the LCA software GaBi ts, developed by thinkstep (http://www.gabi-
software.com/america/index/).
Comparative LCA of Electronic and Paper Statements
Bank of America
WSP USA
July 17, 2018
Page 26

7 SCOPE OF THE STUDY
7.1 FUNCTION
The function of a statement is to deliver information about the status of an account such as the balance, history of transact ions, and
need for payment. The performance characteristics of statements include the accurate, complete, and timely presentation of the
aforementioned account information. Additional functions of the statement, such as for archiving and/or electronically sharing bank
information for tax or other purposes, have not been included in this study. Statements are delivered at a rate of one per month, per
account type, to a customer.
7.2 FUNCTIONAL UNIT
The function of the statement is to provide information about an account to the account-holder. Regardless of paper or electronic
delivery, the statement contains the same information. The functional unit of this study is one statement. The average statement is 2.5 pages according to Bank of America. The results of this performance measurement are that the selected functional unit
accurately represents the primary function of a statement.
7.3 SYSTEM BOUNDARY
The study’s system boundary is from cradle-to-grave for the life cycle inventory and impact assessment and includes all phases of
the product life cycle from raw material extraction and processing, manufacturing, product assembly, transportation and
distribution, use, to end of life (EOL). The analysis does not include infrastructure processes in either primary data or secondary
data collection efforts.10
Through discussion with bank representatives, the electronic and paper statement’s generation and delivery system was evaluated.
The process for generating statements begins in the same way regardless of the final delivery method. First, the electronic s tatement
is generated in its archivable format. In general, there are two statement document files generated electronically: the archive
document and a document specific for printing purposes. The archive document serves several purposes, one of which is for onl ine
banking (OLB). A single copy of the archive document is stored, and referenced for multiple purposes. The next steps for the
statement depend on the method of delivery selected by the customer.
If the customer selected paper delivery, then a separate electronic statement file is generated from the archive document and sent
electronically to Document Fulfillment Services (DFS) at Bank of America facilities within the United States. Paper statements are
created based on that DFS electronic file. Those paper statements are converted (printed, folded, put in envelopes, and envelopes
sealed) by machinery primarily owned and operated by Bank of America. If the customer does not select paper delivery, the DFS
electronic document is not generated. DFS does not permanently store copies of the electronic documents beyond a limited amount
of time after they are printed. After the DFS electronic file is destroyed, the archive document is referenced if reprints are required.
If the customer selected electronic delivery, then the archive electronic document undergoes the following steps to prepare it for
OLB viewing:
(1) The archive ingests the statement images
(2) Storage information is sent to an application that indexes the statement images for OLB retrieval
(3) That index information is provided to OLB; links are added to the document so that the customer can access the
statement information in OLB
(4) Email notification is sent to the customer that statement is ready to view
10 Infrastructure processes comprise the production of capital equipment and machinery that are used to extract and process materials and produce
products, and also infrastructure for energy, water, waste, and transport processes.
Comparative LCA of Electronic and Paper Statements
Bank of America
WSP USA
July 17, 2018
Page 27

If the customer does not have OLB, these steps do not occur. The archive document is kept in storage, as required by law, but the
links for access in OLB are not created and no email is sent to the customer. The archive is the system of record for electronic
storage and it supports electronic retrieval, reprints, OLB, and other functions.
All product life cycle phases are included in the study’s boundary. A process map is shown in Figure 5. Unit processes shown in
orange are common to both paper and electronic statement delivery and, therefore, are not included in the comparative analysis.
Unit processes shown in blue are processes operated by the bank and its direct partners and for which primary data have been
collected. Unit processes shown in green are processes not operated by the bank or its direct partners and for which secondary data
have been collected.
The specific key phases considered for the paper statements include:
■ Extraction of raw materials used to make paper
■ Transportation required to supply the paper mill with pulp and other materials
■ Paper production
■ Transportation of the finished paper from the mills to the printing and converting facility
■ Electronic generation and transition of the file used to print the statement
■ Printing and converting of statements (folding, making envelopes, stuffing envelopes, sealing envelopes) into ready-to-mail
products
■ Transportation of statements to customers in the United States via the United States Postal Service (USPS)
■ The use phase of the product
■ The EOL of the paper statement (including shredding, landfilling and incineration)
■ Electricity generation and consumption for all phases
The key phases considered for the electronic statements include:
■ Electronic processing of archived statement to OLB readable form
■ Electronic delivery of statement availability notice to customer via email
■ Electronic viewing of statements by customers on personal devices which include desktops, laptops, tablets, and cellphones
■ Printing of statements by customers at home (including home paper production and transportation, and electricity for printing,
plus EOL considerations similar to paper statements such as shredding, landfilling, and incineration)
■ Electricity generation and consumption for all phases
We include the possibility for home printing assuming that some customers will print their electronic statements at home. Based on
similar studies, we assume there is a 25% probability that the statement will be printed, therefore the 25% of the energy and
materials to print the statement at home are included in the system boundary (Le Pochat, Berthoud, Gaborit, & Mary, 2010),
(Moberg, Borggren, Finnveden, & Tyskeng, 2008).
Note that since the goal of the study is to calculate the difference in GHG emissions and BWC between electronic and paper
statements, this study’s system boundary includes only the differences between the two systems. Regardless of the delivery method
of the statement, the information contained therein is generated as an archive document and stored by the bank in servers contained
in data centers. Furthermore, the statements must be electronically stored for the same amount of time regardless of if the statement
is delivered electronically or in paper format to the customer. Therefore, the infrastructure and energy for generating and s toring
statements is the same for both paper and electronic statements and not relevant to the calculat ion of the difference in GHG
emissions and water consumption. As a result of this system boundary, only the differences between the two systems will be
presented and percent contributions from life cycle phases for each system are presented solely to illus trate the drivers of
differences between the two systems.
Comparative LCA of Electronic and Paper Statements
Bank of America
WSP USA
July 17, 2018
Page 28

Waste generation and disposal methods are accounted for where they are included in the GaBi LCI unit process data and based on
information from the United States Environmental Protection Agency (EPA) for the percentages of paper that are recycled,
landfilled or incinerated in the United States. Percentages are based on the Newspaper/Mechanical Papers product category. The
recycling rate is 68.2%; the incineration rate is 6.2%, and the landfill rate is 25.6% (EPA, Advancing Sustainable Materials
Management: 2014 Tables and Figures, 2016). It is assumed that all statements are shredded, and therefore cannot be recycled
(Paper Shredding: Tips and Recycling info, 2016), so the incineration and landfill rates were adjusted to 19% and 81%,
respectively, to take into account that no recycling takes place. A sensitivity analysis was conducted to determine the impacts if no
statements were shredded, and the standard US recycling rate was applied.
Comparative LCA of Electronic and Paper Statements
Bank of America
WSP USA
July 17, 2018
Page 29

Figure 5: Process Maps
Paper Statements
Online Statements
Processes are common to both paper and
electronic statement delivery; not included in the
analysis
Processes operated by the bank and its direct
partners; primary data collected
Processes not operated by the bank or its direct
partners; secondary data collected
Comparative LCA of Electronic and Paper Statements
Bank of America
WSP USA
January 22, 2018
Page 30

7.4 ENERGY AND MATERIAL CONSUMPTION
To quantify energy and material inputs and outputs, WSP collected primary data from Bank of America and its primary paper
production partner. The majority of statement paper (99.2%) produced for the bank comes from three of the partner’s mills.
Primary activity and inventory data have been collected for three facilities operated by the primary paper partner. This incl udes the
transportation of materials to the mill, all mill energy and activities, co-products of production, and transport of final paper rolls to
the DFS. The bank has two DFS facilities in two confidential locations in the United States.
The data for converting the paper into statements ready to mail include cutting the roll of paper into sheets, printing the statements,
folding the paper statements, creating and stuffing envelopes, sealing envelopes, and printing postage. Inputs, outputs and
conversion rates for these processes were collected from DFS by means of energy monitors on actual printing machines; the amount
of actual peak and non-production run time against the peak and non-production energy consumption rates across an average month,
compared to the total sheets processed both in Bank of America printer and insertion hardware.
From DFS, the statements travel by USPS to customers via first class mail. Data on the average path of a first-class letter were
collected from USPS documentation (How a Letter Travels, n.d.)
For electronic statement viewing, energy data for using computers to access statements through the Bank of America website or
mobile devices through the Bank of America mobile banking app were calculated based on energy to run these devices and the
average session times for bank customers. Printing of online statements at home was also evaluated and this added the production
and transport of paper and ink, plus the energy to print and shred statements at home.
7.5 ENERGY PRODUCTION
The United States electricity grid as per the USEPA’s eGRID 2012 regional data in GaBi were used for the unit processes
conducted in the United States. LCI data on the production and combustion of transportation fuels, such as gasoline, diesel, and jet
fuel, for the transportation of mail were sourced from the GaBi databases.
A complete list of energy databases used in the model (e.g., electricity, natural gas, other fuels) will be provided.
7.6 CUT-OFF CRITERIA
Any cut-off criteria implemented in the ecoinvent or GaBi databases are included in this assessment. The product ion and disposal of
devices for viewing statements has been cut-off from the system boundary. The cut-off criteria applied in this study for the
exclusion of the production of devices and EOL (laptops, PCs, tablets and mobile phones) for viewing statements is based on the
time that the device is used where time is a proxy for energy. Section 4.2.3.3.3 of the ISO standard 14044 notes three methods for
cut-off criteria: mass, energy, and environmental impact. The cut-off criteria based on percentage of environmental impacts cannot
be calculated in this study because the total GHG emissions and BWC of an online statement (and a paper statement) have not been
calculated. Only the absolute value of the difference between the two statement delivery methods has been calculated. Therefore,
the cut-off criteria can only be based on the mass or energy inputs to the system. While electronic devices have mass, the primary
contributors to the impacts of the electronic statement are energy related, such as electricity, which does not have mass. Therefore,
energy is the remaining option for the basis of cut-off criteria.
The energy that the device uses in order to view a statement has already been included in the study. Data on the embodied energy in
devices is difficult to source and ranges widely as discussed later in this report. Therefore, the cut-off criteria used in this study
relates the embodied energy in the device to the amount of time the device is used to view a statement compared to the total amount
of time the device is used over its lifetime. These devices (PCs, laptops, tablets, and smartphones) are truly multifunctional (i.e.,
they can be used for written, oral, and video communication, navigation, to capture still or moving images, for work purposes , and
for leisure) and the customer does not purchase the device for the purpose of statement-viewing. Therefore, if less than 1% of the
devices’ total lifetime of active usage is devoted to viewing statements, then it meets the cut -off criteria for exclusion from the
inputs to the study.
Comparative LCA of Electronic and Paper Statements
Bank of America
WSP USA
January 22, 2018
Page 31
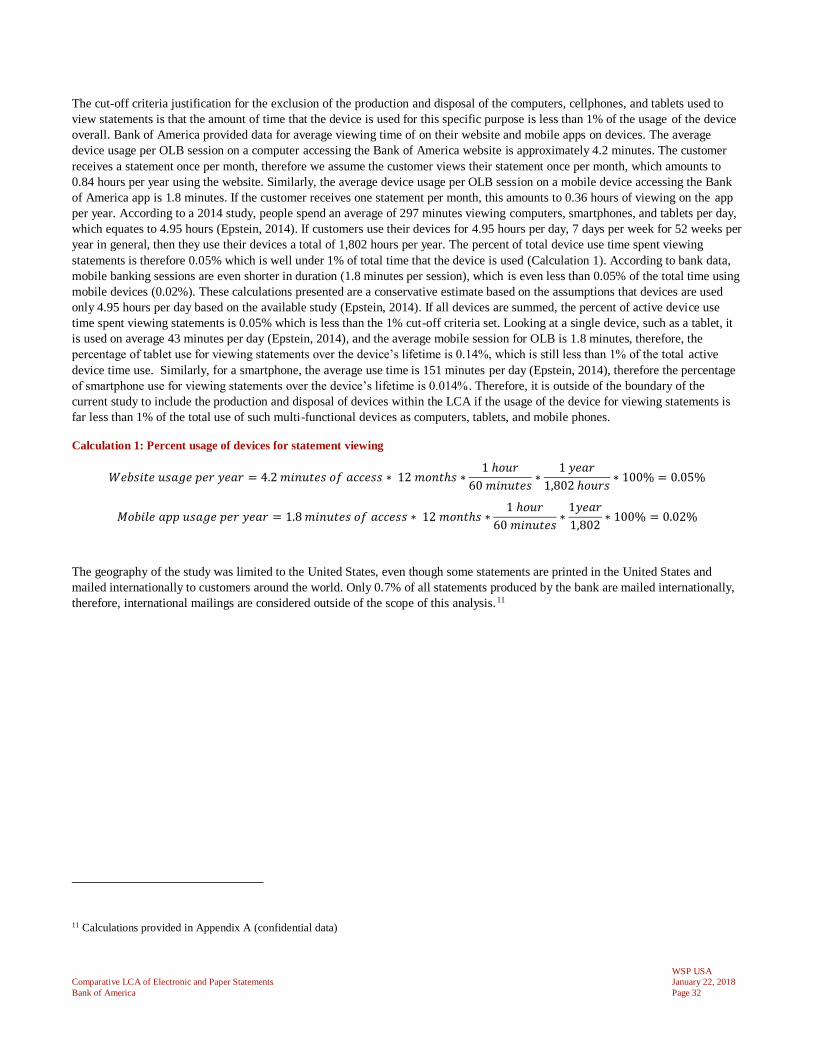
The cut-off criteria justification for the exclusion of the production and disposal of the computers, cellphones, and tablets used to
view statements is that the amount of time that the device is used for this specific purpose is less than 1% of the usage of the device
overall. Bank of America provided data for average viewing time of on their website and mobile apps on devices. The average
device usage per OLB session on a computer accessing the Bank of America website is approximately 4.2 minutes. The customer
receives a statement once per month, therefore we assume the customer views their statement once per month, which amounts to
0.84 hours per year using the website. Similarly, the average device usage per OLB session on a mobile device accessing the Bank
of America app is 1.8 minutes. If the customer receives one statement per month, this amounts to 0.36 hours of viewing on the app
per year. According to a 2014 study, people spend an average of 297 minutes viewing computers, smartphones, and tablets per day,
which equates to 4.95 hours (Epstein, 2014). If customers use their devices for 4.95 hours per day, 7 days per week for 52 weeks per
year in general, then they use their devices a total of 1,802 hours per year. The percent of total device use time spent viewing
statements is therefore 0.05% which is well under 1% of total time that the device is used (Calculation 1). According to bank data,
mobile banking sessions are even shorter in duration (1.8 minutes per session), which is even less than 0.05% of the total time using
mobile devices (0.02%). These calculations presented are a conservative estimate based on the assumptions that devices are used
only 4.95 hours per day based on the available study (Epstein, 2014). If all devices are summed, the percent of active device use
time spent viewing statements is 0.05% which is less than the 1% cut-off criteria set. Looking at a single device, such as a tablet, it
is used on average 43 minutes per day (Epstein, 2014), and the average mobile session for OLB is 1.8 minutes, therefore, the
percentage of tablet use for viewing statements over the device’s lifetime is 0.14%, which is still less than 1% of the total active
device time use. Similarly, for a smartphone, the average use time is 151 minutes per day (Epstein, 2014), therefore the percentage
of smartphone use for viewing statements over the device’s lifetime is 0.014% . Therefore, it is outside of the boundary of the
current study to include the production and disposal of devices within the LCA if the usage of the device for viewing statements is
far less than 1% of the total use of such multi-functional devices as computers, tablets, and mobile phones.
Calculation 1: Percent usage of devices for statement viewing
𝑊𝑒𝑏𝑠𝑖𝑡𝑒 𝑢𝑠𝑎𝑔𝑒 𝑝𝑒𝑟 𝑦𝑒𝑎𝑟 = 4.2 𝑚𝑖𝑛𝑢𝑡𝑒𝑠 𝑜𝑓 𝑎𝑐𝑐𝑒𝑠𝑠 ∗ 12 𝑚𝑜𝑛𝑡ℎ𝑠 ∗1 ℎ𝑜𝑢𝑟
60 𝑚𝑖𝑛𝑢𝑡𝑒𝑠∗
1 𝑦𝑒𝑎𝑟
1,802 ℎ𝑜𝑢𝑟𝑠∗ 100% = 0.05%
𝑀𝑜𝑏𝑖𝑙𝑒 𝑎𝑝𝑝 𝑢𝑠𝑎𝑔𝑒 𝑝𝑒𝑟 𝑦𝑒𝑎𝑟 = 1.8 𝑚𝑖𝑛𝑢𝑡𝑒𝑠 𝑜𝑓 𝑎𝑐𝑐𝑒𝑠𝑠 ∗ 12 𝑚𝑜𝑛𝑡ℎ𝑠 ∗1 ℎ𝑜𝑢𝑟
60 𝑚𝑖𝑛𝑢𝑡𝑒𝑠∗
1𝑦𝑒𝑎𝑟
1,802∗ 100% = 0.02%
The geography of the study was limited to the United States, even though some statements are printed in the United States and
mailed internationally to customers around the world. Only 0.7% of all statements produced by the bank are mailed internationally,
therefore, international mailings are considered outside of the scope of this analysis.11
11 Calculations provided in Appendix A (confidential data)
Comparative LCA of Electronic and Paper Statements
Bank of America
WSP USA
January 22, 2018
Page 32

8 LIFE CYCLE INVENTORY ANALYSIS
8.1 DATA COLLECTION PROCEDURES
This section describes how various sources of primary product activity data have been collected for each phase of the product life
cycle, for both paper statements and electronic statements.
8.1.1 PAPER STATEMENTS
8.1.1.1 STATEMENT GENERATED AND STORED
Because the process for generating statements begins in the same way regardless of the final delivery method, the impacts from
generating the statement were not modeled for either delivery method.
Once the archivable version of the statement is created, extra processing occurs for both delivery methods to ready the statement to
be either printed or accessed online. Because these extra steps occur in both delivery methods, the impacts were not modeled for
either delivery method.
8.1.1.2 MATERIAL PRODUCTION FOR STATEMENTS AND ENVELOPES
The raw data for the production of paper for each paper mill were provided to WSP directly from the paper company. The primary
data inputs included the fuels, wood, and chemicals for the paper. Table 22 in the Appendix (confidential data) shows the total paper
production inputs for all three mills normalized by the percentage of paper provided to Bank of America from each mill. Secondary
data on logging were included in the datasets sourced from GaBi on wood production. These secondary datasets included all
activities related to logging. Outputs of the paper production process are shown in Table 23 (confidential data) in the Appendix. The
percentage of paper supplied per mill was provided directly from the paper company.
The paper company provided the transportation distance traveled and method that each paper production input material travels to
produce the paper per mill. Total distance travelled was calculated by multiplying the provided distance per load by the number of
loads per year. Because the number of loads per year was only provided for one of the three mills, the distance travelled per weight
was calculated per transportation method. This intensity was then applied to the other two mills to calculate distance traveled per
transportation method. Table 24 (confidential data) shows the aggregated transportation data normalized by the percentage of paper
provided to Bank of America from each mill.
8.1.1.3 TRANSPORTATION FROM MILL TO DOCUMENT FULFILLMENT SERVICES
Paper travels from the mill to Document Fulfillment Services (DFS) via diesel truck. Since the paper comes from three mills and is
sent to two DFS locations, the average distance the paper travels was calculated using Calculation 2. Bank of America provided
information that each DFS facility prints approximately half of all statements.
Calculation 2: Average distance traveled by paper from mill to DFS
𝐴𝑣𝑒𝑟𝑎𝑔𝑒 𝐷𝑖𝑠𝑡𝑎𝑛𝑐𝑒
= (50% ∗ % of paper supplied from MillA ∗ MillAdistance to DFS1)
+ (50% ∗ % of paper supplied from MillA ∗ MillAdistance to DFS2)
+ (50% ∗ % of paper supplied from MillB ∗ MillBdistance to DFS1)
+ (50% ∗ % of paper supplied from MillB ∗ MillBdistance to DFS2)
+ (50% ∗ % of paper supplied from MillC ∗ MillCdistance to DFS1)
+ (50% ∗ % of paper supplied from MillC ∗ MillCdistance to DFS2)
The weighted average distance calculated from the formula above is 889.5 miles.
The mass of the paper that travels from the mill to DFS for one complete statement is comprised of the components shown in Table
6. In a statement, there is an outer envelope that contains all of the contents of the statement. There is also an inner envelope for
return correspondence. The outer envelope mass is 0.00798 kg (Moberg, Borggren, Finnveden, & Tyskeng, 2008). The inner
Comparative LCA of Electronic and Paper Statements
Bank of America
WSP USA
January 22, 2018
Page 33

envelope weight (0.00638 kg) is based on direct measurement of the inner and outer envelopes and calculated to be 4/5 of the mass
of the outer envelope (0.00798 kg *(4/5)). The mass of one piece of paper, 0.005 kg, was determined by weighing one piece of copy
paper.
Table 6: Mass of paper from mill to DFS
Item Mass (kg)
2.5 pieces of papera 0.0125
Outer envelope paper 0.00798
Inner envelope paper 0.00638
Total 0.02686
a One piece of paper = 0.005 kg
8.1.1.4 STATEMENT PREPARATION
The following steps occur at both DFS locations:
• Printing the statement
• Creating the inner and outer envelope purchased from vendor
• Folding the statement and placing it into the envelope
• Sealing the envelope
Statement ink was calculated based on the difference in the full weight and empty weight of ink cartridges with 15%-page coverage
as shown in Table 7 (Inkjet Cartridge Volumes and Page Yields, 2017). To calculate ink use per page, the ink weight was divided
by the number of page yields. The ink use per page from all cartridges was averaged to calculate the average ink weight per page
(0.04 g per page), and this value was multiplied by 2.5 pages per statement to calculate total statement ink (0.11 g). Statement
advertising inserts and regulatory information were excluded from the system.
Comparative LCA of Electronic and Paper Statements
Bank of America
WSP USA
January 22, 2018
Page 34

Table 7: Ink weight
OEM Code Empty Weight
(grams)
Full Weight
(grams)
Weight of Ink
(grams)
Page Yields @
15% Coverage
Ink per Page
(grams)
HP 51641a 110 134 24 461 0.05
HP 51649a 45 54 9 450 0.02
HP c1823d 110 130 20 690 0.03
HP c6578dn 96 115 19 450 0.04
HP c6578a 100 125 25 450 0.06
HP c6625an (30ml) 100 125 25 430 0.06
HP c6657an 37 48 11 391 0.03
HP c8728an 36 45 9 190 0.05
c8766wn(No.95) 33 40 7 260 0.03
c9363wn(No.97) 34 42 8 450 0.02
Lexmark 10n0026 23 30 7 275 0.03
Lexmark 10n0227 23 29 6 275 0.02
Lexmark 12a1980 43 60 17 275 0.06
Lexmark 15m0120 43 60 17 275 0.06
Lexmark 17g0060 43 60 17 225 0.08
Lexmark 12a1990 43 60 17 450 0.04
Lexmark 18c0031 32 41 9 135 0.07
The electricity to produce and fold 1 envelope is 0.0034 Wh per envelope (Moberg, Borggren, Finnveden, & Tyskeng, 2008). Total
electricity to produce both the outer and inner envelope is 0.0000068 kWh (2*0.0034 kWh / 1,000).
Electricity usage for printing was provided directly from DFS (Miller, 2017) and consisted of the electricity required to print and
insert 1 sheet of paper. Electricity usage per 1 sheet of paper is 0.002647 kWh, which equates to 0.0066175 kWh (2.5 * 0.002647
kWh) per statement. These data were collected based on machinery specifications and metered electricity and the time that the
machine is operating to produce statements (Miller, 2017).
The annual water usage at both DFS locations is 1,632 gallons (Miller, 2017) and these locations mail approximately 680,000,000
pieces of mail per year. Therefore, the water use is per piece of mail is 0.0000024 gallons or 0.000009072 kg. These data were
based observations of water used at the DFS facilities (Miller, 2017).
Relevant masses and energy use by type and source are presented in Table 8.
Comparative LCA of Electronic and Paper Statements
Bank of America
WSP USA
January 22, 2018
Page 35

Table 8: Paper statement inputs
Input Amount per
Statement
Unit Source
Paper 0.0269 kg (Moberg, Borggren, Finnveden, & Tyskeng, 2008)
Plastic Film 0.0004 kg (Moberg, Borggren, Finnveden, & Tyskeng, 2008)
Glue 0.0003 kg (Moberg, Borggren, Finnveden, & Tyskeng, 2008)
Statement Ink 0.0001 kg (Inkjet Cartridge Volumes and Page Yields, 2017)
Envelope Ink 0.0004 kg (Moberg, Borggren, Finnveden, & Tyskeng, 2008)
Tap Water 9.072E-06 kg (Miller, 2017)
Envelope Production Electricity 6.800E-06 kWh (Moberg, Borggren, Finnveden, & Tyskeng, 2008)
Printing and Inserting Statement 0.0066175 kWh (Miller, 2017)
8.1.1.5 TRANSPORT BY USPS
The completed statement travels the following distances from the DFS to the customer. Transportation path is based on USPS
information (How a Letter Travels, n.d.). The mass of the total statement (0.028 kg) is carried the distances by each transportation
mode outlined in Table 9. The impacts of the production of the transport means (e.g., trucks, trains, and planes) were not included.
Table 9: USPS transportation paths
Start End Mode Distance (miles)
DFS USPS regional processing and distribution center (P&DC) Truck 25
P&DC Origin Airport Truck 25
Origin Airport Destination Airport Plane 500
Destination Airport USPS branch Truck 20
USPS branch Customer Truck 5
8.1.1.6 USE PHASE
The use phase is not applicable to the paper statement.
8.1.1.7 END OF LIFE
It is assumed that the 2.5 pages of statement are shredded by the customer for security purposes because bank statements contain
sensitive information. Shredder energy consumption of 0.0009 kWh per statement was calculated based on the information that the
shredder can shred up to 12 sheets of paper per pass, with a maximum speed of 6.2 feet per minute (Calculation 3). These shredder
assumptions are based on a standard home use shredder available from an office supply store (Ativa® 12-Sheet Micro-Cut
Shredder, C184-E).
Comparative LCA of Electronic and Paper Statements
Bank of America
WSP USA
January 22, 2018
Page 36

Calculation 3: Shredder energy
𝑆ℎ𝑟𝑒𝑑𝑑𝑒𝑟 𝐸𝑛𝑒𝑟𝑔𝑦 𝑝𝑒𝑟 𝑆𝑡𝑎𝑡𝑒𝑚𝑒𝑛𝑡 = 360 𝑊 ∗1 𝑘𝑊
1000 𝑊∗
11 𝑖𝑛
𝑠𝑡𝑎𝑡𝑒𝑚𝑒𝑛𝑡∗
1 𝑓𝑡
12 𝑖𝑛∗
1
6.2𝑓𝑡
𝑚𝑖𝑛
∗ 1 ℎ𝑟
60 𝑚𝑖𝑛= 0.0009 𝑘𝑊ℎ
At end-of-life (EoL), the statement is then landfilled or incinerated. Because shredded paper cannot typically be recycled, recycling
impacts were not considered in the study (Paper Shredding: Tips and Recycling info, 2016). The landfilled and incinerated rates are
based on 2014 EPA published disposal rates for newspapers/mechanical papers (Table 10) (EPA, Advancing Sustainable Materials
Management: 2014 Tables and Figures, 2016) and scaled up to consider the absence of recycling. The rates are then multiplied by
the total weight of one complete shipped statement to calculate the mass of landfilled and incinerated material.
Table 10: Disposal rates and methods
Disposal Method % Disposed Weight Disposed (kg)
Landfilled 81% 0.0227
Incineration 19% 0.0055
8.1.2 ONLINE STATEMENTS
8.1.2.1 STATEMENT GENERATION AND STORAGE
Since the process for generating statements begins in the same way regardless of the final delivery method, the impacts from
generating the statement were not modeled for either delivery method.
Once the archivable version of the statement is created, processing occurs for both delivery methods to ready the statement to be
either printed or accessed online. As these extra steps occur in both delivery methods, the impacts were not modeled for either
delivery method.
8.1.2.2 ELECTRONIC STATEMENT DISTRIBUTION
The electricity usage for distributing an invoice over the internet was modeled using an internet electricity intensity factor (Aslan,
Mayers, Koomey, & France, 2017). This factor is the average electricity intensity of transmitting data through the internet and is
quantified in kWh/GB. The system boundary for the system includes data centers, Internet Protocol (IP) core network, access
networks, home/on-site networking equipment, and user devices. This does not include the production of the data centers
themselves or the electronic equipment. Since the intensity factor of 7.2 kWh/GB applies to data year 2012, this factor was adjusted
to apply to data year 2016. It was assumed that the energy needed per amount of data transmitted over the internet decreases by 30%
per year (Coroama & Hilty, 2014), thus giving a 2016 intensity of 1.73 kWh/GB (Table 11).
Table 11: Internet electricity adjustment calculations
Year Calculation Intensity (kWh / GB)
2012 None 7.20
2013 7.20 * 70% 5.04
2014 5.04 * 70% 3.53
2015 3.53 * 70% 2.47
2016 2.47 * 70% 1.73
Comparative LCA of Electronic and Paper Statements
Bank of America
WSP USA
January 22, 2018
Page 37
The average size of an electronic invoice is 4.375 kB based on a study that found that a two-page invoice is 3.5 kB (Moberg,
Borggren, Finnveden, & Tyskeng, 2008). This was extrapolated to 2.5 pages in Calculation 4.
Calculation 4: Size of electronic statement
3.5 kB
2 pages∗ 2.5 pages = 4.375 kB
The total internet electricity use is 0.000007563 kWh based on the statement size of 4.375 kB (Calculation 5).
Calculation 5: Energy for viewing statements online only
1.73kWh
GB∗ 4.375 𝑘𝐵 ∗
1 𝐺𝐵
1,000,000 𝑘𝐵= 0.000007563 kWh
Additional internet electricity is used to download the statement. Based on the measured data, the size of the downloaded statement
is 350 kB, which requires additional internet electricity use 0.000605 kWh. This results in total internet electricity use of
0.000612615 kWh (Calculation 6) to view and download a statement.
Calculation 6: Energy for viewing and downloading statements
(1.73kWh
GB∗ 4.375 𝑘𝐵 ∗
1 𝐺𝐵
1,000,000 𝑘𝐵) + (1.73
kWh
GB∗ 350 𝑘𝐵 ∗
1 𝐺𝐵
1,000,000 𝑘𝐵) = 0.000613 kWh
Though we acknowledge that user behavior with online viewing varies, this report assumes that a customer is viewing a statement
online, and a certain percentage of customers are also downloading, printing, shredding, and disposing the statement at home.
Additional scenarios are described in the Sensitivity Analysis Section 8.5.
8.1.2.3 USE PHASE: CUSTOMER VIEWS STATEMENT
An electronic statement could be viewed on a variety of devices, including a desktop computer, notebook PC, tablet, or smartphone;
thus, all of these devices were considered in this study. The energy use for a desktop computer includes the energy for the computer
and the monitor. The energy use per device is shown in Table 12 below.
The percent of usage was calculated by dividing the minutes an average person in the United States spends viewing a computer,
smartphone, and tablet, per day (Epstein, 2014) by the total amount of time a person spends viewing these three devices per day, as
shown in Table 12. Because this study did not differentiate computer viewing by a laptop or a desktop, the 2015 sales data of
laptops and desktops was applied to the percent of time a person spends viewing a computer (Darrow, 2016).
The average energy use was then calculated by multiplying each device’s energy by its percent of use, as shown in Calculation 7.
Calculation 7: Average energy use for electronic devices
(117 𝑊 ∗ 14%) + (25 𝑊 ∗ 21%) + (25 𝑊 ∗ 14%) + (15 𝑊 ∗ 51%) = 32.5 𝑊
Comparative LCA of Electronic and Paper Statements
Bank of America
WSP USA
January 22, 2018
Page 38

Table 12: Energy use per viewing device
Device Watts % of Usage Source
Desktop Computer Monitor 42 N/A (Estimating Appliance and Home Electronic Energy Use)
Desktop Computer PC 75 N/A (Estimating Appliance and Home Electronic Energy Use)
Total Desktop (Monitor and PC) 117 14% (Estimating Appliance and Home Electronic Energy Use)
Notebook PC 25 21% (Estimating Appliance and Home Electronic Energy Use)
Tablet 25 14% (Watt Finders Guide LG&E)
Smartphone 15 51% (Trollinger, 2016)
Average Energy for Electronic
Devices
32.5
The internet electricity intensity factor includes the energy use from user devices. The energy includes accessing the internet, rather
than the time spent on the device viewing the internet. Therefore, device energy use was modeled separately to account for the
energy from the time spent on the device.
It was assumed that customers spend 15 minutes using their devices to look at statements online, based on one of the longer viewing
scenarios described in Le Pochat’s Comparative LCA of a Digital Invoice Versus a Paper Invoice (Le Pochat, Berthoud, Gaborit, &
Mary, 2010). This is a conservative estimation of time spent viewing statements based on previous published studies because, even
though Bank of America has data on time spent using OLB for the website and mobile app, it cannot distinguish between time spent
viewing statements and time spent using OLB for other activities such as paying bills or transferring money. Furthermore, Bank of
America cannot track if statements are downloaded or printed, therefore, the statement might be viewed on a computer or mobil e
device (once downloaded) after the customer logs off of their OLB session. The total device energy use is 0.0081 kWh for viewing
1 statement for 15 minutes (Calculation 8).
Calculation 8: Time viewing statements on an average electronic device
32.5 W ∗1 𝑘𝑊
1000 𝑊∗ 15 𝑚𝑖𝑛𝑢𝑡𝑒𝑠 ∗
1 ℎ𝑟
60 𝑚𝑖𝑛𝑢𝑡𝑒𝑠= 0.0081 𝑘𝑊ℎ
8.1.2.4 USE PHASE: CUSTOMER PRINTS STATEMENT
The paper used to print the statement at home was included in the analysis. Like for the paper statement, the mass of 2.5 pieces of
paper (0.0125 kg) was the basis for the analysis. The average Bank of America customer cannot use the same paper that the paper
company supplies to Bank of America because this paper is not available for retail sale. Since the average Bank of America
customer does not have access to Bank of America-specific paper; it was assumed that paper for printing at home was industry
average paper. Therefore, modeled primary paper data from Bank of America’s paper producer were not used to model at-home
printing. The at-home printing analysis instead utilized datasets from GaBi.
The transportation necessary for paper and ink to be used at a customer’s home to print an online statement was modeled. This
includes both upstream transportation of the customer to transport the paper and ink to a store, as well as the customer’s travel to the
store, as shown in Table 13. The total mass of materials transported is the mass of 2.5 pieces of paper (0.0125 kg) and the mass of
the ink on a statement (0.0001 kg).
Comparative LCA of Electronic and Paper Statements
Bank of America
WSP USA
January 22, 2018
Page 39

Table 13: Transportation required for materials to print an online statement
Transportation Path Distance Transportation Mode
Paper Manufacturer to Converter 20 50% Truck, 50% Train
Converter to Distributor 250 Truck
Distributor to Store 250 Truck
Customer to Store 20 Truck
The energy from printing a statement was also modeled. Printing speed is assumed to be 14 pages per minute inkjet and multi-
function printers, and 20 pages per minute for laser printers (Technology Knowledge, n.d.), therefore requiring 0.18 minutes, 0.13
minutes, and 0.18 minutes to print 2.5 pages on a inkjet, laser, or multi-function printer, respectively. kWh per statement was
calculated by multiplying the kilowattage per printer type by the time it takes to print 2.5 pages.
Average energy use, shown in Table 14, was calculated by analyzing the market saturation of each type of printer (inkjet, laser, and
multi-function) from large office retailers. The total printers available by printer type was summed across the four retailers, and then
divided by the total printers offered per retailer to calculate the market saturation by printer type. This method was used to calculate
the average printer energy use because no data on printer sales was available.
Table 14: Printer energy by type
Printer Type Watts kWh per
Statement
% of Market
Saturation
Watt Source
Inkjet 13 0.0000387 16% (Estimating Appliance and Home Electronic Energy Use, 2017)
Laser 250 0.0005208 74% (Estimating Appliance and Home Electronic Energy Use, 2017)
Multi-Function 18 0.0000536 9% (Estimating Appliance and Home Electronic Energy Use, 2017)
Printer energy use was calculated by multiplying the kWh required to print 2.5 pages by the % of market saturation (Calculation 9).
Calculation 9: Printer energy use
(16% ∗ 0.0000387 𝑘𝑊ℎ) + (74% ∗ 0.0005208 𝑘𝑊ℎ) + (9% ∗ 0.0000536 𝑘𝑊ℎ) = 0.0003988 kWh per statement
8.1.2.5 END OF LIFE
The same shredder energy assumptions from the paper statement were used to model the electronic statement, as described in
Section 8.1.1.7.
After shredding, the statement is then landfilled or incinerated. Because shredded paper cannot typically be recycled, recycling
impacts were not considered in the study (Paper Shredding: Tips and Recycling info, 2016). The landfilled and incinerated rates are
based on 2014 EPA published disposal rates for newspapers/mechanical papers (Table 15) (EPA, Advancing Sustainable Materials
Management: 2014 Tables and Figures, 2016) and scaled up to consider the absence of recycling. The rates are then multiplied by
the total weight of 2.5 pages to calculate the mass of landfilled and incinerated material (Table 15). The same disposal assumptions
from the paper statement were applied to the printed electronic statement.
Comparative LCA of Electronic and Paper Statements
Bank of America
WSP USA
January 22, 2018
Page 40

Table 15: End of life of printed statements
Disposal Method % Disposed Weight Disposed (kg)
Landfilled 81% 0.0101
Incineration 19% 0.0024
8.2 UNIT PROCESSES
The GaBi professional database, version 6.115 service pack 33 and GaBi extension databases XVII: Full US, XVIII: NREL USLCI
Integrated, and XIII: ecoinvent integrated v3.3 database are the principal sources of secondary LCI data used by this study.
Inputs were identified from information provided by Bank of America and their paper producer, as well as from literature sources,
and were matched to the most representative datasets in the aforementioned databases. Attention was paid to ensure the
compatibility of datasets with respect to system boundaries and modeling assumptions to avoid double-counting. While each of
these items is not an exact match, they provide a good proxy source of data to simplify the analysis, making the project feas ible.
8.3 CALCULATION PROCEDURES
The life cycle activity input data were aggregated in Excel spreadsheets. All life cycle inventory calculations were performed in
GaBi ts®. LCIA results produced in GaBi were exported to Excel spreadsheets for results aggregation and interpretation.
8.4 DATA VALIDATION
All primary activity data including the inputs to Bank of America’s operations and its paper producer were internally validated by
the providers of the data. The primary data from the paper company, transportation, converting, and use phase energy, as well as
EOL data were internally validated by the WSP project manager. Secondary data from the GaBi databases undergo internal
validation by thinkstep as well as external review by DEKRA.12
8.5 SENSITIVITY ANALYSIS
A sensitivity analysis was performed for the online statement system. Three scenarios were created to evaluate three different
customer behaviors when viewing and/or printing a statement and are described below and in Table 16. The customer behaviors
include:
1. Customer only views the statement online
2. Customer views the statement online for a brief amount of time, then downloads, prints, and shreds the statement
3. Customer views the statement online for a longer amount of time, then downloads, prints, and shreds the statement
12 http://www.gabi-software.com/uploads/media/131211_GaBi_Review_Report_Verification_Statement_signed_DEKRA.pdf
Comparative LCA of Electronic and Paper Statements
Bank of America
WSP USA
January 22, 2018
Page 41

Table 16: Scenarios for online statements
Phase Scenario 1 –
Views Only
Scenario 2 – Short View,
Download, Print, Shred
Scenario 3 – Long View,
Download, Print, Shred
Internet Data 4.38 kB 354.38 kB 354.38 kB
Electronic Device Viewing Time 15 minutes 5 minutes 15 minutes
Downloading No Yes Yes
Paper Use No Yes Yes
Printing No Yes Yes
Shredding No Yes Yes
End of Life No Statement incinerated or
landfilled
Statement incinerated or
landfilled
Of these three scenarios, the most conservative assumption is that the customer would both view the statement online for 15 minutes
and all customers would download and print the statement because this scenario would use the most device energy and consume
energy and materials to print and shred the statement.
These scenarios were based on a published journal article (Le Pochat, Berthoud, Gaborit, & Mary, 2010) in which the variable
scenarios in this article were the number of sheets in the statement for the paper statement, the time spent viewing the statement,
printing ratio, and the printing mode for the electronic invoice. Since the number of pages in a statement is not variable for this
study, this input was not variable in the scenarios examined.
The GHG emissions and BWC impacts were calculated for the electronic statement for each of these four scenarios. Customers are
likely to have a range of behaviors and practices for examining online statements in which some may print their statements, while
others may not. No data on actual customer behaviors around printing statements were available either from primary or secondary
sources, therefore, four sensitivity analyses were developed based on scenario 3 to evaluate the influence of customer behavior
assumptions on the GHG emissions and BWC differences between the paper and online statement. These four sensitivity analyses
include:
1. 100% of customers download and print statement
2. 50% of customers download and print the statement, 50% view online only for 15 minutes
3. 25% of customers download and print the statement, 75% view online only for 15 minutes
4. 0% of customers download and print the statement, 100% view online only for 15 minutes
Based on discussions with the commissioner of the study, and value choices by the practitioners, the third scenario in which 25% of
customers download and print the statement was chosen as the primary case to be presented in the results. Assessment of the at-
home printing included the energy for downloading, printing, and shredding the statements as well as the paper for printing.
Three additional sensitivity analyses were undertaken to test the sensitivity of the results and conclusions to 1) the added impacts of
hardware and software of the internet; 2) increased electricity for the internet; and 3) the assumption of no shredding of paper
statements and standard United States recycling rates.
There are several reasons why including the production of electronic devices in this study, even in a sensitivity analysis, become
unreliably uncertain. First, the data on the carbon impacts of device production range widely. A 2014 meta-analysis of 20 LCA
studies on the embodied carbon of personal computers (PCs) and laptops found a range of between 200 and 800 kg CO2e for PCs
and between 100 and 400 kg CO2e for laptops (Malmodin, 2014). If we assume the lifespan of these devices is 3 years, then on
Comparative LCA of Electronic and Paper Statements
Bank of America
WSP USA
January 22, 2018
Page 42

average, the GHG emissions attributable to a PC or laptop for its use as a statement-viewing device is only 4.9gCO2e. Therefore, it
is outside of the system boundary of the current study to include the production and disposal of devices within the LCA if the usage
of the device for viewing statements is far less than 1% of the total use of such multi-functional devices as computers, tablets, and
mobile phones. Allocation Principles and Procedures
Paper production for the paper statement delivered by mail involved the production of pulp for paper making and pulp for sale . We
could not exclude the pulp for sale from the system boundary by sub-division because all of the inputs to paper production such as
chemicals and energy are used throughout the paper production system. Mass allocation was applied to the co-product pulp sold to
allocate the burdens of inputs between the pulp for sale and the pulp for paper production. There are no points of allocation for the
paper statement from printing, transportation, shredding or EOL of the paper statement.
There are no points of allocation in the electronics statement system as there are no co-products from producing, delivering,
viewing, printing, or the EOL of the electronic statement. The avoided burden approach is used to allocate for both the impacts of
the recycled paper in the base case (which assumes no shredding of paper) and for end of life.
Comparative LCA of Electronic and Paper Statements
Bank of America
WSP USA
January 22, 2018
Page 43

9 LIFE CYCLE IMPACT ASSESSMENT
9.1 LCIA PROCEDURES AND CALCULATIONS
LCIA was carried out using characterization factors programmed into GaBi ts®. The two impact categories considered in this
assessment are greenhouse gas emissions (GHG emissions) and blue water consumption (BWC). The Intergovernmental Panel on
Climate Change’s (IPCC) Fifth Assessment Report (AR5) 100-year time-scale excluding biogenic carbon (IPCC AR5 GWP 100
excl. biogen) method was used for quantifying GHG emissions and it is measured in carbon dioxide equivalents (g CO2e). GHG
emissions are referred to as global warming potential (GWP) in GaBi®. These category indicators are internationally accepted. Blue
water refers to surface and ground water only and excludes rain water which is green water. The GaBi BWC characterization
method was used to quantify blue water in this study and it is measured in volume of water (liters or gallons of water).13 These
metrics are mid-point assessment methods. Characterization factor methodology for factors available in GaBi® can be found on the
GaBi website.14
The justification for why these impact categories have been selected, and other have been omitted, stems from the goal of the study
as communicated by the commissioner of the study. Bank of America sought understanding of the relative GHG emission and water
impacts of delivering bank statements electronically and by paper copy with the intention to communicate these insights internally
and externally. The rationale for this is that the study was undertaken to meet the requests of the bank’s stakeholders who are
interested in the GHG emission and water impacts associated with delivering statements electronically and in paper format through
the mail. Therefore, other impact categories are considered outside of the scope of the study because they do not serve to achieve
the goal set forth by the commissioner of the study. The results below are based on the scenario in which 25% of customers view
the statement for 15 minutes and download and print the statement, and the remaining 75% view the statement online for 15 minutes
and do not print.
9.2 LCIA RESULTS
The GaBi ts® software calculates the LCIA results in its balance function and computes the environmental impact results according
to pre-defined characterization methods in the selected LCIA methodology.
9.2.1 GREENHOUSE GAS EMISSIONS
The GHG emissions reduction from switching from a paper statement to an online statement, as characterized by the IPCC AR5
characterization factors for GWP 100, is 73 g CO2e per statement. This assumes that the statement length is 2.5 pages on average.
Also, the baseline of comparison for the following results assumes that 25% of customers print statements at home.
13 Blue water refers to surface and ground water only (excluding rain water, green water). Rain water is typically excluded from the assessment of
freshwater consumption and one focuses on BWC only, as this is the relevant part which can be assessed with current impact assessment methods.
14 http://www.gabi-software.com/international/support/gabi/gabi-lcia-documentation/
Comparative LCA of Electronic and Paper Statements
Bank of America
WSP USA
January 22, 2018
Page 44

The contribution of each life cycle phase to the total GHG emissions per statement type is given in Table 17, Figure 6, and Figure 7.
Table 17: Greenhouse gas emissions by life cycle phase by statement type, per statement
g CO2e /
Statement
Statement
Generated and
Stored
Paper
Production
Transport
from Mill to
BAC
Printing by
BAC
USPS
Transport
Internet
Electricity
Customer
Device
Electricity
At-home
Printing End of Life
Paper
Statement
Common – not
modeled 52.96 7.30 6.99 4.31 N/A N/A N/A 15.08
Online
Statement
Common – not
modeled N/A N/A N/A N/A 0.36 4.74 6.75 1.73
Note: Paper Production only includes the GHG impacts for producing Bank of America’s statement paper. At-home printing includes the GHG impacts from producing the paper that
statements are printed on at-home.
Comparative LCA of Electronic and Paper Statements
Bank of America
WSP USA
January 22, 2018
Page 45

Figure 6: Relative greenhouse gas contribution per life cycle phase for paper statements, per statement
Paper
Production
61%
Transport from
Mill to BAC
9%
Printing by BAC
8%
USPS Transport
5%
End of Life
17%
Figure 7: Relative greenhouse gas contribution per life cycle phase for online statements, per statement
Internet Electricity
2%
At-home
Printing
50%
End of Life
13%
Customer
Device
Electricity 35%
Comparative LCA of Electronic and Paper Statements
Bank of America
WSP USA
January 22, 2018
Page 46
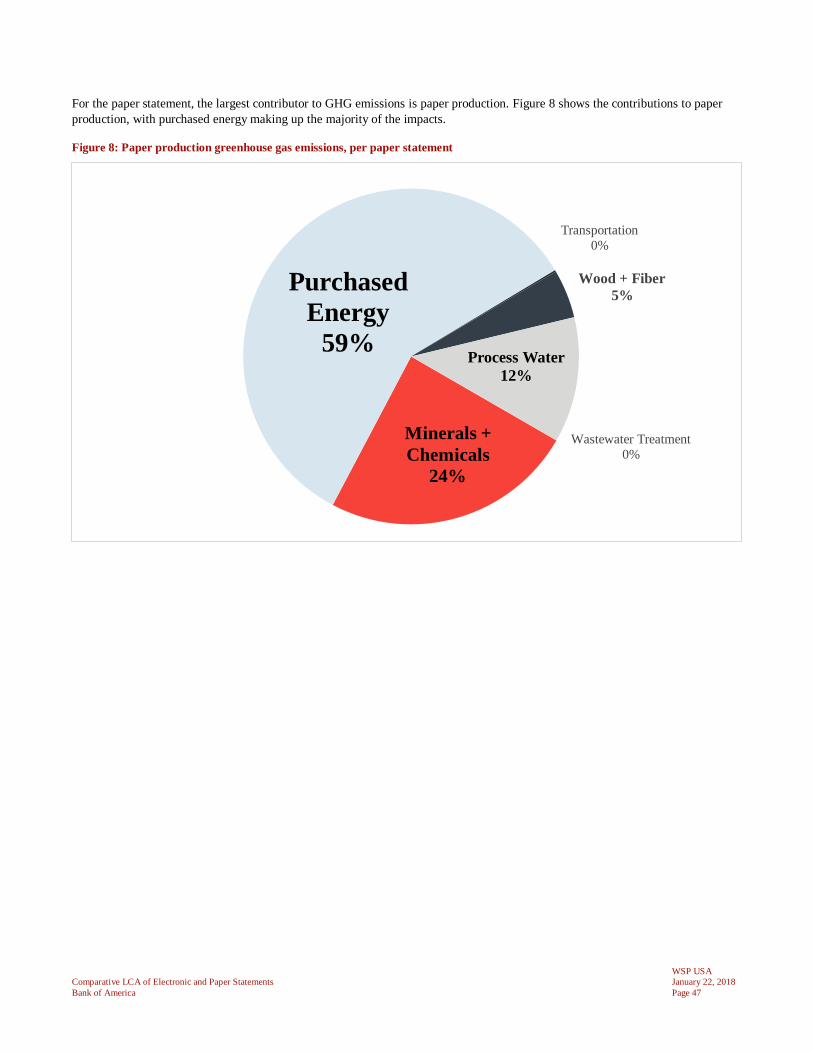
For the paper statement, the largest contributor to GHG emissions is paper production. Figure 8 shows the contributions to paper
production, with purchased energy making up the majority of the impacts.
Figure 8: Paper production greenhouse gas emissions, per paper statement
Minerals +
Chemicals
24%
Purchased
Energy
59%
Transportation
0%
Wood + Fiber
5%
Process Water
12%
Wastewater Treatment
0%
Comparative LCA of Electronic and Paper Statements
Bank of America
WSP USA
January 22, 2018
Page 47

9.2.2 BLUE WATER CONSUMPTION
The BWC reduction between a paper statement and an online statement, as characterized by the GaBi BWC characterization method, is 0.25 gallons of water per statement. This assumes
that the statement length is 2.5 pages on average. Also, the baseline of comparison for the following results assumes that 25% of customers print statements at home.
The contribution of each life cycle phase to the total BWC per statement type is given in Table 18, Figure 9, and Figure 10.
Table 18: BWC results by life cycle phase by statement type, per statement
gal BWC /
Statement
Statement
Generated and
Stored
Paper
Production
Transport
from Mill to
BAC
Printing by
BAC
USPS
Transport
Internet
Electricity
Customer
Device
Electricity
At-home
Printing End of Life
Paper
Statement
Common – not
modeled 0.282 0.003 0.012 0.0004 N/A N/A N/A 0.006
Online
Statement
Common – not
modeled N/A N/A N/A N/A 0.001 0.007 0.048 0.001
Note: Paper Production only includes the BWC impacts for producing Bank of America’s statement paper. At-home printing includes the BWC impacts from producing the paper that
statements are printed on at-home.
Comparative LCA of Electronic and Paper Statements
Bank of America
WSP USA
January 22, 2018
Page 48

Figure 9: Relative BWC contribution per life cycle phase for paper statements, per statement
Paper
Production
93%
Transport from Mill to BAC
1%
Printing by BAC
4%
USPS Transport
0%
End of Life
2%
Figure 10: Relative BWC contribution per life cycle phase for online statements, per statement
Internet Electricity
1%
Customer Device
Electricity
13%
At-home
Printing
85%
End of Life
1%
Comparative LCA of Electronic and Paper Statements
Bank of America
WSP USA
January 22, 2018
Page 49

For the paper statement, the largest contributor to BWC is paper production. Figure 11 shows the contributions to paper production,
with process water making up the majority of the impacts. River Water Credit is wastewater that has been discharged to surface
water after treatment at the paper mill's on-site wastewater treatment plant, and is therefore a negative value because it is adding
water back to the system.
Figure 11: Paper production BWC, per paper statement
0.8
Process
Water
Minerals +
Chemicals
Purchased Energy
gal BWC / Statement
River Water Credit (0.39)
Wastewater Treatment Credit (0.0003)
Transportation 0.000001
Wood + Fiber 0.0001
Purchased Energy 0.02
Minerals + Chemicals 0.20
Process Water 0.46
Wood + Fiber Transportation
Wastewater
Treatment
Credit
River
Water
Credit
-0.4
-0.2
0.0
0.2
0.4
0.6
ga
l B
WC
/ S
tate
men
t
9.3 LCIA RESULTS LIMITATIONS RELATIVE TO DEFINED GOALS
Other impact categories were not quantified in the results of the study because they do not serve to answer the questions defined in
the goal and scope of the study for the intended audience stated in Section 6. As such, the application of the results of this study are
limited to interpretations based on GHG emissions and BWC and cannot be generalized or applied to other environmental impacts.
Comparative LCA of Electronic and Paper Statements
Bank of America
WSP USA
January 22, 2018
Page 50

9.4 IMPACT CATEGORIES AND INDICATORS CONSIDERED
Results from this study are from select impact categories from the IPCC AR5 method as illustrated in Table 19. Other impact
categories have been excluded from the results because they do not answer the questions defined as the goal and scope for the
intended audience in Chapter 6 of this report.
Table 19: Impact categories, units and methods
Impact category Unit Method
GHG emissions g CO2e IPCC AR5: GWP100, excl biogenic carbon
Blue water consumption Gallons of water Water: blue water consumption
9.5 DESCRIPTION OF PRACTITIONER VALUE CHOICES
The practitioner value choices have been limited to the selected LCIA and the allocations procedures described in the relevant
sections of this report. All results are presented on a mid-point basis, using the methods noted in Section 9.1; normalization and
weighting are not used. Other impact categories have been excluded from the results because they do not answer the questions
defined as the goal and scope for the intended audience in Section 6 of this report. Due to lack of available data on customer
behavior with online statements, a conservative assumption was made that the typical customer who receives their statement online
will view it for up to 15 minutes online and 25% of the time, they will download, and print that statement even though the actual
percentage of people who print statements at home could be lower than 25% and customers may also view statements for shorter
periods of time than 15 minutes.
9.6 STATEMENT OF RELATIVITY
LCIA results are relative expressions and do not predict impacts on category endpoints, the exceeding of thresholds, safety margins
or risks.
■ No grouping of impact categories has been performed, all impacts are presented at the mid-point level
■ LCIA impacts presented in this report are based on mid-point characterization factors (e.g., kg CO2 equivalent for GHG
emissions), and this study does not make reference to the ultimate damage to human health and the environment. For example,
GHG emissions may be a negative or a positive environmental impact depending on the conditions in locations where
emissions occur. Since this study does not present end-point results, it does not draw any conclusions about the relative impact
(positive or negative) for the categories considered by the study.
Comparative LCA of Electronic and Paper Statements
Bank of America
WSP USA
January 22, 2018
Page 51

10 LIFE CYCLE INTERPRETATION
10.1 DATA QUALITY ASSESSMENT
10.1.1 BACKGROUND DATA QUALITY
The life cycle data used in the LCA relies upon the secondary data sources from GaBi® to produce GHG emissions and BWC
results. The data quality evaluation in accordance with ISO Standards 14040 and 14044 are given in Table 20.
Table 20: Data quality evaluation
Data Quality Requirement Explanation
Temporal coverage Data were collected from Bank of America and from its paper provider for a full year of
statement and paper production based on 2016 values for all production activities. Secondary data are representative of materials and processes in production over the 2010–2016 timeframe
and the secondary data sources are temporally appropriate for characterizing the inputs to Bank
of America’s statement activities. Temporal coverage is considered to be adequate for all
inventory data.
Geographical coverage The majority of statements Bank of America prints are delivered within the United States and the
primary data collected from Bank of America and its paper producer on statement activities and
paper production is representative of the North America. Secondary data sources therefore represent United States averages. Geographic coverage is considered to be adequate for all
inventory data.
Technology coverage The production methods employed by Bank of America and its paper producer represent current and modern technology. Production technologies for the inputs to the paper production process
(e.g., pulpwood, electricity, natural gas, and chemicals) as well as for the printing, mail delivery,
end-of-life and the electronic statement delivery, viewing and printing evolve over time. These
changes over time are captured in the annual update of the GaBi® databases used to sources secondary data sources. Therefore, technology coverage is considered to be adequate for the
inventory data used in this study.
Precision Since the primary data for modeling were based on primary information from Bank of America and its paper producer based on records kept by these organizations. These data are considered to
have high precision, therefore, variability in primary activity data has not been assessed. All
background data are from GaBi® and is well documented for its precision. No measured data
were collected, therefore, the variability and precision associated with measuring equipment
cannot be assessed.
Completeness All material flows were modeled with either with primary or secondary data and checked for
mass and energy balance. Only 0.5% of materials by mass required for paper production were omitted from the model. The impacts from the production and EOL of internet servers were also
excluded as their use specifically for viewing statements is low compared to the overall use of the
internet for its many functions. Hardware devices for viewing electronic statements were
excluded from the system boundary as the percent allocation of time a user spends on their device viewing a statement was calculated to be less than 1% of the total average time a person
uses the device. Therefore, data completeness is considered to be sufficient for this study. The
study does not include the evaluation of additional impact categories (e.g., other impacts to water and air quality), which may limit the utility of the results in driving internal decision making.
Additionally, this study does not include the evaluation of toxicity impacts, such as the indicators
human toxicity (cancer and non-cancer) and ecotoxicity, because the precision of the current LCA characterization factors are within a factor of 100 to 1,000 (Rosenbaum, et al., 2008). While
this is a substantial improvement over previously available toxicity characterization models, it is
still significantly higher than that of other impacts addressed in this study. Also, given the
Comparative LCA of Electronic and Paper Statements
Bank of America
WSP USA
January 22, 2018
Page 52

Data Quality Requirement Explanation
limitations of the characterization models for each of these factors, toxicity results should not be
used to make any comparative assertions and this is a comparative analysis.
Representativeness All material and energy inputs were modeled using secondary data sources. In this way, the data
largely reflects North American averages for the materials and processes modeled. For some
inputs, exact matches to secondary datasets were not available, therefore, suitable proxy datasets
were identified in the GaBi® databases. Only 2.7% of the materials by mass required for paper production were modeled with proxy data. Therefore, representatives is considered to be
adequate for this study.
Consistency All secondary data are considered to be internally consistent as they have been modeled according to the GaBi modeling principles and guidelines. According to these principles, cut-off
rules for each unit process require coverage of at least 95% of mass and energy of the input and
output flows, and 98% of their environmental relevance (according to expert judgment).
Therefore, consistency is considered to be adequate.
Reproducibility Because Bank of America and their paper producer’s primary data are confidential, an
independent practitioner would not be able to reproduce the results reported in this study. However, if a hypothetical study team was granted access to these confidential data, the
methodology description in this report would be a sufficient guideline to reproduce the results
presented herein. Therefore, reproducibility is considered to be adequate.
Sources Bank of America provided primary activity data on the generation, transmission, printing, and mailing of statements. Data on paper production for the statements printed by Bank of America
were collected directly from the Bank’s primary paper provider. Data on internet energy, device
energy, and EOL for paper in the United States were collected from literature sources noted in the references section of this report. Secondary data for all material and energy inputs as well as
comparative fuels were sourced from GaBi® databases.
Uncertainty Input uncertainty and data variability were assessed to be moderate and model precision assessed
to be high. The major source of variability and uncertainty in the study appears to be the percent of customers who print statements at home. There were no available data sources (primary or
secondary) upon which this assumption could be based, therefore, sensitivity analysis was
performed on the full range of potential cases (from 0% printing at home to 100% printing at home). Further, the impact categories assessed in this study are not associated with high degrees
of uncertainty, such as is the case with human and ecotoxicity metrics. Furthermore, due to
limitations in the tool and datasets used in this study, uncertainty analysis on the dataset data is
not possible (e.g., uncertainty ranges for most inputs are not available in GaBi®). Therefore, uncertainty analysis was not performed on the inventory data or impact assessments. It is
acknowledged that spatial and temporal variability in input data and results introduces
uncertainty into any LCA, but they can only be assessed if some measure of this uncertainty is available for testing. It is recommended, however, that the tool be updated to include the ability
to perform this type of analysis.
10.1.2 BENCHMARKING AND COMPARISON TO OTHER STUDIES
Since paper production is a major driver of the GHG emissions and BWC of paper statements, additional data sources were
examined for points of comparison for paper production. This serves as an evaluation of the accuracy and completeness of the
primary data on paper production collected from Bank of America’s paper producer.
The Forest Products Association of Canada (FPAC) and the American Forest & Paper Association (AF&PA) conducted an LCA to
evaluate the environmental impacts of four North American grades of printing and writing (P&W) papers (National Council for Air
and Stream Improvement, 2010). As shown in Table 21, the study produced a GHG emissions for office paper in the same range as
the USLCI and the EU Graphic Paper datasets in GaBi®, as well as the modeled data from Bank of America’s paper provider. The
Forest Products Association of Canada GHG emissions of 1.35 kg CO2e/kg paper is 31% less than that of Bank of America’s paper
provider which indicates that the data collected and the modeling performed in this study on Bank of America’s paper production is
Comparative LCA of Electronic and Paper Statements
Bank of America
WSP USA
January 22, 2018
Page 53

accurate. The drivers for the lower GHG emissions of the USLCI and EU datasets include a higher recycled content, a greater
amount of facilities surveyed, and geographic differences in the sources of pulp, electricity, and fuels for paper production.15
Table 21: Comparison of Paper GHG emissions from four sources, per kg of paper
Dataset GHG (kg CO2e / kg paper) Percent difference from BAC’s
Paper Provider
BAC’s Paper Provider 1.97
Forest Products Association of Canada 1.35 31%
USLCI 1.16 41%
EU Graphic Paper 0.84 57%
As a point of comparison for BWC, the Forest Products Association of Canada and the USLCI dataset did not include water in the
analysis, so BWC cannot be evaluated. The EU Graphic Paper dataset did produce a value for BWC of 7.1 gallons of water per kg
of paper. This is on the same order of magnitude of the 10.5 gallons of water per kg of paper that resulted from the BWC evaluation
of Bank of America’s paper provider. Drivers of differences between these two values include the sources of the water and
electricity due to the location of the facilities in the United States versus Europe and the fact that there is higher recycled content in
the EU paper (21%) than in the bank’s paper (12%).
The paper provider also provided their internal carbon footprint calculation, which included the scope 1 and scope 2 location-based
emissions from on-site fuel combustion and purchased energy. Because the results of this study included scope 3 emissions, the
modeled on-site fuel combustion and purchased energy were compared to the provided value. The modeled results of on-site fuel
combustion and purchased energy were 18% higher than the paper provider’s scope 1 and 2 emissions. Additionally, the
background data used to calculate emissions from electricity and fuels (e.g., natural gas and coal) used in this study are cradle-to-
gate, which means they include emissions from the production and transportation of fuels and that is not included in the scope 1 and
2 calculations provided by the paper provider. The largest contributor to purchased energy emissions is coal usage at the mill that
provides 70% of the paper to Bank of America. Coal usage at this mill was replaced by natural gas in November 2016, but the data
from the paper provider was based on 2015 production values. The mill with the lowest GHG emissions (approximately 1/3 of the
mill with the highest emissions), only provides 24% of the paper to Bank of America.
10.2 SENSITIVITY ANALYSIS
10.2.1 PERCENT OF ONLINE STATEMENTS PRINTED AT HOME
To evaluate the impact of the assumptions around customer behavior with online statements, four sensitivity analyses were
developed based on the conservative assumption that the customer views the statement for at least 15 minutes online and then, in
some cases, chooses to download, print and then shred the statement. The resulting difference between the GHG emissions and
BWC of the paper statement and the online statement in these four sensitivity analyses is summarized in Table 17. The value
represented in the results section of the report (25% print) is highlighted in bold. Even if 100% of customers download and print
an online statement, the online statement reduces GHG emissions and BWC by 48 g CO2e and 0.10 gallons of water per statement
respectively. The linear relationship between increased at-home printing and decreased difference in the GHG emissions and BWC
between paper and online statements is illustrated in Figure 12 and Figure 13. The primary driver of GHG emissions and BWC in
the 100%, 50%, and 25% print sensitivity analyses is the at-home printing of the statement. In the 0% sensitivity analysis the GHG
15 Source for EU Graphic Paper is GaBi dataset called EU Graphic Paper with the data source as VTT EcoData database
Comparative LCA of Electronic and Paper Statements
Bank of America
WSP USA
January 22, 2018
Page 54

emissions and BWC associated with the electricity used by the customer’s device was the largest source of impacts, mainly because
no printing is done in the 0% print scenario.
Table 18 and Table 19 provide values for the GHG emissions and BWC of the phases of the online statement life cycle considered
in this study by printing percentage scenario. From these tables, it is evident that at-home printing is a significant driver of impacts
for online statements, therefore, the greater the percentage of online statements printed at home, the greater the GHG emissions
and BWC. In the scenario in which no online statements are printed at home, these tables show that customer device electricity use
is the primary driver of GHG emissions and BWC.
Table 17: GHG emissions and BWC difference between paper and online statement based on percent of online statements printed
Sensitivity case GHG difference (g CO2e/statement) BWC difference (gallons water/statement)
100% print 48 0.10
50% print 65 0.20
25% print 73 0.25
0% print 82 0.30
Figure 12: GHG emissions difference between paper and
online statements across sensitivity analyses
40
50
60
70
80
90
0% 25% 50% 75% 100%
g C
O2e
Dif
fere
nce
/ S
tate
men
t
Percent of Statements Printed
Figure 13: BWC difference between paper and online
statement across sensitivity analyses
0.0
0.1
0.2
0.3
0.4
0% 25% 50% 75% 100%
gal
BW
C D
iffe
rence
/ S
tate
men
t
Percent of Statements Printed
Comparative LCA of Electronic and Paper Statements
Bank of America
WSP USA
January 22, 2018
Page 55

Table 18: GHG emissions impact per online statement print scenarios
g CO2e /
Statement
Statement Generated
and Stored
Internet
Electricity
Customer Device
Electricity At-home Printing End of Life
100% Print Common – not modeled 0.4 5 27 7
50% Print Common – not modeled 0.4 5 13 3
25% Print Common – not modeled 0.4 5 7 2
0% Print Common – not modeled 0.4 5 N/A N/A
Table 19: BWC impact per online statement print scenarios
gal BWC /
Statement
Statement Generated
and Stored
Internet
Electricity
Customer Device
Electricity
At-home
Printing End of Life
100% Print Common – not modeled 0.001 0.007 0.191 0.003
50% Print Common – not modeled 0.001 0.007 0.096 0.002
25% Print Common – not modeled 0.001 0.007 0.048 0.001
0% Print Common – not modeled 0.001 0.007 N/A N/A
10.2.2 SYSTEM BOUNDARY SENSITIVITY TO NO SHREDDING AND RECYCLING ONLINE
AND PAPER STATEMENTS
To test the sensitivity of the selected system boundary to assumptions, a sensitivity analyses was conducted on the EOL
assumptions for paper both from paper statements and online statements printed at home. The base case for this study assumed that
all paper and printed online statements were shredded, and thus could not be recycled. This sensitivity analysis assumes that no
shredding occurs for either paper or printed online statements, but that standard United States recycling rates apply. The results
from this sensitivity analysis are showed in Table 25. The difference in GHG emissions and BWC between paper and online
statements increases moderately by 2 g CO2e/statements and by 0.03 gallons of water/statement. This sensitivity analysis shows that
not shredding and recycling do not change the overall conclusion that online statements reduce GHG emissions and BWC compared
to paper statements.
Table 25: GHG emissions and BWC difference between paper and online statement based on the no shredding and recycling case
Sensitivity Case GHG difference (g CO2e/statement) BWC difference (gallons water/statement)
No Shredding and Recycling Case 75 0.28
Base Case 73 0.25
Comparative LCA of Electronic and Paper Statements
Bank of America
WSP USA
January 22, 2018
Page 56

10.2.3 SYSTEM BOUNDARY SENSITIVITY TO INTERNET HARDWARD AND SOFTWARE
To test the sensitivity of the system boundary to the selected boundary, another sensitivity analyses was conducted on the exclusion
of the hardware and software of the internet from the online statement system boundary. The study Malmodin, 2014, supporting
materials, calculated the GHG emissions from the production and use of internet hardware based on the global emission factor for
electricity (Malmodin, 2014). The global electricity GHG emissions factor is on par with that of the United States (study global =
0.6 kg CO2e/kWh & US eGRID average mix = 0.585 kg CO2e from GaBi). The results shown in Figure 4C of this study present the
impacts assuming global electricity. Table S6.1.2. gives the values used to make Figure 4C and for the electricity impacts, the
transmission and core network contributes 2.5 kg CO2e while the manufacturing of the equipment contributes 0.3 kg CO2e.
Therefore, the GHG emissions from hardware is 12% of the GHG emissions from the electricity used. This analysis tested the
sensitivity of the results to the impacts of producing the equipment by increasing the electricity by 12% to account for increased
GHG emissions and water consumption for internet hardware and software.
It is well-known that electronics manufacturing requires a significant amount of ultra-pure water for the washing steps for
microchips and this drives the water impacts of electronics. It is difficult, however, to find a similar water impact for a finished
electronic device like a server. Instead, the BWC of 34 different ICs (various die sizes, package types, and tech nodes) from GaBi
were examined to ensure that the BWC from increasing electricity could proxy the increased BWC from producing the hardware.
On average, the GHG emissions for an IC are 2.3 kg CO2e/IC and the BWC is 10.2 kg water/IC. As mentioned before, the US
eGRID average mix GHG emissions are 0.585 kg CO2e/kWh. The water consumption embedded in power is not insignificant
though. For the US eGRID mix, BWC is 3.43 kg water/kWh. Comparing per IC and per kWh are not appropriate, but, therefore,
the primary energy demand for an IC from GaBi (9.4 kWh) was used to normalize the GHG emissions and BWC. If normalized to a
per kWh energy demand basis for producing an IC, then the BWC for ICs is 1.09 kg water/kWh which is a lower BWC/kWh than
that of grid energy, therefore, increasing the electricity assumption in the model by 12% will provide a conservative estimat e for the
water consumption of the hardware.
As a result of increasing the electricity intensity of the internet by 12%, there was only a minor decrease in the GHG and BWC
difference between the paper statement and the online statement where 25% of customers print their statement at home, but this
difference was only observable in the decimal places beyond the significant figures considered in this study. Therefore, the system
is not sensitive to the inclusion of internet hardware and software.
10.2.4 SYSTEM BOUNDARY SENSITIVITY TO INCREASED INTERNET ELECTRICITY
This sensitivity analysis used the unadjusted electricity intensity of the internet from 2012 since the base case adjusted this value for
2016 data by decreasing it 30% per year, with a resulting electricity intensity of the internet of 1.73 kWh/GB instead of the 2012
value of 7.2 kWh/GB. This sensitivity analysis shows that the difference in paper statements to online statements (where 25% of
customers print at home) decreased slightly from the base case (Table 26). That is to say that the increase in internet electricity
caused the online statement GHG emissions and BWC to increase so the absolute difference between the paper and online
statements decreased. Therefore, the results of the study are not sensitive to internet electricity.
Table 26: GHG emissions and BWC difference between paper and online statement based on the high internet electricity case
Sensitivity Analysis GHG difference (g CO2e/statement) BWC difference (gallons water/statement)
Increased Internet Electricity 72 0.24
Base Case 73 0.25
10.3 IDENTIFICATION OF RELEVANT FINDINGS
Based on the results of this cradle-to-grave life cycle assessment, there are appreciable reductions in the GHG emissions and BWC
of a paper and electronic statement. With the assumptions in this study, the available data and under the scenario in which 25% of
Comparative LCA of Electronic and Paper Statements
Bank of America
WSP USA
January 22, 2018
Page 57

customers print their online statements, the difference in GHG emissions from paper to online statements is estimated to be 73 g
CO2e and the reduction in BWC is 0.25 gallons of water per statement). If all of Bank of America statements mailed in a year (551
million statements) were delivered online instead of mailed as paper statements, this would result in a reduction of approximately
40,000 metric tons of GHG emissions and 136 million gallons of blue water consumed when using electronic instead of paper
delivery. This is approximately equivalent to the GHG emissions from 6,000 United States homes in a year (EPA U. , Greenhouse
Gas Equivalencies Calculator, 2017) and the water contained in approximately 206 Olympic swimming pools. This amounts to
0.001% of the GHG emissions emitted in the United States in 2015 (EPA U. , 2015) and 0.0001% of the water use in the United
States in 2010 (USGS, 2010). This is equal to 4% of GHG emissions and 6% of water use from Bank of America’s 2016 global
operations (Bank of America Corporation, 2016).16 In terms of paper savings, if all of Bank of America statements mailed in a year
(551 million statements) were delivered online instead of mailed as paper statements, the reduction in total paper would be 7,915
metric tons of paper if 100% of online statements were printed at-home, and 13,080 metric tons of paper if 25% of online statements
were printed at-home.
Several sensitivity analyses were evaluated as a part of this study (see Section 8.5). The first sensitivity analysis was on the assumed
percentage of at-home printed statements. Even in the worst-case scenario, in which 100% of customers view their statements for 15
minutes online, then download, print and dispose of their online statement, the reduction in GHG emissions and BWC compared to
paper statement delivery remains, though it is reduced to 48 g CO2e and 0.10 gallons of water per statement, respectively. If all of
Bank of America’s statements were delivered online and were 100% printed at home, instead of by printed mail, in this sensitivity
analysis, the reduction in GHG emissions and BWC would still be 26,000 metric tons of CO2e and 55 million gallons of water
annually.
The second sensitivity analysis tested the assumption that all paper statements, whether mailed or printed at home, are shredded. In
this analysis, no statements are shredded, which means that the paper could be recycled according to standard United States
recycling rates. The difference in GHG emissions and BWC between paper and online statements increases moderately by 2 g
CO2e/statements and by 0.03 gallons of water/statement. This sensitivity analysis shows that not shredding and recycling do not
change the overall conclusion that online statements reduce GHG emissions and BWC compared to paper statements.
The third sensitivity analysis focused on capturing the embodied GHG emissions and BWC of the internet hardware and software.
As a result of expanding the system boundary to include these impacts, there was on a minor decrease in the GHG and BWC
difference between the paper statement and the online statement where 25% of customers print their statement at home, but thi s
difference was only observable in the decimal places beyond the significant figures considered in this study. Therefore, the system
is not sensitive to the inclusion of internet hardware and software.
The fourth sensitivity analysis tested the assumption that internet electricity efficiency increased over time by increasing the
assumed electricity for the interned to 7.2 kWh/GB from 1.73 kWh/GB. This sensitivity analysis shows that the difference in paper
statements to online statements (where 25% of customers print at home) decreased slightly from the base case. That is to say that
the increase in internet electricity caused the online statement GHG emissions and BWC to increase so the absolute difference
between the paper and online statements decreased. Therefore, the results of the study are not sensitive to internet electri city.
These four sensitivity analyses demonstrated that the overall results of the study were not sensitive to these assumptions and the
conclusion that online statements reduce GHG emissions and BWC remains unchanged.
It is also notable that the impacts of printing online statements at home are 30% lower than that of mailed paper statements. The
reasons for this are two-fold. First, the mailed statement includes two envelopes (the outer envelope that the statement is mailed in
and the inner reply envelope) which are not included in online delivery of statements. The mass of these two envelopes is
approximately equal to that of the statement itself which means that the online statement requires half the total mass of paper that
the mailed paper statement requires. Second, the paper produced for Bank of America has higher GHG emissions per statement than
the standard dataset paper modeled for at home printing (as noted in Table 21). As noted in section 10.1.2, the drivers for the lower
GHG emissions from the at-home printing paper include a higher recycled content, a greater amount of facilities surveyed, and
geographic differences in the sources of pulp, electricity, and fuels for paper production. The paper the bank sources is not available
16 Shifting from paper statements to online would not actually reduce Bank of America’s direct emissions or water use by these percentages, but
this is for a point of comparison.
Comparative LCA of Electronic and Paper Statements
Bank of America
WSP USA
January 22, 2018
Page 58

to the general public for purchase, therefore, it is not reasonable to assume the same paper is used to print at home as is used to print
the mailed statements.
Within the system boundaries considered in this study, the primary driver of GHG emissions and BWC for the paper statement is
paper production. Table 17 and Table 18 show the GHG and BWC impacts per phase for the different printing scenarios for online
statements.
For the online statement, the primary driver of GHG emissions and BWC is the at-home printing by the customer’s viewing device
in the sensitivity analyses in which 100%, 50%, and 25% of customers print their statements at home. The primary driver of GHG
emissions and BWC in the 0% at-home printing sensitivity analysis was the customer device electricity consumption.
10.4 CONCLUSIONS
Regardless of the percent of customers that print their statements at home, the finding that online statements reduce GHG emissions
and BWC compared to paper statements holds true, only the magnitude of the reduction changes. If all of Bank of America’s
statements for checking, savings, home loan, credit card, and investment accounts were delivered electronically, significant
reductions in GHG emissions and water consumption would be achieved. Furthermore, encouraging customers not to print
statements at-home would result in additional reductions in GHG emissions and BWC.
This study also identified paper production as a primary driver of GHG emissions and BWC in the printing statement system.
Printing, transportation, and statement end-of-life did not contribute heavily to paper statement GHG emissions or BWC within the
system boundaries considered. Within paper production, the major driver of GHG emissions was purchased energy followed by
minerals and chemicals. Efforts to reduce the GHG emissions of paper should therefore be focused in these areas. The primary
driver of BWC from paper production was the total process water even though significant efforts are made to recover and recycle
water within the paper production facilities. For the online statements, the primary driver of GHG emissions and BWC was at-home
printing, which includes paper and ink transportation and distribution, paper production, and the electricity from the printer. The
percent of customers who print online statements at home is currently unknown and outside of the control of Bank of America.
Further studies on this topic could attempt to quantify how many customers who receive online statements download and print
them. This could be accomplished with a voluntary customer survey.
10.5 LIMITATIONS AND ASSUMPTIONS
The results of this study are limited to Bank of America checking, savings, home loan, credit card, and investment account
statements and, thus, do not consider products with equal or comparable functionality produced by other institutions. The results of
this study, therefore, can only be applied to Bank of America statements of this type. The primary assumption in this study was on
the customer viewing and printing behavior with respect to online statements. The sensitivity analyses evaluated in this study did
demonstrate that the magnitude of the GHG emissions and BWC difference between online and paper statements is sensitive to this
assumption, but that the conclusion that online statements reduce GHG emissions and BWC compared to paper statements does not
change. Therefore, the results of this study are not limited by this assumption. The study did not evaluate additional impact
categories such as other impacts to air and water quality. This introduces a limitation on the utility of the results in driving internal
decision making as such decision-making may be based only on the statement-delivery method’s impacts on GHG emissions and
BWC. The study also did not include the impacts of user devices due to the cut-off criteria applied. Since less than 1% of device use
is attributable to statement-viewing, the impact on the results is likely minimal.
Comparative LCA of Electronic and Paper Statements
Bank of America
WSP USA
January 22, 2018
Page 59

11 REFERENCES Aslan, J., Mayers, K., Koomey, J. G., & France, C. (2017, August). Electricity Intensity of Internet Data Transmission: Untangling
the Estimates. Journal of Industrial Ecology, Online Version of Record published before inclusion in an issue, doi:
10.1111/jiec.12630.
Ativa® 12-Sheet Micro-Cut Shredder, C184-E. (n.d.). Retrieved 05 2017, from Office Depot:
http://www.officedepot.com/a/products/770578/Ativa-12-Sheet-Micro-Cut-Shredder/
Bank of America Corporation. (2016). Environmental, Social & Governance Performance Data Summary. Retrieved 10 2017, from
https://about.bankofamerica.com/assets/pdf/Bank-of-America-2016-ESG-Performance-Data-Summary.pdf#page=2
Bank of America Corporation. (2016). Environmental, Social & Governance Performance Data Summary. Retrieved 10 2017, from
https://about.bankofamerica.com/assets/pdf/Bank-of-America-2016-ESG-Performance-Data-Summary.pdf#page=2
Coroama, V. C., & Hilty, L. M. (2014, February). Assessing Internet energy intensity: A review of methods and results.
Environmental Impact Assessment Review, 45, 63-68. Retrieved from http://publicationslist.org/data/lorenz.hilty/ref-
218/2014_Coroama_Hilty_Assessing_Internet_Energy_Intensity_AAM.pdf
Darrow, B. (2016, June 9). Retrieved 12 2017, from http://fortune.com/2016/06/09/pc-sales-are-worse-than-you-think/
EPA. (2016). Advancing Sustainable Materials Management: 2014 Tables and Figures. Retrieved 06 2017, from
https://www.epa.gov/sites/production/files/2016-11/documents/2014_smm_tablesfigures_508.pdf
EPA. (2017). Inventory of U.S Greenhouse Gas Emissions and Sinks: 1990-2015. Retrieved 09 2017, from
https://www.epa.gov/sites/production/files/2017-02/documents/2017_complete_report.pdf
EPA, U. (2015). Inventory of U.S. Greenhouse Gas Emissions and Sinks. Retrieved from Greenhouse Gas Emissions:
https://www.epa.gov/ghgemissions/inventory-us-greenhouse-gas-emissions-and-sinks
EPA, U. (2017). Greenhouse Gas Equivalencies Calculator. Retrieved from United States Environmental Protection Agency
Energy and the Environment: https://www.epa.gov/sites/production/files/widgets/ghg_calc/calculator.html#energy
Epstein, Z. (2014, 05 29). Horrifying chart reveals how much time we spend staring at screens each day. Retrieved 12 2017, from
BGR.com: http://bgr.com/2014/05/29/smartphone-computer-usage-study-chart/
Estimating Appliance and Home Electronic Energy Use. (2017, 03). Retrieved from Energy Saver:
https://energy.gov/energysaver/estimating-appliance-and-home-electronic-energy-use
Greenhouse Gas Equivalencies Calculator. (2017, September). Retrieved 10 2017, from EPA.gov:
https://www.epa.gov/energy/greenhouse-gas-equivalencies-calculator
How a Letter Travels. (n.d.). Retrieved 11 2016, from USPS: https://about.usps.com/publications/pub100/pub100_078.htm
Inkjet Cartridge Volumes and Page Yields. (2017, 06). Retrieved from Inksell.com: http://www.inksell.com/ipd-inkvolumes.html
ISO. (2006). ISO 14040: environmental management—life cycle assessment—principles and framework. International Organization
for Standardization, Geneva, Switzerland.
ISO. (2006). ISO 14044: environmental management—life cycle assessment, life cycle impact assessment. International
Organization for Standardization, Geneva, Switzerland.
Le Pochat, S., Berthoud, F., Gaborit, M., & Mary, T. (2010). Comparative LCA of a digital invoice versus a paper invoice. EVEA.
Malmodin, J. L. (2014). Life Cycle Assessment of ICT: Carbon Footprint and Operational Electricity Use from the. Journal of
Industrial Ecology, 18(6).
Miller, J. D. (2017, 07 31). Senior Vice President, Newark Operations Group Manager. (L. Shpritz, Interviewer)
Moberg, A., Borggren, C., Finnveden, G., & Tyskeng, S. (2008). Effects of a total change from paper invoicing to electronic
invoicing in Sweden. A screening life cycle assessment focusing on greenhouse gas emissions and. Stockholm: KTH
Centre for Sustainable Communications. Retrieved 11 2016, from http://www.diva-
portal.org/smash/get/diva2:355958/FULLTEXT01.pdfat
Comparative LCA of Electronic and Paper Statements
Bank of America
WSP USA
January 22, 2018
Page 60

National Council for Air and Stream Improvement, I. (. (2010). Printing & Writing Papers Life-Cycle Assessment. Retrieved 11
2017, from http://www.afandpa.org/docs/default-source/default-document-library/lca-executive-summary.pdf
Paper Shredding: Tips and Recycling info. (2016). Retrieved 12 2017, from Ecocycle.org: http://ecocycle.org/shred
Rosenbaum, R., Bachmann, T., Gold, L., Huijbregts, A., Jolliet, O., Juraske, R., . . . Hauschild, M. (2008). USEtox—the UNEP-
SETAC toxicity model: recommended characterisation factors for human toxicity and freshwater ecotoxicity in life cycle
impact assessment. International Journal of Life Cycle Assessment, 13, 534-546.
Technology Knowledge. (n.d.). Retrieved January 9, 2018, from Highspeedbackbone.net:
http://static.highspeedbackbone.net/html/Choosing-Printer-article.html
thinkstep AG: LBP-GaBi. (2016). GaBi Software System. Leinfelden_Echterdingen / Germany: University of Stuttgart.
Trollinger, V. (2016, February 9). How Much Energy Does My Phone Charger Use? Retrieved 11 2016, from Bounce Energy:
http://www.bounceenergy.com/blog/2016/02/how-much-energy-does-this-appliance-use-phone-charger/
USEPA. (2015). Inventory of U.S. Greenhouse Gas Emissions and Sinks. Retrieved from Greenhouse Gas Emissions:
https://www.epa.gov/ghgemissions/inventory-us-greenhouse-gas-emissions-and-sinks
USEPA. (2017, September). Greenhouse gas equivalences calculator. Retrieved 10 2017, from EPA.gov:
https://www.epa.gov/energy/greenhouse-gas-equivalencies-calculator
USEPA. (2017). Greenhouse Gas Equivalencies Calculator. Retrieved from United States Environmental Protection Agency
Energy and the Environment: https://www.epa.gov/sites/production/files/widgets/ghg_calc/calculator.html#energy
USGS. (2010). Water use in the United States. Retrieved from Total water use: https://water.usgs.gov/watuse/wuto.html
Watt Finders Guide LG&E. (n.d.). Retrieved 11 2016, from LG&E and KU 2017: https://lge-
ku.com/sites/default/files/documents/watt_finders_guide.pdf
Comparative LCA of Electronic and Paper Statements
Bank of America
WSP USA
January 22, 2018
Page 61
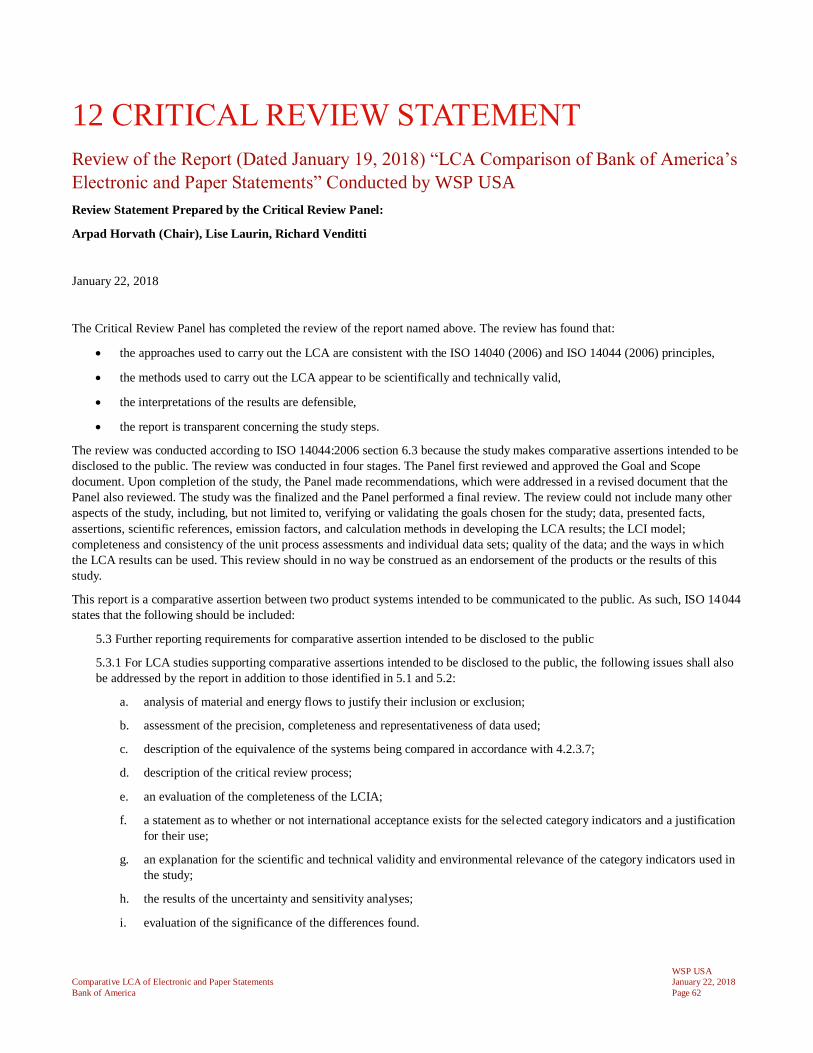
12 CRITICAL REVIEW STATEMENT
Review of the Report (Dated January 19, 2018) “LCA Comparison of Bank of America’s
Electronic and Paper Statements” Conducted by WSP USA
Review Statement Prepared by the Critical Review Panel:
Arpad Horvath (Chair), Lise Laurin, Richard Venditti
January 22, 2018
The Critical Review Panel has completed the review of the report named above. The review has found that:
• the approaches used to carry out the LCA are consistent with the ISO 14040 (2006) and ISO 14044 (2006) principles,
• the methods used to carry out the LCA appear to be scientifically and technically valid,
• the interpretations of the results are defensible,
• the report is transparent concerning the study steps.
The review was conducted according to ISO 14044:2006 section 6.3 because the study makes comparative assertions intended to be
disclosed to the public. The review was conducted in four stages. The Panel first reviewed and approved the Goal and Scope
document. Upon completion of the study, the Panel made recommendations, which were addressed in a revised document that the
Panel also reviewed. The study was the finalized and the Panel performed a final review. The review could not include many other
aspects of the study, including, but not limited to, verifying or validating the goals chosen for the study; data, presented facts,
assertions, scientific references, emission factors, and calculation methods in developing the LCA results; the LCI model;
completeness and consistency of the unit process assessments and individual data sets; quality of the data; and the ways in which
the LCA results can be used. This review should in no way be construed as an endorsement of the products or the results of this
study.
This report is a comparative assertion between two product systems intended to be communicated to the public. As such, ISO 14044
states that the following should be included:
5.3 Further reporting requirements for comparative assertion intended to be disclosed to the public
5.3.1 For LCA studies supporting comparative assertions intended to be disclosed to the public, the following issues shall also
be addressed by the report in addition to those identified in 5.1 and 5.2:
a. analysis of material and energy flows to justify their inclusion or exclusion;
b. assessment of the precision, completeness and representativeness of data used;
c. description of the equivalence of the systems being compared in accordance with 4.2.3.7;
d. description of the critical review process;
e. an evaluation of the completeness of the LCIA;
f. a statement as to whether or not international acceptance exists for the selected category indicators and a justification
for their use;
g. an explanation for the scientific and technical validity and environmental relevance of the category indicators used in
the study;
h. the results of the uncertainty and sensitivity analyses;
i. evaluation of the significance of the differences found.
Comparative LCA of Electronic and Paper Statements
Bank of America
WSP USA
January 22, 2018
Page 62

The Panel has concluded that the study includes all of the mandatory elements.
The Panel stresses that considering the scientific limitations, including model and parameter uncertainty in the models employed for
the impact assessments, the impact assessment results should be interpreted as relative measures of impact for the various scenarios
evaluated. The impact assessment results should be used only to identify differences in global warming potential and blue water
impacts between the two defined product systems (electronic and paper delivery of a bank statement). As common life-cycle stages
for the two product systems were not considered, the results should not be used for absolute assertions of impact.
This review statement only applies to the report named above, dated January 19, 2018, but not to any other versions, derivative
reports, excerpts, press releases, and similar.
Comparative LCA of Electronic and Paper Statements
Bank of America
WSP USA
January 22, 2018
Page 63
Arpad Horvath Lise Laurin
Richard Venditti