lc/ms/ms research method for 14 antidepressants utilizing ... · lc/ms/ms research method for 14...
TRANSCRIPT

LC/MS/MS Research Method for 14 Antidepressants Utilizing Dried Blood SpotsKerry M. Hassell, Sarah J. Fair, and Joseph L. Herman Thermo Fisher Scientific, Franklin, MA, USA

2 LC/MS/MS Research Method for 14 Antidepressants Utilizing Dried Blood Spots
LC/MS/MS Research Method for 14 Antidepressants Utilizing Dried Blood Spots Kerry M. Hassell, Sarah J. Fair, and Joseph L. Herman Thermo Fisher Scientific, 101 Constitution Blvd., Franklin, MA 02038
Overview Purpose: To develop an LC-MS/MS research method for measuring the concentration of antidepressants from dried blood spots (DBS).
Methods: An LC-MS/MS method was developed to extract 14 antidepressants from dried blood spots for quantitation.
Results: The analytes of interest were extracted successful from dried blood spots showing good linearity, accuracy, and precision.
Introduction Important factors in the analysis of drugs in whole blood are accurate measurements, storage capabilities, small sample volume, and easy extraction. Dried blood spots are becoming an adopted clinical research technique for the analysis of drugs in biological matrices. Due to the complexity of the solution resulting from dissolving the blood spot, the sample must undergo further cleanup by chromatographic separation before introduction into the mass spectrometer. A research application is demonstrated using the Thermo Scientific™ Prelude SPLC™ system and the Thermo Scientific™ TSQ Endura™ triple quadrupole mass spectrometer (Figure 1) to quantitatively analyze 14 antidepressant drugs collected from dried blood spots.
Instrumentation A Prelude SPLC system was used in TX mode and equipped with a Thermo Scientific™ TurboFlow™ Fluoro XL 0.5 x 50 mm cleanup column and a 2.1 x 50 mm, 2.6 µm particle size Thermo Scientific™ Accucore™ aQ analytical column. The detector for the system was a TSQ Endura triple quadrupole mass spectrometer with a heated electrospray ionization (HESI-II) probe in positive mode. Thermo Scientific™ TraceFinder™ software version 3.1 was used for quantitation. The liquid chromatography flow path is found in Figure 3.
Method Parameters
Mobile phases were (A) 10 mM ammonium formate, 0.05% formic acid in water; (B) 10 mM ammonium formate, 0.05% formic acid in methanol; and (C) 45/45/10 acetonitrile/isopropanol/acetone. The LC method is shown in Table 1. The mass spectrometer quantifier and qualifier selected-reaction monitoring (SRM) transitions are shown in Table 2. The method range for all the analytes was 10–750 ng/mL.
FIGURE 1. Prelude SPLC system with TSQ Endura MS
Methods Sample Preparation The analytes of interest were spiked into human whole blood at various concentrations to make calibrators and controls. The samples were spotted at a fixed volume onto Whatman® paper. Then, the analyte was extracted by solvent containing isotopically labeled internal standards and transferred into clean vials for LC-MS/MS analysis. The entire workflow is depicted in Figure 2.
Spot DBS card with standards and QCs
Add 200 µL of IS in methanol
Vortex for 20 minutes
Extract solution from wells and add 500 µL water
Punch card with 3 mm hole punch
Place punched hole into 96 well plate
FIGURE 2. Workflow of preparing the dried blood spot for LC/MS
FIGURE 3. Online sample cleanup and analytic separation flow path
TABLE 2. SRM transitions
Step Start Sec Flow %A %B %C Tee Loop
Flow Grad %A %B
1 0.00 40 1.5 100.0 - - ==== out 0.50 100 -
2 0.67 65 0.20 - 100 - T in 0.50 100 -
3 1.75 5 0.20 - 100 - ==== in 0.50 40 60
4 1.83 120 1.20 - - 100 ==== out 0.50 25 75
5 3.83 30 1.10 - - 100 ==== out 0.50 - 100
6 4.33 60 1.50 100 - - ==== out 0.50 100 -
Analyte Precursor Ion (Q1)
Product Ions (Q3)
Collision Energy S-lens
Amitriptyline 278.1 233.2 15 61 191.1 15 61
Doxepin 280.2 235.0 26 61 Imipramine 281.0 86.3 25 88
208.0 25 88 Fluvoxamine 319.1 200.0 19 70
228.0 19 70 Clomipramine 314.9 86.2 20 55
242.1 20 55 Fluoxetine 310.1 117.1 10 83
148.0 10 83 Paroxetine 330.1 192.0 28 94
151.0 28 94 Citalopram 325.1 109.1 25 120
262.0 25 120 Nortiptyline 264.1 233.0 20 50
191.0 20 50 Desipramine 267.1 208.1 20 48
236.1 20 48 Venlafaxine 278.2 147.1 15 61
121.1 15 61 Sertraline 306.0 275.0 13 80
158.9 13 80 Duloxetine 298.0 154.0 8 55
- Bupropion 241.0 167.0 15 61
185.0 15 61 Amitriptyline-d3 281.1 233.2 24 90 Doxepin-d3 283.2 235.1 24 106 Fluoxetine-d6 316.1 154.0 16 79 Paroxetine-d6 336.1 198.1 20 125 Nortiptyline-d3 267.1 233.1 18 97 Sertraline-d3 309.0 275.0 12 69
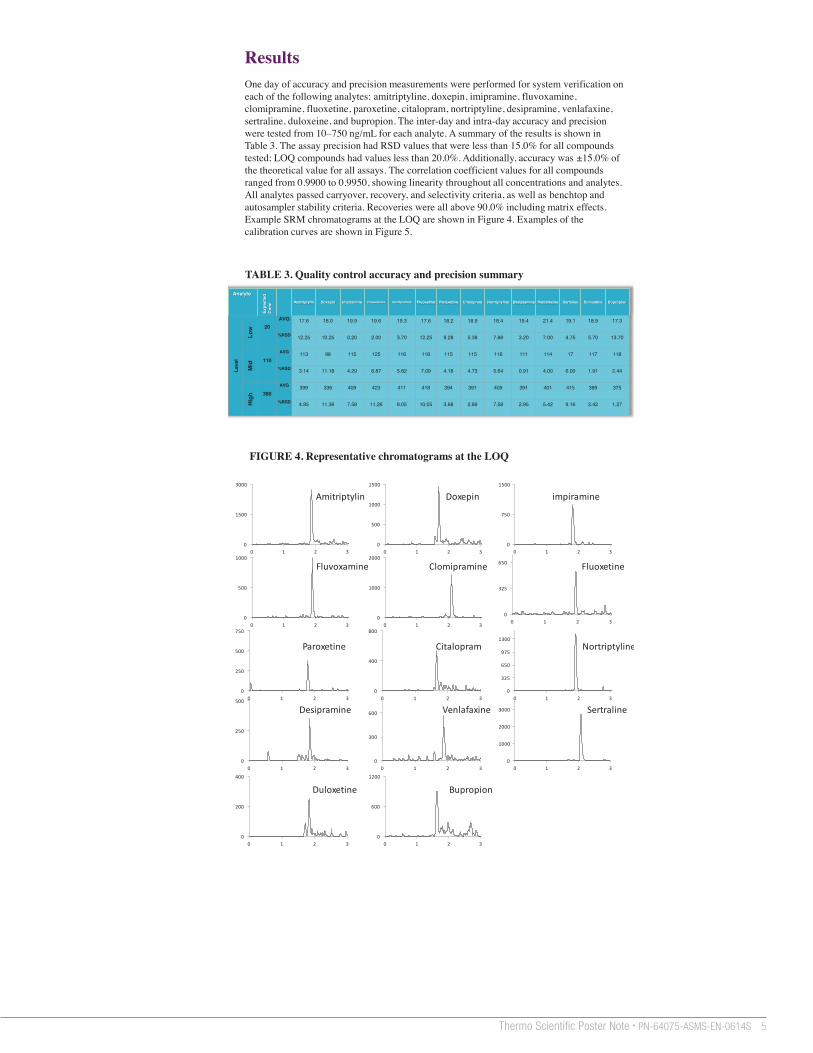
TABLE 1. LC method parameters Results One day of accuracy and precision measurements were performed for system verification on each of the following analytes: amitriptyline, doxepin, imipramine, fluvoxamine, clomipramine, fluoxetine, paroxetine, citalopram, nortriptyline, desipramine, venlafaxine, sertraline, duloxeine, and bupropion. The inter-day and intra-day accuracy and precision were tested from 10–750 ng/mL for each analyte. A summary of the results is shown in Table 3. The assay precision had RSD values that were less than 15.0% for all compounds tested; LOQ compounds had values less than 20.0%. Additionally, accuracy was ±15.0% of the theoretical value for all assays. The correlation coefficient values for all compounds ranged from 0.9900 to 0.9950, showing linearity throughout all concentrations and analytes. All analytes passed carryover, recovery, and selectivity criteria, as well as benchtop and autosampler stability criteria. Recoveries were all above 90.0% including matrix effects. Example SRM chromatograms at the LOQ are shown in Figure 4. Examples of the calibration curves are shown in Figure 5.
TABLE 3. Quality control accuracy and precision summary Analyte
Expe
cted
C
onc Amitriptylin Doxepin Impiramine Fluvoxamine Clomipramine Fluoxetine Paroxetine Citalopram Nortriptyline Desipramine Venlafaxine Sertaline Duloxetine Bupropion
Leve
l
Low
20
AVG 17.6 18.0 19.9 19.6 19.3 17.6 18.2 18.9 18.4 19.4 21.4 19.1 18.9 17.3
%RSD 12.25 10.25 0.20 2.00 3.70 12.25 9.28 5.38 7.88 3.20 7.00 4.75 5.70 13.70
Mid
110
AVG 113 98 115 125 116 118 115 115 116 111 114 17 117 118
%RSD 3.14 11.18 4.29 8.87 5.82 7.09 4.18 4.73 5.64 0.91 4.00 6.00 1.91 2.44
High
380
AVG 399 336 409 423 411 418 394 391 409 391 401 415 389 375
%RSD 4.95 11.36 7.58 11.26 8.05 10.05 3.68 2.89 7.58 2.95 5.42 9.16 2.42 1.27
FIGURE 4. Representative chromatograms at the LOQ
0
250
500
0 1 2 30
300
600
0 1 2 30
1000
2000
3000
0 1 2 3
0
250
500
750
0 1 2 30
325
650
975
1300
0 1 2 3
0
500
1000
0 1 2 30
1000
2000
0 1 2 3
0
325
650
0 1 2 3
0
1500
3000
0 1 2 30
500
1000
1500
0 1 2 30
750
1500
0 1 2 3
Amitriptylin Doxepin impiramine
Fluvoxamine Clomipramine Fluoxetine
Paroxetine Citalopram Nortriptyline
Desipramine Venlafaxine Sertraline
Duloxetine Bupropion
0
400
800
0 1 2 3
0
200
400
0 1 2 30
600
1200
0 1 2 3
FIGURE 5. Representative calibration curves
Conclusion • An LC-MC/MS research method has been successfully developed and verified for the
quantification of 14 antidepressant drugs collected from dried blood spots using a Prelude SPLC system and a TSQ Endura triple quadrupole mass spectrometer.
• Online sample cleanup of the matrix resulting from dried blood spot collection reduced the complexity of the LC-MS/MS workflow.
• Due to the use of online sample preparation, this research method is more accurate, easier to perform, takes less time, is more robust, and is less costly then traditional offline sample preparation such as SPE plates.
For Research Use Only. Not for use in diagnostic procedures.
Whatman is a registered trademark of GE Healthcare. All other trademarks are the property of Thermo Fisher Scientific and its subsidiaries.
This information is not intended to encourage use of these products in any manners that might infringe the intellectual property rights of others.

3Thermo Scientific Poster Note • PN-64075-ASMS-EN-0614S
LC/MS/MS Research Method for 14 Antidepressants Utilizing Dried Blood Spots Kerry M. Hassell, Sarah J. Fair, and Joseph L. Herman Thermo Fisher Scientific, 101 Constitution Blvd., Franklin, MA 02038
Overview Purpose: To develop an LC-MS/MS research method for measuring the concentration of antidepressants from dried blood spots (DBS).
Methods: An LC-MS/MS method was developed to extract 14 antidepressants from dried blood spots for quantitation.
Results: The analytes of interest were extracted successful from dried blood spots showing good linearity, accuracy, and precision.
Introduction Important factors in the analysis of drugs in whole blood are accurate measurements, storage capabilities, small sample volume, and easy extraction. Dried blood spots are becoming an adopted clinical research technique for the analysis of drugs in biological matrices. Due to the complexity of the solution resulting from dissolving the blood spot, the sample must undergo further cleanup by chromatographic separation before introduction into the mass spectrometer. A research application is demonstrated using the Thermo Scientific™ Prelude SPLC™ system and the Thermo Scientific™ TSQ Endura™ triple quadrupole mass spectrometer (Figure 1) to quantitatively analyze 14 antidepressant drugs collected from dried blood spots.
Instrumentation A Prelude SPLC system was used in TX mode and equipped with a Thermo Scientific™ TurboFlow™ Fluoro XL 0.5 x 50 mm cleanup column and a 2.1 x 50 mm, 2.6 µm particle size Thermo Scientific™ Accucore™ aQ analytical column. The detector for the system was a TSQ Endura triple quadrupole mass spectrometer with a heated electrospray ionization (HESI-II) probe in positive mode. Thermo Scientific™ TraceFinder™ software version 3.1 was used for quantitation. The liquid chromatography flow path is found in Figure 3.
Method Parameters
Mobile phases were (A) 10 mM ammonium formate, 0.05% formic acid in water; (B) 10 mM ammonium formate, 0.05% formic acid in methanol; and (C) 45/45/10 acetonitrile/isopropanol/acetone. The LC method is shown in Table 1. The mass spectrometer quantifier and qualifier selected-reaction monitoring (SRM) transitions are shown in Table 2. The method range for all the analytes was 10–750 ng/mL.
FIGURE 1. Prelude SPLC system with TSQ Endura MS
Methods Sample Preparation The analytes of interest were spiked into human whole blood at various concentrations to make calibrators and controls. The samples were spotted at a fixed volume onto Whatman® paper. Then, the analyte was extracted by solvent containing isotopically labeled internal standards and transferred into clean vials for LC-MS/MS analysis. The entire workflow is depicted in Figure 2.
Spot DBS card with standards and QCs
Add 200 µL of IS in methanol
Vortex for 20 minutes
Extract solution from wells and add 500 µL water
Punch card with 3 mm hole punch
Place punched hole into 96 well plate
FIGURE 2. Workflow of preparing the dried blood spot for LC/MS
FIGURE 3. Online sample cleanup and analytic separation flow path
TABLE 2. SRM transitions
Step Start Sec Flow %A %B %C Tee Loop
Flow Grad %A %B
1 0.00 40 1.5 100.0 - - ==== out 0.50 100 -
2 0.67 65 0.20 - 100 - T in 0.50 100 -
3 1.75 5 0.20 - 100 - ==== in 0.50 40 60
4 1.83 120 1.20 - - 100 ==== out 0.50 25 75
5 3.83 30 1.10 - - 100 ==== out 0.50 - 100
6 4.33 60 1.50 100 - - ==== out 0.50 100 -
Analyte Precursor Ion (Q1)
Product Ions (Q3)
Collision Energy S-lens
Amitriptyline 278.1 233.2 15 61 191.1 15 61
Doxepin 280.2 235.0 26 61 Imipramine 281.0 86.3 25 88
208.0 25 88 Fluvoxamine 319.1 200.0 19 70
228.0 19 70 Clomipramine 314.9 86.2 20 55
242.1 20 55 Fluoxetine 310.1 117.1 10 83
148.0 10 83 Paroxetine 330.1 192.0 28 94
151.0 28 94 Citalopram 325.1 109.1 25 120
262.0 25 120 Nortiptyline 264.1 233.0 20 50
191.0 20 50 Desipramine 267.1 208.1 20 48
236.1 20 48 Venlafaxine 278.2 147.1 15 61
121.1 15 61 Sertraline 306.0 275.0 13 80
158.9 13 80 Duloxetine 298.0 154.0 8 55
- Bupropion 241.0 167.0 15 61
185.0 15 61 Amitriptyline-d3 281.1 233.2 24 90 Doxepin-d3 283.2 235.1 24 106 Fluoxetine-d6 316.1 154.0 16 79 Paroxetine-d6 336.1 198.1 20 125 Nortiptyline-d3 267.1 233.1 18 97 Sertraline-d3 309.0 275.0 12 69
TABLE 1. LC method parameters Results One day of accuracy and precision measurements were performed for system verification on each of the following analytes: amitriptyline, doxepin, imipramine, fluvoxamine, clomipramine, fluoxetine, paroxetine, citalopram, nortriptyline, desipramine, venlafaxine, sertraline, duloxeine, and bupropion. The inter-day and intra-day accuracy and precision were tested from 10–750 ng/mL for each analyte. A summary of the results is shown in Table 3. The assay precision had RSD values that were less than 15.0% for all compounds tested; LOQ compounds had values less than 20.0%. Additionally, accuracy was ±15.0% of the theoretical value for all assays. The correlation coefficient values for all compounds ranged from 0.9900 to 0.9950, showing linearity throughout all concentrations and analytes. All analytes passed carryover, recovery, and selectivity criteria, as well as benchtop and autosampler stability criteria. Recoveries were all above 90.0% including matrix effects. Example SRM chromatograms at the LOQ are shown in Figure 4. Examples of the calibration curves are shown in Figure 5.
TABLE 3. Quality control accuracy and precision summary Analyte
Expe
cted
C
onc Amitriptylin Doxepin Impiramine Fluvoxamine Clomipramine Fluoxetine Paroxetine Citalopram Nortriptyline Desipramine Venlafaxine Sertaline Duloxetine Bupropion
Leve
l
Low
20
AVG 17.6 18.0 19.9 19.6 19.3 17.6 18.2 18.9 18.4 19.4 21.4 19.1 18.9 17.3
%RSD 12.25 10.25 0.20 2.00 3.70 12.25 9.28 5.38 7.88 3.20 7.00 4.75 5.70 13.70
Mid
110
AVG 113 98 115 125 116 118 115 115 116 111 114 17 117 118
%RSD 3.14 11.18 4.29 8.87 5.82 7.09 4.18 4.73 5.64 0.91 4.00 6.00 1.91 2.44
High
380
AVG 399 336 409 423 411 418 394 391 409 391 401 415 389 375
%RSD 4.95 11.36 7.58 11.26 8.05 10.05 3.68 2.89 7.58 2.95 5.42 9.16 2.42 1.27
FIGURE 4. Representative chromatograms at the LOQ
0
250
500
0 1 2 30
300
600
0 1 2 30
1000
2000
3000
0 1 2 3
0
250
500
750
0 1 2 30
325
650
975
1300
0 1 2 3
0
500
1000
0 1 2 30
1000
2000
0 1 2 3
0
325
650
0 1 2 3
0
1500
3000
0 1 2 30
500
1000
1500
0 1 2 30
750
1500
0 1 2 3
Amitriptylin Doxepin impiramine
Fluvoxamine Clomipramine Fluoxetine
Paroxetine Citalopram Nortriptyline
Desipramine Venlafaxine Sertraline
Duloxetine Bupropion
0
400
800
0 1 2 3
0
200
400
0 1 2 30
600
1200
0 1 2 3
FIGURE 5. Representative calibration curves
Conclusion • An LC-MC/MS research method has been successfully developed and verified for the
quantification of 14 antidepressant drugs collected from dried blood spots using a Prelude SPLC system and a TSQ Endura triple quadrupole mass spectrometer.
• Online sample cleanup of the matrix resulting from dried blood spot collection reduced the complexity of the LC-MS/MS workflow.
• Due to the use of online sample preparation, this research method is more accurate, easier to perform, takes less time, is more robust, and is less costly then traditional offline sample preparation such as SPE plates.
For Research Use Only. Not for use in diagnostic procedures.
Whatman is a registered trademark of GE Healthcare. All other trademarks are the property of Thermo Fisher Scientific and its subsidiaries.
This information is not intended to encourage use of these products in any manners that might infringe the intellectual property rights of others.

4 LC/MS/MS Research Method for 14 Antidepressants Utilizing Dried Blood Spots
LC/MS/MS Research Method for 14 Antidepressants Utilizing Dried Blood Spots Kerry M. Hassell, Sarah J. Fair, and Joseph L. Herman Thermo Fisher Scientific, 101 Constitution Blvd., Franklin, MA 02038
Overview Purpose: To develop an LC-MS/MS research method for measuring the concentration of antidepressants from dried blood spots (DBS).
Methods: An LC-MS/MS method was developed to extract 14 antidepressants from dried blood spots for quantitation.
Results: The analytes of interest were extracted successful from dried blood spots showing good linearity, accuracy, and precision.
Introduction Important factors in the analysis of drugs in whole blood are accurate measurements, storage capabilities, small sample volume, and easy extraction. Dried blood spots are becoming an adopted clinical research technique for the analysis of drugs in biological matrices. Due to the complexity of the solution resulting from dissolving the blood spot, the sample must undergo further cleanup by chromatographic separation before introduction into the mass spectrometer. A research application is demonstrated using the Thermo Scientific™ Prelude SPLC™ system and the Thermo Scientific™ TSQ Endura™ triple quadrupole mass spectrometer (Figure 1) to quantitatively analyze 14 antidepressant drugs collected from dried blood spots.
Instrumentation A Prelude SPLC system was used in TX mode and equipped with a Thermo Scientific™ TurboFlow™ Fluoro XL 0.5 x 50 mm cleanup column and a 2.1 x 50 mm, 2.6 µm particle size Thermo Scientific™ Accucore™ aQ analytical column. The detector for the system was a TSQ Endura triple quadrupole mass spectrometer with a heated electrospray ionization (HESI-II) probe in positive mode. Thermo Scientific™ TraceFinder™ software version 3.1 was used for quantitation. The liquid chromatography flow path is found in Figure 3.
Method Parameters
Mobile phases were (A) 10 mM ammonium formate, 0.05% formic acid in water; (B) 10 mM ammonium formate, 0.05% formic acid in methanol; and (C) 45/45/10 acetonitrile/isopropanol/acetone. The LC method is shown in Table 1. The mass spectrometer quantifier and qualifier selected-reaction monitoring (SRM) transitions are shown in Table 2. The method range for all the analytes was 10–750 ng/mL.
FIGURE 1. Prelude SPLC system with TSQ Endura MS
Methods Sample Preparation The analytes of interest were spiked into human whole blood at various concentrations to make calibrators and controls. The samples were spotted at a fixed volume onto Whatman® paper. Then, the analyte was extracted by solvent containing isotopically labeled internal standards and transferred into clean vials for LC-MS/MS analysis. The entire workflow is depicted in Figure 2.
Spot DBS card with standards and QCs
Add 200 µL of IS in methanol
Vortex for 20 minutes
Extract solution from wells and add 500 µL water
Punch card with 3 mm hole punch
Place punched hole into 96 well plate
FIGURE 2. Workflow of preparing the dried blood spot for LC/MS
FIGURE 3. Online sample cleanup and analytic separation flow path
TABLE 2. SRM transitions
Step Start Sec Flow %A %B %C Tee Loop
Flow Grad %A %B
1 0.00 40 1.5 100.0 - - ==== out 0.50 100 -
2 0.67 65 0.20 - 100 - T in 0.50 100 -
3 1.75 5 0.20 - 100 - ==== in 0.50 40 60
4 1.83 120 1.20 - - 100 ==== out 0.50 25 75
5 3.83 30 1.10 - - 100 ==== out 0.50 - 100
6 4.33 60 1.50 100 - - ==== out 0.50 100 -
Analyte Precursor Ion (Q1)
Product Ions (Q3)
Collision Energy S-lens
Amitriptyline 278.1 233.2 15 61 191.1 15 61
Doxepin 280.2 235.0 26 61 Imipramine 281.0 86.3 25 88
208.0 25 88 Fluvoxamine 319.1 200.0 19 70
228.0 19 70 Clomipramine 314.9 86.2 20 55
242.1 20 55 Fluoxetine 310.1 117.1 10 83
148.0 10 83 Paroxetine 330.1 192.0 28 94
151.0 28 94 Citalopram 325.1 109.1 25 120
262.0 25 120 Nortiptyline 264.1 233.0 20 50
191.0 20 50 Desipramine 267.1 208.1 20 48
236.1 20 48 Venlafaxine 278.2 147.1 15 61
121.1 15 61 Sertraline 306.0 275.0 13 80
158.9 13 80 Duloxetine 298.0 154.0 8 55
- Bupropion 241.0 167.0 15 61
185.0 15 61 Amitriptyline-d3 281.1 233.2 24 90 Doxepin-d3 283.2 235.1 24 106 Fluoxetine-d6 316.1 154.0 16 79 Paroxetine-d6 336.1 198.1 20 125 Nortiptyline-d3 267.1 233.1 18 97 Sertraline-d3 309.0 275.0 12 69
TABLE 1. LC method parameters Results One day of accuracy and precision measurements were performed for system verification on each of the following analytes: amitriptyline, doxepin, imipramine, fluvoxamine, clomipramine, fluoxetine, paroxetine, citalopram, nortriptyline, desipramine, venlafaxine, sertraline, duloxeine, and bupropion. The inter-day and intra-day accuracy and precision were tested from 10–750 ng/mL for each analyte. A summary of the results is shown in Table 3. The assay precision had RSD values that were less than 15.0% for all compounds tested; LOQ compounds had values less than 20.0%. Additionally, accuracy was ±15.0% of the theoretical value for all assays. The correlation coefficient values for all compounds ranged from 0.9900 to 0.9950, showing linearity throughout all concentrations and analytes. All analytes passed carryover, recovery, and selectivity criteria, as well as benchtop and autosampler stability criteria. Recoveries were all above 90.0% including matrix effects. Example SRM chromatograms at the LOQ are shown in Figure 4. Examples of the calibration curves are shown in Figure 5.
TABLE 3. Quality control accuracy and precision summary Analyte
Expe
cted
C
onc Amitriptylin Doxepin Impiramine Fluvoxamine Clomipramine Fluoxetine Paroxetine Citalopram Nortriptyline Desipramine Venlafaxine Sertaline Duloxetine Bupropion
Leve
l
Low
20
AVG 17.6 18.0 19.9 19.6 19.3 17.6 18.2 18.9 18.4 19.4 21.4 19.1 18.9 17.3
%RSD 12.25 10.25 0.20 2.00 3.70 12.25 9.28 5.38 7.88 3.20 7.00 4.75 5.70 13.70
Mid
110
AVG 113 98 115 125 116 118 115 115 116 111 114 17 117 118
%RSD 3.14 11.18 4.29 8.87 5.82 7.09 4.18 4.73 5.64 0.91 4.00 6.00 1.91 2.44
High
380
AVG 399 336 409 423 411 418 394 391 409 391 401 415 389 375
%RSD 4.95 11.36 7.58 11.26 8.05 10.05 3.68 2.89 7.58 2.95 5.42 9.16 2.42 1.27
FIGURE 4. Representative chromatograms at the LOQ
0
250
500
0 1 2 30
300
600
0 1 2 30
1000
2000
3000
0 1 2 3
0
250
500
750
0 1 2 30
325
650
975
1300
0 1 2 3
0
500
1000
0 1 2 30
1000
2000
0 1 2 3
0
325
650
0 1 2 3
0
1500
3000
0 1 2 30
500
1000
1500
0 1 2 30
750
1500
0 1 2 3
Amitriptylin Doxepin impiramine
Fluvoxamine Clomipramine Fluoxetine
Paroxetine Citalopram Nortriptyline
Desipramine Venlafaxine Sertraline
Duloxetine Bupropion
0
400
800
0 1 2 3
0
200
400
0 1 2 30
600
1200
0 1 2 3
FIGURE 5. Representative calibration curves
Conclusion • An LC-MC/MS research method has been successfully developed and verified for the
quantification of 14 antidepressant drugs collected from dried blood spots using a Prelude SPLC system and a TSQ Endura triple quadrupole mass spectrometer.
• Online sample cleanup of the matrix resulting from dried blood spot collection reduced the complexity of the LC-MS/MS workflow.
• Due to the use of online sample preparation, this research method is more accurate, easier to perform, takes less time, is more robust, and is less costly then traditional offline sample preparation such as SPE plates.
For Research Use Only. Not for use in diagnostic procedures.
Whatman is a registered trademark of GE Healthcare. All other trademarks are the property of Thermo Fisher Scientific and its subsidiaries.
This information is not intended to encourage use of these products in any manners that might infringe the intellectual property rights of others.
5Thermo Scientific Poster Note • PN-64075-ASMS-EN-0614S
LC/MS/MS Research Method for 14 Antidepressants Utilizing Dried Blood Spots Kerry M. Hassell, Sarah J. Fair, and Joseph L. Herman Thermo Fisher Scientific, 101 Constitution Blvd., Franklin, MA 02038
Overview Purpose: To develop an LC-MS/MS research method for measuring the concentration of antidepressants from dried blood spots (DBS).
Methods: An LC-MS/MS method was developed to extract 14 antidepressants from dried blood spots for quantitation.
Results: The analytes of interest were extracted successful from dried blood spots showing good linearity, accuracy, and precision.
Introduction Important factors in the analysis of drugs in whole blood are accurate measurements, storage capabilities, small sample volume, and easy extraction. Dried blood spots are becoming an adopted clinical research technique for the analysis of drugs in biological matrices. Due to the complexity of the solution resulting from dissolving the blood spot, the sample must undergo further cleanup by chromatographic separation before introduction into the mass spectrometer. A research application is demonstrated using the Thermo Scientific™ Prelude SPLC™ system and the Thermo Scientific™ TSQ Endura™ triple quadrupole mass spectrometer (Figure 1) to quantitatively analyze 14 antidepressant drugs collected from dried blood spots.
Instrumentation A Prelude SPLC system was used in TX mode and equipped with a Thermo Scientific™ TurboFlow™ Fluoro XL 0.5 x 50 mm cleanup column and a 2.1 x 50 mm, 2.6 µm particle size Thermo Scientific™ Accucore™ aQ analytical column. The detector for the system was a TSQ Endura triple quadrupole mass spectrometer with a heated electrospray ionization (HESI-II) probe in positive mode. Thermo Scientific™ TraceFinder™ software version 3.1 was used for quantitation. The liquid chromatography flow path is found in Figure 3.
Method Parameters
Mobile phases were (A) 10 mM ammonium formate, 0.05% formic acid in water; (B) 10 mM ammonium formate, 0.05% formic acid in methanol; and (C) 45/45/10 acetonitrile/isopropanol/acetone. The LC method is shown in Table 1. The mass spectrometer quantifier and qualifier selected-reaction monitoring (SRM) transitions are shown in Table 2. The method range for all the analytes was 10–750 ng/mL.
FIGURE 1. Prelude SPLC system with TSQ Endura MS
Methods Sample Preparation The analytes of interest were spiked into human whole blood at various concentrations to make calibrators and controls. The samples were spotted at a fixed volume onto Whatman® paper. Then, the analyte was extracted by solvent containing isotopically labeled internal standards and transferred into clean vials for LC-MS/MS analysis. The entire workflow is depicted in Figure 2.
Spot DBS card with standards and QCs
Add 200 µL of IS in methanol
Vortex for 20 minutes
Extract solution from wells and add 500 µL water
Punch card with 3 mm hole punch
Place punched hole into 96 well plate
FIGURE 2. Workflow of preparing the dried blood spot for LC/MS
FIGURE 3. Online sample cleanup and analytic separation flow path
TABLE 2. SRM transitions
Step Start Sec Flow %A %B %C Tee Loop
Flow Grad %A %B
1 0.00 40 1.5 100.0 - - ==== out 0.50 100 -
2 0.67 65 0.20 - 100 - T in 0.50 100 -
3 1.75 5 0.20 - 100 - ==== in 0.50 40 60
4 1.83 120 1.20 - - 100 ==== out 0.50 25 75
5 3.83 30 1.10 - - 100 ==== out 0.50 - 100
6 4.33 60 1.50 100 - - ==== out 0.50 100 -
Analyte Precursor Ion (Q1)
Product Ions (Q3)
Collision Energy S-lens
Amitriptyline 278.1 233.2 15 61 191.1 15 61
Doxepin 280.2 235.0 26 61 Imipramine 281.0 86.3 25 88
208.0 25 88 Fluvoxamine 319.1 200.0 19 70
228.0 19 70 Clomipramine 314.9 86.2 20 55
242.1 20 55 Fluoxetine 310.1 117.1 10 83
148.0 10 83 Paroxetine 330.1 192.0 28 94
151.0 28 94 Citalopram 325.1 109.1 25 120
262.0 25 120 Nortiptyline 264.1 233.0 20 50
191.0 20 50 Desipramine 267.1 208.1 20 48
236.1 20 48 Venlafaxine 278.2 147.1 15 61
121.1 15 61 Sertraline 306.0 275.0 13 80
158.9 13 80 Duloxetine 298.0 154.0 8 55
- Bupropion 241.0 167.0 15 61
185.0 15 61 Amitriptyline-d3 281.1 233.2 24 90 Doxepin-d3 283.2 235.1 24 106 Fluoxetine-d6 316.1 154.0 16 79 Paroxetine-d6 336.1 198.1 20 125 Nortiptyline-d3 267.1 233.1 18 97 Sertraline-d3 309.0 275.0 12 69
TABLE 1. LC method parameters Results One day of accuracy and precision measurements were performed for system verification on each of the following analytes: amitriptyline, doxepin, imipramine, fluvoxamine, clomipramine, fluoxetine, paroxetine, citalopram, nortriptyline, desipramine, venlafaxine, sertraline, duloxeine, and bupropion. The inter-day and intra-day accuracy and precision were tested from 10–750 ng/mL for each analyte. A summary of the results is shown in Table 3. The assay precision had RSD values that were less than 15.0% for all compounds tested; LOQ compounds had values less than 20.0%. Additionally, accuracy was ±15.0% of the theoretical value for all assays. The correlation coefficient values for all compounds ranged from 0.9900 to 0.9950, showing linearity throughout all concentrations and analytes. All analytes passed carryover, recovery, and selectivity criteria, as well as benchtop and autosampler stability criteria. Recoveries were all above 90.0% including matrix effects. Example SRM chromatograms at the LOQ are shown in Figure 4. Examples of the calibration curves are shown in Figure 5.
TABLE 3. Quality control accuracy and precision summary Analyte
Expe
cted
C
onc Amitriptylin Doxepin Impiramine Fluvoxamine Clomipramine Fluoxetine Paroxetine Citalopram Nortriptyline Desipramine Venlafaxine Sertaline Duloxetine Bupropion
Leve
l
Low
20
AVG 17.6 18.0 19.9 19.6 19.3 17.6 18.2 18.9 18.4 19.4 21.4 19.1 18.9 17.3
%RSD 12.25 10.25 0.20 2.00 3.70 12.25 9.28 5.38 7.88 3.20 7.00 4.75 5.70 13.70
Mid
110
AVG 113 98 115 125 116 118 115 115 116 111 114 17 117 118
%RSD 3.14 11.18 4.29 8.87 5.82 7.09 4.18 4.73 5.64 0.91 4.00 6.00 1.91 2.44
High
380
AVG 399 336 409 423 411 418 394 391 409 391 401 415 389 375
%RSD 4.95 11.36 7.58 11.26 8.05 10.05 3.68 2.89 7.58 2.95 5.42 9.16 2.42 1.27
FIGURE 4. Representative chromatograms at the LOQ
0
250
500
0 1 2 30
300
600
0 1 2 30
1000
2000
3000
0 1 2 3
0
250
500
750
0 1 2 30
325
650
975
1300
0 1 2 3
0
500
1000
0 1 2 30
1000
2000
0 1 2 3
0
325
650
0 1 2 3
0
1500
3000
0 1 2 30
500
1000
1500
0 1 2 30
750
1500
0 1 2 3
Amitriptylin Doxepin impiramine
Fluvoxamine Clomipramine Fluoxetine
Paroxetine Citalopram Nortriptyline
Desipramine Venlafaxine Sertraline
Duloxetine Bupropion
0
400
800
0 1 2 3
0
200
400
0 1 2 30
600
1200
0 1 2 3
FIGURE 5. Representative calibration curves
Conclusion • An LC-MC/MS research method has been successfully developed and verified for the
quantification of 14 antidepressant drugs collected from dried blood spots using a Prelude SPLC system and a TSQ Endura triple quadrupole mass spectrometer.
• Online sample cleanup of the matrix resulting from dried blood spot collection reduced the complexity of the LC-MS/MS workflow.
• Due to the use of online sample preparation, this research method is more accurate, easier to perform, takes less time, is more robust, and is less costly then traditional offline sample preparation such as SPE plates.
For Research Use Only. Not for use in diagnostic procedures.
Whatman is a registered trademark of GE Healthcare. All other trademarks are the property of Thermo Fisher Scientific and its subsidiaries.
This information is not intended to encourage use of these products in any manners that might infringe the intellectual property rights of others.

6 LC/MS/MS Research Method for 14 Antidepressants Utilizing Dried Blood Spots
LC/MS/MS Research Method for 14 Antidepressants Utilizing Dried Blood Spots Kerry M. Hassell, Sarah J. Fair, and Joseph L. Herman Thermo Fisher Scientific, 101 Constitution Blvd., Franklin, MA 02038
Overview Purpose: To develop an LC-MS/MS research method for measuring the concentration of antidepressants from dried blood spots (DBS).
Methods: An LC-MS/MS method was developed to extract 14 antidepressants from dried blood spots for quantitation.
Results: The analytes of interest were extracted successful from dried blood spots showing good linearity, accuracy, and precision.
Introduction Important factors in the analysis of drugs in whole blood are accurate measurements, storage capabilities, small sample volume, and easy extraction. Dried blood spots are becoming an adopted clinical research technique for the analysis of drugs in biological matrices. Due to the complexity of the solution resulting from dissolving the blood spot, the sample must undergo further cleanup by chromatographic separation before introduction into the mass spectrometer. A research application is demonstrated using the Thermo Scientific™ Prelude SPLC™ system and the Thermo Scientific™ TSQ Endura™ triple quadrupole mass spectrometer (Figure 1) to quantitatively analyze 14 antidepressant drugs collected from dried blood spots.
Instrumentation A Prelude SPLC system was used in TX mode and equipped with a Thermo Scientific™ TurboFlow™ Fluoro XL 0.5 x 50 mm cleanup column and a 2.1 x 50 mm, 2.6 µm particle size Thermo Scientific™ Accucore™ aQ analytical column. The detector for the system was a TSQ Endura triple quadrupole mass spectrometer with a heated electrospray ionization (HESI-II) probe in positive mode. Thermo Scientific™ TraceFinder™ software version 3.1 was used for quantitation. The liquid chromatography flow path is found in Figure 3.
Method Parameters
Mobile phases were (A) 10 mM ammonium formate, 0.05% formic acid in water; (B) 10 mM ammonium formate, 0.05% formic acid in methanol; and (C) 45/45/10 acetonitrile/isopropanol/acetone. The LC method is shown in Table 1. The mass spectrometer quantifier and qualifier selected-reaction monitoring (SRM) transitions are shown in Table 2. The method range for all the analytes was 10–750 ng/mL.
FIGURE 1. Prelude SPLC system with TSQ Endura MS
Methods Sample Preparation The analytes of interest were spiked into human whole blood at various concentrations to make calibrators and controls. The samples were spotted at a fixed volume onto Whatman® paper. Then, the analyte was extracted by solvent containing isotopically labeled internal standards and transferred into clean vials for LC-MS/MS analysis. The entire workflow is depicted in Figure 2.
Spot DBS card with standards and QCs
Add 200 µL of IS in methanol
Vortex for 20 minutes
Extract solution from wells and add 500 µL water
Punch card with 3 mm hole punch
Place punched hole into 96 well plate
FIGURE 2. Workflow of preparing the dried blood spot for LC/MS
FIGURE 3. Online sample cleanup and analytic separation flow path
TABLE 2. SRM transitions
Step Start Sec Flow %A %B %C Tee Loop
Flow Grad %A %B
1 0.00 40 1.5 100.0 - - ==== out 0.50 100 -
2 0.67 65 0.20 - 100 - T in 0.50 100 -
3 1.75 5 0.20 - 100 - ==== in 0.50 40 60
4 1.83 120 1.20 - - 100 ==== out 0.50 25 75
5 3.83 30 1.10 - - 100 ==== out 0.50 - 100
6 4.33 60 1.50 100 - - ==== out 0.50 100 -
Analyte Precursor Ion (Q1)
Product Ions (Q3)
Collision Energy S-lens
Amitriptyline 278.1 233.2 15 61 191.1 15 61
Doxepin 280.2 235.0 26 61 Imipramine 281.0 86.3 25 88
208.0 25 88 Fluvoxamine 319.1 200.0 19 70
228.0 19 70 Clomipramine 314.9 86.2 20 55
242.1 20 55 Fluoxetine 310.1 117.1 10 83
148.0 10 83 Paroxetine 330.1 192.0 28 94
151.0 28 94 Citalopram 325.1 109.1 25 120
262.0 25 120 Nortiptyline 264.1 233.0 20 50
191.0 20 50 Desipramine 267.1 208.1 20 48
236.1 20 48 Venlafaxine 278.2 147.1 15 61
121.1 15 61 Sertraline 306.0 275.0 13 80
158.9 13 80 Duloxetine 298.0 154.0 8 55
- Bupropion 241.0 167.0 15 61
185.0 15 61 Amitriptyline-d3 281.1 233.2 24 90 Doxepin-d3 283.2 235.1 24 106 Fluoxetine-d6 316.1 154.0 16 79 Paroxetine-d6 336.1 198.1 20 125 Nortiptyline-d3 267.1 233.1 18 97 Sertraline-d3 309.0 275.0 12 69
TABLE 1. LC method parameters Results One day of accuracy and precision measurements were performed for system verification on each of the following analytes: amitriptyline, doxepin, imipramine, fluvoxamine, clomipramine, fluoxetine, paroxetine, citalopram, nortriptyline, desipramine, venlafaxine, sertraline, duloxeine, and bupropion. The inter-day and intra-day accuracy and precision were tested from 10–750 ng/mL for each analyte. A summary of the results is shown in Table 3. The assay precision had RSD values that were less than 15.0% for all compounds tested; LOQ compounds had values less than 20.0%. Additionally, accuracy was ±15.0% of the theoretical value for all assays. The correlation coefficient values for all compounds ranged from 0.9900 to 0.9950, showing linearity throughout all concentrations and analytes. All analytes passed carryover, recovery, and selectivity criteria, as well as benchtop and autosampler stability criteria. Recoveries were all above 90.0% including matrix effects. Example SRM chromatograms at the LOQ are shown in Figure 4. Examples of the calibration curves are shown in Figure 5.
TABLE 3. Quality control accuracy and precision summary Analyte
Expe
cted
C
onc Amitriptylin Doxepin Impiramine Fluvoxamine Clomipramine Fluoxetine Paroxetine Citalopram Nortriptyline Desipramine Venlafaxine Sertaline Duloxetine Bupropion
Leve
l
Low
20
AVG 17.6 18.0 19.9 19.6 19.3 17.6 18.2 18.9 18.4 19.4 21.4 19.1 18.9 17.3
%RSD 12.25 10.25 0.20 2.00 3.70 12.25 9.28 5.38 7.88 3.20 7.00 4.75 5.70 13.70
Mid
110
AVG 113 98 115 125 116 118 115 115 116 111 114 17 117 118
%RSD 3.14 11.18 4.29 8.87 5.82 7.09 4.18 4.73 5.64 0.91 4.00 6.00 1.91 2.44
High
380
AVG 399 336 409 423 411 418 394 391 409 391 401 415 389 375
%RSD 4.95 11.36 7.58 11.26 8.05 10.05 3.68 2.89 7.58 2.95 5.42 9.16 2.42 1.27
FIGURE 4. Representative chromatograms at the LOQ
0
250
500
0 1 2 30
300
600
0 1 2 30
1000
2000
3000
0 1 2 3
0
250
500
750
0 1 2 30
325
650
975
1300
0 1 2 3
0
500
1000
0 1 2 30
1000
2000
0 1 2 3
0
325
650
0 1 2 3
0
1500
3000
0 1 2 30
500
1000
1500
0 1 2 30
750
1500
0 1 2 3
Amitriptylin Doxepin impiramine
Fluvoxamine Clomipramine Fluoxetine
Paroxetine Citalopram Nortriptyline
Desipramine Venlafaxine Sertraline
Duloxetine Bupropion
0
400
800
0 1 2 3
0
200
400
0 1 2 30
600
1200
0 1 2 3
FIGURE 5. Representative calibration curves
Conclusion • An LC-MC/MS research method has been successfully developed and verified for the
quantification of 14 antidepressant drugs collected from dried blood spots using a Prelude SPLC system and a TSQ Endura triple quadrupole mass spectrometer.
• Online sample cleanup of the matrix resulting from dried blood spot collection reduced the complexity of the LC-MS/MS workflow.
• Due to the use of online sample preparation, this research method is more accurate, easier to perform, takes less time, is more robust, and is less costly then traditional offline sample preparation such as SPE plates.
For Research Use Only. Not for use in diagnostic procedures.
Whatman is a registered trademark of GE Healthcare. All other trademarks are the property of Thermo Fisher Scientific and its subsidiaries.
This information is not intended to encourage use of these products in any manners that might infringe the intellectual property rights of others.

Thermo Fisher Scientific, San Jose, CA USA isISO 13485 Certified.
www.thermoscientific.com©2014 Thermo Fisher Scientific Inc. All rights reserved. ISO is a trademark of the International Standards Organization. Whatman is a registered trademark of GE Healthcare. All other trademarks are the property of Thermo Fisher Scientific and its subsidiaries. This information is presented as an example of the capabilities of Thermo Fisher Scientific products. It is not intended to encourage use of these products in any manners that might infringe the intellectual property rights of others. Specifications, terms and pricing are subject to change. Not all products are available in all countries. Please consult your local sales representative for details.
PN-64075-EN-0614S
Africa +43 1 333 50 34 0Australia +61 3 9757 4300Austria +43 810 282 206Belgium +32 53 73 42 41Canada +1 800 530 8447China 800 810 5118 (free call domestic)
400 650 5118
Denmark +45 70 23 62 60Europe-Other +43 1 333 50 34 0Finland +358 9 3291 0200France +33 1 60 92 48 00Germany +49 6103 408 1014India +91 22 6742 9494Italy +39 02 950 591
Japan +81 45 453 9100Latin America +1 561 688 8700Middle East +43 1 333 50 34 0Netherlands +31 76 579 55 55New Zealand +64 9 980 6700Norway +46 8 556 468 00Russia/CIS +43 1 333 50 34 0
Singapore +65 6289 1190Spain +34 914 845 965Sweden +46 8 556 468 00Switzerland +41 61 716 77 00UK +44 1442 233555USA +1 800 532 4752
For Research Use Only. Not for use in diagnostic procedures.