lcn fund tier 1 interim technical report hook norton low
TRANSCRIPT

1
LCN Fund Tier 1 Interim Technical Report
Hook Norton Low Carbon Community Smart Grid
Steven Burns
October 2012
Working With
2
Introduction and Objectives 1.
This document has been developed to provide an interim update on the Hook Norton Low Carbon
Community Smart Grid Tier 1 LCNF project. It will focus primarily on the technical learning from the
scheme following the installation activity on the project. A further close our report will be produced
in Q4 2013 to detail additional learning gained from a prolonged period of running the system, data
analysis and customer interaction.
The following information is extracted from the Tier 1 project submission pro-forma.
Project Title Hook Norton Low Carbon Community Smart Grid
Project Background
Hook Norton is a dynamic rural community in Oxfordshire with around 2,500 residents and 800 properties. Last year, the village was awarded £400k from DECC’s Low Carbon Communities programme to help its residents ‘decarbonise’. Thanks to the Hook Norton Low Carbon group and the limited company which they have set up, the money has been spent on a variety of different projects which, over time, will return money back into the community. Initiatives undertaken to date include home retrofits (£5 to £40k interest free loans), a school makeover (including a 17.5kW PV installation) and a small automatic metering deployment. Plans are now underway to obtain planning consent and funding for a community wind turbine (330kW) to the North East of the village. Hook Norton, like many rural villages represents a unique challenge when it comes to carbon reduction because success can only be achieved via a high level of engagement with the local community. Given the fantastic work that has already gone on in Hook Norton, Western Power Distribution aims to develop a range of tools and techniques that can be used to support the low carbon transition within rural communities.
Scope and objectives
• To develop and explore customer engagement and incentive programmes. This aspect will include a small scale domestic demand response trial. • To develop community data measurement and display capabilities (e.g. to ascertain the total electricity consumption of the village by installing measurement devices at various locations. Subsequently, to provide this and other relevant information back to the local community via a web portal/customer interface (which if successful, could then be used for other villages)) • To deploy Power Line Communications (PLC) technology at scale within the low voltage (LV) network, illustrating its potential capabilities for enabling smart grid end point measurement and data aggregation. • To test an ‘off the shelf’ asset monitoring solution for HV/LV pole-mounted and ground-mounted substations. • To test and demonstrate a miniature smart grid telecommunications network (with multiple technologies) that will enable both local and remote network visibility • To explore the changes that could be made to a network control system for enabling simple forms of Low Voltage (LV) network monitoring and management
Success criteria Accelerates the development of a low carbon energy sector
Has the potential to deliver net benefits to existing and/or future

3
customers
Has a Direct Impact on the operation of a DNO’s Distribution System
Generates new knowledge that can be shared amongst all
Focuses on network Solutions that are at the trialling stage
Does not lead to unnecessary duplication
Details of the work carried out 2.
The electricity supply for Hook Norton is delivered through a mix of overhead and ground mounted
distribution substations. One of the key aims for the project was to identify and trial methods for
monitoring the low voltage network to provide improved information detailing the energy
consumption of the village. This was undertaken through a combination of monitoring at substations
and energy consumption readings at domestic properties, via smart nodes. Power Line Carrier (PLC)
communications have also been trialled on this project to provide the last mile communications
between domestic properties and substations. The gathered consumption data is to be passed on to
customers for their own information via an online portal provided by the National Energy
Foundation (NEF).
2.1. Project Participants
Western Power Distribution has worked with a number of partners on the Smart Hooky project.
The National Energy Foundation (NEF) is an independent education charity with a long standing
relationship with Hook Norton and has supported many of the low carbon activities in the
village. They were appointed to lead the community engagement and knowledge transfer
elements of the trial.
AND Technology is an independent company specialising in research & development solutions
for industry. They have previously supported the creation of the smart node and hub through an
IFI project utilising the Renesas PLC solution. AND’s role within the project has been to support
the technology development, on site commissioning and technical reporting. Renesas have
continued their involvement, supporting the PLC solution.
2.2. Village Layout and Monitoring
As part of the project, monitoring has been installed at ground mounted substations in Hook
Norton. There are also two sites in the village with HV supplies, feeding a pumping station and
the Hook Norton Brewery. It was deemed that monitoring these would provide little additional

4
information to support the community. Further monitoring is to be added to overhead sites as a
business as usual activity.
Map of Hook Norton with substation boundary areas overlaid
The following table outlines the requirements for each site. The substations in the village
range from pole mounted transformers with a single LV feeder, up to a ground mounted site
with four LV ways. This has meant that the solution developed has had to be suitably flexible
to account for the range of variations found across the trial area. All of the substations in
Hook Norton are outdoors requiring monitoring apparatus to be sited in weatherproof
cabinets. For pole mounted sites, a modified communications cabinet has been utilised, and
GRP pillars and meter boxes for ground mounted sites. The following table details the range
of variations across the sites in the village.
Substation Name LV Ways OH / UG Site Hub Housing
Bourne Lane 3 UG Yes GRP
East End 2 UG Yes Meter Box
Station Rd 3 UG Yes GRP
Southside 2 UG Yes Meter Box
Southrop 2 OH No Pole Cab
Crofts Lane 1 OH No Pole Cab
Scotland End 2 UG No GRP
Hook Norton 4 UG No GRP
Knitting Street 1 OH No Pole Cab
The Bourne 2 OH No Pole Cab
Down End 1 OH No Pole Cab

5
2.3. System Configuration
The above diagram outlines the system configuration used at Hook Norton. Smart nodes have been
installed at 39 domestic properties across the village and communicate via narrowband Power Line
Carrier (PLC) to a Smart Hub situated at a distribution substation. Additional data is collected at the
substation via Rogowski coil units, measuring the 3 phase current on the LV feeders. Readings are
fed through an interface unit and then onto a series of power meters. All data from the smart hub
and power meters are then consolidated at an RTU and transmitted through an onsite radio to a
local radio tower at Whichford Hill. The data is then passed into the WPD network to an ENMAC
control system which is being used as a data collector. Customer consumption data is passed to NEF
and made available for viewing on the web portal by individual customers using a secure login.
2.4. Smart Nodes
Smart Nodes have been installed at a number of domestic
properties via the spare way at the cut-out position. A dual pole
isolation switch has also been installed to allow easy isolation.
Installations took approximately 30 minutes at internal meter
positions and external meter boxes. The total household current is
measured via a clip on CT attached around a live conductor.
The smart node contains a Power Line Carrier (PLC)
communications module capable of returning data gathered to
the substation along the mains cables. As with all equipment on
this project, the nodes utilise the DNP3 protocol.
Smart Node installed in outside meter box with dual pole isolator switch

6
2.5. Smart Hubs
The Smart Hub is a data concentrator designed to gather data from smart nodes, and pass it on
to the RTU to be sent to the head end systems. These units have been installed in four ground
mounted substations where there was the highest concentration of interested customers. To
create the PLC connection a 3 phase service was jointed on to an outgoing leg from the
substations, allowing the PLC signal to
propagate onto the LV busbars and out on to
the network.
To allow ease of connection and removal the
smart hubs have been connected via a 3 phase
commando socket. While this provides a
practical operational solution, it did prove to
be bulky in some scenarios, and caused some
space issues in the smaller enclosures.
Smart Hub with commando socket attachment
2.6. Substation Equipment
For the underground sites a combination of housing have been trialled. For larger sites a GRP
cabinet has been installed to house all the monitoring equipment. At East End and Southside
substations, two large meter boxes have been utilised due to space constraints.
Meter boxes and GRP housings used for installing ground mounted monitoring
For each LV feeder, a Rogowski coil has been installed around the individual phases to allow
detailed current monitoring. The flexible nature of the coils allows live installation unlike
other methods of monitoring utilising split core CTs around busbars. The Rogowski coils have
been terminated into Haysys Rogowski interface units by bringing the tails from the coils
through ducting into the external cabinets.
An interface unit is required for each LV feeder, which can lead to space issues for
substations with four or more LV ways. Schneider PM9c power meters have been installed

7
to act as a metering unit and process the voltage and current data before passing it through
to the RTU.
Rogowski Coils around low voltage cables in a 3 way LV cabinet.
The completed cabinets have been arranged as below. The following example is from one of the GRP
cabinets and was prepared in the workshop prior to installation.

8
Project Outcomes to Date 3.
3.1. Smart Node Performance
The first smart nodes were installed towards the end of Q4 2011 and to date 39 have been
installed at properties attached to 4 different ground mounted substations. The system has the
ability to vary the reporting times of current readings from each property. Below is a sample of
data gathered with a 2 minute resolution for a series of 4 nodes attached to the East End
Substation. In total data from 17 nodes was collected in this sample; however data is only
displayed for 4 to allow a clearer view of the load variations.
This snapshot of data demonstrates the ability of the nodes to gather load data at a meaningful
resolution without overloading the communications network. To ensure data privacy, each node
is identifiable only by the serial number within the system. It is not until the data is returned to
NEF that it is cross referenced with the address data table with the explicit permission of
customers.
During on-site testing, a data set was evaluated for a number of properties to examine the
accuracy of current readings. In some cases the current was less than 1A and showing little
variation. This lead to some initial concern that the clip on CT was not operating, but was
verified to be correct using a current meter at the property. The uniform readings were
explained primarily through properties being unoccupied during the daytime while testing was
underway.
3.2. PLC Performance
Previous trials by WPD and elsewhere have provided some evidence surrounding the reliability
of narrow band PLC on a UK network. Learning from these schemes indicated that the solution
employed at Hook Norton could encounter a number of problems including the ability to reach
9
properties at distance from the substation and signal reliability. However none of these issues
have been experienced and the system has performed well.
At East End substation, the hub was installed prior to any nodes at domestic properties. In this
scenario, nodes successfully joined the network following energisation at the customer premise.
The project has also tested the scenario where nodes have been commissioned in meter boxes
prior to the smart hub being sited at the substation. This also resulted in the nodes all
successfully joining the network.
The Renesas PLC solution has the added ability for nodes to act as repeaters, allowing nodes
closer to the substation to pass messages on from locations that otherwise would not have the
signal strength to communicate with the hub. At East End substation a network of 17 nodes has
been installed and has automatically configured into a 3 layer network. In practice this means
that nodes far from the substation are passing messages through two nodes closer and allowing
successful communication. This network configuration has occurred without the need for a
lengthy set-up process or indeed on site intervention.
A paper has been prepared by AND Technology outlining the findings and performance of the
PLC system and is attached in Appendix A.
Further information about the Renesas PLC technology used on this project can be found at the
following link.
http://www.renesas.eu/products/mpumcu/plc_mpumcu/m16c60_plc/m16c6s/index.jsp
3.3. Customer Engagement and Incentives
The customer engagement was led by NEF as they had worked previously with the village on a
number of low carbon and energy efficiency schemes. Key to recruiting customers for this
project was the use of existing networks like the Hook Norton Low Carbon Club and other
organised groups. This provided an element of trust to the householders as the project came
with the endorsement of the groups. Information was also posted on local notice boards and
shop windows to raise the awareness of the scheme. As a further incentive, participants were
entered into a prize draw including such potential rewards as Eurostar vouchers, a meal at a
village pub and vouchers for a local store. It is thought that these incentives may have helped
the initial sign up but have in many cases not been the deciding factor.
The most successful recruitment drive was at a local music event, where people were relaxed
enjoying themselves. This social setting made the initial approach simpler giving time to explain
about the project and collect names and ask if they knew anybody who would be interested too.
An extensive door to door campaign was also employed to gather further project participants.
This provided a relatively small 2% response rate but provided knowledge that the area had
been thoroughly covered and a large proportion of eligible properties engaged.
Once signed up, retention of participants was high and in total only 2 customers dropping out. A
small number of other customers also left the project due to lack of space at meter positions or

10
through moving out of the area. NEF ensured that customers were kept up to date on the
project as part of their on-going communication with Low Carbon Hook Norton.
Due to the limited scale of the scheme, all installation booking was handled though NEF. This
proved a time consuming process as people are available at different times. From a customer
perspective the installations went well and there have been no complaints.

11
Project modifications 4.
The data architecture for the project has undergone a number of reviews throughout the project.
Within the electricity distribution industry, there has been an on-going debate regarding whether
smart grid intelligence should be centralised or decentralised. From a systems perspective it was
initially planned to install a remote server at Whichford Hill that would manage the data
applications. However, this was reviewed as part of the business integration process and a
centralised solution has been employed by developing a duplicate ENMAC control system specifically
for trial activity. This will ensure that for any future research projects, the data systems should be
applicable and will save additional development, and reduce the need for numerous maintenance
plans relating to remotely installed servers.
From an installation perspective, much of the project has followed the planned methodology. Some
installation delays have occurred in terms of deployment but have not altered the primary scheme
objectives.
A small number of smart nodes could not be fitted at some customer installation points due to lack
of space. This was always identified as a potential risk, and has led to a slight reduction in the
number of nodes deployed.

12
Learning To Date 5.
5.1. Smart Nodes
While the performance of the smart nodes has been extremely positive, there have been a
number of factors that have been identified that would improve the deployment in future
scenarios. During the early stages of node installation it
was decided to concentrate on installing nodes in
customers premises with outdoor meter boxes. This
ensured that if further work was required to update
firmware, access to the node could be made with minimal
disruption to the customer.
At a number of sites the meter positions were too
congested to allow installation. This was due to a number
of factors including off-peak time switches, FITs meters
and equipment from previous trials undertaken by EA
Technology in the area. In some circumstance, customers
had also installed their own equipment in meter boxes
making installation of a node not possible.
Further work could be undertaken to assess the form
factor of the smart nodes and even look to include it as
part of an enhanced cut-out. This would significantly
reduce the space required and remove the need for
external wiring to a clip on CT. This would however require
the additional associated with a cut out change.
Outside meter box with additional time switch.
The use of a clip on CT was chosen as a compromise position between cost and accuracy. A
number of devices were tested by AND Technology and the chosen component provided a good
level of accuracy. On site testing was used to verify the current at the meter point matched that
recorded and sent to the smart hub. In a number of instances, a recent meter change had
occurred and the meter tails upgraded to 25mm2 conductors. In this instance the CT could not
fully clamp around the cable and a tie wrap was employed to secure the CT. This was shown to
have a limited effect on the overall accuracy of the device.
At one property the internal wiring was particularly complex with more than one consumer unit
in place. The CT could not be fitted around the enlarged meter tails and as another cable was
identified. However it was later discovered that this cable did not carry all the power for the
property as current readings returned did not match expectations.

13
The current design of smart node does not
monitor the voltage at customer’s premises.
This functionality would have provided an
additional layer of network knowledge which
should be included in any further
deployments.
Smart node with clip on current clamp CT
5.2. Substation Works
At the time of installation, no such project of this type had been trialled by WPD. The
methodology employed was developed based on utilising existing business skill-sets and BAU
activity, rather than developing new methods and working practices. For example rather than
develop clamps onto the LV substation busbars, a new cable was jointed onto an existing LV
cable near the substation. The new cable was then terminated in a three phase cut out and used
to inject the PLC signal back to the substation and out on the network via the other cables.
Station Road substation with monitoring housed in GRP cabinet.
At Station Rd substation (pictured) this methodology involved extensive excavation and
reinstatement works along with the casting of a plinth for the monitoring cabinet. Additional
wayleave agreements were required as the land outside the substation is privately owned. While
this approach was practical for a trial it would prove too costly and time consuming for a wide-
scale deployment.

14
In a trial of this nature, space was not a major issue for the range of substations chosen. The
solution employed took into account the area available and used cabinets to house the
monitoring equipment. It is recognised that these method would not be applicable at all
locations, in particular GRP housings with no additional available land.
The monitoring equipment in the cabinets was chosen to provide a robust system utilising off
the shelf products. As a result the solution developed was relatively large and required a
significant amount of small wiring to connect the devices. More compact monitoring products
are now becoming available on the market which should prove simpler and quicker to install and
requiring less specialist small wiring skills.
5.3. Communications and IT
Initial problems were encountered with the PLC solution at two sites as nodes joined to the
network and then failed to communicate with the hub. This was eventually traced to a poor
neutral connection in the monitoring cabinet that was easily rectified. Nodes then re-joined the
network and have since retained a good connection.
When the project was initially designed it was envisaged that the data would be retrieved
through the use of locally based server. However it became clear that a centralised solution
would serve the wider programme of LCNF projects more ably. This change of direction along
with the integration of Central Networks into WPD caused a delay in the IT delivery for the
project. This has also had a knock on effect in the delivery of the customer portal as data has not
been available for end users to date.
As part of the monitoring solution a Schneider Talus T4e RTU has been used to collate the data
gathered from the range of devices on site. The Smart Hub utilises the DNP3 protocol with a
unique set of data mapping points. In initial bench tests, data failed to be passed through the
RTU as the correct profile did not exist for the smart hub. As DNP3 profiling software was not
available, Schneider was contacted to create the mapping allowing the equipment to be
successfully commissioned. This is something that will be factored into any future deployments
using DNP3.
5.4. Customer Engagement
The recruitment of customers in the village yielded smaller numbers than was initially
anticipated. The lack of certainty as to when data would be available was, in some cases, a factor
that hindered recruitment. The use of incentives such as the prize draw proved popular although
it is not thought that this was the deciding factor in involvement for many.
As limited amounts of data have been made available it is difficult to assess what impact this will
have on behaviour. It is therefore proposed that a further assessment of this aspect should be
made in the project close out report in Q4 2013.

15
Next Steps 6.
To date, Smart Hooky has focused primarily on getting the equipment installed and communications
technology established. There are a number of pieces of monitoring equipment still to be installed at
pole mounted, that will give a more complete picture of the energy usage of the area.
Further work will be undertaken by NEF to examine and understand the data coming from the
project, which will also be used to inform a number of further studies and trials in Hook Norton
It is believed that the infrastructure in place leaves a legacy that will in future help inform and shape
the energy usage of the village. This can be a vital platform for further projects in the community
aimed at reducing the carbon footprint of Hook Norton.
The final close out report for this scheme will be produced in Q4 2013 to review the performance in
and share additional learning. Further knowledge dissemination is also planned through conferences
and an event to be organised in Hook Norton for interested parties. For further information please
see our website: www.westernpowerinnnovation.co.uk.

[© AND Technology Research Ltd || www.andtr.com || Smart Hooky Appendix A Page 1 of 9 || November 2012]
Appendix 1 – PLC Technical Insert for Smart Hooky Trial
1 | Introduction
The ‘Smart Hooky’ Smart Hubs & Nodes are built upon technology from AND Technology Research
(AND) & communicate via narrowband Power Line Communication (PLC), employing Differential Code
Shift Keying (DCSK) modulation. DCSK is designed to cope with characteristic power line phenomena,
such as spectral distortion, harmonic interference, attenuation, etc. & has proven to be robust in field
trials outside of the UK.
To relay data back to WPD & NEF, the Smart Hubs have an RJ45 Ethernet socket which is used to serve
data back via the backhaul communications link using Distributed Network Protocol 3 (DNP3).
2 | Network coverage Smart Hubs were fitted to East End, Station Road & Bourne Lane Substations, while Smart Nodes were
installed into volunteer property’s that are supplied by one of these substations.
Of the 38 nodes installed into properties connected to either the; East End, Station Road or Bourne Lane
substations, 37 achieved full bi-directional communication with their associating Smart Hub. Only 1
Smart Node (installed into a property in Station Road), to date, has failed to communicate with its
associating Smart Hub. As a result of further trials & investigation, this failure has been attributed to the
fact that the candidate property does not have a direct electrical connection to a Smart Hub-enabled
substation & is likely to be connected to an entirely different substation altogether.
Robust & reliable, point-to point, bi-directional communications has been achieved over 275 meters
utilising the village’s Low Voltage electrical network & the Smart Hub (installed in the East End
Substation) & Smart Node (installed in a residential property served by the East End substation) PLC
communications equipment. However, as later sections of this report describe, point-to-point distance
performance is not necessary critical to the system’s operation as the Smart Hub & Node system
deploys dynamic network technology.
Monitoring data has also been successfully received at WPD’s remote monitoring site from the Smart
Hub installed in the East End Substation & associating Nodes, via the DNP3 backhaul.
3 | Network topology & configuration
Each network (or Smart Zone) with a Smart Hub fitted at the Substation was configured with a Tree
network topology – whereby the Smart Hub is the central root node (the top level of the hierarchy) &
the Smart Nodes (installed in properties with an electrical connection to the substation) are connected
via a point-to-point link to appropriate levels below that (see ‘Figure 1’).
Figure 1 | Network topology showing Smart Nodes connected to Smart Hub at different levels
Smart Hub
0x0001
Smart Node
0x0101
Smart Node
0x0103
Smart Node
0x0202
Smart Node
0x0102
Smart Node
0x0201
Level 0
Level 1
Level 2

[© AND Technology Research Ltd || www.andtr.com || Smart Hooky Appendix A Page 2 of 9 || November 2012]
The networking layer technology deployed in both the Smart Hub & Node enabled the East End,
Station Road & Bourne Lane networks to self-form, thus no on-site manual configuration of the network
was required.
From trials & on-site testing, it was demonstrated that the installed systems had automatically
configured themselves for optimum communication quality, while trying to maintain lowest network
traffic levels. This was seen in terms of both being able to communicate bi-directionally with all of the
installed Smart Nodes on the network & also by the automatically assigned network addresses -
indicating network configuration level.
Figure 2 below shows data being reported back from a 4th network level Smart node, after receiving an
‘Instantaneous Reading’ command from the Smart Hub.
Figure 2 | East End Terminal Emulation Application log highlighting a 4th network level (0x0401) Smart node (13166)
sending back data after receiving a command [18/05/2012]
[Note: UTC time not configured. Voltage & Power factor assumed, not currently being measured]
Figure 3 below shows how individual Smart Nodes have automatically been assigned network address
& levels according to their location on the Low Voltage (LV) electrical network & the optimum
communication quality path back to the Smart Hub installed in the East End Substation.
Note: Only some of the nodes installed in the East End Smart Zone have been mapped onto the WPD
network map in order to highlight likely communication paths between the Smart Node & Smart Hub.

[© AND Technology Research Ltd || www.andtr.com ||Smart Hooky Appendix A - Page 3 of 9 || November 2012]
Figure 3 | East End Smart Node location & network address assignment according to location on LV network & optimum communications path back to the Smart Hub
Level 4
Smart Node 13166
Network address 0x0401
[18/05/2012]
Level 3
Smart Node 13152
Network address 0x0301
[18/05/2012]
Level 2
Smart Node 13164
Network address 0x0204
[18/05/2012]
Level 1
Smart Node 13139
Network address 0x0108
[18/05/2012]
Level 1
Smart Node 13127
Network address 0x0104
[18/05/2012]
Level 1
Smart Node 13146
Network address 0x0105
[18/05/2012]
Level 2
Smart Node 13105
Network address 0x0201
[18/05/2012]
Substation

[© AND Technology Research Ltd || www.andtr.com || Smart Hooky Appendix A - Page 4 of 9 || November 2012]
During the various on-site tests, as anticipated, the networks at each of the Substation sites
reconfigured as new Smart nodes were added. This was recorded in the different network address
being assigned to existing nodes on different visits to Hook Norton.
4 | Quality of service
As discussed earlier in the report, from the trial it can be seen that bi-directional communication
between the Smart Hub & all installed Smart Nodes (connected by the electrical LV network to Smart
Hub-enabled Substations) is reliably being achieved.
From on-site trials & testing it was seen that the system is able to operate comfortably on the existing LV
electrical network infrastructure powered by East End, Station Road or Bourne Lane substations & that
the noise floor generated by the existing electrical supply equipment does not impede the operation of
the Smart Hub & Nodes (see ‘Figure 4 - 11 ’).
Figure 4 | Scope plot of the electrical noise floor at the East End Substation [15/03/2012]
Figure 5 | Scope plot of a message being sent (Tx) from the East End Smart Hub [15/03/2012]
[© AND Technology Research Ltd || www.andtr.com || Smart Hooky Appendix A - Page 5 of 9 || November 2012]
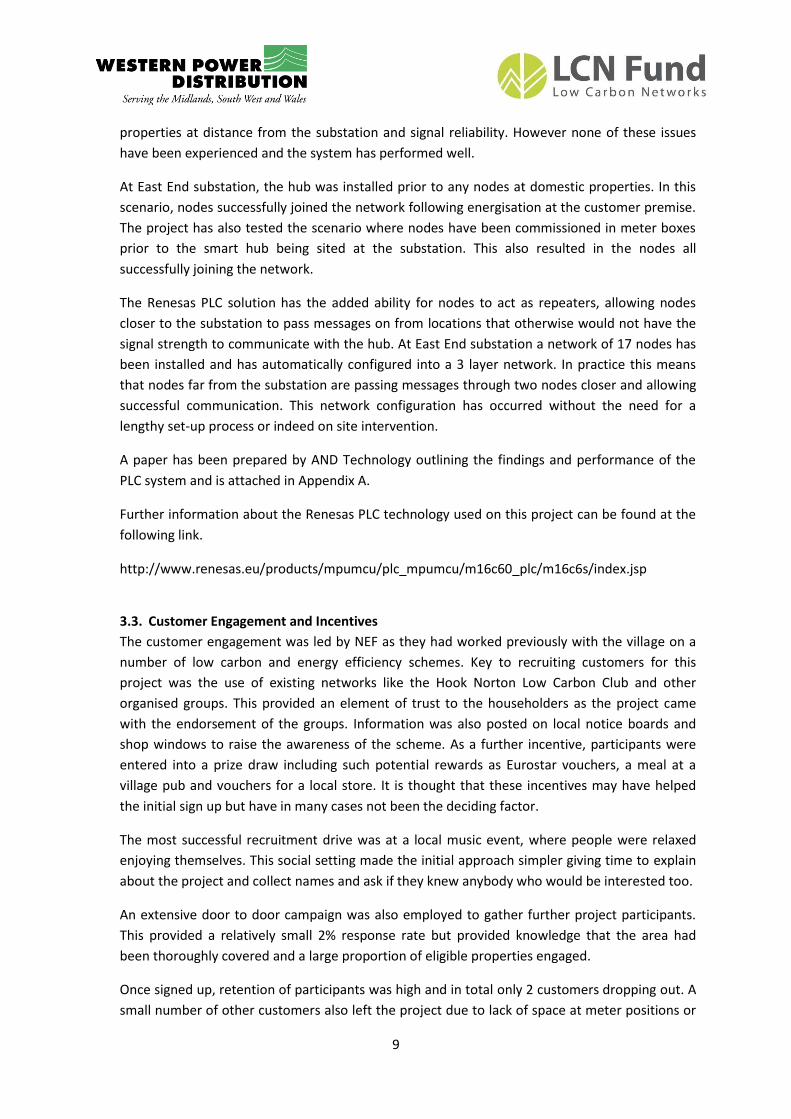
Figure 5 | Scope plot of a message being received (Rx) by the East End Smart Hub from a Test Smart Node
[15/03/2012]
Figure 6 | Scope plot of the electrical noise floor at the Bourne Lane Substation [15/03/2012]

[© AND Technology Research Ltd || www.andtr.com || Smart Hooky Appendix A - Page 6 of 9 || November 2012]
Figure 7 | Scope plot of a message being sent (Tx) from the Bourne Lane Smart Hub [15/03/2012]
Figure 8 | Scope plot of a message being received (Rx) by the Bourne Lane Smart Hub from Smart Node 13169
installed in a property [15/03/2012]
[© AND Technology Research Ltd || www.andtr.com || Smart Hooky Appendix A - Page 7 of 9 || November 2012]
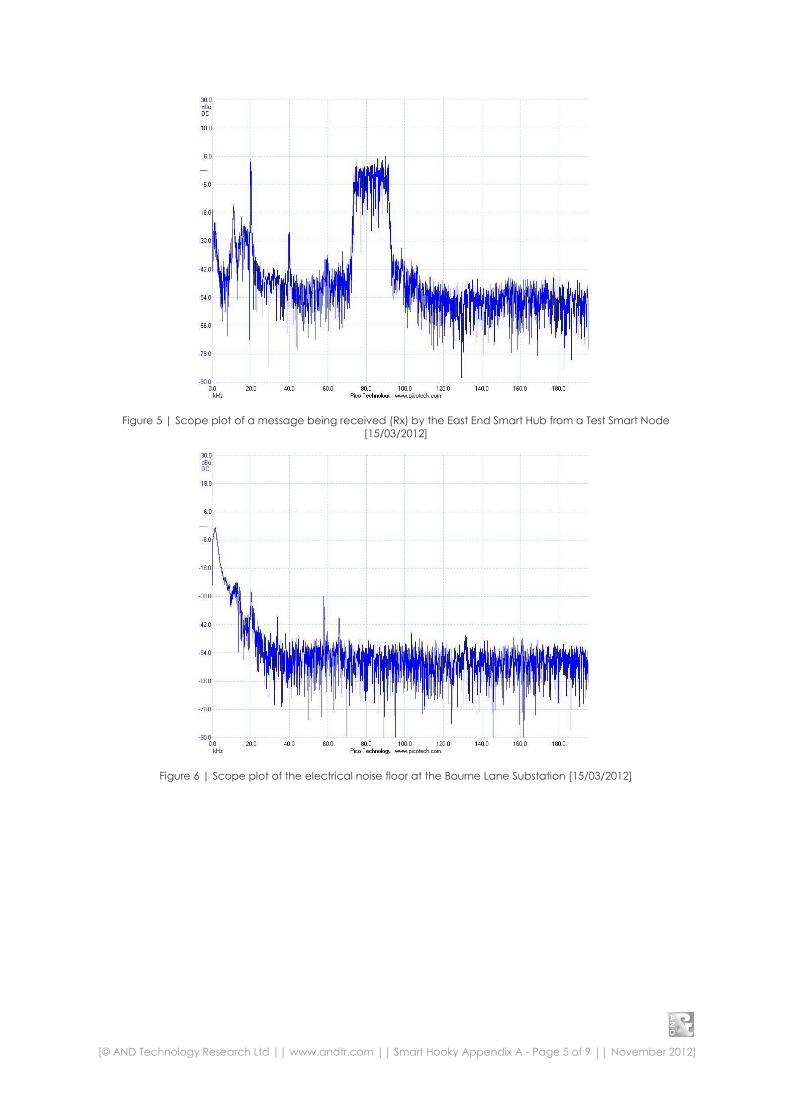
Figure 9 | Scope plot of the electrical noise floor at the Station Road Substation [15/03/2012]
Figure 10 | Scope plot of a message being sent (Tx) from the Station Road Smart Hub [15/03/2012]
[© AND Technology Research Ltd || www.andtr.com || Smart Hooky Appendix A - Page 8 of 9 || November 2012]
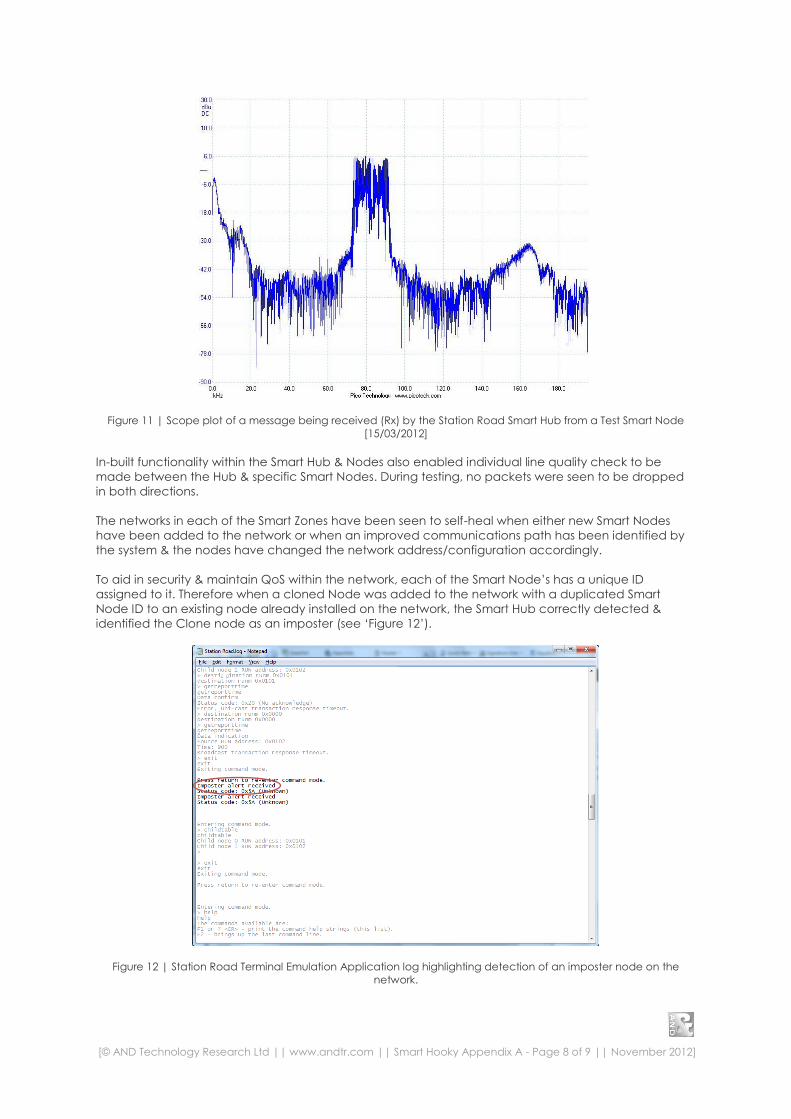
Figure 11 | Scope plot of a message being received (Rx) by the Station Road Smart Hub from a Test Smart Node
[15/03/2012]
In-built functionality within the Smart Hub & Nodes also enabled individual line quality check to be
made between the Hub & specific Smart Nodes. During testing, no packets were seen to be dropped
in both directions.
The networks in each of the Smart Zones have been seen to self-heal when either new Smart Nodes
have been added to the network or when an improved communications path has been identified by
the system & the nodes have changed the network address/configuration accordingly.
To aid in security & maintain QoS within the network, each of the Smart Node’s has a unique ID
assigned to it. Therefore when a cloned Node was added to the network with a duplicated Smart
Node ID to an existing node already installed on the network, the Smart Hub correctly detected &
identified the Clone node as an imposter (see ‘Figure 12’).
Figure 12 | Station Road Terminal Emulation Application log highlighting detection of an imposter node on the
network.

[© AND Technology Research Ltd || www.andtr.com || Smart Hooky Appendix A - Page 9 of 9 || November 2012]
4 | Future
The technology ‘blocks’ from AND, that the Smart Hub & Nodes are based upon, are being developed
to include new features & functionality to enable further integration into the Smart Grid/Electrical Asset
Monitoring fields & to provide increased quality of service & demand management monitoring
capabilities.
Along with these extra capabilities & increased functionality, additional data security features are
being added.