leachate characterization and assessment of groundwater ... · leachate characterization and...
TRANSCRIPT

1
Leachate Characterization and assessment of groundwater pollution near municipal solid waste landfill site
Suman Mor
a*, Khaiwal Ravindra
b, R. P. Dahiya
a and A. Chandra
a
aCentre for Energy Studies, Indian Institute of Technology Delhi, Hauz Khas, New
Delhi-110016, India bMicro and Trace Analysis Centre, Department of Chemistry, University of
Antwerp, Universiteitsplein 1, B-2610 Antwerp, Belgium
Abstract
Leachate and groundwater samples were collected from Gazipur landfill-site and
its adjacent area to study the possible impact of leachate percolation on groundwater
quality. Concentration of various physico-chemical parameters including heavy metal
(Cd, Cr, Cu, Fe Ni, Pb and Zn) concentration and microbiological parameters {total
coliform (TC) and faecal coliform (FC)} were determined in groundwater and leachate
samples. The moderately high concentrations of Cl-, NO3
-, SO4
2-, NH4
+, Phenol, Fe, Zn
and COD in groundwater, likely indicate that groundwater quality is being significantly
affected by leachate percolation. Further they proved to be as tracers for groundwater
contamination. The effect of depth and distance of the well from the pollution source was
also investigated. The presence of TC and FC in groundwater warns for the groundwater
quality and thus renders the associated aquifer unreliable for domestic water supply and
other uses. Although some remedial measures are suggested to reduce further
groundwater contamination via leachate percolation, the present study demand for the
proper management of waste in Delhi.
Keywords: Solid waste; landfill; leachate; groundwater contamination; health risk;
tracer; remedial measure.
*Corresponding author: Suman Mor; e-mail: [email protected]
2
Introduction
Landfills have been identified as one of the major threats to groundwater
resources (Fatta et al., 1999; USEPA, 1984;). Waste placed in landfills or open dumps
are subjected to either groundwater underflow or infiltration from precipitation. The
dumped solid wastes gradually release its initial interstitial water and some of its
decomposition by-products get into water moving through the waste deposit. Such liquid
containing innumerable organic and inorganic compounds is called ‘leachate’. This
leachate accumulates at the bottom of the landfill and percolates through the soil.
Areas near landfills have a greater possibility of groundwater contamination
because of the potential pollution source of leachate originating from the nearby site.
Such contamination of groundwater resource poses a substantial risk to local resource
user and to the natural environment The impact of landfill leachate on the surface and
groundwater has given rise to a number of studies in recent years (Saarela, 2003; Abu-
Rukah and Kofahi, 2001; Looser et al., 1999; Christensen.et al., 1998; De Rosa et al.,
1996; Flyhammar, 1995). Many approaches have been used to assess the contamination
of underground water. It can be assessed either by the experimental determination of the
impurities or their estimation through mathematical modeling (Moo-Young et al., 2004;
Hudak, 1998; Stoline et al., 1993; and Butwa et al., 1989).
In the present study, the impact of leachate percolation on groundwater quality
was estimated from an unlined landfill site at Gazipur, Delhi. Various physico-chemical
parameters including heavy metals and quality indicator microbes were analyzed in
leachate and in groundwater samples to understand the possible link of groundwater
contamination. The effect of depth and distance of landfill from groundwater sources

3
were also studied and some remedial measures were discussed to reduce further
contamination of groundwater.
Site specification
Delhi is the capital of India and sprawls over 1483 km2 at latitudes 28
o35'N and
longitude77o12'E located at an altitude of 218 m above the mean sea level. The Gangetic
Plain and the Aravalli Ridge converge at Delhi and they give a mixed geological
character with alluvial plains as well as quartzite bedrocks. The climatic regime of Delhi
belongs to the semi arid type and characterized by extreme dry conditions associated with
hot summers and cold winters. The temperature ranges between 18.7 o
C (mean minimum)
and 40.3 oC (mean maximum). It also experiences heavy rains primarily during the
periods of monsoon with an average rainfall of 714.6 mm. The groundwater level in
Delhi city varies between 15 to 20-meter depth.
Delhi, with a population approaching to 14 million is estimated to generate about
7000 metric tones of garbage daily. The per capita generation of solid waste in Delhi
ranging from 150 gms to 600 gms a day depending upon the economic status of the
community involved and it mainly includes waste from household, industries and medical
establishments.
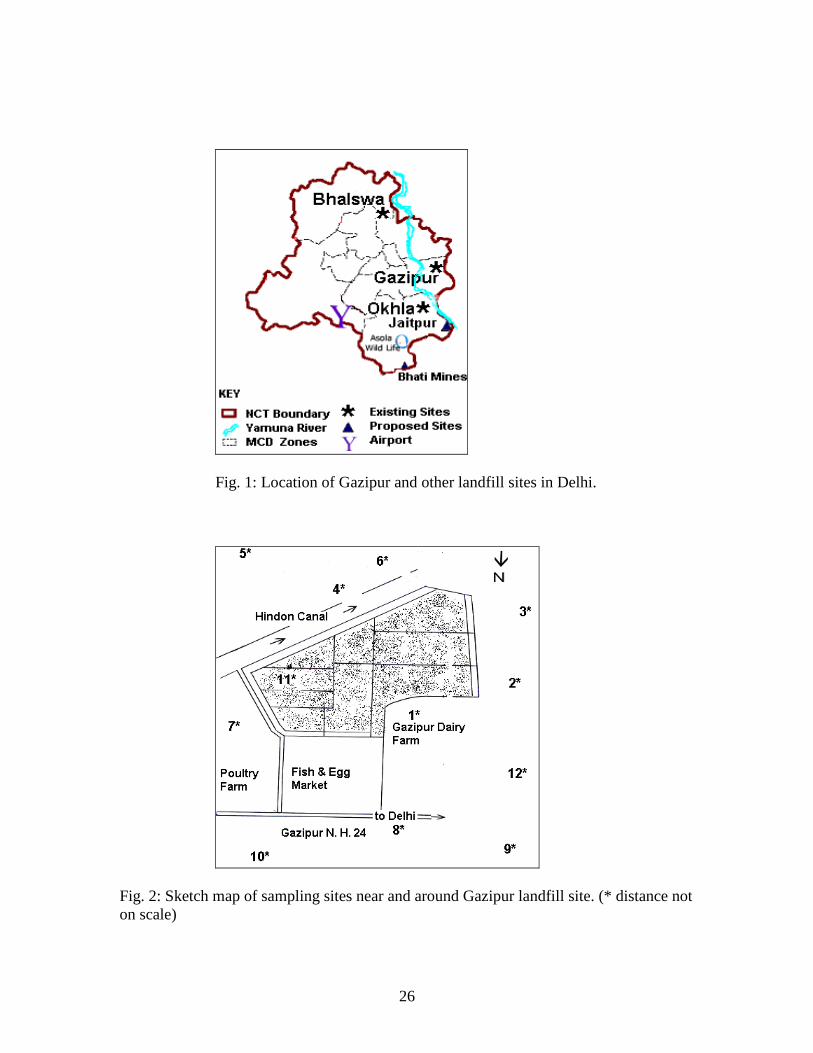
The earliest landfill was started in Delhi in 1975 near Ring road. In 1978 two
other landfills were started at Timarpur and Kailash Nagar. Till date 17 landfill sites have
been filled and closed. At present there are three large functioning landfill sites at
Ghazipur, Okhla and Bhalswa (Fig. 1). These sites are spread over an area of about 1.5 x
106 m
2. None of their bases is lined, which may result in continuous groundwater
contamination. These sites had not been designed systematically before being used for
4
disposal /dumping of waste. Furthermore no environmental impact assessment had been
carried out prior to selection of these sites.
Gazipur Landfill Site
The Gazipur landfill started in the year 1984 and still in use. It spreads over an
area of approximately 3 x 10⁵ m
2 and situated near National Highway 24. On an average
2200 MT/day of waste is dumped and the waste fill height varies from 12 m to 20 m. It is
located at the close proximity of the Hindon Canal. The waste dumped at this site
includes domestic waste, e.g. kitchen waste; paper, plastic, glass, cardboard, cloths.
Construction and demolition waste consisting of sand, bricks and concrete block are also
dumped. Further waste from the adjacent poultry market, fish market, slaughterhouse,
dairy farm and non-infectious hospital waste is also dumped.
The site is non-engineered low lying open dump, looks like a huge heap of waste
up to a height of 12-20 m. Trucks from different parts of the city collect and bring waste
to this site and dump the waste in irregular fashion. The waste is dumped as such without
segregation, except the rag pickers who rummage through the garbage and help in
segregating it. They generally collect glass material, plastic and metals and sell this to the
recycling units (Aggarwal et al., 2005). At this landfill site two water bore wells are
operational, which are used for washing of refuse removal vehicles and maintenance of
heavy earth moving equipments.
Experimental
Sampling of leachate and groundwater
In an effort to study the extent of the groundwater contamination 12 sampling
sites were selected within 1.5 km of landfill site from where the samples were taken (Fig.
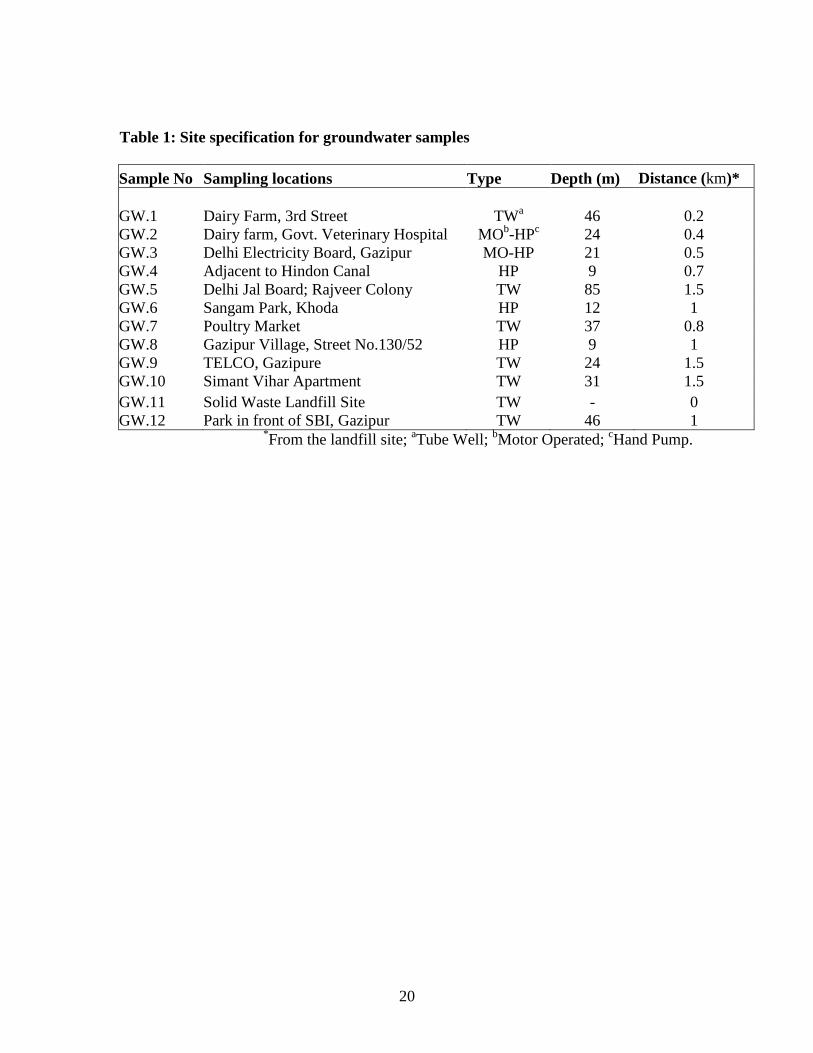
2). Details of the sampling points are presented in Table 1. The samples were collected
5
after the extraction of water either from hand pump or from tube well in September 2003.
The water was left to run from the source for about 4 min to equate the minimum number
of well volume and to stabilize the electrical conductivity (EC). Since the landfill site was
not equipped with a leachate collector, the leachate collected at the base of the landfill
was sampled randomly from three different locations and were mixed prior to its analysis.
Analytical methods
After the sampling, the samples were immediately transferred to the lab and were
store in cold room (4 oC). The analysis was started without delay in lab based on the
priority to analyze parameters as prescribed by APHA (1994) methods. All the samples
were analyzed for selected relevant physico-chemical parameters, heavy metals and total
coliform (TC) and faecal coliform (FC) according to internationally accepted procedures
and standard methods (APHA, 1994) Various physico-chemical parameters examined in
groundwater samples includes, pH, electrical conductivity (EC), total dissolved solids
(TDS), total dissolved volatile solids (TDVS), fixed dissolved solids (FDS), chemical
oxygen demand (COD), biological oxygen demand (BOD), total alkalinity (TA), total
hardness (TH), calcium (Ca2+
), magnesium (Mg2+
), sodium (Na+), potassium (K
+),
ammonia (NH4+), chloride (Cl
-), fluoride (F
-), sulphate (SO4
2-), nitrate (NO3
-), nitrite
(NO2-), phosphate (PO4
3-), boron ( B), silica (Si) and phenol. EC and pH were recorded
using a Systronics conductivity meter, mode 306 and µ pH system 361(Systronics).
TDVS and FDS were estimated by using oven-drying method. Estimation of COD was
done by reflux titrimetry, while BOD was calculated by oxygen determination by
Winkler titration. TA, TH, Ca2+
, Mg2+
and Cl- were estimated by titrimetry, Na
+ and K
+
by flame photometry (Systronic-128). Estimation of F- by SPADNS, PO4
3- by
molybdenum–blue complex formation using spectrophotometer (Systronic 20D+), while
6
SO42-
, NO3-, NH4
+, NO2
-, B, Si and phenol were also determined by using either the same
spectrophotometer or by Perkin-Elmer UV/VIS Lambda 2 spectrophotometer. The
concentrations of cadmium (Cd), copper (Cu), chromium (Cr), iron (Fe), nickel (Ni), lead
(Pb) and zinc (Zn) were determined using a SpectrAA-20 (Varian) atomic absorption
spectrometer. The limit of detection (LOD) of these elements were 0.02, 0.03, 0.06, 0.03,
0.1, 0.1, and 0.01 mg l-1
, respectively. Samples for TC and FC were aseptically taken
from the wells and their estimation was done by membrane filtration technique.
All the experiments were carried out in triplicate and the results were found
reproducible within ± 3% error. The data were statistically analyzed by setting up and
calculating a correlation matrix for the various parameters using Statistical Package for
Social Sciences (SPSS) software package (Norusis and SPSS Inc, 1997).
Results and Discussion
Leachate
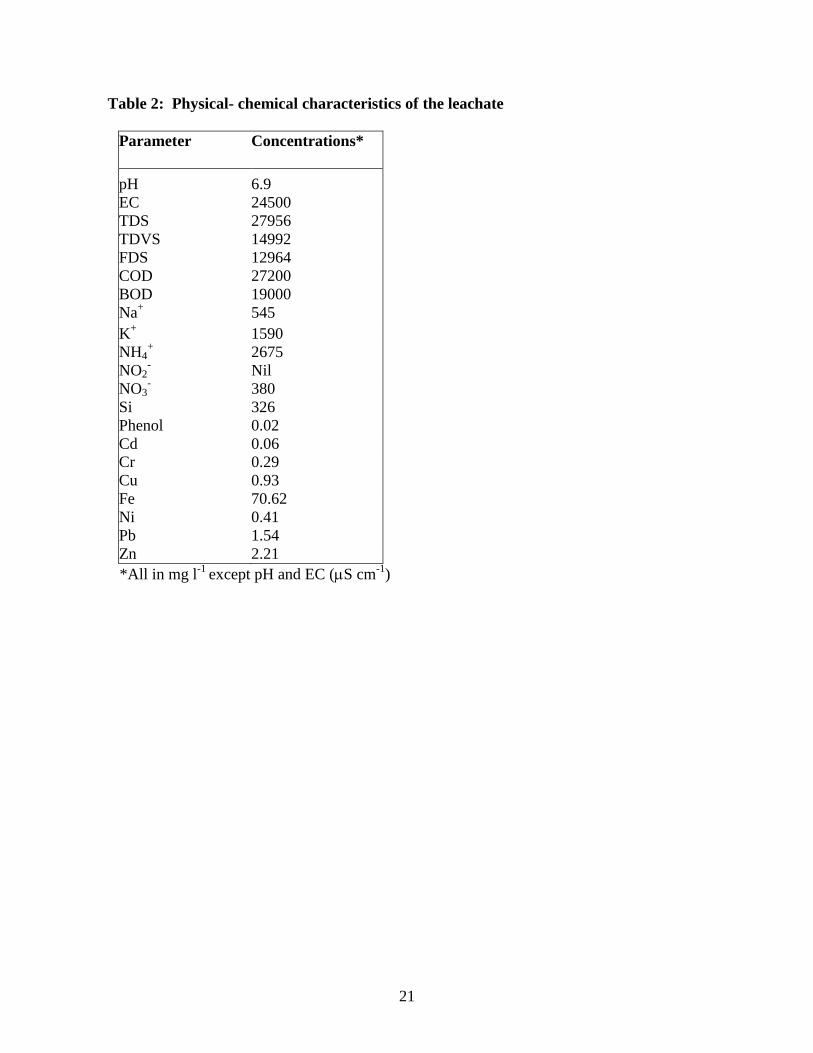
Physico-chemical characteristics of the leachate depend primarily upon the waste
composition and water content in total waste. The characteristics of the leachate samples
collected from the Gazipur landfill site has been presented in Table 2. The pH value of
the collected sample was found to be 6.9. The relatively high values of EC (24500 µScm-
1) and TDS (27956 mg l
-1) indicate the presence of inorganic material in the samples. The
presence of high BOD (19000 mg l-1
) and COD (27200 mg l-1
) indicates the high organic
strength. Among the nitrogenous compound, ammonia nitrogen (2675 mg l-1
) was present
in high concentration, this is probably due to the deamination of amino acids during the
decomposition of organic compounds (Crawford and Smith, 1985; Tatsi and Zouboulis,
2002). High concentrations of NO3- (380 mg l
-1) and Si (326 mg l
-1) were also observed in
the leachate samples.
7
The high level of Fe (70.62 mg l-1
) in the leachate sample indicates that Fe and
steel scrap are also dumped in the landfill. The dark brown color of the leachate is mainly
attributed to the oxidation of ferrous to ferric form and the formation of ferric hydroxide
colloids and complexes with fulvic/ humic substance (Chu, et. al., 1994). The presence of
Zn (2.21 mg l-1
) in the leachate shows that the landfill receives waste from batteries and
fluorescent lamps. The presence of Pb (1.54 mg l-1
) in the leachate samples indicates the
disposal of Pb batteries, chemicals for photograph processing, Pb-based paints and pipes
at the landfill site (Moturi et al., 2004; Mor et al., 2005). Cr (0.29 mg l-1
), Cu (0.93 mg l-1
)
and Ni (0.41 mg l-1
) were also present in the leachate samples. A variety of waste is
dumped at Gazipur landfill site, which likely indicate the origin of Zn, Pb, Cr, Cu and Ni
in leachate (Moturi et al., 2004; Mor et al., 2005). Christensen et al., 1994 have also
reported the presence of these compounds in leachate.
Groundwater
Physico-chemical Characteristics
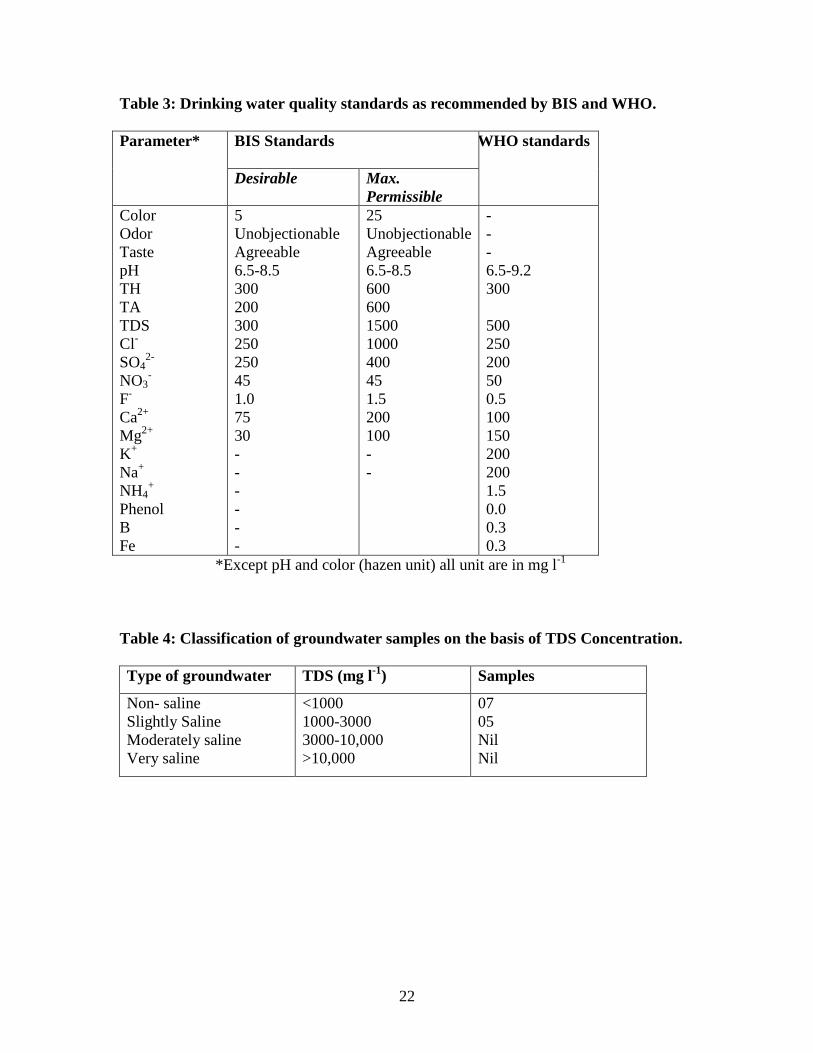
The underground water of the studied area is used for domestic and other
purposes. Table 3 shows the desirable and maximum permissible limit recommended by
Bureau of Indian Standard (BIS, 1991) and World Health Organization (WHO, 1997).
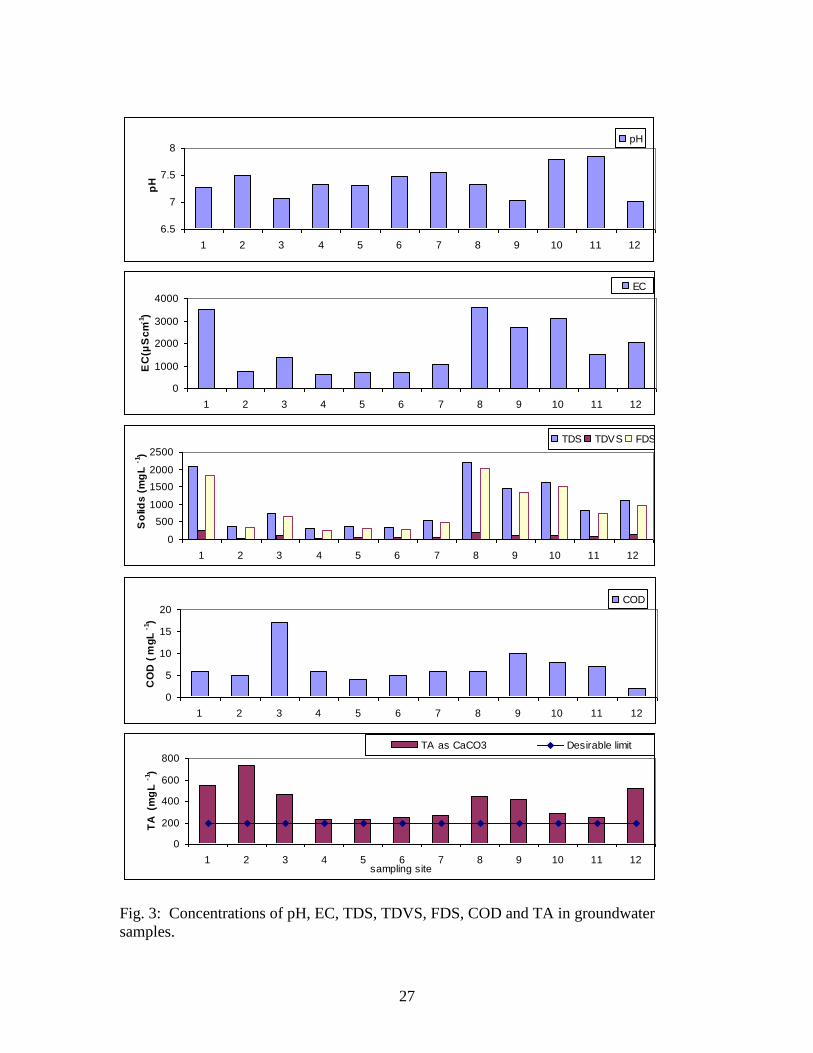
The pH of all the groundwater samples was about neutral, the range being 7.02 to 7.85
(Fig. 3). The EC is a valuable indicator of the amount of material dissolved in water. The
EC in the studied area range between 617 and 3620 µS cm-1
and was found to be high,
especially at sites 1, 3, 8, 9, 10, 12 (Fig. 3). These high conductivity values obtained for
the underground water near the landfill is an indication of its effect on the water quality.
TDS indicates the general nature of water quality or salinity. The range of TDS at all sites
falls in between 302 and 2208 mg l-1
(Fig. 3). The TDS concentration was found to be
8
remarkably high at sites 1,8,9,10 and 12. As per the classification of Rabinove et al.,
(1958) based on TDS, seven samples were non-saline and five samples were slightly
saline (Table 3). This high value of TDS may be due to the leaching of various pollutants
into the groundwater. Olaniya and Saxena (1977) also reported the groundwater
pollution from refuse in the vicinity of the dumping sites detectable through increased
TDS concentration of water. The high concentrations of TDS decrease the palatability
and may cause gastro-intestinal irritation in human and may also have laxative effect
particularly upon transits (WHO, 1997). TDVS in the water samples ranged from 36 to
268 mg l-1
and the concentration of FDS in the samples varied from 264 to 2008 mg l-1
(Fig. 3). COD is a measure of oxygen equivalent to the organic matter content of the
water susceptible to oxidation by a strong chemical oxidant and thus is an index of
organic pollution. The COD level in the groundwater samples varied from 2 to17 mg l-1
,
indicating the presence of organic contaminants in the water (Fig. 3) and can be used as
organic indicators to assess the groundwater pollution caused by landfill.
The concentration of TA as CaCO3 in groundwater ranges from 230 to 734 mg l-1
(Fig. 3). Water within the approximate pH range of 4.3 to 8.3 contain bicarbonate
alkalinity and weak acids such as carbonic acid (carbon dioxide in solution) can also
exist. Natural processes such as the dissolution of carbonate minerals and dissolution of
CO2 gas from the atmosphere and soils could be a mechanism, which supply HCO3- into
the groundwater:
CaCO3+CO2+H2O Ca2+
+2HCO3 (1)
CO2+H2O H++HCO3
- (2)
In addition, anthropogenic CO2 gas should be considered as a potential source of
bicarbonate in groundwater. Potential sources of CO2 gas are (a) CO2 gas originating
9
from municipal wastes within unlined landfill sites, (b) CO2 gas due to the oxidation of
organic materials leaked from old latrines and sewage systems in the downtown area, and
(c) HCO3- from sulfate reduction of organic materials in the aquifer (Clark
and Fritz,
1997).
CH2O+O2 CO2+H2O (3)
2CH2O +SO42-
H2S+2HCO3- (4)
The high alkalinity imparts water with unpleasant taste, and may be deleterious to
human health with high pH, TDS and TH.
Multivalent cations, particularly Mg2+
and Ca2+
are often present at a significant
concentration in natural waters. These ions are easily precipitated and in particular react
with soap to make it difficult to remove scum. TH is normally expressed as the total
concentration of Ca2+
and Mg2+
in mg l-1
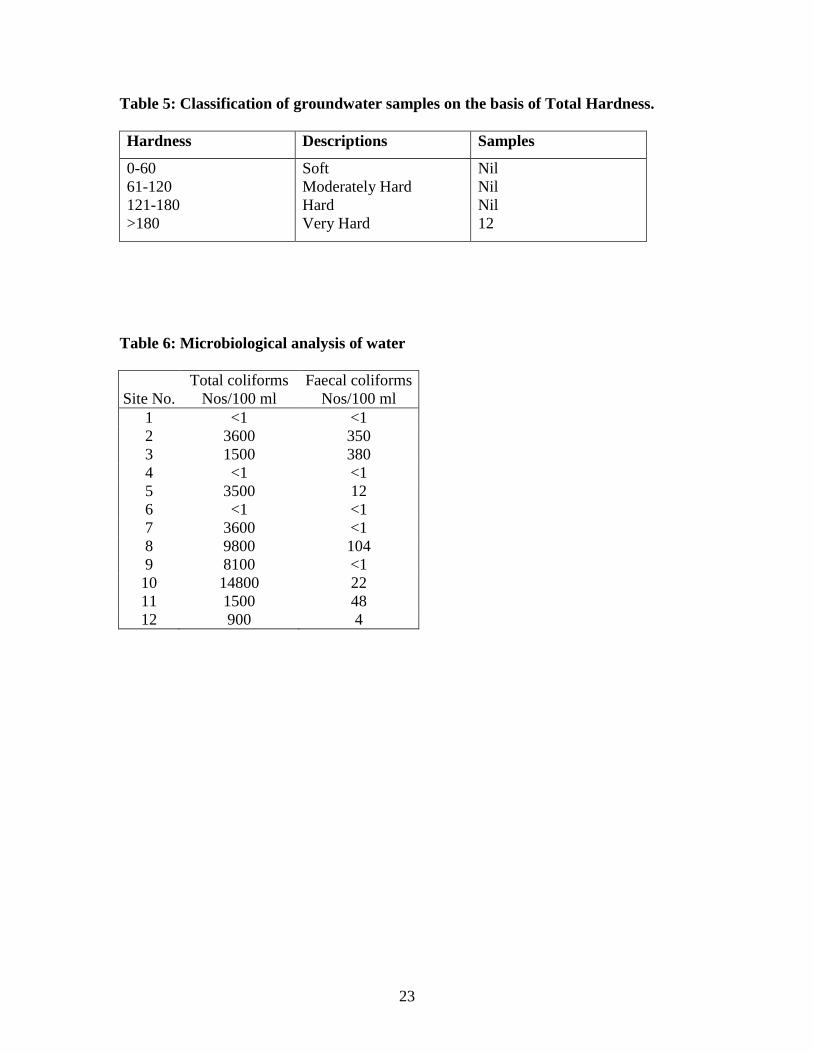
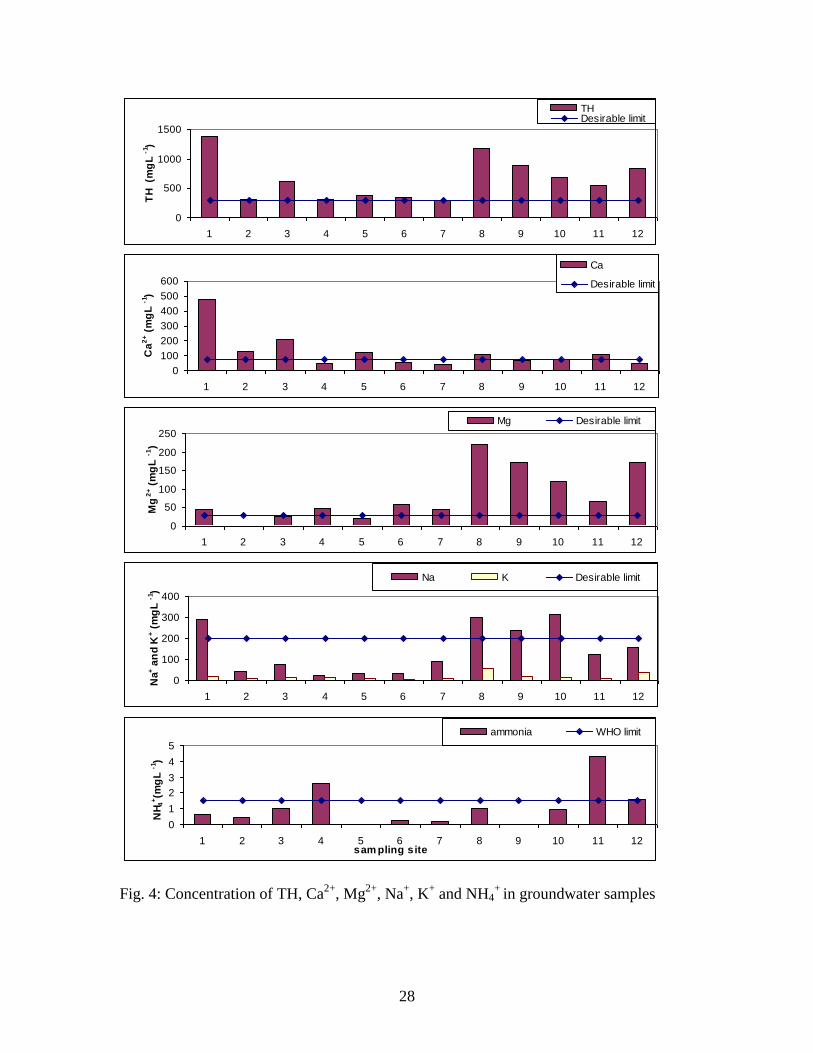
, equivalent CaCO3. TH ranged from 296 to
1388 mg l-1
(Fig. 4). According to the classification of Durfor and Becker (1964) for TH
a very hard groundwater dominantly distributed in the studied area (Table 5). Ca2+
and
Mg2+
are the important parameters for total hardness. Ca2+
concentration in groundwater
ranged from 43 to 477 mg l-1
(Fig. 4). Ca2+
often comes from carbonate-based minerals,
such as calcite and dolomite. Ca2+
and SiO2 may also come from the dissolution of
concrete in streets and the side walks. The concentration of Ca2+
found to be very high in
samples from site 1 and 3. The excess of Ca2+
causes concretions in the body such as
kidney or bladder stones and irritation in urinary passages. The concentration of Mg2+
ions varied from non-detectable (nd) to 220 mg l-1
(Fig. 4). Mg2+
salts are cathartic and
diuretic and high concentration may cause laxative effect, while deficiency may cause
structural and functional changes. It is essential as an activator of many enzyme systems
(WHO, 1997). The concentration of Na+ in water samples varied from 22 to 313 mg l
-1
10
(Fig. 4). The high concentration of Na+ may pose a risk to persons suffering from cardiac,
renal and circulatory disease. K+ has been reported to be an indication of the leachate
effect (Ellis, 1980). The concentration of K+ in the water samples varied from 6 to 56 mg
l-1
and was found to be well within the permissible limit at Gazipur (Fig. 4). The NH4+
concentration in the samples ranged from nd to 4.3 mg l-1
(Fig. 4) and likely indicate its
origin from leachate.
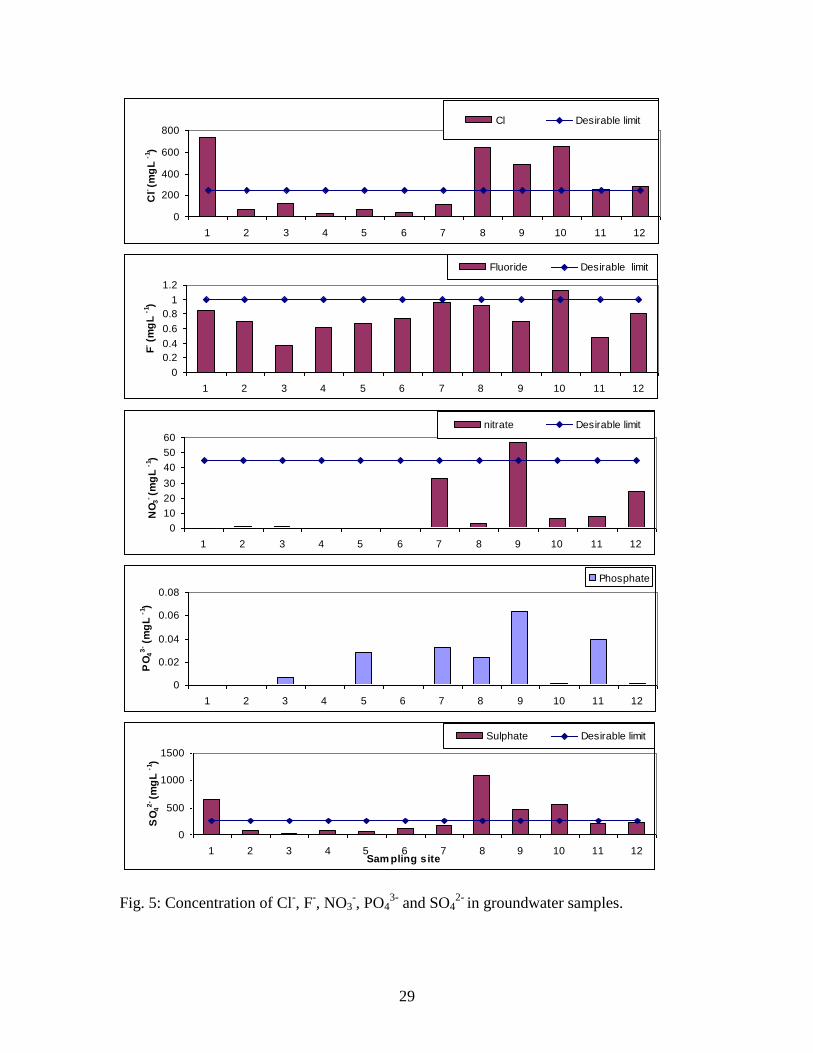
An excess of Cl- in water is usually taken as an index of pollution and considered
as tracer for groundwater contamination (Loizidou and Kapetanios, 1993). The
concentration of Cl- the groundwater samples ranged between 28 mg l
-1 to 737 mg l
-1. At
sites 8 and 10, the chloride concentration was found to be comparatively high (Fig. 5).
High Cl- content of groundwater is likely to originate from pollution sources such as
domestic effluents, fertilizers, and septic tanks, and from natural sources such as rainfall,
the dissolution of fluid inclusions. Increase in Cl- level is injurious to people suffering
from diseases of heart or kidney (WHO, 1997).
The concentration of F- in the studied water samples ranged from 0.37 to 1.13 mg
l-1
and found to be slightly high in sample at site 10 (Fig. 5). F- at low concentration (~1
mg l-1
) in drinking water has been considered beneficial but high concentration may
causes dental fluorosis (tooth mottling) and more seriously skeletal fluorosis (Ravindra
and Garg, 2005). The concentration of NO3- in water sample varied from nd to 56 mg l
-1
(Fig. 5).
Although only one sample (site 9) exceeds the permissible limit but it shows a
moderately high concentration. Jawad et al. (1998), have also reported increase in NO3-
concentration in groundwater due to wastewater dumped at the disposal site and likely
indicate the impact of leachate. The concentration of NO2- varied from nd to 0.56 mg l
-1.
PO43-
in the water sample was well below the permissible limit and the concentration
11
varied from nd to 0.06 mg l-1
(Fig. 5). Concentration of SO42-
in water sample ranged
from 12 to 1096 mg l-1
and was significantly high at sites 1, 8 and 10 (Fig. 5).
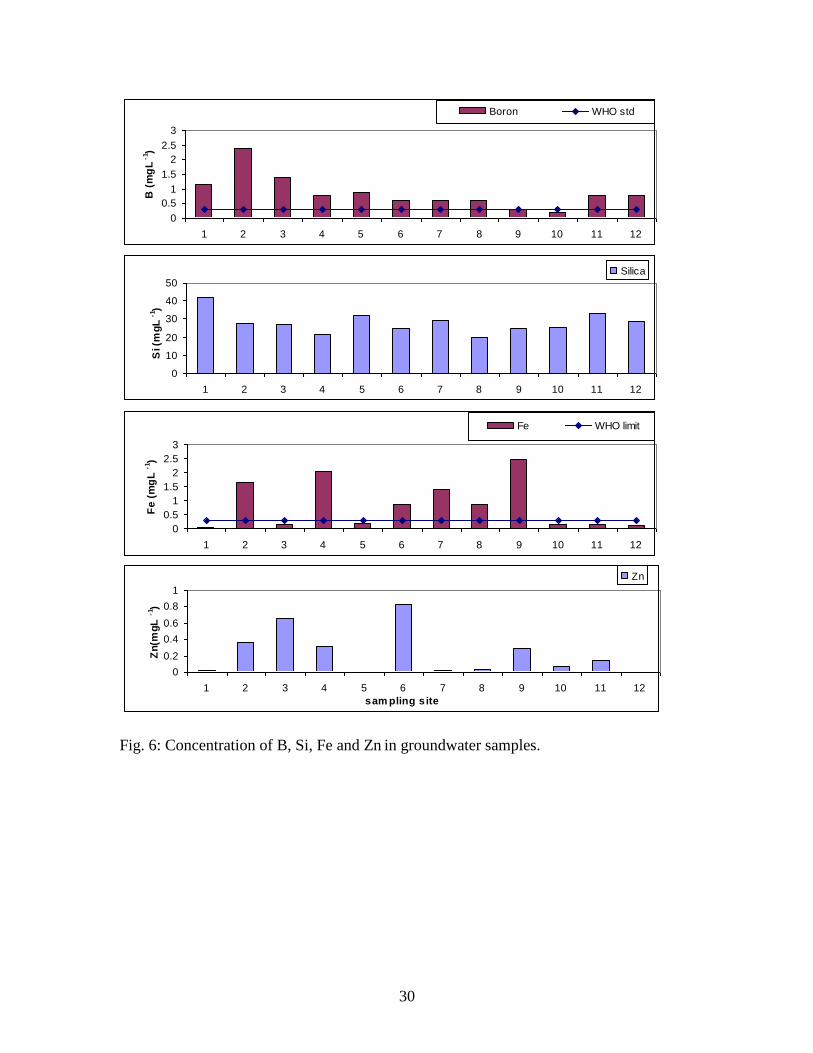
Concentration of B varied from 0.2 to 2.4 mg l-1
(Fig. 6). The presence of Si in
water sample varied from 19.6 to 42.4 mg l-1
(Fig. 6). A very low concentration of
phenol was also observed in water samples and its concentration varied from nd to 0.1
mg l-1
, which further support that groundwater near landfill site is being significantly
affected by leachate percolation.
Heavy Metals
The groundwater samples were analyzed for heavy metal such as Cu, Fe and Zn,
which are characterized as undesirable metals in drinking water. WHO (1997) has
proposed their permissible value of 1, 0.3 and 5 mg l-1
respectively in drinking water.
Only Fe and Zn showed their presence in groundwater samples above the LOD of the
present analytical method. Fe concentration in the water samples varied from 0.04 to 2.48
mg l-1
(Fig. 6) and found well above the WHO permissible limit in many samples.
Presence of Fe in water can lead to change of color of groundwater (Rowe et al., 1995).
The concentration of Zn varied from nd to 0.8 mg l-1
(Fig. 6). The metals Pb, Cd, Cr and
Ni are characterized as toxic one for drinking water. The concentration of these metal was
found to be below detection limit in groundwater samples. This likely indicates that these
metal may be adsorbed by the soil strata or by the organic matter in soil.
Heavy metals remain in the waste or at the waste–rock interface as a result of
redox controlled precipitation reactions (Yanful et al., 1988). Further the metal mobility
is also controlled by physical sorptive mechanisms and landfills have an inherent in situ
capacity for minimizing the mobility of toxic heavy metals (Pohland et al., 1993). This
12
fixing of heavy metals reduces the risk of direct toxic effects due to ingestion of leachate
contaminated groundwater.
However, once the leachate leaves the site the situation changes. The leachate is
generally a strongly reducing liquid formed under methanogenic conditions and on
coming into contact with aquifer materials has the ability to reduce sorbed heavy metals
in the aquifer matrix. The most important reactions are the reduction of Fe and Mn to
more soluble species. Hence the concentration of these components increases under
favorable conditions close to a landfill and may lead to a serious toxic risk.
Microbial contamination
The difficulty of detecting low concentration of pathogenic bacteria and viruses,
coliform bacteria are used to determine the faecal contamination. The concept of
coliforms as bacterial indicator of microbial water quality is based on the premise that
coliforms are present in high numbers in the faeces of humans and other warm-blooded
animals. If faecel pollution has enters in groundwater; it is likely that these bacteria will
be present, even after significant dilution. Table 6 shows the presence of TC and FC in
most samples, indicating the contamination of groundwater possibly due to leachate
percolation in groundwater. The presence of faecal contamination is an indicator that a
potential health risk exists for individual exposed to this water.
The coliform bacteria can multiply where leachate enters an oxygenated system.
Klink and Stuart, 1999 found that when leachate was diluted with the bacteria-free
groundwater there was an increase in the number of thermotolerant coliform and the
bacteria were able to survive for up to two weeks under laboratory conditions.
13
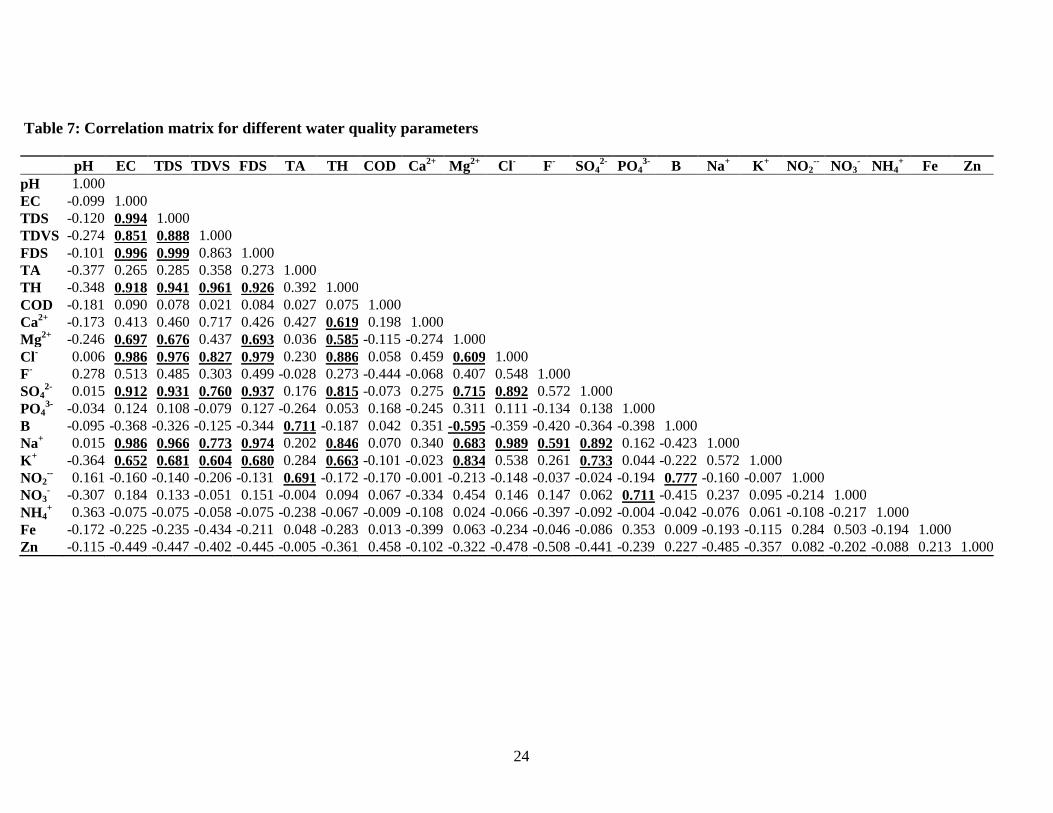
Correlation analysis
Correlation analysis is a preliminary descriptive technique to estimate the degree
of association among the variables involved. The purpose of the correlation analysis is to
measure the intensity of association observed between two variables. Such association is
likely to lead to reasoning about causal relationship between the variables. Correlation
matrix between various parameters is shown in table 7.
Most of the parameters were found to bear statistically significant correlation with
each other indicating close association of these parameter with each other. TDS had a
strong correlation with a number of parameters like TH, Mg2+
, Cl-, SO4
2-, Na
+, and K
+
indicates the high mobility of these ions. Thus the single parameter of TDS can give a
reasonable good indication of a number of parameters (Ravindra et al., 2003).
Total hardness was found to be positively correlated with Ca2+
, Mg2+
, Cl-, SO4
2-,
Na+ and K
+. Mg
2+ found to be negatively correlated with B, but positively correlated with
SO42-
, Na+ and K
+. An excellent correlation value of Na
+ with Cl
- and SO4
2- indicate that
the main water type in the sample is Na-Cl and Na-SO4.
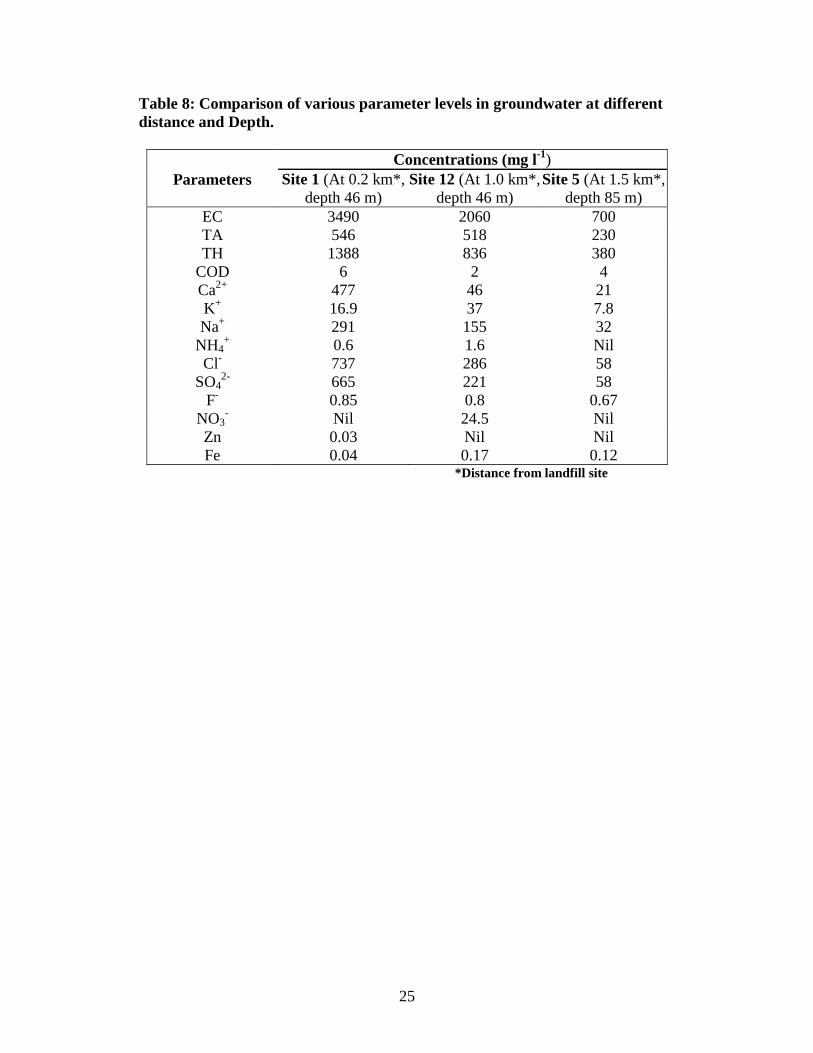
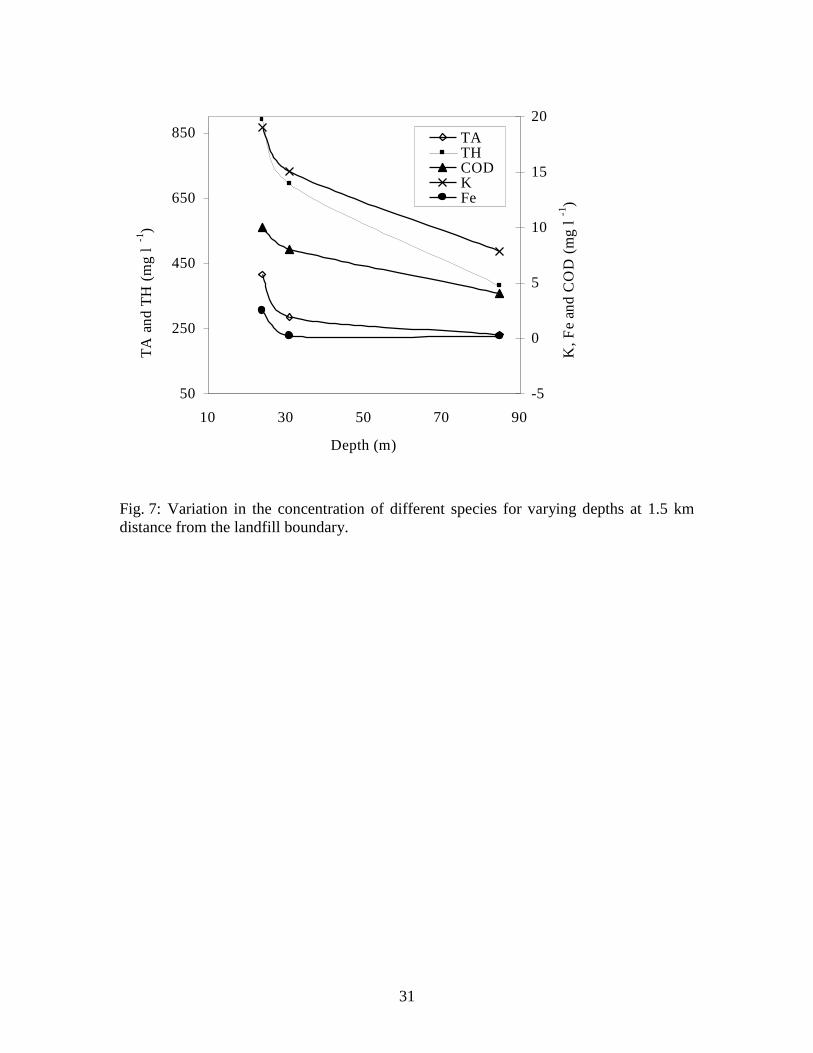
Effect of depth and distance
The extent of contamination of groundwater quality due to leachate percolation
depends upon a number of factors like leachate composition, rainfall, depth and distance
of the well from the pollution source, the landfill site in the present case. Water samples
collected from different depths and distances were analyzed for this study. Fig. 7 shows
that the concentrations of various species in the groundwater samples for equal distance
of 1.5 km from the landfill site boundary at varying depth. Interestingly the water
contamination drops fast with depth up to 30 m and further percolation of leachate
14
becomes gentler. However, this aspect needs further investigations by drilling more wells
of varying depths for having a proper correlation between time and percolation depth.
Similarly when the water quality of the wells situated at different distances from the
landfill site but having the same depth was compared (Table 8, see site 1 and 12). Water
sampled from the well situated close to the landfill site was found to be more
contaminated than that of the well situated farther away. It obviously follows from the
fact that the gravitational movement of the viscous fluid, leachate is hindered due to the
mass of the solid soil matter. With increasing time the viscous fluid penetrates deeper and
spread all over a longer distance. A combined effect of distance and depth can also be
assessed from Table 8 (site 1 and 5), which again confirms the above discussion.
Although increased levels of few pollutants in groundwater may also be contributed by
some near by activity such as cattle and poultry farming around the landfill.
Strictly speaking one should avoid using groundwater drawn from the wells located
in proximity of the waste dumping sites. If this is unavoidable, deeper drilling and
frequent analysis of water samples are desirable. Efforts should be made to supply clean
water through pipelines from distant sources.
Remedial Measures for the Groundwater Pollution
From the groundwater monitoring it is clearly evident that the leachate generated
from the landfill site is affecting the groundwater quality in the adjacent areas through
percolation in the subsoil. Therefore, some remedial measures are required to prevent
further contamination. This can be achieved by the management of the leachate generated
within the landfill. Leachate management can be achieved through effective control of
leachate generation, its treatment and subsequent recycling throughout the waste.

15
Engineered landfill sites are generally provided with impermeable liner and
drainage system at the base of the landfill, which will not allow leachate to percolate into
subsoil. All the leachate accumulated at the base of the landfill can be collected for
recycling or treatment. This collected leachate can be distributed throughout the waste by
means of spraying the leachate across the landfill surface. Some of the water may be lost
through evaporation and therefore leading to reduction in the volume of the leachate for
ultimate treatment.
Techno economic feasibility studies should be carried out for choosing the options
for a landfill site. Retrofitting techniques for the existing, old sites, like Gazipur, would
be cumbersome and expensive. At and around this site water supply drawn from safe,
distant sources should be the first option. Gazipur site will soon be closed for MSW
disposal since it has already received waste beyond its capacity. Remedial measures
should be considered by taking this into account.
Gazipur landfill site is non-engineered landfill. It is neither having any bottom liner
nor any leachate collection and treatment system. Therefore, all the leachate generated
finds its paths into the surrounding environment. In such conditions only feasible options
that could be followed are:
(i) Limiting the infiltration of the water through the landfill cover by providing
impermeable clay cover. Due to this less water will enter and subsequently
less leachate will be generated, thereby reducing the amount of leachate
reaching the landfill base.
(ii) Extraction of the leachate collected at the base can be done and it can be
recycled, so that less amount will enter the aquifer lying below.
16
(iii) Increasing the evapo-transpiration rate by providing vegetation cover over the
landfill can also reduce leachate production.
Conclusions
The moderately high concentration of EC, TDS, Cl-, SO4
2-, NO3
-, Na
+ and Fe etc.
in groundwater near landfill deteriorates its quality for drinking and other domestic
purposes. Further, the presence of Cl-, NO3
-, NH4
+, Phenol and COD can be used as tracer
with relation to leachate percolation. The samples were also found to be bacteriological
unsafe. As there is no natural or other possible reason for high concentration of these
pollutants, it can be concluded that leachate has significant impact on groundwater
quality near the area of Gazipur landfill site. The groundwater quality improves with the
increase in depth and distance of the well from the pollution source. Although, the
concentrations of few contaminants do not exceed drinking water standard even then the
ground water quality represent a significant threat to public health. Some remedial
measures are also recommended to stop further groundwater contamination.
Acknowledgements
The authors acknowledge Dr. Makhijani for giving permission to work in wastewater lab,
CPCB, New Delhi and Mr. J.K. Bhatia for analytical assistance. SM and KR also thanks
to Dr. Alex de Visscher and Dr László Bencs.
17
References
Abu- Rukah, Y. and O. Al- Kofahi, 2001. The assessment of the effect of landfill leachate
on ground-water quality—a case study. El-Akader landfill site—north Jordan , Arid
Environ. 49, 615-630.
Agarwal, A., Singhmar, A., Kulshrestha, M., and A. K., Mittal, 2005. Municipal solid
waste recycling and associated markets in Delhi, India. Resource Conservation and
Recycling 44, 73-90.
APHA-AWWA-WPCF, 1994. Standard Methods for the Examination of Water and
Wastewater, 15th
Eds American Public Health Association, Washington, DC, USA.
Butow, E., Holzbecher, E. and E. Kob, 1989. Approach to Model the Transport of
Leachates from aLandfill Site including Geochemical Processes, Contaminant Transport
in Groundwater. Kobus and Kinzelbach, Balkema, Rotterdam, pp. 183–190.
Bureau of Indian Standards (BIS), 1991. Indian standard specification for drinking water,
IS 10500, pp. 2-4.
Christensen, T. H., Kjeldsen, P., Albrechtsen, H.-J., Heron, G., Nielson, P. H., Bjerg, P.
L. and P.E. Holm, 1994. Attenuation of Landfill Leachate Pollutants in Aquifers. Critical
Reviews in Environ. Science and Technol. 24, 119-202.
Christensen, J. B., D. L. Jensen, C. Gron, Z. Filip and T. H. Christensen, 1998.
Characterization of the dissolved organic carbon in landfill leachate-polluted
groundwater, Water Res., 32, 125-135.
Chu, L. M., K. C. Cheung and M. H. Wong,1994. Variations in the chemical properties
of landfill leachate. Environ. Manage., 18, 105-117.
Clark I., and P. Fritz, 1997. Environmental isotopes in hydrology, Lewis Boca Ratopn,
New York.
Crawford, J. F. and P. G. Smith, 1985. Landfill Technology, pp. 84-85. Butter-Worths,
London.
DeRosa, E., Rubel, D., Tudino, M., Viale, A., and R.J. Lombardo, 1996. The leachate
composition of an old waste dump connected to groundwater: Influence of the
reclamation works. Environ. Monit. Assess. 40 (3): 239-252.
Durfor, C.N. and Becker, E. 1964. Public water supplies of the 100 largest cities in the
US. US-Geol. Sur. Water Supply Paper 1812 : 364.
Ellis, J., A 1980. Convenient parameter for tracing leachate from sanitary landfills. Water
Res., 14, 1283-1287.
18
Fatta D., A Papadopoulos and M., Loizidou, 1999. A study on the landfill leachate and
its impact on the groundwater quality of the greater area. Environ. Geochem. Health 21
(2): 175-190.
Flyhammar, P.: 1995, Leachate quality and environmental effects at active Swedish
municipal landfill, in: R. Cossu, H. T. Christensen and R. Stegmann (eds) Regulations,
EnvironmentalImpact and Aftercare. Proceedings Sardinia ’95, Fifth International
Landfill Symposium. Vol. III, Sardinia, Italy, pp. 549–557.
Hudak, P.F., 1998. Groundwater monitoring strategies for variable versus constant
contaminant loading functions. Environ. Monit. Assess. 50, 271-288.
Jawad, A., S. A. Al-Shereideh, Y. Abu-Rukah, and K. Al Qadat, 1998. Aquifer Ground
Water Quality and Flow in the Yarmouk River Basin of Northern Jordan. Environ.
Systems, 26, 265-287.
Loizidou, M., and E. Kapetanios, 1993. Effect of leachate from landfills on underground
water quality. Sci. Total Environ., 128, 69–81.
Looser, M.O., A. Parriaux, and M. Bensimon, 1999. Landfill underground pollution
detection and characterization using inorganic traces. Water Res. 33, 3609-3616.
Moo-Young, H., Johnson, B., Johnson. A., Carson, D., Lew, C., Liu, S, and K. Hancock,
2004. Characterization of infiltration rates from landfills: Supporting groundwater
modeling efforts. Environ. Monit. Assess. 96, 283-311.
Mor, S., Ravindra, K., Vischher, A. R. P. Dahiya and A. Chandra, 2005. Municipal Solid
Waste Characterisation and its assessment for potential methane generation at Gazipur
Landfill Site, Delhi: A case study. Bioresource Technology, Communicated.
Moturi, M. C. Z., Rawat, M., and V. Subramanian, 2004. Distribution and fractionation
of heavy metals in solid waste from selected sites in the industrial belt of Delhi, India.
Environ. Monit. Assess. 95, 183-199.
Norusis, M. J. and SPSS Inc., 1997. SPSS for Windows Professional Statistics 7.5,
Englewood Cliffs: Prentice Hall.
Olaniya, M. S. and K. L. Saxena, 1977. Ground water pollution by open refuse dumps at
Jaipur. Ind J. Environ. Health 19, 176-188.
Pohland, F. G., Cross, W. H. and J. P. Gould, 1993. Metal speciation and mobility as
influenced by landfill disposal practices. In: Metals in Groundwater (edited by Allen, H.
E., Perdue, E. M. and Brown, D. S.). Lewis Publishers, Boca Raton, 411-429.
Rabinove C. J., R. H. Long Ford, and J. W. BrookHart, 1958. Saline water resource of
North Dakota U.S. Geol. Sur. Water Supply Paper 1428, 72.
19
Ravindra, K., Ameena, Meenakshi, Monika, Rani and A. Kaushik, 2003. Seasonal
variation in water quality of river Yamuna in Haryana and its ecological best-designated
use. Environ Monitor. 5, 419-426.
Ravindra, K., and V.K. Garg 2005. Appraisal of Groundwater quality for drinking
purpose in Hisar city (India) with special reference to fluoride. International Journal of
Environmental Health Research, in press.
Rowe, R. K., R. Q. Quigley and J. R. Booker, 1995. Clay Barrier Systems for Waste
Disposal Facilities, E & FN Spon, London, UK.
Saarela, J., 2003. Pilot investigations of surface parts of three closed landfills and factors
affecting them Environ. Monit. Assess. 84,183-192.
Stoline, M. R., Passerp, R. N., and M. J. Barcelona, 1993. Statistical trends in
groundwater monitoring data at a landfill site – A case study. Environ. Monit. Assess. 27
(3): 201-219.
Stuart, M.E. and Klinck, B.A. 1998. A catalogue of leachate quality from selected
landfills from newly industrialised countries. British Geological Survey Technical Report
WC/99/17.
Tatsi A. A. and A. I. Zouboulis, 2002. A field investigation of the quantity and quality of
leachate from a municipal solid waste landfill in a Mediterranean climate (Thessaloniki,
Greece), Adv. Environ. Res. 6, 207-219.
United States Environmental Protection Agency (USEPA), 1984. Office of Drinking
Water, A Ground Water Protection Strategy for the Environmental Protection Agency,
pp.11.
WHO (World Health Organization). 1997. Guideline for drinking water quality, 2nd
ed.,
Vol 2 Health criteria and other supporting information, World Health organization,
Geneva, pp 940-949.
Yanful, E. K., Quigley, R. M. and H. W. Nesbitt, 1988. Heavy metal migration at a
landfill site, Sarnia, Ontario, Canada - 2: metal partitioning and geotechnical
implications. Applied Geochemistry 3, 623-629.
20
Table 1: Site specification for groundwater samples
Sample No Sampling locations Type Depth (m) Distance (km)*
GW.1 Dairy Farm, 3rd Street TWa 46 0.2
GW.2 Dairy farm, Govt. Veterinary Hospital MOb-HP
c 24 0.4
GW.3 Delhi Electricity Board, Gazipur MO-HP 21 0.5
GW.4 Adjacent to Hindon Canal HP 9 0.7
GW.5 Delhi Jal Board; Rajveer Colony TW 85 1.5
GW.6 Sangam Park, Khoda HP 12 1
GW.7 Poultry Market TW 37 0.8
GW.8 Gazipur Village, Street No.130/52 HP 9 1
GW.9 TELCO, Gazipure TW 24 1.5
GW.10 Simant Vihar Apartment TW 31 1.5
GW.11 Solid Waste Landfill Site TW - 0
GW.12 Park in front of SBI, Gazipur TW 46 1 *From the landfill site;
aTube Well;
bMotor Operated;
cHand Pump.
21
Table 2: Physical- chemical characteristics of the leachate
Parameter
Concentrations*
pH 6.9
EC 24500
TDS 27956
TDVS 14992
FDS 12964
COD 27200
BOD 19000
Na+ 545
K+ 1590
NH4+ 2675
NO2- Nil
NO3- 380
Si 326
Phenol 0.02
Cd 0.06
Cr 0.29
Cu 0.93
Fe 70.62
Ni 0.41
Pb 1.54
Zn 2.21
*All in mg l-1
except pH and EC (S cm-1
)
22
Table 3: Drinking water quality standards as recommended by BIS and WHO.
Parameter* BIS Standards
WHO standards
Desirable Max.
Permissible
Color
Odor
Taste
pH
TH
TA
TDS
Cl-
SO42-
NO3-
F-
Ca2+
Mg2+
K+
Na+
NH4+
Phenol
B
Fe
5
Unobjectionable
Agreeable
6.5-8.5
300
200
300
250
250
45
1.0
75
30
-
-
-
-
-
-
25
Unobjectionable
Agreeable
6.5-8.5
600
600
1500
1000
400
45
1.5
200
100
-
-
-
-
-
6.5-9.2
300
500
250
200
50
0.5
100
150
200
200
1.5
0.0
0.3
0.3
*Except pH and color (hazen unit) all unit are in mg l-1
Table 4: Classification of groundwater samples on the basis of TDS Concentration.
Type of groundwater TDS (mg l-1
) Samples
Non- saline
Slightly Saline
Moderately saline
Very saline
<1000
1000-3000
3000-10,000
>10,000
07
05
Nil
Nil
23
Table 5: Classification of groundwater samples on the basis of Total Hardness.
Hardness Descriptions Samples
0-60
61-120
121-180
>180
Soft
Moderately Hard
Hard
Very Hard
Nil
Nil
Nil
12
Table 6: Microbiological analysis of water
Site No.
Total coliforms
Nos/100 ml
Faecal coliforms
Nos/100 ml
1 <1 <1
2 3600 350
3 1500 380
4 <1 <1
5 3500 12
6 <1 <1
7 3600 <1
8 9800 104
9 8100 <1
10 14800 22
11 1500 48
12 900 4
24
Table 7: Correlation matrix for different water quality parameters
pH EC TDS TDVS FDS TA TH COD Ca2+
Mg2+
Cl- F
- SO4
2- PO4
3- B Na
+ K
+ NO2
-- NO3
- NH4
+ Fe Zn
pH 1.000
EC -0.099 1.000
TDS -0.120 0.994 1.000
TDVS -0.274 0.851 0.888 1.000
FDS -0.101 0.996 0.999 0.863 1.000
TA -0.377 0.265 0.285 0.358 0.273 1.000
TH -0.348 0.918 0.941 0.961 0.926 0.392 1.000
COD -0.181 0.090 0.078 0.021 0.084 0.027 0.075 1.000
Ca2+
-0.173 0.413 0.460 0.717 0.426 0.427 0.619 0.198 1.000
Mg2+
-0.246 0.697 0.676 0.437 0.693 0.036 0.585 -0.115 -0.274 1.000
Cl- 0.006 0.986 0.976 0.827 0.979 0.230 0.886 0.058 0.459 0.609 1.000
F- 0.278 0.513 0.485 0.303 0.499 -0.028 0.273 -0.444 -0.068 0.407 0.548 1.000
SO42-
0.015 0.912 0.931 0.760 0.937 0.176 0.815 -0.073 0.275 0.715 0.892 0.572 1.000
PO43-
-0.034 0.124 0.108 -0.079 0.127 -0.264 0.053 0.168 -0.245 0.311 0.111 -0.134 0.138 1.000
B -0.095 -0.368 -0.326 -0.125 -0.344 0.711 -0.187 0.042 0.351 -0.595 -0.359 -0.420 -0.364 -0.398 1.000
Na+ 0.015 0.986 0.966 0.773 0.974 0.202 0.846 0.070 0.340 0.683 0.989 0.591 0.892 0.162 -0.423 1.000
K+ -0.364 0.652 0.681 0.604 0.680 0.284 0.663 -0.101 -0.023 0.834 0.538 0.261 0.733 0.044 -0.222 0.572 1.000
NO2-- 0.161 -0.160 -0.140 -0.206 -0.131 0.691 -0.172 -0.170 -0.001 -0.213 -0.148 -0.037 -0.024 -0.194 0.777 -0.160 -0.007 1.000
NO3- -0.307 0.184 0.133 -0.051 0.151 -0.004 0.094 0.067 -0.334 0.454 0.146 0.147 0.062 0.711 -0.415 0.237 0.095 -0.214 1.000
NH4+ 0.363 -0.075 -0.075 -0.058 -0.075 -0.238 -0.067 -0.009 -0.108 0.024 -0.066 -0.397 -0.092 -0.004 -0.042 -0.076 0.061 -0.108 -0.217 1.000
Fe -0.172 -0.225 -0.235 -0.434 -0.211 0.048 -0.283 0.013 -0.399 0.063 -0.234 -0.046 -0.086 0.353 0.009 -0.193 -0.115 0.284 0.503 -0.194 1.000
Zn -0.115 -0.449 -0.447 -0.402 -0.445 -0.005 -0.361 0.458 -0.102 -0.322 -0.478 -0.508 -0.441 -0.239 0.227 -0.485 -0.357 0.082 -0.202 -0.088 0.213 1.000
25
Table 8: Comparison of various parameter levels in groundwater at different
distance and Depth.
Parameters
Concentrations (mg l-1
)
Site 1 (At 0.2 km*,
depth 46 m)
Site 12 (At 1.0 km*,
depth 46 m)
Site 5 (At 1.5 km*,
depth 85 m)
EC 3490 2060 700
TA 546 518 230
TH 1388 836 380
COD 6 2 4
Ca2+
477 46 21
K+ 16.9 37 7.8
Na+ 291 155 32
NH4+ 0.6 1.6 Nil
Cl- 737 286 58
SO42-
665 221 58
F- 0.85 0.8 0.67
NO3- Nil 24.5 Nil
Zn 0.03 Nil Nil
Fe 0.04 0.17 0.12 *Distance from landfill site
26
Fig. 1: Location of Gazipur and other landfill sites in Delhi.
Fig. 2: Sketch map of sampling sites near and around Gazipur landfill site. (* distance not
on scale)
27
6.5
7
7.5
8
1 2 3 4 5 6 7 8 9 10 11 12
pH
pH
0
1000
2000
3000
4000
1 2 3 4 5 6 7 8 9 10 11 12
EC
(µS
cm
-1)
EC
0
500
1000
1500
2000
2500
1 2 3 4 5 6 7 8 9 10 11 12
So
lid
s (
mg
L-1
)
TDS TDVS FDS
0
5
10
15
20
1 2 3 4 5 6 7 8 9 10 11 12
CO
D (
mg
L-1
)
COD
0
200
400
600
800
1 2 3 4 5 6 7 8 9 10 11 12sampling site
TA
(m
gL
-1)
TA as CaCO3 Desirable limit
Fig. 3: Concentrations of pH, EC, TDS, TDVS, FDS, COD and TA in groundwater
samples.
28
0
500
1000
1500
1 2 3 4 5 6 7 8 9 10 11 12
TH
(m
gL
-1)
THDesirable limit
0
100
200
300
400
500
600
1 2 3 4 5 6 7 8 9 10 11 12
Ca
2+ (
mg
L-1
)
Ca
Desirable limit
0
50
100
150
200
250
1 2 3 4 5 6 7 8 9 10 11 12
Mg
2+ (
mg
L -
1)
Mg Desirable limit
0
100
200
300
400
1 2 3 4 5 6 7 8 9 10 11 12
Na
+ a
nd
K+ (
mg
L-1
)
Na K Desirable limit
0
1
2
3
4
5
1 2 3 4 5 6 7 8 9 10 11 12sam pling site
NH
4+(m
gL
-1)
ammonia WHO limit
Fig. 4: Concentration of TH, Ca2+
, Mg2+
, Na+, K
+ and NH4
+ in groundwater samples
29
0
200
400
600
800
1 2 3 4 5 6 7 8 9 10 11 12
Cl-
(mg
L-1
)
Cl Desirable limit
0
0.2
0.4
0.6
0.8
1
1.2
1 2 3 4 5 6 7 8 9 10 11 12
F- (
mg
L-1
)
Fluoride Desirable limit
0
10
20
30
40
50
60
1 2 3 4 5 6 7 8 9 10 11 12
NO
3- (m
gL
-1)
nitrate Desirable limit
0
0.02
0.04
0.06
0.08
1 2 3 4 5 6 7 8 9 10 11 12
PO
43
- (m
gL
-1)
Phosphate
0
500
1000
1500
1 2 3 4 5 6 7 8 9 10 11 12Sam pling site
SO
42
- (m
gL
-1)
Sulphate Desirable limit
Fig. 5: Concentration of Cl-, F
-, NO3
-, PO4
3- and SO4
2- in groundwater samples.
30
0
0.5
1
1.5
2
2.5
3
1 2 3 4 5 6 7 8 9 10 11 12
B (
mg
L-1
)
Boron WHO std
0
10
20
30
40
50
1 2 3 4 5 6 7 8 9 10 11 12
Si (m
gL
-1)
Silica
0
0.5
1
1.5
2
2.5
3
1 2 3 4 5 6 7 8 9 10 11 12
Fe
(m
gL
-1)
Fe WHO limit
0
0.2
0.4
0.6
0.8
1
1 2 3 4 5 6 7 8 9 10 11 12
sam pling s ite
Zn
(mg
L-1
)
Zn
Fig. 6: Concentration of B, Si, Fe and Zn in groundwater samples.
31
50
250
450
650
850
10 30 50 70 90
Depth (m)
TA
an
d T
H (
mg
l -1
)
-5
0
5
10
15
20
K,
Fe
and
CO
D (
mg
l -1
)
TATHCODKFe
Fig. 7: Variation in the concentration of different species for varying depths at 1.5 km
distance from the landfill boundary.