leaching characteristics of selenium from coal fly ash
TRANSCRIPT

University of Arkansas, FayettevilleScholarWorks@UARK
Theses and Dissertations
5-2014
Leaching Characteristics of Selenium from Coal FlyAshMark Allen CantrellUniversity of Arkansas, Fayetteville
Follow this and additional works at: http://scholarworks.uark.edu/etd
Part of the Natural Resources Management and Policy Commons, and the Water ResourceManagement Commons
This Thesis is brought to you for free and open access by ScholarWorks@UARK. It has been accepted for inclusion in Theses and Dissertations by anauthorized administrator of ScholarWorks@UARK. For more information, please contact [email protected], [email protected].
Recommended CitationCantrell, Mark Allen, "Leaching Characteristics of Selenium from Coal Fly Ash" (2014). Theses and Dissertations. 1054.http://scholarworks.uark.edu/etd/1054

Leaching Characteristics of Selenium from Coal Fly Ash

Leaching Characteristics of Selenium from Coal Fly Ash
A thesis submitted in partial fulfillment of the requirements for the degree of
Master of Science in Crop, Soil, and Environmental Science
by
Mark A. Cantrell University of Arkansas
Bachelor of Science in Agricultural, Food and Life Sciences, 2004
May 2014 University of Arkansas
This thesis is approved for recommendation to the Graduate Council.
___________________________________ Dr. Kristofor R. Brye Thesis Director
___________________________________ ________________________________ Dr. Julian L. Fairey Dr. Esten Mason Committee Member Committee Member ___________________________________ Dr. David M. Miller Committee Member

ABSTRACT
Selenium (Se) contamination can be a potential groundwater concern near un-lined coal
ash landfills. Out of all the Environmental Protection Agency (EPA) priority and non-priority
pollutants, Se has the narrowest range between what is considered beneficial and detrimental for
aquatic and terrestrial organisms. The effects of ash type (i.e., fresh and weathered), water-
extractant type (i.e., deionized water, rainwater, and groundwater), and extraction time (i.e., 2-
and 6-hours) on Se, arsenic (As), and chromium (Cr) concentrations were investigated from
Class C, subbituminous coal fly ash produced at the Flint Creek Power Plant located in Benton
County, AR. Water-extractable Se concentrations differed (P = 0.03) between ash types across
water-extractants, but were unaffected by extraction times. Unexpectedly, fresh ash water-
extractable Se concentrations were below minimum detection limits (i.e., 2.0 μg L-1) for all
treatments. In contrast, averaged over extraction times, the weathered ash water-extractable Se
concentration was greatest (P < 0.05) with groundwater and rainwater, which did not differ and
averaged 60.0 μg L-1, compared to extraction with deionized water (57.6 μg L-1). Selenite (Se4+)
was greater (P < 0.001) in the fresh (3.85 mg kg-1) than in the weathered ash (0.70 mg kg-1),
while selenate (Se6+) concentration was greater (P < 0.001) in the weathered (0.67 mg kg-1) than
in fresh ash (0.48 mg kg-1). Results from this study indicate that environmental weathering of
Class C, subbituminous fly ash promotes oxidation of selenite (Se4+), to the less toxic, but highly
mobile selenate (Se6+). The formation of hydrated ettringite [Ca6Al2(SO4)3(OH)12 - 26H2O] and
calcium selenite (CaSeO3) likely acted as a sink for weathered ash selenite (Se4+). Implications
of this research include a better understanding of the past, present, and future environmental and
health risk potential associated with the release of water-soluble Se, As, and Cr to aid in the
development of sustainable fly ash management strategies.

ACKNOWLEDGEMENTS
I would like to thank American Electric Power (AEP-SWEPCO) which provided the
funding for this research. Throughout this research process, AEP-SWEPCO was always an open
book in regard to any information or results that were needed. I would also like to express my
gratitude to my supervisors, Ivaunna Neigler and Claude Gregory, who allowed me to continue
working full-time while attending classes. Lastly, I would like to thank my committee members
Dr. Julian Fairey, Dr. David Miller, Dr. Esten Mason, and, most importantly, my advisor Dr.
Kris Brye for their knowledge and guidance throughout this process.

DEDICATION
I dedicate this thesis to my wife, Kari Cantrell, whose support and patience throughout
this entire process provided the stability that was needed to accomplish this task. I would also
like to thank my grandparents, James and Pauline Cantrell. Everything that I have accomplished
can be traced back to them.

TABLE OF CONTENTS
List of Tables List of Figures
INTRODUCTION……………………………………………………………………………….1
References…………………………………………………………………………………3
CHAPTER 1: LEACHING CHARACTERISTICS OF SELENIUM FROM COAL FLY ASH……………………………………………………………………………….5 Literature Review………………………………………………………………………….6
Coal-Fired Electric Generation Plants…………………………………………….6 Coal and Coal Ash………………………………………………………………...7 Bottom Ash……………………………………………………………..…8 Fly Ash…………………………………………………………………….9 Selenium………………………………………………………………………....10
Selenium Volatization…………………………………………………....10 Selenium’s Role in the Environment…………………………………….12 Ash Landfill Leachate…………………………………………………....15 Selenium in Soils………………………………………………………...16 Selenium Reduction in the Environment……………………………...…20 Selenium Reduction in Waste Streams…………………………………..22 ABMet™ Treatment Technology………………………………………..23 Justification………………………………………………………………………………28
Objectives…………………………………………………………………………...…...31 Testable Hypotheses…………………………………………………………………..…31
References……………………………………………………………………………..…34 CHAPTER 2: LEACHING CHARACTERISTICS OF SELENIUM AS AFFECTED BY COAL FLY ASH TYPE, WATER EXTRACTANT, AND EXTRACTION TIME………………………………………………………………………………….……….49 Abstract………………………………………………………………………………..…50 Introduction……………………………………………………………………………....51 Materials and Methods…………………………………………………………………...55 Site Description - Flint Creek Power Plant……………………………………...55 Sub-bituminous Coal…………………………………………………….56 Bottom Ash………………………………………………………………56 Fly Ash…………………………………………………………………...57 Class 3N Solid Waste Disposal Facility (Ash Landfill)…………………58 Ash Landfill - Daily Operations…………………………………60 Current Landfill Liner…………………………………………....61 Current Sub-Surface Leachate Collection……………………….61 Future Intermediate Liner and Leachate Collection System……..62 ABMet™ Treatment Technology - Flint Creek………………….63 Groundwater Monitoring………………………………………………...70

Local Geology/Hydrology……………………………………………….73 Boone Formation………………………………………………...73 St. Joe Formation……………………………………...…………75 Chattanooga Shale Formation……………………………………75 Hydrology - Springfield Plateau Aquifer………………..………76 Local Soils………………………………………………….……77 Preliminary Data…………………………………………………………78 Treatments……………………………………………………………………..…79 Water-Extractant Collection……………………………………………..82 Statistical Analyses………………………………………………………………82 Results and Discussion…………………………………………………………………..84 Initial Ash Characteristics………………………………………………………..84 Initial Water-Extractant Characteristics………………………………………….89 Treatment Effects on Fly Ash Properties………………………………………...90 Water-Soluble Se, As, and Cr Fractions…………………………………………98 Correlations among Ash Properties……………………………………………...98 Environmental Implications…………………………………………………….100 Summary and Conclusions…………………………………………………………..…101 References………………………………………………………………………………104 Appendices……………………………………………………………………………...137 Appendix A…………………………………...………………………………...137
Appendix B……………………………………………………………………..138 Appendix C……………………………………………………………………..139
CONCLUSION..........................................................................................................................141
References………………………………………………………………………………143

LIST OF TABLES
Table 2-1. Analysis of sub-bituminous coal used at the Flint Creek Power Plant for electrical generation…………………………………………………...……………113
Table 2-2. Flint Creek fly ash samples analyzed for leaching using the Toxicity Characteristic Leaching Procedure (TCLP) and the Synthetic Precipitation Leaching Procedure (SPLP)…………………………………………………………….114
Table 2-3. Assessment monitoring constituent (AMC) list for the groundwater protection standard (GWPS) sampled quarterly (AEP, 2010; EPA, 2011)………….…115
Table 2-4. Expanded Parameter (EP) list for the groundwater protection standard (GWPS) sampled once every three years (AEP, 2010; EPA, 2011)………….116
Table 2-5. Hydraulic conductivity values for groundwater monitoring wells located at the Flint Creek ash landfill based on slug tests…………………………...…117
Table 2-6. Two-sample t-test summary of the initial ash characteristics used in the laboratory extractions. Reported as mean values [standard error (±SE)] based on three replications…………………………………………………………...…118 Table 2-7. Analysis of variance summary of the initial water extractant characteristics used during the laboratory extractions. Reported as mean values [standard error (±SE)] based on three replications. For the purpose of running the statistical analyses, any less than values (<) were reported as the numeric equivalent………………………………………………………….……119
Table 2-8. Analysis of variance summary of the effects of ash type, extraction time, extractant type, and their interaction on pH, electrical conductivity (EC), selenium (Se), arsenic (As), and chromium (Cr) concentrations in the water-extractable treatment samples……………………………………………………120
Table 2-9. Analysis of covariance summary of the effects of water extractant, extractant property, and their interactions on water-extractable selenium (Se), arsenic (As), and chromium (Cr) concentrations for the weathered ash samples. Reported as the correlation coefficient (r) based on five replications…………….……121

LIST OF FIGURES
Figure 1-1. Basic diagram of the boiler at the Flint Creek Power Plant. Selenium that is naturally enriched in the coal volatizes upon combustion and is carried with the flue gas stream through the convective section of the boiler. The flue gas enters the convective section around 1371 ºC (2500 ºF) and cools to a temperature of 399 ºC (750 ºF) before exiting the convective section. Selenium will condense on the surface of the fly ash at temperatures below 500 ºC (932 ºF; Sargent and Lundy Engineers, 1974)………………………………………...…44��
Figure 1-2. Oxidation-reduction potential (Eh)-pH diagram for selenium (EPRI, 2013)……….45
Figure 1-3. Gradually reducing conditions created within the bioreactors as landfill leachate gravity flows downward through the bioreactor and different electron acceptors are used for bacterial respiration……………………………………………....46
Figure 1-4. Precipitated elemental selenium (Se0) on the granular activated carbon. The Se0 is indicated by the reddish orange precipitant on the black carbon. This is a key feature of the ABMet™ system because it allows for easy removal and collection of the Se0 by backwashing the bioreactors…………………………….…47
Figure 1-5. Fixed biofilm oxidation-reduction potential (ORP) gradient created as wastewater passes through a GE ABMet™ bioreactor; modified from (GE, 2010)…….48
Figure 2-1. Basic diagram of the boiler at the Flint Creek Power Plant. Selenium that is naturally enriched in the coal volatizes upon combustion and is carried with the flue gas stream through the convective section of the boiler. The flue gas enters the convective section around 1371 ºC (2500 ºF) and cools to a temperature of 399 ºC (750 ºF) before exiting the convective section. Selenium will condense on the surface of the fly ash at temperatures below 500 ºC (932 ºF; Sargent and Lundy Engineers, 1974)……………………………………….…122� Figure 2-2. Topographic map showing the property boundary for the Flint Creek Power Plant in relation to the ash landfill. Total property owned by American Electric Power (AEP) is approximately 607 hectares (1,500 acres) Modified from AEP Real Estate Asset Mgmt. Dept. (2010)………...............................123
Figure 2-3. Cross-section map of the ash landfill showing the final grade, top of waste, intermediate liner, existing ash and bottom grade elevations; modified from AEP (2011). Elevations listed on left and right y-axis are in feet above sea level…………………………………………………………………………..……..124
Figure 2-4. Simplified cross-section of the ABMet™ bioreactor. Enough free-board must be maintained within the bioreactor to allow for adequate expansion of the biomatrix during the backwash sequence to prevent washout of the

biomatrix……………………………………………………………………..…………125 Figure 2-5. Modified flow diagram of the GE ABMet™ bioreactor to be used at the Flint Creek ash landfill to reduce selenium oxyanions (Se6+ and Se4+) to their elemental form (GE, 2010). Only one of the three bioreactors are shown to simplify the piping schematic………………………………………………………..…126 Figure 2-6. Aerial image of the groundwater monitoring wells in relation to the ash landfill. Monitoring wells that have exceeded the Groundwater Protection Standard of 50 μg Se L-1 are indicated in red. Wells with no Se contamination are indicated in green, including the private well indicated in yellow. The assumed migration of the Se plume is indicated by the dashed red line………………………………………………………………..…127 Figure 2-7. Physiography map of the area surrounding the Flint Creek ash landfill. The ash landfill is located on the relatively flat, southward extension of the Springfield Plateau. Modified from Fenneman (1938)…………………………...……128
Figure 2-8. Stratiography of the Flint Creek ash landfill; modified from Doheny-Skubic (2006) and Brahana (2011; personal communication)…………….…129
Figure 2-9. Cross-sectional schematic of the perched selenium contamination in the regolith at the Flint Creek ash landfill; not drawn to scale…………………………130
Figure 2-10. Underlying soils map of the Flint Creek ash landfill area. Linker fine sandy loam (LrC), Nixa very gravelly silt loam (NfC), Captina silt loam (CnB), Elsah soils (Eg), and Noark very gravelly silt loam (NoD) are soil series located beneath the ash landfill. Modified from NRCS- Natural Resources Conservation Services……………………………………………...131
Figure 2-11. Underlying soils map of the land directly west of the Flint Creek ash landfill in relation to the selenium plume. Captina silt loam (CnB), Linker fine sandy loam (LrC), Cherokee silt loam (Cs), Peridge silt loam (PeC), and Noark very gravelly silt loam (NoD) are soil series located in this area. Modifed from NRCS- Natural Resources Conservation Services……………...………132
Figure 2-12. Groundwater Se concentrations (μg Se L-1) as monitored at three wells (B-02, NE-3, and B-05) over a 12-yr period at the Flint Creek coal ash landfill. B-02 experienced an exceedence of the groundwater protection (GWP) standard in January 2009 after four consecutive readings greater than 50 μg Se L-1. After the exceedence, monitoring well NE-3 was installed to determine the nature and extent of the Se plume down-gradient of well B-02………………………………………………………………….…………133
Figure 2-13. Suspension pH and electrical conductivity (EC) were affected by ash

type, among extraction times, and across extractant types. Different letters are significantly different at the 0.05 level…………………………………………………134
Figure 2-14. Water-soluble selenium (Se), arsenic, (As), and chromium (Cr) differed (P < 0.05) between ash types across extractant types, averaged over extraction times. Different letters are significantly different at the 0.05 level……………………135
Figure 2-15. Water-soluble chromium (Cr) concentrations differed (P < 0.05) between between ash types among extraction times, averaged over extractant types. Different letters are significantly different at the 0.05 level……………………………136

1
INTRODUCTION
Selenium (Se) is a naturally occurring element present in soil, water, and the air. Natural
sources include weathering of the Earth’s crust, wildfires, and volcanic activity (Chapman et al.,
2009). Anthropogenic sources include agriculture (i.e., pesticides and feed additives), coal
combustion, mining, municipal wastewater discharge, petroleum refining, photographic
products, electronics, glass, ceramic, shampoo, and pigment manufacturing (Barceloux, 1999;
Chapman et al., 2009). A key trait of Se is the narrow range of exposure between what is
considered a deficiency (< 40 �g Se day-1) and what is considered toxic (> 400 �g Se day-1) for
humans (WHO, 1996). Therefore, the EPA’s Maximum Contaminant Level (MCL) in drinking
water for humans is 50 �g Se L-1 (EPA, 2011). Human Se deficiency is far more widespread
than human Se toxicity on a global scale (Fordyce, 2005). However, in China, human Se toxicity
has been reported from the consumption of crops grown in high seleniferous soils with
symptoms including garlic breath, loss of hair and nails, dental problems, gastrointestinal
problems, and nervous system problems (Yang et al., 1983).
In aquatic eco-systems, water concentrations greater than 5 μg Se L-1 can potentially
cause adverse health effects due to the bioaccumulative effects of Se within the food-chain
(EPA, 2011). Aquatic Se toxicity is characterized by reproductive teratogenic deformities and
embryo toxicity of both aquatic birds and fish and was first recognized within the U.S. in the
early 1980s (Lemly, 1999; Spallholz and Hoffman, 2002; Chapman et al., 2009). During the
1980s, several aquatic ecosystems were severely affected by Se contamination, including
agricultural drainage evaporation containments (e.g., Kesterson Reservoir, CA) and discharges
from coal ash containments (e.g., Belews Lake and Hyco Reservoir, NC and Martin Lake, TX;
Skorupa, 1998; Lemly, 2002). Because of the potential harm to humans and the aquatic

2
environment, Se removal from industrial wastestreams is necessary before discharge. One such
industrial wastestream is the leachate generated from coal ash landfills.
In the US, there is approximately 43,929,517 metric tons (48,424,000 tons) of bottom ash
and fly ash stored in coal ash landfills or coal ash impoundments annually (ACAA, 2011).
Leachate generated from a coal ash landfill can be laden with Se, which could cause harm to the
environment. Selenium contamination can be a potential groundwater concern near un-lined
coal ash landfills. A study conducted by EPRI (2006) reported that coal ash landfill leachate has
a mean concentration of 19 μg Se L-1, with a range between 0.07 to 1,760 μg Se L-1 and can exist
in a variety of oxidation states, such as selenide (Se2-), elemental Se (Se0), selenite (Se4+), and
selenate (Se6+). Selenium speciation is highly affected by oxidation-reduction potential and pH
and the oxidation state affects Se solubility and mobility in soils, the aquatic environment, and
fly ash. During coal combustion, Se is released and transferred to fly ash through a physical (i.e.,
volatization-condensation) adsorption process with selenite (Se4+), and selenate (Se6+) being the
dominant forms present (Huang et al., 2004).
Due to Se’s mobility within the environment, understanding Se’s adsorption, desorption,
and leaching processes are critical for assessing the amount of Se that has been, and could be,
released into the environment from a fly ash landfill. Data obtained from this research should
help quantify the amount of Se that has leached from a Class C, sub-bituminous, fly ash
weathered at an un-lined landfill adjacent to the Flint Creek Power Plant located in Benton
County, Arkansas. Implications of this research include a better understanding of the past,
present, and future environmental and health risk potential associated with the release of
selenium’s water-soluble fraction.

3
REFERENCES
American Coal Ash Association (ACAA). 2011. Corrected 2009 coal combustion product (CCP) production and use survey. Available at http://acaa.affiniscape.com/ associations/8003/files/2009_CCP_Production_Use_Survey_Corrected_020811.pdf (verified 03 Mar. 2014). Barceloux, D. 1999. Selenium. J. Toxicol. Clin. Toxicol. 37:145-172. Chapman, P.M., W.J. Adams, M.L. Brooks, C.G. Delos, S.N. Luoma, W.A. Maher, H.M. Ohlendorf, T.S. Presser, and D.P. Shaw. 2009. Ecological assessment of selenium in the aquatic environment: Summary of a SETAC Pellston workshop. Soc. Environ.Toxicol. Chem. (SETAC). Available at http://www.setac.org/sites/ default/files/SELSummary.pdf (verified 03 Mar. 2014). Electric Power Research Institute (EPRI). 2006. Characterization of field leachates at coal combustion product management sites: arsenic, selenium, chromium, and mercury speciation. Available at http://www.epri.com (verified 03 Mar. 2014). TR-1012578. Environmental Protection Agency (EPA). 2011. Groundwater and drinking water standards. Available at http://water.epa.gov/drink/index.cfm (verified 03 Mar. 2014). Fordyce, F.M. 2005. Selenium deficiency and toxicity in the environment. p. 373-415. In Essentials of Medical Geology. London: Elsevier. Huang, Y., B. Jin, Z. Zhong, R. Xiao, Z. Tang, and H. Ren. 2004. Trace elements (Mn, Cr, Pb, Se, Zn, Cd, and Hg) in emissions from a pulverized coal boiler. Fuel Process Technol. 86:23-32. Lemly, A.D. 1999. Selenium impacts on fish: An insidious time bomb. Hum. Ecol. Risk Assess. 5:1139-1151. Lemly, A.D. 2002. Symptoms and implications of selenium toxicity in fish: The Belews lake case example. Aquat. Toxicol. 57:39-49. Skorupa, J.P. 1998. Selenium poisoning of fish and wildlife in nature: Lessons from twelve real- world examples. p. 315-354. In Frankenberger, W.T., and R.A. Engberg (eds.) Environmental Chemistry of Selenium. Marcel Dekker, New York. Spallholz, J.E., and D.J. Hoffman. 2002. Selenium toxicity: Cause and effects in aquatic birds. Aquatic Toxicol. 57:27-37. World Health Organization (WHO). 1996. Trace elements in human nutrition and health. Available at http://www.who.int/nutrition/publications/micronutrients/ 9241561734/ en/index.html (verified 03 Mar. 2014).

4
Yang, G., S. Wang, R. Zhou, and S. Sun. 1983. Endemic selenium intoxication of humans in China. Am. J. Clin. Nutr. 37:872-881.

5
CHAPTER 1
LEACHING CHARACTERISTICS OF SELENIUM FROM COAL FLY ASH
6
LITERATURE REVIEW
Coal-Fired Electric Generation Plants
There are a total of 1,436 electric generators at 594 coal-fired plants in the United States
(EIA, 2011). During 2009, the total US usage of electricity was 3,950 million megawatt hours,
with 1,776 million megawatt hours supplied by coal-fired plants. Based on this figure, coal-fired
plants provide approximately 45 % of the total net electrical generation, with 847,930 metric tons
(934,683 tons) of coal consumed per day (EIA, 2011). Not since 1978 has electric generation
from coal been this low (EIA, 2011). Low natural gas prices, higher coal prices, surplus of
natural gas plants, and increased costs of environmental compliance has led to this decline (EIA,
2011). Coal-fired generation density by sector can be seen from the following percentages: East
North Central (23.7 %), South Atlantic (19.6 %), West North Central (12.9 %), West South
Central (12.6 %), Mountain (11.5 %), East South Central (11.1 %), Middle Atlantic (7.0 %),
New England (0.8 %) and Pacific (0.8 %; EIA, 2011).
At a typical coal-fired plant, coal arrives by rail, barge, or may be mined near the plant
and transported to the plant’s coal yard by a system of conveyer belts. Once the coal has arrived
at the plant, the coal is conveyed to large bunkers and then into a pulverizer, where the coal is
ground into a fine talcum-powder-like consistency. From this point, the pulverized coal is
injected into a boiler by forced-draft air and is combusted. The heat from this combustion turns
water into high pressure steam. This high pressure steam is what turns the turbine, which in turn
creates a magnetic field inside the generator and creates the electricity. This entire process is a
transformation of energy, whereas the coal is a source of stored chemical energy, and the
combustion of the coal to produce steam is thermal energy. Furthermore, the velocity of the
moving steam is kinetic energy, and the rotation of the turbine is mechanical energy, which

7
produces the electrical energy (Gregory, Energy Production Supt. II, personal communication,
2010). Following the combustion of coal, a percentage of the coal is left over as a by-product
known as coal ash.
Coal and Coal Ash
Coal is a heterogeneous mixture of organic and inorganic constituents formed from plants
by chemical and geological processes called coalification (Kitto and Stultz, 2005). The major
constituents of coal (i.e., carbon, hydrogen, oxygen, nitrogen, and sulfur) volatize during
combustion and account for 70 to 97 % of the total composition (EPRI, 1994b). The American
Society for Testing and Materials (ASTM) ranks coal using volatile matter and fixed carbon as
the ranking criteria. Lignite [< 19,306 kJ kg-1 (< 8,300 Btu lb-1)], sub-bituminous [19,306 to
26,749 kJ kg-1 (8,300 to 11,500 Btu lb-1)], bituminous [24,423 to 32,564 kJ kg-1 (10,500 to
14,000 Btu lb-1)], and anthracite [> 34,890 kJ kg-1 (> 15,000 Btu lb-1)] are ranks of coal ordered
according to their heat values (Kitto and Stultz, 2005). Due to their wide availability, bituminous
and sub-bituminous coals are the primary ranks used for the generation of electricity in the US
(Kitto and Stultz, 2005).
Following combustion, 3 to 30 % of the inorganic constituents, as well as a small amount
of organic matter, are left over as ash (Tripodi and Cheremisinoff, 1980; EPRI, 1994b). The
composition of coal ash will vary depending on the coal origin, degree of pulverization,
combustion process, and collection/disposal methods (EPRI, 1994b). The major constituents of
coal ash include silicon, aluminum, iron, and calcium, which account for 95 to 99 % of the total
weight (Morrison, 1970; Tripodi and Cheremisinoff, 1980). The minor constituents include
magnesium, titanium, sodium, potassium, sulfur, and phosphorus, which account for less than

8
3.5 % of the total weight (Morrison, 1970; Tripodi and Cheremisinoff, 1980). The trace
constituents can include antimony, arsenic, barium, beryllium, boron, copper, fluorine, lead,
manganese, mercury, molybdenum, nickel, selenium, tellurium, thallium, tin, titanium, uranium,
vanadium, and zinc (Tripodi and Cheremisinoff, 1980). In US coals, Coleman et al. (1993)
reported that Se was primarily present in the organic phase within the coal and had a mean
concentration of 1.7 mg Se kg-1, with a range between 0.02 to 75 mg Se kg-1. Inorganic
constituents that are naturally enriched in coal are further concentrated in the coal combustion
residuals (CCRs): bottom ash and fly ash.
Bottom Ash
Bottom ash is a coarse, heavy ash that is too dense to carry over in the gas stream after
combustion (Tripodi and Cheremisinoff, 1980; Fizette, 2005). Due to its density, bottom ash is
collected in the bottom of the boiler. The particle size ranges from that of gravel to silt, with
much of the bottom ash sized similar to that of natural sand (Fizette, 2005). Bottom ash may
range in color from medium brown to a grayish black and is usually angular in shape (Fizette,
2005; Sayiri, 2005). The specific gravity of bottom ash ranges from 1.6 to 2.6 depending on the
size of the ash particles (Sayiri, 2005). Approximately 44 % of the 15,059,270 metric tons
(16,600,000 tons) of bottom ash produced in 2009 were re-used as a marketable product (ACAA,
2011). Some beneficial re-uses of bottom ash include construction fill material, snow and ice
control, concrete/cement products, mining applications, and as road and sub-surface material
(Fizette, 2005; Sayiri, 2005). The remaining unmarketable bottom ash is either landfilled or
placed in impoundments for storage.

9
Fly Ash
In 2011, the American Coal Ash Association (ACAA) reported 57,152,640 metric tons
(63,000,000 tons) of fly ash were produced from coal generation. The physical and chemical
properties of fly ash are largely dependent on the mineral content, composition, source of the
coal, and combustion conditions within the boiler (Lou et al., 2011). The four major constituents
of fly ash are silica (SiO2), aluminum oxide (Al2O3), calcium oxide (CaO), and iron oxide
(Fe2O3; EPRI, 1984; Wesche, 1991). The minor minerals present are magnesium oxide (MgO),
sodium oxide (Na2O), titanium oxide (TiO2), potassium oxide (K20), phosphorus oxide (P2O3),
and sulfur trioxide (SO3), all of which account for less than 5 % of the total weight (EPRI, 1984;
Wesche, 1991). There are also trace amounts of heavy metals, such as arsenic, barium,
cadmium, chromium, copper, lead, mercury, molybdenum, nickel, selenium, strontium,
vanadium, and zinc, which typically do not exceed 1 % by weight (Yeheyis, 2008). Fly ash has a
mean Se concentration of 14.0 mg Se kg-1 and a normal range between 5.5 and 46.9 mg Se kg-1
(EPRI, 1987). Fly ash particles range in size from 0.5 μm (clay) to 100 μm (fine sand), with a
specific gravity that ranges from 2.2 to 2.8 (Tripodi and Cheremisinoff, 1980; Yeheyis, 2008).
According to the ASTM (2006), fly ash is classified as Class C or Class F. Class C fly
ash generally has more than 20 % CaO and more than 50 % SiO2, Al2O3, and Fe2O3 content and
is normally produced from sub-bituminous or lignite coal combustion. Class F fly ash is usually
produced from bituminous and anthracite coal combustion and has less than 10 % CaO content
and more than 70 % SiO2, Al2O3, and Fe2O3 content (ASTM, 2006). Coal samples tested during
research conducted by EPRI (1984) showed Class C fly ashes having a 14.6 to 27.2 % CaO
composition and Class F having a 0.3 to 6.8 % CaO composition.

10
Approximately 40 % of the fly ash produced is re-used in industrial applications, with the
remainder being land-filled (ACAA, 2011). Applications for re-used fly ash include
concrete/cement products, structural fills, road base, soil modification, mining applications,
waste stabilization, and agriculture. One concern with fly ash is the concentrated elements
present, such as Se, which are transferred from the coal to the ash through a volatization process.
Selenium
Selenium Volatization
Selenium is a volatile element that is released and transferred to fly ash during coal
combustion through a physical (volatization-condensation) adsorption process (Huang et al.,
2004). Of the trace elements, only mercury is more volatile than Se during the combustion of
coal (Huang et al., 2004; Lopez-Anton et al., 2007). Factors affecting Se volatization include
combustion temperature, residence time, coal source, fly ash composition, and the particle size of
the coal and fly ash (Senior et al., 2010). Zeng and Sarofim (2001) studied the vaporization
process during coal combustion and determined that Se was present within the coal as it entered
the boiler. After injection into the boiler, the coal begins to turn into a liquid “melt”, releasing
gas vapors that combust. This melt, if hardened, is known as slag. The Se is transported through
the liquid melt and released as a gas vapor (Zeng and Sarofim, 2001). Vaporized Se will be in
the gas form as either Se(g) or hydrogen selenide (H2Se) during coal gasification and is
converted to selenium dioxide (SeO2) as it mixes with oxygen-rich gases in the boiler during
combustion (Bool and Helble, 1995; Lopez-Anton et al., 2006; Noda and Ito, 2008). Due to its
recondensing temperature of 500�C (932�F), Se will begin recondensing into a solid as the gases
cool while passing through the convective section of the boiler (primary super-heater and

11
economizer) and the electrostatic precipitator (ESP; Noda and Ito, 2008). The Se will condense
on the surface of the fly ash particles forming condensed Se compounds such as SeO2(g) (Bool
and Helble, 1995; Lopez-Anton et al., 2006). Selenium experiences an increasing condensation
ratio as the flue gas temperatures decrease (Noda and Ito, 2008). During ESP testing, Huang et
al. (2004) reported that as the diameter of the fly ash particles decreased, the surface area
increased, and the relative enrichment of Se upon the fly ash became greater. Huang et al.
(2004) also documented the Se concentration ratio in each CCR as bottom ash (< 5 %), fly ash (~
45 %), and flue gas (~ 50 %). Otero-Rey et al. (2003) reported similar Se concentrations in each
CCR. Selenium that does not condense onto the fly ash particles passes out of the stack in a gas
(vapor) form.
Selenium is not present in appreciable amounts in bottom ash due to selenium’s
recondensing temperature below 500 �C (932 �F; Noda and Ito, 2008). In typical coal units,
bottom ash is collected at the bottom of the boiler combustion section and at the high
temperatures of 635 to 1343 �C (1775 to 2450 �F) in the boiler combustion section, Se has
volatized out of the coal and is present only in the gas phase (Figure 1-1). However, Otero-Rey
et al. (2003) and Huang et al. (2004) reported Se in bottom ash comprising nearly 5 % of the
total Se in CCRs. Unfortunately, these studies did not differentiate between bottom and
economizer ash. Economizer ash is often collectively referred to as bottom ash due to its
collection point. Economizer ash is collected at the bottom of the convective section and
resembles the composition and texture of bottom ash (Figure 1-1). Selenium will be present in
economizer ash due to the temperature and collection point of the economizer ash within the
boiler. Therefore, it is assumed that the Se being reported in the bottom ash actually condensed
in the convective section and was entrained in the economizer ash.��Any presence of Se in the

12
bottom ash may be due to the presence of ash “slag” or unburned coal in the bottom ash. After
collection, fly ash that was not able to be marketed is landfilled.
Selenium’s Role in the Environment
Selenium is a naturally occurring metalloid present in soil, water, and the air. Natural
sources include weathering of the Earth’s crust, wildfires, and volcanic activity (Chapman et al.,
2009). While anthropogenic sources include agriculture (i.e., pesticides and feed additives), coal
combustion, mining, municipal wastewater discharge, petroleum refining, photographic
products, electronics, glass, ceramic, shampoo, and pigment manufacturing (Barceloux, 1999;
Chapman et al., 2009). Andren and Klein (1975) reported that approximately 1.5 to 2.5 times as
much Se is released into the environment from coal combustion than by natural weathering.
Selenium can exist in a variety of oxidation states as selenide (2-), elemental Se (0), selenite (4+),
and selenate (Se6+). Selenium is considered essential for human and animal health, but has not
been reported as being essential for plant growth (Elrashidi et al., 1987; Fordyce, 2007).
A key trait of Se is the narrow range of exposure between what is considered a
deficiency (i.e., < 40 �g Se day-1) and what is considered toxic (i.e., > 400 �g Se day-1) for
humans (WHO, 1996). Selenium is an essential element for structural proteins “selenoproteins”
and for cellular defense against oxidative damage (Chapman et al., 2009). The National
Academy of Sciences’ (NAS) adequate and safe intake rate for adults is 50 to 200 �g Se day-1,
while the estimated US daily intake is 60 to 216 �g Se day-1 (Barceloux, 1999). The EPA’s
Maximum Contaminant Level (MCL) in drinking water for humans is 50 �g Se L-1 (EPA, 2011).
Human’s primary exposure route in descending order is diet, water, and air (Barceloux, 1999).

13
The consumption of meats and plants are the main sources of Se in the human diet (Fordyce,
2007).
Human Se deficiency is far more widespread than human Se toxicity on a global scale
(Fordyce, 2005). Selenium deficiency has been linked to Keshan (cardiac muscle degeneration)
and Kashin-Beck (bone and joint disorder) disease (Coleman et al., 1993). In China, Se toxicity
has been reported from the consumption of crops grown in high seleniferous soils (Yang et al.,
1983). Symptoms include garlic breath, loss of hair and nails, dental problems, gastrointestinal
problems, and nervous system problems.
In the US, Se received little attention until the 1930s, when disease problems in livestock
were traced to Se. Livestock exposed to selenium-rich grain and forage led to Se toxicity, often
referred to as alkali disease or blind staggers (Fordyce, 2007). In the 1980s, several aquatic
ecosystems were severely affected by Se contamination, including agricultural drainage
evaporation containments (Kesterson Reservoir) and discharges from coal fly ash containments
(Belews Lake, Hyco Reservoir, and Martin Lake; Skorupa, 1998). At the Kesterson Reservoir in
California, waterfowl populations were affected by a high incidence of embryonic death and
deformity within the eggs, while chronic reproductive toxicity lead to the elimination of entire
communities of fish at the coal fly ash containment discharges (Skorupa, 1998; Lemly, 1999).
The national aquatic water quality criterion for aquatic species is 5 �g Se L-1 (EPA, 2011).
In aquatic ecosystems, Se toxicity is characterized by reproductive teratogenic
deformities and embryo toxicity of both aquatic birds and fish (Lemly, 1999; Spallholz and
Hoffman, 2002; Chapman et al., 2009). Embryo toxicity is more pronounced in aquatic birds
and teratogenic deformities are more pronounced in fish larvae (Chapman et al., 2009).
Selenium bio-accumulates within the egg after being transferred from the parent’s diet. Since

14
the egg is the primary point of impact, fish populations can decline in a matter of a few years,
while adult fish appear healthy (Lemly, 1999). Therefore, Lemly (2002) suggested that chronic
Se toxicity could be “invisible” due to the limited acute mortality of adult fish. Aquatic birds are
exposed to Se after the ingestion of insects and fish in which organic Se bioaccumulation has
occurred (Spallholz and Hoffman, 2002).
Water concentrations greater than 5 �g Se L-1 may potentially cause adverse effects
within the food chain due to the bio-accumulative effect of Se (EPA, 2011). In the aquatic
environment, Se bioaccumulation is caused by the passive uptake of Se directly from water or
sediments and from the direct uptake from food sources (Barceloux, 1999; Lemly, 1999). The
bioconcentration factor from passive uptake is more extensive in the lower trophic levels of the
food chain (Barceloux, 1999; EPRI, 2006b). At Belews Lake in North Carolina, Lemly (2002)
observed the bioaccumulation within periphyton biota (algae and microbes) and in the visceral
tissue of fish to be 519 to 3975 times the background water concentrations of 10 �g Se L-1. Fan
et al. (2002) reported primary producers absorbing inorganic Se oxyanions and biotransforming
these into organic forms of Se. Following this, the organic forms of Se were transferred though
the remaining trophic levels: two through four (Fan et al., 2002). The trophic levels are trophic
level 1: primary producers (filamentous algae, phytoplankton, periphyton), trophic level 2:
primary consumers (filter feeders and collector-gatherers), trophic level 3: secondary consumers
(forage fishes and predatory/omnivorous invertebrates), and trophic level 4: tertiary consumers
(predatory fish; EPRI, 2006b).
The oxidized species present also affect selenium’s toxicity within the aquatic
environment. Selenite (Se4+) and selenate (Se6+) are usually the dominate species present in the
environment (EPRI, 2006b). Selenite (Se4+) is readily adsorbed by aquatic species and is slightly

15
more toxic than selenate (Se6+) in water (Barceloux, 1999). Similarly, Skorupa (1998) reported
that selenite-dominated waters appeared to have a steeper environmental response curve than
selenate-dominated waters.
Ash Landfill Leachate
One of the major concerns with ash landfills is the potential for groundwater
contamination due to the leaching of concentrated contaminates present in the ash. Groundwater
could become contaminated if allowed to come in contact with ash landfill leachate (Tripodi and
Cheremisinoff, 1980). Due to their high solubility, boron, calcium, and sulfate are key indicators
of leachate migration from ash landfills (EPRI, 1987). Selenium can also be a key indicator if
present in the mobile selenate (Se6+) form.
Under experimental laboratory conditions, Wang et al. (2007) reported leachate
concentrations of less than 0.1 mg Se L-1 from sub-bituminous ash over the entire pH range,
which suggests that the high concentration of CaO present formed hydration and precipitation
products [e.g. Ca6Al2(SO4)3(OH)12 or CaSeO3] with Se. Leaching from bituminous ash resulted
in concentrations less than 0.1 mg Se L-1 at pH 3 to 4 with increasing Se concentrations (1.7 to
2.5 mg Se L-1) as pH neared 12 (Wang et al., 2007). However, alkaline pH values for
bituminous coal ash leachate are highly unlikely in the environment. Leachate from bituminous
ash results in a slightly acidic pH (6 to 6.4), while leachate derived from sub-bituminous ash
results in alkaline pH values (11.3 to 11.7; EPRI, 2006a). Wang et al. (2007) also reported
similar natural pH values of 4.4 to 6.0 for bituminous ash and 10.6 to 12.3 for sub-bituminous
ash.

16
As a landfill leachate plume migrates away from a landfill, the soil solution pH it comes
in contact with may change chemically. The magnitude of impact will depend on the existing
soil pH, buffer capacity of the soil, residence time, pH of the leachate plume, and buffer capacity
of the leachate plume (EPRI, 2006a). Soils that have high concentrations of clay, extractable Fe,
and extractable Al are expected to have high buffering capacities, while sandy soils generally
have low buffering capacities (EPRI, 2006a).
Selenium in Soils
Selenium can be present in soils as organic Se, metal selenides (Se2-), elemental Se (Se0),
selenite (Se4+), and selenate (Se6+). Fordyce (2005) reported the average concentration in soils
ranges between 0.1 to 2.0 mg Se kg-1. However, in high seleniferous soils, the average
concentration was 4.5 mg Se kg-1, with a maximum value of 80 mg Se kg-1 (Elrashidi et al.,
1987). Selenium’s mobility in soils is determined by the adsorption-desorption and
precipitation-solubilization processes of Se (Jayaweera and Biggar, 1996; Dhillon and Dhillon,
2000). Thermodynamic equilibrium predictions of soil redox do not always hold true in the
natural environment due to factors such as soil heterogeneity, kinetic barriers to equilibrium, and
biological processes (Jayaweera and Biggar, 1996; Hyun et al., 2006). Adsorption onto soil
particles is controlled by the redox conditions, chemistry, geologic materials, and soil pH and
usually occurs rapidly within minutes or hours (Sposito, 1989; EPRI, 1994a; Barceloux, 1999;
Goldberg et al., 2008).
As soil pH increases, Se oxyanions will deprotonate (e.g. HSeO4- � SeO4
2- or HSeO3-
�SeO32-) and the soil surface charge will become increasingly negative resulting in increased
repulsion forces and decreased adsorption (Ahlrichs and Hossner, 1989; Hyun et al., 2006;

17
Rovira et al., 2008). With this increasing pH, there is a direct increase in leaching of Se
oxyanions from soil, a characteristic of anion adsorption-desorption (EPRI, 1994a; Otero-Rey et
al., 2005; Goh and Lim, 2004). Selenium adsorption can also be affected by clay and iron
oxides, divalent cations, and total Se present within the soil.
Clay and iron oxide minerals have positively charged adsorption sites causing them to
adsorb negatively charged Se ions more readily (White and Dubrosky, 1994; Rovira et al., 2008).
Soils with high concentrations of metal oxides had the greatest ability to adsorb Se (Tan et al.,
1994). Goldberg et al. (2008) researched the effect of increasing Se concentrations on adsorption
and reported that selenite (Se4+) adsorption increased rapidly and then plateaued (L-curve), while
selenate (Se6+) adsorption was nearly linear (C-curve).
Anions such as phosphate and sulfate (PO43-, SO4
2-) can also negatively affect Se
adsorption by competing with Se oxyanions for adsorption sites in soils (Dhillon and Dhillon,
2000; Goh and Lim, 2004). Sulfates have been shown to strongly limit selenate (Se6+)
adsorption due to the competitive traits between the two (Alemi et al., 1988; EPRI, 1994a; White
and Dubrovsky, 1994; Goh and Lim, 2004). Goh and Lim (2004) reported a sharp decrease in
selenate (Se6+) adsorption when sulfate concentrations ranged from 0 to 0.01 M (0 to 961 mg
SO42- L-1), while Dhillon and Dhillon (2000) reported a minimal decrease in selenite (Se4+)
adsorption with increasing sulfate concentrations. Both selenite (Se4+) and selenate (Se6+)
adsorption rates decreased as phosphate concentrations increased (Goh and Lim, 2004). Dhillon
and Dhillon (2000) observed soils adsorbing two to three times more phosphate than Se when
competing for the same adsorption sites. Shifting from aerobic to anaerobic conditions will also
affect Se speciation within soils.

18
Under reducing conditions, Se may exist as insoluble metal selenides (Se2-) and elemental
Se (Se0; Elrashida et al., 1987; Flury et al., 1997). Under normal oxidizing soil conditions,
soluble Se may exist in the 4+ oxidation state as selenite (Se4+) or in the 6+ oxidation state as
selenate (Se6+; Ahlrichs and Hossner, 1989). Fluctuating groundwater in the vadose zone may
cause a cycling in redox conditions resulting in a cycling between both Se oxyanion species
selenate (Se6+) and selenite (Se4+; Jayaweera and Biggar, 1996). With fluctuating groundwater,
soil pores can become filled with water instead of air with a resulting decrease in O2, which can
lead to anaerobic conditions, while a drop in the groundwater table can lead to drying of the soil
pores (increase in O2) and a return to aerobic conditions (Sposito, 1989; Jayaweera and Biggar,
1996). Under these conditions, a rise in the groundwater table may result in the reduction of Se
species and a decrease in leaching potential. On the other hand, a decreasing groundwater table
may result in the oxidation of Se species and an increase in leaching potential. However, Flury
et al. (1997) reported an increase in leaching with increasing rainfall during the winter months in
alluvial soils. Therefore, soil parent material, water holding capacity, and water infiltration rates
may have a large impact on leaching. Selenite (Se4+) is typically present in acidic to neutral soils
and selenate (Se6+) is typically present in alkaline soils (Neal and Sposito, 1989; Goh and Lim,
2004). Changes in oxidation states affect selenium’s mobility, solubility, and adsorption rates in
soils (Elrashida et al., 1987; Goh and Lim, 2004; Otero-Rey et al., 2005).
Selenite (Se4+) functions like the phosphate anion (inner-sphere surface complex) and has
a greater adsorption than selenate (Se6+; Goldberg et al., 2008; Zhang et al., 2010). The pKa
values for selenite (Se4+) are 2.64 and 8.36 (Wang et al., 2007), indicating that biselenite (HSeO3-
) is the dominate species present in neutral soils and selenite (SeO32-) is dominate in alkaline
soils. Selenite (Se4+) adsorption is greatest at low pHs and decreases with increasing pHs above

19
6 (Frost and Griffin, 1977; EPRI, 1994a; Hyun et al., 2006). Similarly, Goh and Lim (2004)
documented selenite (Se4+) adsorption decreased from 83 % at pH 3 to 59 % at pH 7 using a 200
μM selenite (Se4+) solution added to a tropical soil. In alluvial soils from the San Joaquin valley,
Fio et al. (1991) reported greater than 50 % adsorption of selenite (Se4+) after only 8 hours. In
acidic and neutral soils, selenite (Se4+) adsorption is also controlled by its ability to bind to ferric
hydroxides and aluminum oxides (Ylaranta, 1982; Ahlrichs and Hossner, 1987; Barceloux, 1999;
Goldberg et al., 2008). This adsorption characteristic is what allows selenite (Se4+) removal
from wastewater to be feasible with iron (III) hydroxide and alum co-precipitation (EPRI,
2006c). Once adsorbed onto the soil, selenite (Se4+) is resistant to leaching (Fio et al., 1991;
Dhillon and Dhillon, 2000). Ahlrichs and Hossner (1987) observed selenite (Se4+) having little
mobility even after 50 pore volumes of solution. Therefore, selenite (Se4+) could remain in the
soil matrix for extended periods, which could lead to a problematic long-term source of Se.
Selenite (Se4+) tends to be oxidized to selenate (Se6+) in low-moisture soils, as soil temperature
increases, and in alkaline soils (Ahlrichs and Hossner, 1987).
Selenate (Se6+) is known to behave like the sulfate anion (outer-sphere surface complex)
with low adsorption rates, high solubility, and pronounced leachability causing selenate (Se6+) to
be highly mobile in soils (Elrashida et al., 1987; Neal and Sposito, 1989; Peak and Sparks,
2002). Due to selenate’s (Se6+) pKa2 value of 1.91, only the completely de-protonated species
(SeO42-) exists in most soils. Selenate (Se6+) adsorption is greatest at a soil pH less than 4 and
quickly decreases from a pH 4 to 7 with nearly no adsorption occurring at pH > 9 (EPRI, 1994a;
Hyun et al., 2006). Goh and Lim (2004) reported that selenate (Se6+) adsorption decreased from
46 % at pH 3 to 15 % at pH 7 using a 200 μM selenate (Se6+) solution added to a tropical soil.
Hyun et al. (2006) noted that selenate (Se6+) adsorption was greatest in clay soils and lowest in

20
sandy soils. However, selenate (Se6+) adsorption to clay is still weak, and under alkaline
conditions, selenate (Se6+) could leach through relatively pure clay (Frost and Griffin, 1977;
White and Dubrovsky, 1994). In sandy-loam soil, selenate (Se6+) was mobile at pHs from 2 to 9
and leached with less than three pore volumes of solution (Ahlrichs and Hossner, 1987).
Selenate (Se6+) is also readily leached into groundwater from alluvial soils in the vadose zone,
due to selenate’s (Se6+) low affinity for soil particles (Neal and Sposito, 1989). Under high
redox conditions and with minimal microbial activity, selenate (Se6+) reduction to selenite (Se4+)
will be limited (Elrashida et al., 1987; Alemi et al., 1988; Neal and Sposito, 1989).
Selenium Reduction in the Environment
Water-soluble Se oxyanions can be reduced to elemental Se by naturally occurring
bacteria (Oremland et al., 1989; Oremland et al., 1994; Catal et al., 2009). In the environment,
bio-reduction of Se is carried out naturally in soil and water (Steinberg and Oremland, 1990;
Stolz and Oremland, 1999). The most effective selenium-reducing bacteria have been isolated
from environments with high concentrations of Se (Maiers et al., 1988; Ike et al., 2000).
Bacterial respiration reduces the soluble Se oxyanions to elemental Se through the process of
anaerobic microbial respiration (Oremland et al., 2004; Lee et al., 2007; Narasingarao and
Haggblom, 2007). Many different species of bacteria and archaea have been shown to be
capable of reducing Se, including Aeromonas, Bacillus, Clostridium, Desulfotomaculum,
Desulfovibrio, Escherichia, Penicillium, Pseudomonas, Ralstonia, Salmonella, Shewanella,
Sulfurospirillum, and Thauera (Maiers et al., 1988; Adams et al., 1993; Oremland et al., 2004;
Lee et al., 2007; Siddique et al., 2007).

21
During microbial respiration, the use of SeO42- (selenate) as the electron acceptor is
known as dissimilatory selenate (Se6+) reduction (DSeR) written as SeO42- + Org. C � SeO3
2- +
Org. C � Se0 + CO2 + H2O (Stolz and Oremland, 1999). This bio-reduction process is
reversible under oxidizing conditions (Sarathchandra et al., 1981; Zhang et al., 2004). For
elemental Se to re-oxidize to selenite (Se4+) or selenate (Se6+), a shift to aerobic and alkaline
water conditions must occur (Adams et al., 1993). Electric Power Research Institute (2006c)
reported that selenite (Se4+) had a slow conversion rate to selenate (Se6+) in natural surface
waters resulting in selenite (Se4+) as the dominate species normally present. Under highly anoxic
conditions, the toxic gas selenide (HSe-) can form when elemental Se is used as the terminal
electron acceptor (Lovley, 1993; Siddique et al., 2006). This reaction is written as Se0 + H2 �
HSe- + H+. Selenide can also form as a solid which is identifiable by a black, crystalline
precipitate (Herbel et al., 2003). However, selenide is unstable and is quickly oxidized back to
elemental Se in the presence of oxygen (Alemi et al., 1988; Maiers et al., 1988).
Selenium speciation in natural waters is highly affected by redox and pH as seen in the
Eh-pH diagram for Se (Figure 1-2; Allen et al., 1993; Iskandar et al., 2001). However,
thermodynamic equilibrium models are sometimes not accurate due to many unforeseen factors
affecting natural waters (EPRI, 2006b). A change in the oxidation state of Se is known to alter
the solubility, toxicity, and mobility of Se (Doran and Alexander, 1977; Catal et al., 2009;
Hayashi et al., 2009). Furthermore, the solubility of Se increases as the oxidation-reduction
potential (ORP) and pH of the water increases (Masscheleyn et al., 1991). A study performed by
Masscheleyn et al. (1991) observed that, under redox conditions from 0 to 500 mV, the solubility
of Se was as much as 5 times greater at pH 7.5 compared to pH of 5. Selenate (Se6+) was shown
to have the greatest solubility at 500 mV under equilibrium conditions of pH 5 (Masscheleyn et

22
al., 1991). As redox levels decreased to 200 mV, selenite (Se4+) became the pre-dominate
species of Se in water and the solubility drastically decreased under equilibrium conditions
(Masscheleyn et al., 1990, 1991). Further reduction of selenite (Se4+) led to the formation of
elemental Se under anaerobic conditions (Masscheleyn et al., 1990, 1991; Stolz and Oremland,
1999). At -200 mV, the soluble Se species selenate (Se6+) and selenite (Se4+) were not detected
(Masscheleyn et al., 1990, 1991).
Selenium Reduction in Waste Streams
Various other oxyanions and metals present in fly ash landfill leachate may affect Se
reduction. In particular, sulfates and nitrates tend to occur in greater concentrations in effluent of
industrial waste streams (Kashiwa et al., 2000). Selenium and sulfur share similar chemical and
biochemical properties due to their location on the periodic chart (column VIA; Doran and
Alexander, 1977; Oremland et al., 1989; Higashi et al., 2005). However, Se oxyanions and
sulfur oxyanions are reduced under different biogeochemical pathways (Oremland et al., 1989;
Lenz et al., 2008). For example, Se reduction occurs in sediment at much shallower depths than
sulfur reduction (Steinberg and Oremland, 1990; Lovley, 1993). Therefore, Se reduction is not
affected by sulfate concentrations in wastewater due to the greater affinity for Se oxyanions
compared to sulfate (Oremland et al., 1989; Garbisu et al., 1996).
Under reducing conditions, nitrate is used prior to selenate (Se6+) as the preferred electron
acceptor (Steinberg et al., 1992; Kashiwa et al., 2000). Therefore, nitrate is known as an
inhibitor of Se reduction (Steinberg and Oremland, 1990; Lovley, 1993). With nitrate being the
preferred electron acceptor, the reduction of selenate (Se6+) will not take place until the nitrates
have been reduced in the solution. The half-cell reaction for nitrate reduction to ammonium is

23
NO3- + 10H+ + 8e- � NH4+ + 3H20 (White and Dubrovsky, 1994). When high nitrate
concentrations exist in wastewater, excess carbon sources must be available to prevent a decrease
in Se reduction (Adams et al., 1993; Kashiwa et al., 2000). The presence of nitrates and
dissolved oxygen (DO) is a useful indicator of oxidizing conditions (White and Dubrovsky,
1994). Metals such as tungsate, molybdate, and chromate may also inhibit Se reduction
(Oremland et al., 1989; Steinberg and Oremland, 1990).
ABMet™ Treatment Technology
Selenium bio-reduction can be commercially recreated using a continuous-flow-through
bioreactor inoculated with naturally occurring bacteria. In these bioreactors, selenium-respiring
bacteria utilize selenium oxyanions as electron acceptors and some type of carbon source, such
as molasses, as the electron donor (Cantafio et al., 1996; Fujita et al., 2002). Utilizing a carbon
source that is compatible with the selected strain of bacteria is critical for the bacteria’s growth,
sustainability, effectiveness, and redox conditions (Garbisu et al., 1996; Kashiwa et al., 2000;
Astratinei et al., 2006; Zhang et al., 2008). Electron acceptors also support the growth of the
selenium-respiring bacteria (Lovley, 1993).
The GE ABMet™ (Advanced Biological Metals Removal Process) system reduces
dissolved selenium oxyanions selenate (Se6+) and selenite (Se4+) to their elemental form through
a bio-reduction process (Figure 1-3). The ABMet™ system is the only commercially available,
cost-effective, treatment technology that has effectively removed selenate (Se6+) from industrial
wastewater (EPRI, 2006c). The ABMet™ bioreactors are a fixed film, plug-flow type, proven
effective at removing selenium through laboratory treatability studies, pilot trials, and several
large-scale operational systems with flows up to 7.6 million liters per day (2 million gal d-1; GE,
24
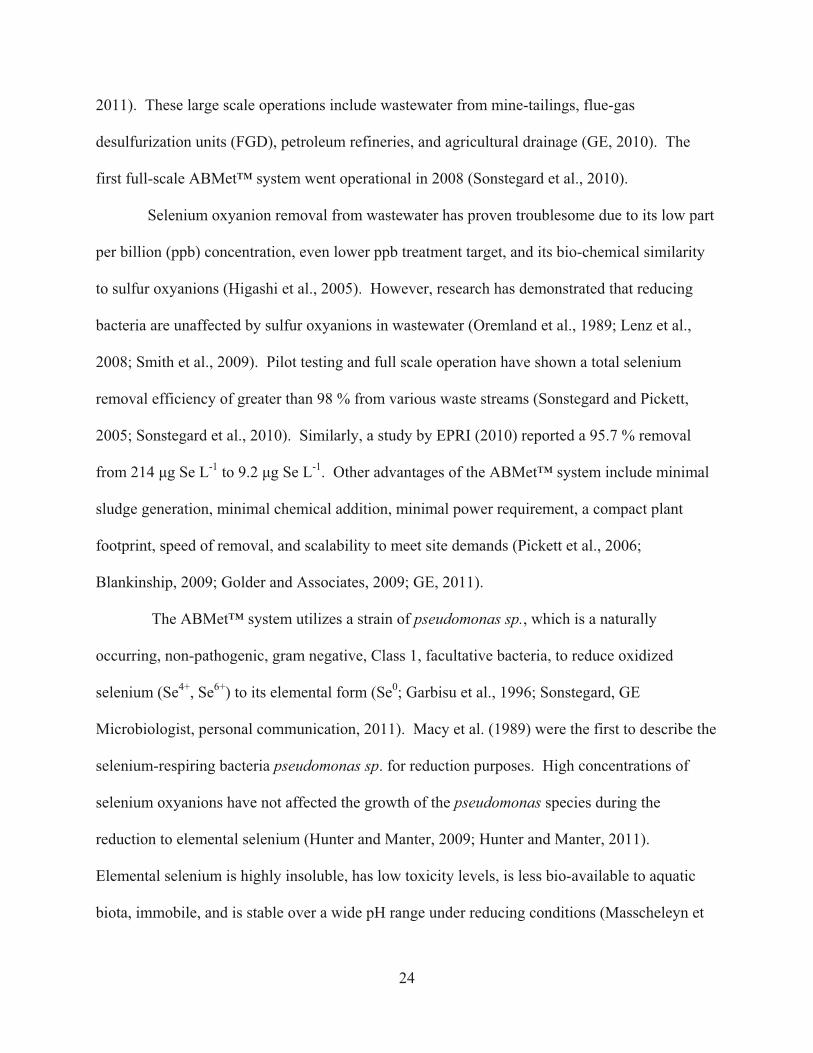
2011). These large scale operations include wastewater from mine-tailings, flue-gas
desulfurization units (FGD), petroleum refineries, and agricultural drainage (GE, 2010). The
first full-scale ABMet™ system went operational in 2008 (Sonstegard et al., 2010).
Selenium oxyanion removal from wastewater has proven troublesome due to its low part
per billion (ppb) concentration, even lower ppb treatment target, and its bio-chemical similarity
to sulfur oxyanions (Higashi et al., 2005). However, research has demonstrated that reducing
bacteria are unaffected by sulfur oxyanions in wastewater (Oremland et al., 1989; Lenz et al.,
2008; Smith et al., 2009). Pilot testing and full scale operation have shown a total selenium
removal efficiency of greater than 98 % from various waste streams (Sonstegard and Pickett,
2005; Sonstegard et al., 2010). Similarly, a study by EPRI (2010) reported a 95.7 % removal
from 214 �g Se L-1 to 9.2 �g Se L-1. Other advantages of the ABMet™ system include minimal
sludge generation, minimal chemical addition, minimal power requirement, a compact plant
footprint, speed of removal, and scalability to meet site demands (Pickett et al., 2006;
Blankinship, 2009; Golder and Associates, 2009; GE, 2011).
The ABMet™ system utilizes a strain of pseudomonas sp., which is a naturally
occurring, non-pathogenic, gram negative, Class 1, facultative bacteria, to reduce oxidized
selenium (Se4+, Se6+) to its elemental form (Se0; Garbisu et al., 1996; Sonstegard, GE
Microbiologist, personal communication, 2011). Macy et al. (1989) were the first to describe the
selenium-respiring bacteria pseudomonas sp. for reduction purposes. High concentrations of
selenium oxyanions have not affected the growth of the pseudomonas species during the
reduction to elemental selenium (Hunter and Manter, 2009; Hunter and Manter, 2011).
Elemental selenium is highly insoluble, has low toxicity levels, is less bio-available to aquatic
biota, immobile, and is stable over a wide pH range under reducing conditions (Masscheleyn et

25
al., 1991; Allen et al., 1993; Iskandar et al., 2001; Lenz et al., 2008; Dey and Kulkarni, 2010).
Factors such as influent water quality, temperature, pH, total suspended solids (TSS), and
influent flow rates are used to determine the specific strains of pseudomonas sp. used in site-
specific beds (Sonstegard and Pickett, 2005; Harwood, GE Water, personal communication,
2010). Following bench-scale tests, the selected bacteria strains are used to inoculate on-site
pilot test bioreactors (Sonstegard and Pickett, 2005). Results from these pilot tests are then used
to finalize full-scale design and operation (Sonstegard and Pickett, 2005).
Following selection, these microbes are inoculated in a packed bed bioreactor filled with
granular activated carbon (GAC; Dey and Kulkarni, 2010). Inoculation “seeding” consists of
spreading the bacteria over the top of the bioreactor bed and allowing them to grow and colonize
within. Due to carbon’s large, irregular surface area, the carbon provides an ideal growth
medium and protects the microbes from sheer and abrasive force, which prevents the bacteria
from being washed out of the bioreactor (Pickett et al., 2006). This protective environment
allows the bacteria to colonize and form a fixed biological film on the GAC called a “biomatrix”
(Pickett et al., 2006; Sonstegard et al., 2010). The biomatrix provides a more stable selenium
effluent concentration when upset conditions are encountered (Pickett et al., 2006; Sonstegard et
al., 2010). Upset conditions may include fluctuations in temperature, pH, influent flow, and/or
influent selenium concentrations.
Depending on the influent pH of the wastestream, sulfuric acid or caustic soda may need
to be mixed with the influent to obtain a pH between 7.5 to 8.0. A neutral influent pH ensures
proper functioning of the microbes and prevents scaling within the bioreactors. A molasses-
based nutrient source is mixed with the influent after pH neutralization and prior to entering the
bioreactor. The molasses acts as the carbon and energy source for the microbes (Harwood, GE

26
Water, personal communication, 2010). The molasses also acts as an electron donor and is
oxidized during the reduction of oxyanions, and has proven to be an inexpensive and effective
energy source for several species of selenium-reducing bacteria (Zhang and Frankenberger,
2006; Zhang et al., 2008). Molasses from sugar cane consists of sucrose (~ 36 %), dextrose (~
12 %), fructose (~ 6 %), and glucose (~ 3 %) in solution (USSC, 2011). The molasses dosage
concentration is dependent upon the influent wastewater quality (Sonstegard et al., 2008). As
selenium and nitrate influent concentrations increase, or as influent temperatures decrease, the
influent molasses concentration will also need to increase (Pickett et al., 2006; Sonstegard et al.,
2008). Since nitrates are reduced prior to selenium reduction, the amount of molasses is
dependent on the nitrate concentration in the wastewater stream (EPRI, 2006c). A study
conducted by Zhang et al. (2008) reported most effective bio-reduction with 0.1 to 0.2 %
molasses influent concentrations. Other carbon sources used for bio-reduction include acetate,
ethanol, glucose, lactate, methanol, rice straw, and fermented whey (Doran and Alexander, 1977;
Cantafio et al., 1996; Bledsoe et al., 1999; Fujita et al., 2002; Zhang and Frankenberger, 2003).
Once reduced in anaerobic conditions, the insoluble elemental selenium will precipitate
onto the biomass (Figure 1-4) within the bioreactor (Sonstegard and Pickett, 2005). This
precipitation of elemental selenium is a key feature of the ABMet™ system. Without removal,
elemental selenium could re-oxidize once it re-enters an aquatic environment (Zhang et al.,
2004). Precipitated elemental selenium (Se0) can be identified on the GAC by its amorphous
nanospheres, which are reddish in color and 200 to 400 nanometers in diameter (Fujita et al.,
2002; Oremland et al., 2004; Lenz et al., 2008). The precipitated Se0 remains in the bed,
collecting in the biomatrix, until the bed is backwashed (Sonstegard et al., 2008). Some current

27
full-scale backwash ponds have been designed to hold 20 years of backwash solids (Sonstegard
et al., 2008).
The ABMet™ bioreactors are not pressure filters. The waste stream flows naturally,
from top to bottom via distribution headers, to ensure correct contact retention time between the
wastewater and the biomatrix (Harwood, GE Water, personal communication, 2010). Retention
time varies from 2 to 12 hours depending on certain parameters such as water chemistry, TSS,
temperature, and effluent standards (Pickett et al., 2006; Sonstegard and Pickett, 2006; Dey and
Kulkarni, 2010). Constraints imposed on the influent wastewater include nitrate-N (< 250 mg L-
1), chloride (< 25,000 mg L-1), TSS (< 250 mg L-1), temperature (1 to 40 ºC), pH (6 to 9), and
total dissolved solids (< 150,000 mg L-1; GE, 2011). The ABMet™ system has also been shown
to reduce the levels of arsenic, copper, hexavalent chromium, nickel, nitrate, zinc, and mercury
from the waste stream during the bio-reduction process (Sonstegard and Pickett, 2005; Harwood,
GE Water, personal communication, 2010). However, a case study performed by EPRI (2006c)
reported that ammonia and organic nitrogen were not effectively removed from the waste stream
by the ABMet™ bioreactors.
The ABMet™ system utilizes facultative bacteria that are capable of both aerobic and
anaerobic respiration (Sonstegard et al., 2010). Wastewater entering the bioreactor will have a
positive ORP ranging from +200 to +300mV (Sonstegard et al., 2008). As the wastewater
travels downward, oxygen is respired and the ORP decreases to near 0 mV (Sonstegard et al.,
2010). The loss of oxygen forces the bacteria to begin respiring oxyanion electron acceptors
such as NO3-, Se04
2-, Se032-, and SO4
2- (Sonstegard et al., 2008). The reduction of electron
acceptors is essential for the growth of the bacteria and creates a multi-layered, gradually
28
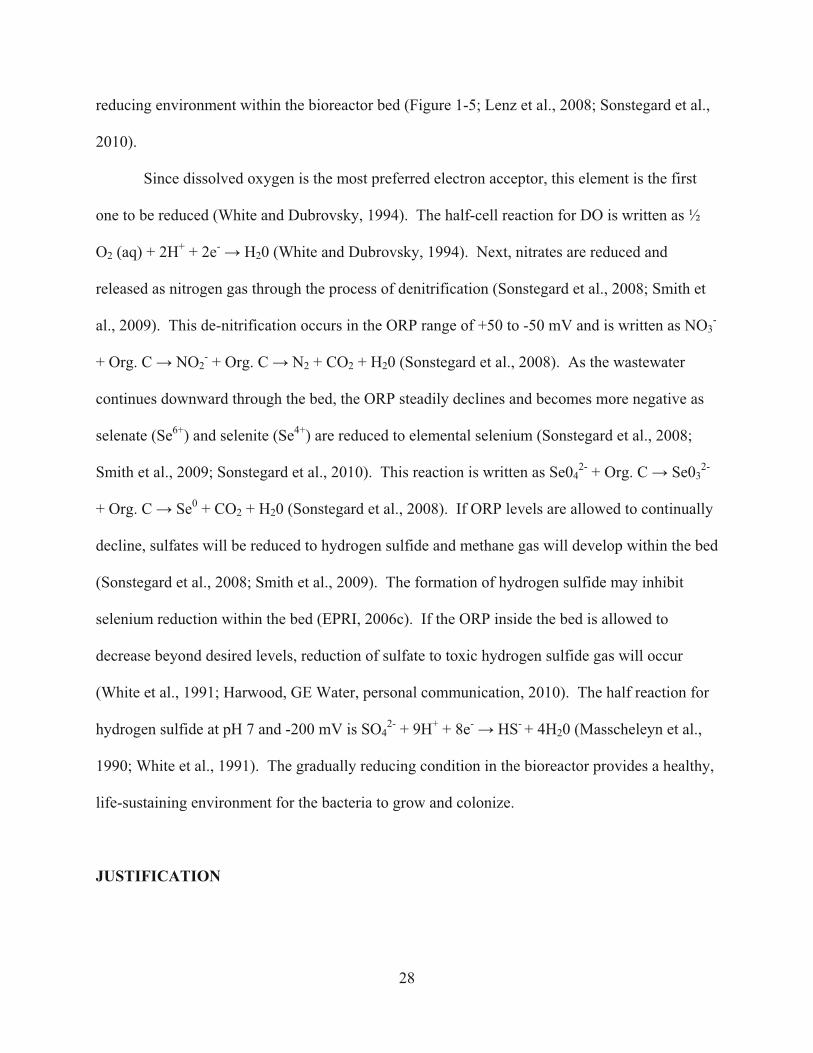
reducing environment within the bioreactor bed (Figure 1-5; Lenz et al., 2008; Sonstegard et al.,
2010).
Since dissolved oxygen is the most preferred electron acceptor, this element is the first
one to be reduced (White and Dubrovsky, 1994). The half-cell reaction for DO is written as ½
O2 (aq) + 2H+ + 2e- � H20 (White and Dubrovsky, 1994). Next, nitrates are reduced and
released as nitrogen gas through the process of denitrification (Sonstegard et al., 2008; Smith et
al., 2009). This de-nitrification occurs in the ORP range of +50 to -50 mV and is written as NO3-
+ Org. C � NO2- + Org. C � N2 + CO2 + H20 (Sonstegard et al., 2008). As the wastewater
continues downward through the bed, the ORP steadily declines and becomes more negative as
selenate (Se6+) and selenite (Se4+) are reduced to elemental selenium (Sonstegard et al., 2008;
Smith et al., 2009; Sonstegard et al., 2010). This reaction is written as Se042- + Org. C � Se03
2-
+ Org. C � Se0 + CO2 + H20 (Sonstegard et al., 2008). If ORP levels are allowed to continually
decline, sulfates will be reduced to hydrogen sulfide and methane gas will develop within the bed
(Sonstegard et al., 2008; Smith et al., 2009). The formation of hydrogen sulfide may inhibit
selenium reduction within the bed (EPRI, 2006c). If the ORP inside the bed is allowed to
decrease beyond desired levels, reduction of sulfate to toxic hydrogen sulfide gas will occur
(White et al., 1991; Harwood, GE Water, personal communication, 2010). The half reaction for
hydrogen sulfide at pH 7 and -200 mV is SO42- + 9H+ + 8e- � HS- + 4H20 (Masscheleyn et al.,
1990; White et al., 1991). The gradually reducing condition in the bioreactor provides a healthy,
life-sustaining environment for the bacteria to grow and colonize.
JUSTIFICATION
29
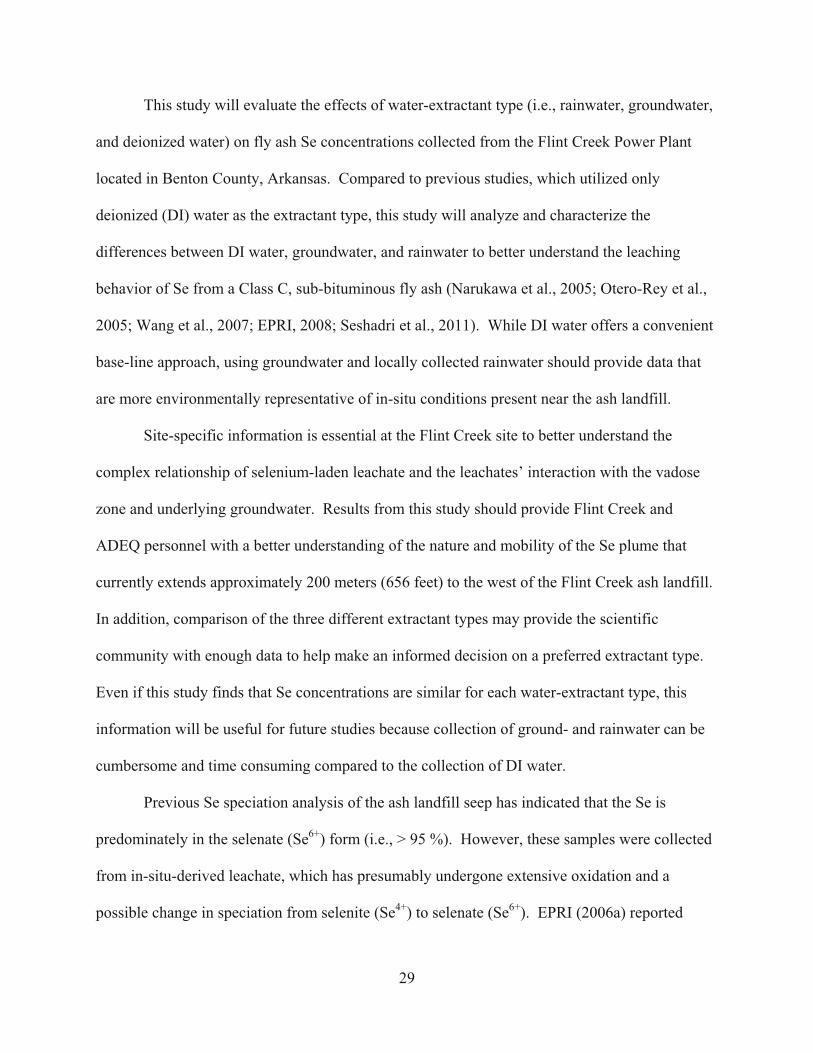
This study will evaluate the effects of water-extractant type (i.e., rainwater, groundwater,
and deionized water) on fly ash Se concentrations collected from the Flint Creek Power Plant
located in Benton County, Arkansas. Compared to previous studies, which utilized only
deionized (DI) water as the extractant type, this study will analyze and characterize the
differences between DI water, groundwater, and rainwater to better understand the leaching
behavior of Se from a Class C, sub-bituminous fly ash (Narukawa et al., 2005; Otero-Rey et al.,
2005; Wang et al., 2007; EPRI, 2008; Seshadri et al., 2011). While DI water offers a convenient
base-line approach, using groundwater and locally collected rainwater should provide data that
are more environmentally representative of in-situ conditions present near the ash landfill.
Site-specific information is essential at the Flint Creek site to better understand the
complex relationship of selenium-laden leachate and the leachates’ interaction with the vadose
zone and underlying groundwater. Results from this study should provide Flint Creek and
ADEQ personnel with a better understanding of the nature and mobility of the Se plume that
currently extends approximately 200 meters (656 feet) to the west of the Flint Creek ash landfill.
In addition, comparison of the three different extractant types may provide the scientific
community with enough data to help make an informed decision on a preferred extractant type.
Even if this study finds that Se concentrations are similar for each water-extractant type, this
information will be useful for future studies because collection of ground- and rainwater can be
cumbersome and time consuming compared to the collection of DI water.
Previous Se speciation analysis of the ash landfill seep has indicated that the Se is
predominately in the selenate (Se6+) form (i.e., > 95 %). However, these samples were collected
from in-situ-derived leachate, which has presumably undergone extensive oxidation and a
possible change in speciation from selenite (Se4+) to selenate (Se6+). EPRI (2006a) reported

30
similar results indicating in-situ leaching of sub-bituminous coal fly ash (i.e., weathered fly ash)
usually resulted in selenate (Se6+) as the dominate species present. On the other hand, sub-
bituminous coal fly ash samples collected directly from ash handling systems (i.e., fresh fly ash)
have resulted in selenite (Se4+) as the dominate species present (Narukawa et al., 2005; Huggins
et al., 2007; Wang et al., 2007). Speciation is important because selenate (Se6+) is less toxic, but
more mobile in an aqueous environment than selenite (Se4+).
The focus of this research was on the leaching characteristics of Se from coal fly ash;
however, many similarities exist between fly ash Se, As, and Cr concentrations, speciation, and
mobility within the environment. The volatility and re-condensation characteristics are also
similar, with Se being the most volatile followed by As and then Cr (Xu, 2003). In the
environment, Se and As behave similarly due to their oxy-anionic species that can exist.
Selenium can exist as selenate (Se6+) and selenite (Se4+), while As can exist as arsenate (As5+)
and arsenite (As3+). Chromium differs slightly because Cr can exist as cationic and anionic
species, forming both trivalent (Cr3+) and hexavalent (Cr6+) Cr (EPRI, 2011). In the aquatic
environment, Se and As toxicity are similar with the more oxidized species selenate (Se6+) and
arsenate (As5+) being less toxic than selenite (Se4+) and arsenite (As3+); in contrast, the more
oxidized hexavalent (Cr6+) Cr is more toxic than trivalent (Cr3+) Cr (EPRI, 2005). Furthermore,
the more oxidized species of Se, As, and Cr are dominate under alkaline and mildly to strongly
oxidizing conditions, while the less oxidized species tend to be dominate under acidic conditions.
Previous research on subbituminous Powder River Basin (PRB) fly ash landfill leachates
determined that the most oxidized species (i.e., Se6+, As5+, and Cr6+) were the dominate species
present and exhibited greater mobility, except for arsenate (As5+; EPRI, 2006a). Once released
into the environment, reactions with Fe and Ca are similar for Se and As, while Se, As, and Cr

31
can all be incorporated into ettringite [Ca6Al2(SO4)3(OH)12 - 26H2O] by substitution with the
sulfate ion (Hassett and Pflughoeft-Hassett, 2002). Therefore, due to these similarities, it is
relevant to simultaneously study As and Cr along with Se.
OBJECTIVES
The primary objective of this study is to evaluate Se leaching characteristics from a Class
C, sub-bituminous fly ash using three different water-extractants (i.e., rainwater, groundwater,
and DI water).
The second objective of this study is to compare the leaching characteristics of fly ash
collected directly from the hot-side precipitators (i.e., fresh fly ash) to samples collected from
within the Flint Creek ash landfill (i.e., weathered fly ash), which have already undergone an
unknown amount of leaching. The goal of this comparison is to determine if differences exist
between fresh and weathered samples. Evaluating this data may help quantify the amount of Se
that has already leached from the weathered fly ash compared to fresh samples.
The third objective is to compare extraction times of 2 and 6 hours.
TESTABLE HYPOTHESES
The first hypothesis is the water-extractable Se concentration should be greatest with DI
water as the extractant type compared to rain- and groundwater. Water-extractable Se
concentrations between rain- and groundwater should not differ significantly. Hypothesis 2 is
that fly ash collected directly from the precipitator will have a lower water-extractable Se
concentration when compared to fly ash that has been weathered at the ash landfill. Hypothesis
3 is that no significant differences will exist between extraction times of 2 and 6 hours.

32
Hypothesis 1 is expected to hold true because pH and buffering capacity of the extractant
type should be a controlling factor for Se extraction. The Flint Creek fly ash is alkaline in nature
(pH = 11.5); and extractable Se concentrations have been observed to be the greatest at a pH of
near 12. Due to DI water’s low buffering capacity, the DI water should result in a more alkaline
pH extraction solution compared to rain- and groundwater. Furthermore, DI water will have the
lowest solute concentration compared to that of rain- and groundwater. Solutes, such as Ca, have
been shown to inhibit Se leaching from sub-bituminous coal fly ash (EPRI, 2005; Wang et al.,
2007; EPRI, 2008; Wang et al., 2009). Pre- and post-fly-ash Se concentrations will be used to
determine the percent Se extracted from the fly ash, which will be the readily soluble fraction.
With Hypothesis 2, three factors must be taken into consideration when determining Se
water-extaction: initial Se concentration, initial Ca concentration, and Se speciation. Fresh
samples collected directly from the precipitator are expected to have greater initial Se
concentrations present, when compared to that of fly ash stored in the landfill. Fly ash that has
been stored in the landfill is expected to have already undergone a certain amount of Se water-
extraction. Therefore, greater initial Se concentrations should be positively correlated with
increased extraction (Iwashita et al., 2005). However, fresh samples should have a greater
concentration of Ca present compared to the weathered samples, which have undergone
weathering, cementation, and some leaching of Ca (Wang et al., 2009). Therefore, a decreased
Ca concentration in the weathered samples should result in greater Se leaching. Another factor
to consider is the speciation of the Se present in the fresh and weathered fly ash. Greater
leaching from the weathered samples may occur if selenate (Se6+) is the dominate species present
in the weathered samples and selenite (Se4+) in the fresh samples.

33
Hypothesis 3 is expected to be true because research by Mattigod and Quinn (2003)
reported no significant change in Se extractability from 1.5 to 24 hours. Therefore, no
significant differences should be noted from 2 to 6 hours extraction time.

34
REFERENCES Adams, D.J., P.B. Altringer, and W.D. Gould. 1993. Bioreduction of selenate and selenite. p. 755–771. In Torma, A.E., M.L. Apel, and C.E. Brierly (eds.) Biohydrometallurgical Technologies: Proc. Int. Biohydrometallurgy Symp. Jackson Hole, WY. 22-25 Aug. 1993. The Minerals, Metals, and Material Soc. Warrensdale, PA. Ahlrichs, J.S., and L.R. Hossner. 1987. Selenate and selenite mobility in overburden by saturated flow. J. Environ. Qual. 16:95-98. Ahlrichs, J.S., and L.R. Hossner. 1989. Self-diffusion of selenate and selenite in overburden. J. Environ. Qual. 18:479-482. Alemi, M.H., D.A. Goldhamer, and D.R. Nielsen. 1988. Selenate transport in steady-state, water- saturated soil columns. J. Environ. Qual. 17:608-613. Allen, H.E., E.M. Perdue, D.S. Brown, J.A. Davis, D.B. Kent, B.A. Rea, A.S. Maest, and S.P. Garabedian. 1993. Metals in groundwater. Lewis Publishers, New York. American Coal Ash Association (ACAA). 2011. Corrected 2009 coal combustion product (CCP) production and use survey. Available at http://acaa.affiniscape.com/ associations/8003/files/2009_CCP_Production_Use_Survey_Corrected_020811.pdf (verified 03 Mar. 2014). American Society for Testing and Materials (ASTM). 2006. Standard test methods for sampling and testing fly ash or natural pozzolans for use in portland-cement concrete: ASTM C311. Available at http://www.astm.org.standards/C311.htm (verified 03 Mar. 2014). Andren, A.W., and D.H. Klein. 1975. Selenium in coal-fired steam plant emissions. Environ. Sci. Technol. 9:856-858. Astratinei, V., E.V. Hullesbusch, and P. Lens. 2006. Bioconversion of selenate in methanogenic anaerobic granular sludge. J. Environ. Qual. 35:1873-1883. Barceloux, D. 1999. Selenium. J. Toxicol. Clin. Toxicol. 37:145-172. Blankinship, S. 2009. “Bugs” used to treat FGD wastewater. Power-Gen Worldwide. Available at http://www.powergenworldwide.com (verified 3 Feb. 2014). Bledsoe, T.L., A.W. Cantafio, and J.M. Macy. 1999. Fermented whey- an inexpensive feed source for a laboratory-scale selenium-bioremediation reactor system inoculated with Thauera selenatis. Appl. Microbiol. Biotechnol. 51:682-685. Bool, L.E., and J.J. Helble. 1995. A laboratory study of the partitioning of trace elements during pulverized coal combustion. Energy Fuels 9:880-887.

35
Cantafio, A.W., K.D. Hagen, G.E. Lewis, T.L. Bledsoe, K.M. Nunan, and J.M. Macy. 1996. Pilot-scale selenium bioremediation of San Joaquin drainage water with thauera selenatis. Appl. Environ. Microbiol. 62:3298-3303. Catal, T., H. Bermek, and H. Liu. 2009. Removal of selenite from wastewater using microbial fuel cells. Biotechnol. Lett. 31:1211-1216. Chapman, P.M., W.J. Adams, M.L. Brooks, C.G. Delos, S.N. Luoma, W.A. Maher, H.M. Ohlendorf, T.S. Presser, and D.P. Shaw. 2009. Ecological assessment of selenium in the aquatic environment: Summary of a SETAC Pellston workshop. Soc. Environ.Toxicol. Chem. (SETAC). Available at http://www.setac.org/sites/ default/files/SELSummary.pdf (verified 03 Mar. 2014). Coleman L., L.J. Bragg, and R.B. Finkelman. 1993. Distribution and mode of occurrence of selenium in US coals. Environ. Geochem. Health 15:215-226. Dey, A., and R. Kulkarni. 2010. Selenium removal from refinery wastewater. UltraPure Water. Available at http://www.ultrapurewater.com (verified 4 Feb, 2014). Dhillon, S.K., and K.S. Dhillon. 2000. Selenium adsorption in soils as influenced by different anions. J. Plant Nutr. Soil Sci. 163:577-582. Doran, J.W., and M. Alexander. 1977. Microbial transformation of selenium. Appl. Environ. Microbiol. 33:31-37. Electric Power Research Institute (EPRI). 1984. Testing and correlation of fly ash properties with respect to pozzolanic behavior. Available at http://www.epri.com (verified 03 Mar. 2014). CS-3314. Electric Power Research Institute (EPRI). 1987. Chemical characterization of fossil fuel combustion wastes. Available at http://www.epri.com (verified 03 Mar. 2014). EA-5321. Electric Power Research Institute (EPRI). 1994a. Chemical attenuation of selenium. Available at http://www.epri.com (verified 03 Mar. 2014). TB-2485-3. Electric Power Research Institute (EPRI). 1994b. Coal ash disposal manual: Third edition. Available at http://www.epri.com (verified 03 Mar. 2014). TR-104137. Electric Power Research Institute (EPRI). 2005. Arsenic and selenium speciation in fly ash and wastewater. Available at http://www.epri.com (verified 03 Mar. 2014). TR-1005567. Electric Power Research Institute (EPRI). 2006a. Characterization of field leachates at coal combustion product management sites: arsenic, selenium, chromium, and mercury speciation. Available at http://www.epri.com (verified 03 Mar. 2014). TR-1012578.

36
Electric Power Research Institute (EPRI). 2006b. Fate and effects of selenium in lentic and lotic systems. Available at http://www.epri.com (verified 03 Mar. 2014). TR-1005315. Electric Power Research Institute (EPRI). 2006c. Review of water treatment technologies for selenium removal implemented at power plants. Available at http://www.epri.com (verified 03 Mar. 2014). TR-1020813. Electric Power Research Institute (EPRI). 2008. The leaching behavior of arsenic and selenium from coal fly ash. Available at http://www.epri.com (verified 03 Mar. 2014). TR- 1015545. Electric Power Research Institute (EPRI). 2010. Pilot-scale and full scale evaluation of treatment technologies for the removal of mercury and selenium in flue gas desulphurization water. Available at http://www.epri.com (verified 4 Feb. 2014). TR- 1017955. Electric Power Research Institute (EPRI). 2011. Chromium in coal combustion products. Available at http://www.epri.com (verified 10 Feb. 2014). TB-1022143. Electric Power Research Institute (EPRI). 2013. Chemical constituents in coal combustion product leachate: Selenium. Available at http://www.epri.com (verified 27 Feb. 2014). TR-3002001237. Elrashidi, M.A., D.C. Adriano, S.M. Workman, and W.L. Lindsay. 1987. Chemical equilibria of selenium in soils: A theoretical development. Soil Sci. 144:141-152. Environmental Protection Agency (EPA). 2011. Groundwater and drinking water standards. Available at http://water.epa.gov/drink/index.cfm (verified 03 Mar. 2014). Fan, T.W., S.J. Teh, D.E. Hinton, and R.M. Higashi. 2002. Selenium biotransformations into proteinaceous forms by foodweb organisms of selenium-laden drainage waters in California. Aquat. Toxicol. 57:65-84. Fio, J.L., R. Fujii, and S.J. Deverel. 1991. Selenium mobility and distribution in irrigated and non-irrigated alluvial soils. Soil Sci. Soc. Am. J. 55:1313-1320. Fizette, H.H. 2005. Development of concrete composites by synergistically using Illinois PCC bottom ash and class C fly ash. PhD. Diss. Southern Illinois University, Carbondale, IL. Flury, M., W.T. Frankenbeger Jr., and W.A. Jury. 1997. Long-term depletion of selenium from Kesterson dewatered sediments. Sci. Total Environ. 198:259-270. Fordyce, F.M. 2005. Selenium deficiency and toxicity in the environment. p. 373-415. In Essentials of Medical Geology. London: Elsevier. Fordyce, F.M. 2007. Selenium geochemistry and health. Ambio 36:94-97.
37
Frost, R.R., and R.A. Griffin. 1977. Effect of pH on adsorption of arsenic and selenium from landfill leachate by clay-minerals. Soil Sci. Soc. Am. J. 41:53-57. Fujita, M., M. Ike, M. Kashiwa, R. Hashimoto, and S. Soda. 2002. Laboratory-scale continuous reactor for soluble selenium removal using selenate-reducing bacterium, bacillus sp. sf-1. Biotechnol. Bioeng. V. 80(7):755-760. Garbisu, C., T. Ishii, T. Leighton, and B.B. Buchanan. 1996. Bacterial reduction of selenite to elemental selenium. Chem. Geol. 132:199-204. General Electric Power & Water (GE). 2010. ABMet- Advanced biological metals removal process. Available at http://www.gewater.com (verified 3 Feb. 2014). General Electric Power & Water (GE). 2011. ABMet: Frequently asked questions. Available at http://www.gewater.com (verified 4 Feb. 2014). Goh, K.H., and T.T. Lim. 2004. Geochemistry of inorganic arsenic and selenium in a tropical soil: Effect of reaction time, pH, and competitive anions on arsenic and selenium adsorption. Chemosphere 55:849-859. Goldberg, S., S. Hyun, and L.S. Lee. 2008. Chemical modeling of arsenic (III, V) and selenium (IV, VI) adsorption by soils surrounding ash disposal facilities. Vadose Zone J. 7:1231- 1238. Golder & Associates. 2009. Literature review of treatment technologies to remove selenium from mining influenced water. Available at http://www.golder.com (verified 4 Feb. 2014). Hassett, D. J., and D.F. Pflughoeft-Hassett. 2002. Evaluating coal combustion by- products (CCBs) for environmental performance. In “Coal Combustion By-Products and Western Coal Mines: A Technical Interactive Forum”. Hayashi, H., K. Kanie, K. Shinoda, A. Muramatsu, S. Suzuki, and H. Sasaki. 2009. pH- dependence of selenate removal from liquid phase by reductive Fe(II)-Fe(III) hydroxysulfate compound, green rust. Chemosphere 76:638-643. Herbel, M.J., J.S. Blum, and R.S. Oremland. 2003. Reduction of elemental selenium to selenide: Experiments with anoxic sediments and bacteria that respire Se-oxyanions. Geomicrobiol. J. 20:587-602. Higashi, R.M., T.A. Cassel, J.P. Skorupa, and T.W. Fan. 2005. Remediation and bioremediation of selenium contaminated waters. p. 355-360. In Lehr, J.H., J. Keeley, and J. Lehr (eds.) Water Encyclopedia: Water Quality and Resource Development. John Wiley & Sons, New York.

38
Huang, Y., B. Jin, Z. Zhong, R. Xiao, Z. Tang, and H. Ren. 2004. Trace elements (Mn, Cr, Pb, Se, Zn, Cd, and Hg) in emissions from a pulverized coal boiler. Fuel Process Technol. 86:23-32. Huggins, F., C.L. Senior, P. Chu, K. Ladwig, and G.P. Huffman. 2007. Selenium and arsenic speciation on fly ash from full-scale coal-burning utility plants. Environ. Sci. Technol. 41:3284-3289. Hunter, W.J., and D.K. Manter. 2009. Reduction of selenite to elemental red selenium by Pseudomonas sp. strain CA5. Curr. Microbiol. 58:493-498. Hunter, W.J., and D.K. Manter. 2011. Pseudomonas seleniipraecipitatus sp. nov.: A selenite reducing y-Proteobacteria isolated from soil. Curr. Microbiol. 62:565-569. Hyun, S., P.E. Burns, I. Murarka, and L.S. Lee. 2006. Selenium (IV) and (VI) sorption by soils surrounding fly ash management facilities. Vadose Zone J. 5:1110-1118. Ike, M., K. Takahashi, T. Fujita, M. Kashiwa, and M. Fujita. 2000. Selenate reduction by bacteria isolated from aquatic environments free from selenium contamination. Water Resour. 34:3019-3025. Iskandar, I.K., K.S. Dhillon, and S.K. Dhillon. 2001. Environmental restoration of metals- contaminated soils. Lewis Publishers, New York. Iwashita, A., Y. Sakaguchi, T. Nakajima, H. Takanashi, A. Ohki, and S. Kambara. 2005. Leaching characteristics of boron and selenium for various coal fly ashes. Fuel 84:479- 485. Jayaweera, G.R., and J.W. Biggar. 1996. Role of redox potential in chemical transformations of selenium in soils. Soil Sci. Soc. Am. J. 60:1056-1063. Kashiwa, M., S. Nishimoto, K. Takahashi, M. Ike, and M. Fujita. 2000. Factors affecting soluble selenium removal by a selenate-reducing bacterium Bacillus sp. SF-1. J. Biosci. Bioeng. 89:528-533. Kitto, J.B., and S.C. Stultz. 2005. Steam its generation and use: 41st Edition. Babcock & Wilcox Company, Barberton. Lee, J.H., J. Han, H. Choi, and H.G. Hur. 2007. Effects of temperature and dissolved oxygen on Se(IV) removal and Se(0) precipitation by Shewanella sp. HN-41. Chemosphere 68:1898-1905. Lemly, A.D. 1999. Selenium impacts on fish: An insidious time bomb. Hum. Ecol. Risk Assess. 5:1139-1151.
39
Lemly, A.D. 2002. Symptoms and implications of selenium toxicity in fish: The Belews lake case example. Aquat. Toxicol. 57:39-49. Lenz, M., E.D. Van Hullebusch, G. Hommes, P. Corvini, and P. Lens. 2008. Selenate removal in methanogenic and sulfate-reducing upflow anaerobic sludge bed reactors. Water Research 42:2184-2194. Lopez-Anton, M.A., M. Diaz-Somoano, D.A. Spears, and M.R. Martinez-Tarazona. 2006. Arsenic and selenium capture by fly ashes at low temperature. Environ. Sci. Technol. 40:3947-3951. Lopez-Anton, M.A., M. Diaz-Somoano, J.L.G. Fierro, and M.R. Martinez-Tarazona. 2007. Retention of arsenic and selenium compounds present in coal combustion and gasification flue gases using activated carbons. Fuel Process. Technol. 88:799-805. Lou, Y., D.E. Giammar, B.L. Huhmann, and J.G. Catalano. 2011. Speciation of selenium, arsenic, and zinc in class C fly ash. Energy Fuels 25:2980-2987. Lovley, D.R. 1993. Dissimilatory metal reduction. Annu. Rev. Microbiol. 47:263- 290. Macy, J.M., T.A. Michel, and D.G. Kirsch. 1989. Selenate reduction by Pseudomonas species: A new mode of anaerobic respiration. FEMS Microbiol. Lett. 61:195-198. Maiers, D.T., P.L. Wichlacz, D.L. Thompson, and D.F. Bruhn. 1988. Selenate reduction by bacteria from a selenium-rich environment. Appl. Environ. Microbiol. 54:2591-2593. Masscheleyn, P.H., R.D. Delaune, and W.H. Patrick Jr. 1990. Transformations of selenium as affected by sediment oxidation-reduction potential and pH. Environ. Sci. Technol. 24:91- 96. Masscheleyn, P.H., R.D. Delaune, and W.H. Patrick Jr. 1991. Arsenic and selenium chemistry as affected by sediment redox potential and pH. J. Environ. Qual. 20:552-527. Mattigod, S.V. and T.R. Quinn. 2003. Selenium content and oxidation states in fly ashes from western US coals. 2003. p. 143-153. In Sajwan et al., (eds). Chemistry of Trace Elements In Fly Ash. New York. Morrison, R.E. 1970. Ash utilization: A review of ash specifications. US Bureau of Mines. Information Circular. 8488:24-31. Narasingarao, P., and M.M. Haggblom. 2007. Identification of anaerobic selenate- respiring bacteria from aquatic sediments. Appl. Environ. Microbiol. 73:3519-3527.
40
Narukawa, T., A. Takatsu, K. Chiba, K.W. Riley, and D.H. French. 2005. Investigation on chemical species of arsenic, selenium, and antimony in fly ash from coal fuel thermal power stations. J. Environ. Monit. 7:1342-1348. Neal, R.H., and G. Sposito. 1989. Selenate adsorption on alluvial soils. Soil Science Soc. Am. J. 53:70-74. Noda, N., and S. Ito. 2008. The release and behavior of mercury, selenium, and boron in coal combustion. Powder Technol. 180:227-231. Oremland, R.S., J.T. Hollibaugh, A.S. Maest, T.S. Presser, L.G. Miller, and C.W. Culbertson. 1989. Selenate reduction to elemental selenium by anaerobic bacteria in sediments and culture: Biogeochemical significance of a novel, sulfate-independent respiration. Appl. Environ. Microbiol. 55:2333-2343. Oremland, R.S., J.S. Blum, C.W. Culbertson, P.T. Visscher, L.G. Miller, P. Dowdle, and F.E. Strohmaier. 1994. Isolation, growth, and metabolism of an obligately anaerobic selenate- respiring bacterium, strain SES-3. Appl. Environ. Microbiol. 60:3011-3019. Oremland, R.S., M.J. Herbel, J.S. Blum, S. Langley, T.J. Beveridge, P.M. Ajayan, T. Sutto, A.V. Ellis, and S. Curran. 2004. Structural and spectral features of selenium nanospheres produced by Se-respiring bacteria. Appl. Environ. Microbiol. 70:52-60. Otero-Rey, J.R., J.M. Lopez-Vilarino, J. Moreda-Pineiro, E. Alonso-Rodriguez, S. Muniategui-Lorenzo, P. Lopez-Mahia, and D. Prada-Rodriguez. 2003. As, Hg, and Se flue gas sampling in a coal-fired power plant and their fate during coal combustion. Environ. Sci. Technol. 37:5262-5267. Otero-Rey, J.R., M.J. Mato-Fernandez, J. Moreda-Pineiro, E. Alonso-Rodriguez, S. Muniategui-Lorenzo, P. Lopez-Mahia, and D. Prada-Rodriguez. 2005. Influence of several experimental parameters on As and Se leaching from coal fly ash samples. Anal. Chim. Acta 531:299-305. Peak, D., and D.L. Sparks. 2002. Mechanisms of selenate adsorption on iron oxides and hydroxides. Environ. Sci. Technol. 36:1460-1466. Pickett, T., J. Sonstegard, and B. Bonkoski. 2006. Using biology to treat selenium. Power Engineering. Available at http://www.powergenworldwide.com (verified 3 Feb. 2014). Rovira, M., J. Gimenez, M. Martinez, X. Martinez-Llado, J. Pablo, V. Marti, and L. Duro. 2008. Sorption of selenium (IV) and selenium (VI) onto natural iron oxides: Geothite and hematite. J. Hazard. Mater. 150:279-284. Sarathchandra, S.U., and J.H. Watkinson. 1981. Oxidation of elemental selenium to selenite by Bacillus megaterium. Science 211:600-601.

41
Sargent and Lundy Engineers. 1974. Flint Creek power plant environmental report. Chicago, IL. Sayiri, S.R.K. 2005. Utilization of Wyoming bottom ash in asphalt mixes. Diss. University of Wyoming, Laramie, WY. Senior, C., B.V. Otten, J. Wendt, and A. Sarofim. 2010. Modeling the behavior of selenium in pulverized-coal combustion systems. Combust. Flame 157:2095-2105. Seshadri, P., D. Sisk, F. Bowman, S. Benson, and W. Seames. 2011. Leachability of arsenic and selenium in submicron coal fly ash. World of Coal Ash Conference. Available at http:// www.flyash.info/ (verified 03 Mar. 2014). Sheha, R.R., and E.A. El-Shazly. 2010. Kinetics and equilibrium modeling of Se (IV) removal from aqueous solutions using metal oxides. Chem. Eng. J. 160:63-71. Siddique, T., Y. Zhang, B.C. Okeke, and W.T. Frankenberger Jr., 2006. Characterization of sediment bacteria involved in selenium reduction. Bioresour. Technol. 97:1041-1049. Siddique, T., J.M. Arocena, R.W. Thring, and Y. Zhang. 2007. Bacterial reduction of selenium in coal mine tailings pond sediment. J. Environ. Qual. 36:621-627. Skorupa, J.P. 1998. Selenium poisoning of fish and wildlife in nature: Lessons from twelve real- world examples. p. 315-354. In Frankenberger, W.T., and R.A. Engberg (eds.) Environmental Chemistry of Selenium. Marcel Dekker, New York. Smith, K., A.O. Lau, and F.W. Vance. 2009. Evaluation of treatment techniques for selenium removal. International Water Conference. IWC-09-05. Sonstegard, J., and T. Pickett. 2005. ABMet biological selenium removal from FGD wastewater. International Water Conference. IWC-05-72. Available at http://www.regulations.gov/ fdmspublic (verified 4 Feb. 2014). Sonstegard, J., T. Pickett, J. Harwood, and D. Johnson. 2008. Full scale operation of GE ABMet biological technology for the removal of selenium from FGD wastewaters. International Water Conference. IWC-08-31. Sonstegard, J., J. Harwood, and T. Pickett. 2010. ABMet: Setting the standard for selenium removal. GE Water and Process Technologies. Water Environment Federation. IWC-10- XX. Available at http://www.wef.org (verified 3 Feb. 2014). Spallholz, J.E., and D.J. Hoffman. 2002. Selenium toxicity: Cause and effects in aquatic birds. Aquatic Toxicol. 57:27-37. Sposito, G.A. 1989. The chemistry of soils. Oxford University Press, New York.

42
Steinberg, N.A., and R.S. Oremland. 1990. Dissimilatory selenate reduction potentials in a diversity of sediment types. Appl. Environ. Microbiol. 56:3550-3557. Steinberg, N.A., J.S. Blum, L. Hochstein, and R.S. Oremland. 1992. Nitrate is a preferred electron acceptor for growth of freshwater selenate-respiring bacteria. Appl. Environ. Microbiol. 58:426-428. Stolz, J.F., and R.S. Oremland. 1999. Bacterial respiration of arsenic and selenium. FEMS Microbiol. Rev. 23:615-627. Tan, J.A., W.Y. Wang, D.C. Wang, and S.F. Hou. 1994. Adsorption, volatilization, and speciation of selenium in different types of soils in China. p. 47-67. In Frankenberger, W.T. Jr., and S. Benson (eds). Selenium in the Environment. New York. Tripodi, R.A., and P.N. Cheremisinoff. 1980. Coal ash disposal: Solid waste impacts. Technomic Pub. Co., Westport, CT. United States Energy Information Administration (EIA). 2011. Electric power annual. Available at http://www.eia.doe.gov/ (verified 03 Mar. 2014). United States Sugar Corporation (USSC). 2011. Molasses composition. Available at http://www. suga-lik.com/molasses/composition.html (verified 3 Feb. 2014). Wang, J., T. Wang, and J.G. Burken. 2007. The leaching characteristics of selenium from coal fly ashes. J. Environ. Qual. 36:1784-1792. Wang, T., J. Wang, Y. Tang, H. Shi, and K. Ladwig. 2009. Leaching characteristics of arsenic and selenium from coal fly ash: role of calcium. Energy Fuels 23:2959-2966. Wesche, K. 1991. Fly ash in concrete: Properties and performance. E & FN Spoon., Great Britian. White, A.F., and N.M. Dubrovsky. 1994. Chemical oxidation reduction controls on selenium mobility in groundwater systems. p. 185-221. In Frankenberger, W.T. Jr., and S. Benson (eds). Selenium in the Environment. New York. White, A.F., S.M. Benson, A.W. Yee, H.A. Wollenberg, and S. Flexser. 1991. Groundwater contamination at the Kesterson Reservoir, California, 2. Geo-chemical parameters influencing selenium mobility. Water Resour. Research 27:1085-1098. World Health Organization (WHO). 1996. Trace elements in human nutrition and health. Available at http://www.who.int/nutrition/publications/micronutrients/ 9241561734/ en/index.html (verified 03 Mar. 2014). Xu, M., R. Yan, C. Zheng, Y. Qiao, J. Han, and C. Sheng. 2003. Status of trace element emission in a coal combustion process : a review. Fuel Process. Technol. 85:215-237.

43
Yang, G., S. Wang, R. Zhou, and S. Sun. 1983. Endemic selenium intoxication of humans in China. Am. J. Clin. Nutr. 37:872-881. Yeheyis, M.B. 2008. Evaluation of coal fly ash for use in mine waste management. PhD.Diss. University of Western Ontario, Canada. Ylaranta, T. 1982. Volatilization and leaching of selenium added to soils. Ann. Agric. Fenn. 21:103-114. Zeng, T., and A.F. Sarofim. 2001. Vaporization of arsenic, selenium, and antimony during coal combustion. Combust. Flame 126:1714-1724. Zhang, N., D. Gang, P.E. Masce, and L.S. Lin. 2010. Adsorptive removal of parts per million level selenate using iron-coated GAC adsorbents. J. Environ. Eng. 136:1089-1095. Zhang, Y.Q., and W.T. Frankenberger Jr., 2003. Characterization of selenate removal from drainage water using rice straw. J. Environ. Qual. 2:441-446. Zhang, Y.Q., Z.A. Zahir, and W.T. Frankenberger Jr., 2004. Fate of colloidal-particulate elemental selenium in aquatic systems. J. Environ. Qual. 33:559-564. Zhang, Y.Q., and W.T. Frankenberger Jr., 2006. Removal of selenate in river and drainage waters by Citerobacter braakii enhanced with zero-valent iron. J. Agric. Food Chem. 346:280-285. Zhang, Y.Q., B.C. Okeke, and W.T. Frankenberger Jr., 2008. Bacterial reduction of selenate to elemental selenium utilizing molasses as a carbon source. Bioresour. Technol. 99:1267-1273.
�
�
�
�
�
�
�
�
�
�
�
�
�
�
�

44
�Figure 1-1. Basic diagram of the boiler at the Flint Creek Power Plant. Selenium that is naturally enriched in the coal volatizes upon combustion and is carried with the flue gas stream through the convective section of the boiler. The flue gas enters the convective section around 1371 ºC (2500 ºF) and cools to a temperature of 399 ºC (750 ºF) before exiting the convective section. Selenium will condense on the surface of the fly ash at temperatures below 500 ºC (932 ºF; Sargent and Lundy Engineers, 1974).
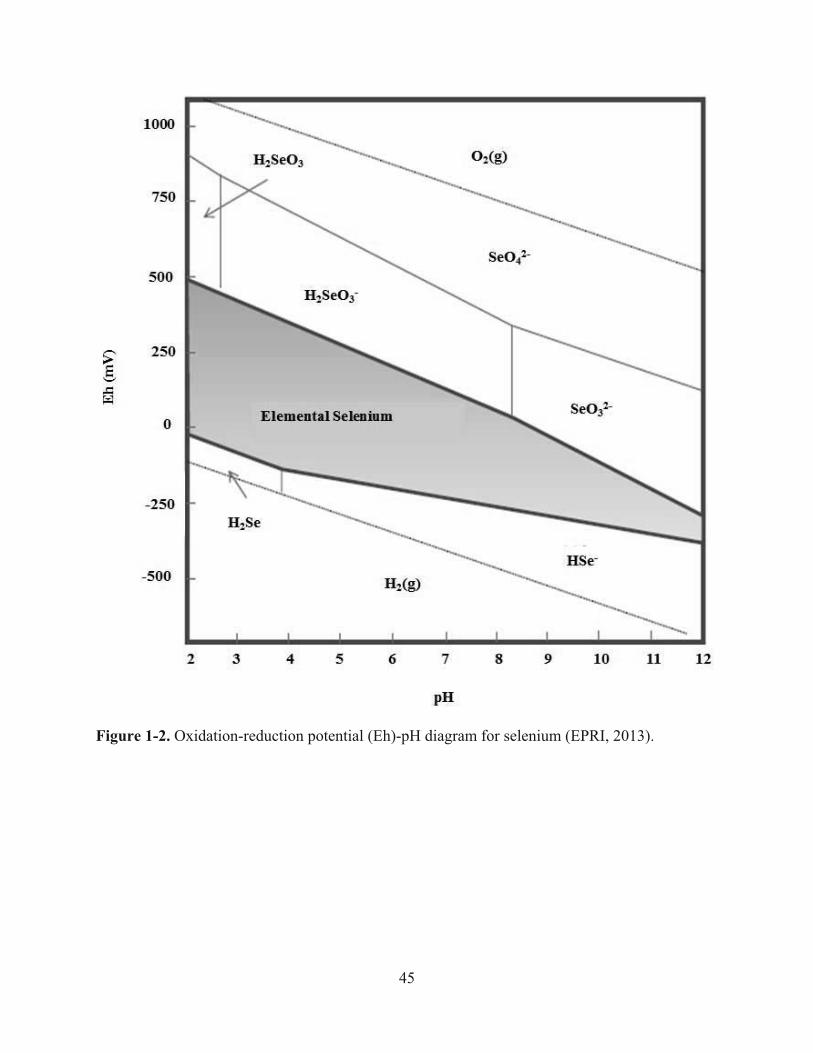
45
��Figure 1-2. Oxidation-reduction potential (Eh)-pH diagram for selenium (EPRI, 2013).�

46
��Figure 1-3. Gradually reducing conditions created within the bioreactors as landfill leachate gravity flows downward through the bioreactor and different electron acceptors are used for bacterial respiration.���

47
�
Figure 1-4. Precipitated elemental selenium (Se0) on the granular activated carbon. The Se0 is indicated by the reddish orange precipitant on the black carbon. This is a key feature of the ABMet™ system because it allows for easy removal and collection of the Se0 by backwashing the bioreactors.��

�� Fi
gure
1-5
. Fix
ed b
iofil
m o
xida
tion-
redu
ctio
n po
tent
ial (
OR
P) g
radi
ent c
reat
ed a
s was
tew
ater
pas
ses t
hrou
gh a
GE
AB
Met
™
bior
eact
or; m
odifi
ed fr
om (G
E, 2
010)
.
48
49
CHAPTER 2
LEACHING CHARACTERISTICS OF SELENIUM AS AFFECTED BY COAL FLY
ASH TYPE, WATER EXTRACTANT, AND EXTRACTION TIME

50
ABSTRACT
Selenium (Se) contamination can be a potential groundwater concern near un-lined coal
ash landfills. Out of all the Environmental Protection Agency (EPA) priority and non-priority
pollutants, Se has the narrowest range between what is considered beneficial and detrimental for
aquatic and terrestrial organisms. The effects of ash type (i.e., fresh and weathered), water-
extractant type (i.e., deionized water, rainwater, and groundwater), and extraction time (i.e., 2-
and 6-hours) on Se, arsenic (As), and chromium (Cr) concentrations were investigated from
Class C, subbituminous coal fly ash produced at the Flint Creek Power Plant located in Benton
County, AR. Water-extractable Se concentrations differed (P = 0.03) between ash types across
water-extractants, but were unaffected by extraction times. Unexpectedly, fresh ash water-
extractable Se concentrations were below minimum detection limits (i.e., 2.0 μg L-1) for all
treatments. In contrast, averaged over extraction times, the weathered ash water-extractable Se
concentration was greatest (P < 0.05) with groundwater and rainwater, which did not differ and
averaged 60.0 μg L-1, compared to extraction with deionized water (57.6 μg L-1). Selenite (Se4+)
was greater (P < 0.001) in the fresh (3.85 mg kg-1) than in the weathered ash (0.70 mg kg-1),
while selenate (Se6+) concentration was greater (P < 0.001) in the weathered (0.67 mg kg-1) than
in fresh ash (0.48 mg kg-1). Results from this study indicate that environmental weathering of
Class C, subbituminous fly ash promotes oxidation of selenite (Se4+), to the less toxic, but highly
mobile selenate (Se6+). The formation of hydrated ettringite [Ca6Al2(SO4)3(OH)12 - 26H2O] and
calcium selenite (CaSeO3) likely acted as a sink for weathered ash selenite (Se4+). Implications
of this research include a better understanding of the past, present, and future environmental and
health risk potential associated with the release of water-soluble Se, As, and Cr to aid in the
development of sustainable fly ash management strategies.

51
INTRODUCTION
Within the US, coal-fired fired plants provide approximately 45 % of the total net
electrical generation, with 847,930 metric tons (934,683 tons) of coal consumed per day (EIA,
2011). During the combustion of coal, inorganic constituents that are naturally enriched in the
coal are further concentrated in the coal combustion residuals (CCRs): fly ash and bottom ash.
One of these inorganic constituents of concern is selenium (Se). Out of all of the EPA priority
and non-priority pollutants, Se has the narrowest range between what is considered beneficial
and detrimental to aquatic species and terrestrial organisms. In aquatic eco-systems, water
concentrations greater than 5 μg Se L-1 can potentially cause teratogenic deformities within fish
populations and embryo toxicity of waterfowl through the bioaccumulative effects of Se in the
aquatic food chain (Lemly, 1999; Spallholz and Hoffman, 2002; Chapman et al., 2009). Humans
have a narrow exposure range between what is considered a deficiency (< 40 �g Se day-1) and
what is considered toxic (> 400 �g Se day-1; WHO, 1996). Therefore, the EPA’s Maximum
Contaminant Level (MCL) in drinking water for humans is 50 �g Se L-1 (EPA, 2011).
Approximately 43,929,517 metric tons (48,424,000 tons) of bottom ash and fly ash is
stored in coal ash landfills or impoundments within the US annually (ACAA, 2011). Leachate
generated from a coal ash landfill can be laden with Se, which could cause harm if released into
the environment. Through environmental weathering, Se can be released from stored fly ash and
become mobilized in the groundwater if the landfill does not have a properly engineered liner
(EPRI, 2001, 2002, 2006c). The Se-laden leachate can be transported with the groundwater and
become a human and ecological threat. One such potential threat would be the un-lined ash
landfill located adjacent to the Flint Creek Power Plant located in Benton County, AR. The Flint
Creek landfill is an above-grade landfill, which has received ash since the plant went operational

52
in 1978. Measurable Se concentrations were first detected in one of the monitoring wells located
along the landfill boundary in 1994, but were not considered a statistically significant increase
(SSI) until 2002, and, in 2009, the well experienced an exceedence for Se under the groundwater
protection standard (GWPS; ADEQ, 2014). Therefore, there was a considerable amount of time
(i.e., 24 years) before Se became mobilized and transported with the groundwater past the
boundaries of the landfill. The slow mobilization may have been due to the pozzolanic properties
of the fly ash restricting the percolating rainwater, slow oxidation to the mobile selenate (Se6+)
form, the formation of secondary products that act as a sink for Se, or a combination of all three
factors (Wesche, 1991; EPRI, 2005, 2006a). Site-specific information is essential to better
understand the complex relationship among Se-laden leachate and the leachates’ interaction with
the vadose zone and underlying groundwater.
The Se plume currently extends approximately 200 m (656 feet) to the west of the plant’s
16 ha (40 acre) landfill. The Se has not yet posed a threat to local drinking water sources or the
aquatic environment because the contamination is currently perched in the regolith. However,
this Se plume needs to be remediated to prevent any further spread. Remediation will consist of
installing an intermediate liner, a leachate collection system, and three GE ABMet™ (Advanced
Biological Metals Removal Process) bioreactors that will reduce the Se oxyanions selenate (Se6+)
and selenite (Se4+) to their elemental form (Se0). The biological reduction to elemental Se (Se0)
will cause the Se to precipitate out within the bioreactors, which will allow the Se to be easily
removed from the waste stream (Sonstegard and Pickett, 2005).
To be able to effectively operate the ABMet™ bioreactors a better understanding of
selenium’s water-soluble fraction is needed. The water-soluble fraction is the readily available
fraction that can be easily released into the environment through contact with rainwater and
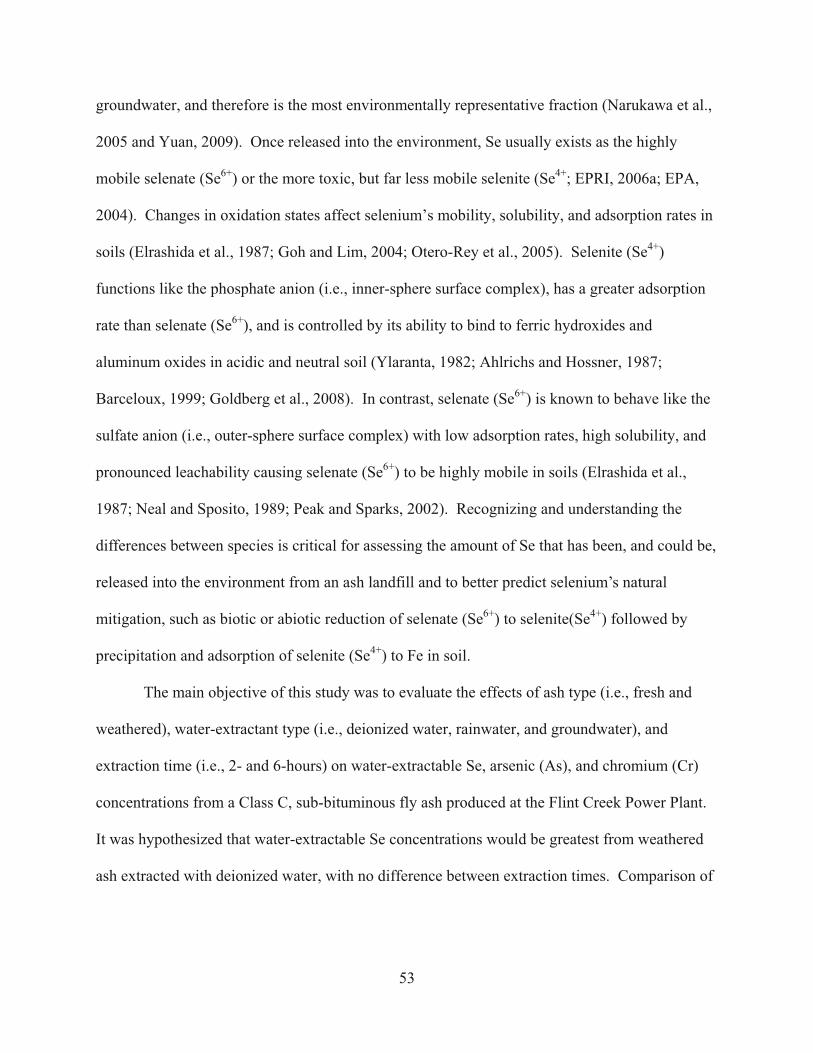
53
groundwater, and therefore is the most environmentally representative fraction (Narukawa et al.,
2005 and Yuan, 2009). Once released into the environment, Se usually exists as the highly
mobile selenate (Se6+) or the more toxic, but far less mobile selenite (Se4+; EPRI, 2006a; EPA,
2004). Changes in oxidation states affect selenium’s mobility, solubility, and adsorption rates in
soils (Elrashida et al., 1987; Goh and Lim, 2004; Otero-Rey et al., 2005). Selenite (Se4+)
functions like the phosphate anion (i.e., inner-sphere surface complex), has a greater adsorption
rate than selenate (Se6+), and is controlled by its ability to bind to ferric hydroxides and
aluminum oxides in acidic and neutral soil (Ylaranta, 1982; Ahlrichs and Hossner, 1987;
Barceloux, 1999; Goldberg et al., 2008). In contrast, selenate (Se6+) is known to behave like the
sulfate anion (i.e., outer-sphere surface complex) with low adsorption rates, high solubility, and
pronounced leachability causing selenate (Se6+) to be highly mobile in soils (Elrashida et al.,
1987; Neal and Sposito, 1989; Peak and Sparks, 2002). Recognizing and understanding the
differences between species is critical for assessing the amount of Se that has been, and could be,
released into the environment from an ash landfill and to better predict selenium’s natural
mitigation, such as biotic or abiotic reduction of selenate (Se6+) to selenite(Se4+) followed by
precipitation and adsorption of selenite (Se4+) to Fe in soil.
The main objective of this study was to evaluate the effects of ash type (i.e., fresh and
weathered), water-extractant type (i.e., deionized water, rainwater, and groundwater), and
extraction time (i.e., 2- and 6-hours) on water-extractable Se, arsenic (As), and chromium (Cr)
concentrations from a Class C, sub-bituminous fly ash produced at the Flint Creek Power Plant.
It was hypothesized that water-extractable Se concentrations would be greatest from weathered
ash extracted with deionized water, with no difference between extraction times. Comparison of

54
the three different water-extractants may provide the scientific community with useful data to
help make an informed decision on a preferred water-extractant.

55
MATERIALS AND METHODS
Site Description - Flint Creek Power Plant
Flint Creek Power Plant is a base-load, coal-fired, electric generation plant located in
Benton County, Arkansas. Construction of the plant began in 1974. By 1978, the plant was
operational. The plant is located approximately 1.6 km (1 mile) west of Gentry, Arkansas
(population 3,129), in the extreme northwest portion of the state (N 36°, 15’, 45” latitude and W
94°, 31’, 15” longitude), with a grade elevation of 354 meters (1160 ft; Wolniak et al., 1978; US
Census, 2010). The land surrounding the plant is largely rural. The plant is jointly owned by
American Electric Power-Southwestern Electric Power Company (AEP-SWEPCO) and the
Arkansas Electric Cooperative Corporation (AECC). The AEP-SWEPCO company staffs the
plant, handles daily operations, and provides the AECC with half of the electric generation
(Gregory, Energy Production Supt. II, personal communication, 2010).
Flint Creek Power Plant was the first commercial power plant in Arkansas to use coal as
its fuel source (Gregory, Energy Production Supt. II, personal communication, 2010). The plant
has the electrical capacity to produce 528 net megawatts per hour, which is enough electricity to
supply approximately 365,000 households at an average Arkansas household usage of 1,076 Kw
per month (EIA, 2010). At full capacity, the plant will burn approximately 6,350 metric tons
(7,000 tons) of coal per day (Wolniak et al., 1978). The coal arrives by railroad and can be
transported directly into the plant’s coal bunkers or stored in the coal yard until needed. Before
being injected into the boiler, the coal is pulverized into a fine talcum-powder-like consistency.
The pulverized coal is then injected into the boiler with pre-heated, forced-draft air (Figure 2-1).
The combustion of the coal produces temperatures over 1,370�C (2,500�F) inside the boiler,
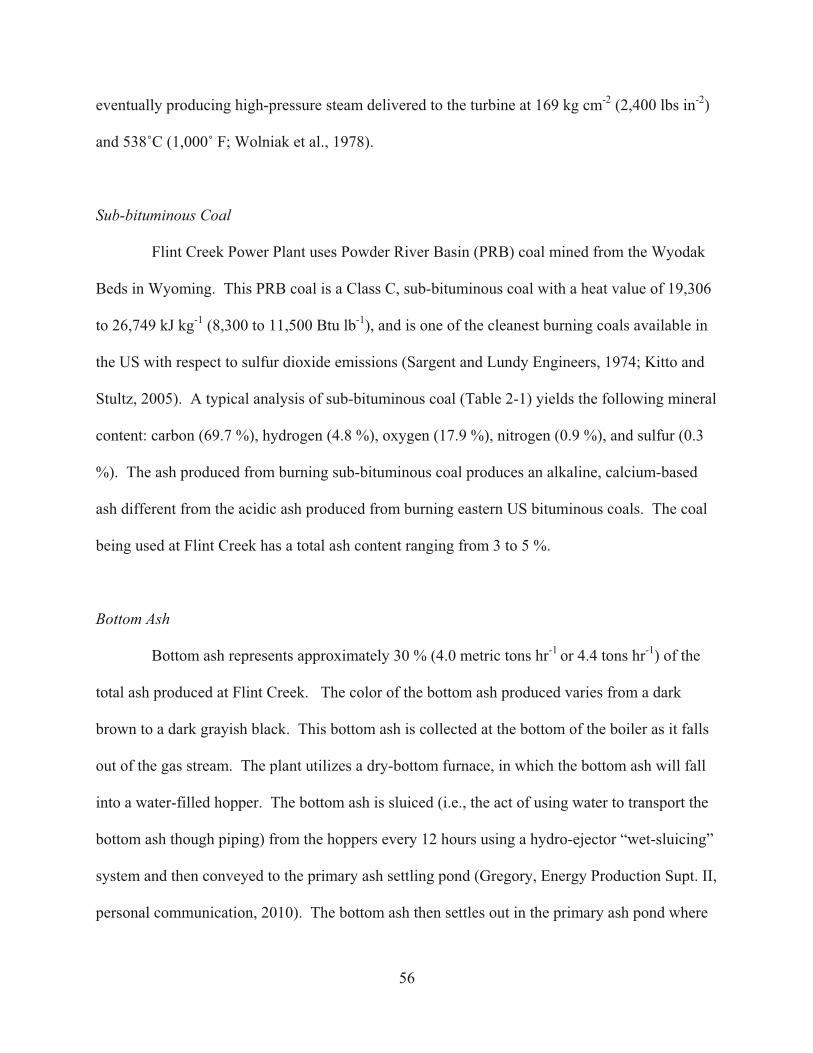
56
eventually producing high-pressure steam delivered to the turbine at 169 kg cm-2 (2,400 lbs in-2)
and 538�C (1,000� F; Wolniak et al., 1978).
Sub-bituminous Coal
Flint Creek Power Plant uses Powder River Basin (PRB) coal mined from the Wyodak
Beds in Wyoming. This PRB coal is a Class C, sub-bituminous coal with a heat value of 19,306
to 26,749 kJ kg-1 (8,300 to 11,500 Btu lb-1), and is one of the cleanest burning coals available in
the US with respect to sulfur dioxide emissions (Sargent and Lundy Engineers, 1974; Kitto and
Stultz, 2005). A typical analysis of sub-bituminous coal (Table 2-1) yields the following mineral
content: carbon (69.7 %), hydrogen (4.8 %), oxygen (17.9 %), nitrogen (0.9 %), and sulfur (0.3
%). The ash produced from burning sub-bituminous coal produces an alkaline, calcium-based
ash different from the acidic ash produced from burning eastern US bituminous coals. The coal
being used at Flint Creek has a total ash content ranging from 3 to 5 %.
Bottom Ash
Bottom ash represents approximately 30 % (4.0 metric tons hr-1 or 4.4 tons hr-1) of the
total ash produced at Flint Creek. The color of the bottom ash produced varies from a dark
brown to a dark grayish black. This bottom ash is collected at the bottom of the boiler as it falls
out of the gas stream. The plant utilizes a dry-bottom furnace, in which the bottom ash will fall
into a water-filled hopper. The bottom ash is sluiced (i.e., the act of using water to transport the
bottom ash though piping) from the hoppers every 12 hours using a hydro-ejector “wet-sluicing”
system and then conveyed to the primary ash settling pond (Gregory, Energy Production Supt. II,
personal communication, 2010). The bottom ash then settles out in the primary ash pond where

57
it can be collected. The settling pond is sized to handle approximately 90,718 metric tons
(100,000 tons) of bottom ash before needing to be dredged (Burns and McDonnell, 1993). Flint
Creek’s primary ash pond has been dredged approximately once every 15 years since 1978
(Carney, Plant Environmental Coordinator, personal communications, 2010). The dredged
bottom ash is then marketed as a road-base material.
Fly Ash
The second type of coal ash produced at Flint Creek is fly ash. Fly ash represents
approximately 70 % (9.3 metric tons hr-1 or 10.2 tons hr-1) of the total ash produced at this site.
Flint Creek uses PRB sub-bituminous coal, which produces a Class C fly ash during combustion.
The color of the fly ash produced varies from a yellowish to light tan. Fly ash is transported out
of the boiler in the gas stream, and is then collected by the electrostatic precipitator (ESP) and
silo baghouse.
Flint Creek uses “hot side” ESPs that receive the flue gas at a maximum temperature of
399�C (750�F) with a dust loading of 2.0 to 2.5 grains m-3 (0.057 to 0.070 grains ft-3; Wolniak et
al., 1978). Flint Creek ESPs use anodic plates and cathodic wires to remove fly ash from the flue
gas with greater than 99.5 % removal efficiency (EPRI, 1982; Terracon, 2006). Electrostatic
precipitation, in this case, is the process in which fly ash suspended in the flue gas is given a
negative charge from negatively charged electrodes (cathodic wires) hanging in the ESP. The
negatively charged fly ash is then collected onto the positively charged (anodic) plates (EPRI,
1982). The plates are periodically rapped (vibrated) causing the fly ash to fall and be collected in
hoppers located below the ESP. The fly ash is then transported to a silo via a hydro-vactor
exhauster system, which utilizes water to create an air vacuum. With this type of design, there is

58
a small amount of fly ash that becomes entrained into the hydro-vactor water (Terracon, 2006).
Historically, this entrained fly ash would then travel with the hydro-vactor water into the plant’s
primary ash settling pond. Engineers at AEP calculated that at least 72 % of the Se loading into
the primary ash pond was from this fly ash carryover. To remediate this problem, in April 2011
the plant placed a new high-efficiency baghouse in service on top of the existing ash silo. This
baghouse replaced the existing two-stage collector system, and is capable of preventing more
than 99.98 % of this fly ash carryover (Massingill, Energy Production Supt. III, personal
communication, 2011). Following start-up of the baghouse, the average Se concentration in the
effluent of the secondary ash pond have decreased from approximately 5 �g Se L-1 to non-
detectable (ND) levels.
Fly ash collected in the silo is either sold or stored at the on-site ash landfill. Fly ash
produced at Flint Creek is high in alkalinity, calcium content (~ 27 %), and exhibits pozzolanic
properties, much like that of Portland cement (Helmuth, 1987; Wesche, 1991; Kiwerska, 2002).
These characteristics allow the fly ash to be sold and utilized as an additive in concrete, improve
soil structure and water-holding capacity, act as a neutralizer in acidic soils, and be an essential
source of micronutrients for agricultural crops under the right conditions (Capp and Spencer,
1970; Martens et al., 1970; Helmuth, 1987; Wesche, 1991; Yeheyis, 2008). The quantity sold
per year is dependent on current market conditions. For example, in 2005, approximately 55 %
of the fly ash produced at Flint Creek was marketed for re-use. The unsold fly ash is transported
from the storage silo to the landfill by semi-truck/trailers.
Class 3N Solid Waste Disposal Facility (Ash Landfill)

59
The Solid Waste Disposal Facility [Arkansas Department of Environmental Quality
(ADEQ) Permit # 0273-S3N-R1], which from this point on will be referred to as the ash landfill,
is located approximately 400 meters (1300 ft) northeast (N 36�, 15’, 34”/ W 94�, 30’, 48”) of the
power plant (ADEQ, 2010). The ash landfill encompasses approximately 16 hectares (40 acres),
and the area around the ash landfill is a relatively flat plateau surface (Burns and McDonnell,
1992). Property surrounding the ash landfill is owned by AEP-SWEPCO and leased out
primarily as pasture for cattle and haying purposes (Figure 2-2; Carney, Plant Environmental
Coordinator, personal communication, 2010). The land directly to the south of the landfill
includes a two-lane highway (Swepco Plant Road) that dead ends at the plant and a railroad track
used for transporting coal and supplies to and from the plant. Just south of this railroad track is a
small area of woods and the plant’s primary ash settling pond. Approximately 800 meters (0.50
miles) to the west of the landfill is Swepco Lake. This lake encompasses 215 hectares (531
acres) and was constructed to serve as a cooling water reservoir for the plant.
Upon initial power production in 1978, fly ash disposal began at the ash landfill (Burns
and McDonnell, 1993). Fly ash was first disposed of on the northeast side of the landfill, and
currently covers most of the landfill site (Burns and McDonnell, 1993; Wehling, Environmental
and Safety Engineer I, personal communication, 2010). Stormwater runoff from the ash landfill
is directed by surface water channels towards an earthen berm that surrounds the landfill (Burns
and McDonnell, 1993; Terracon, 2006). The berms direct the stormwater runoff towards the
southeast and southwest corners of the landfill where it passes underneath the road and railroad
tracks through culverts. These culverts empty into a drainage ditch, transporting the surface
runoff approximately 150 meters (~ 500 ft) before emptying into the plant’s primary ash pond.
The primary ash pond effluent flows into the secondary ash settling pond and then into Swepco

60
Lake Reservoir. The discharge point from the secondary ash pond (N 36�, 15’,03”, W 94�, 31’,
35”) is regulated by a National Pollutant Discharge Elimination System (NPDES) permit (ADEQ
Permit # AR-0037842).
Only Class 3 waste generated at the Flint Creek Power Plant is disposed at the ash
landfill. Class 3 waste includes CCRs such as fly ash, bottom ash, bottom ash dredged from the
settling ponds, slag, and grit blasting materials. Slag is a glassy, angular, non-crystalline
material that accumulates in the boiler as the coal ash melts into a viscous liquid and is quenched
for removal. Grit blasting is a non-hazardous material used to remove ash that has adhered to the
interior surfaces of the boiler, ESPs, and duct work during plant outages (Terracon, 2006).
Ash Landfill – Daily Operations
The ash landfill is operated Monday through Friday from 0700 to 1700 (CST), unless
conditions warrant extended operating times. There is only one entrance to the landfill and it is
closed and locked during off hours. Only AEP-SWEPCO personnel and authorized contractors
are allowed access to the landfill (Terracon, 2006). The ash landfill is operated by AEP-
SWEPCO personnel, while an ash marketing contactor places ash upon the landfill under the
direction and supervision of AEP-SWEPCO personnel. Ash is deposited and periodically graded
to allow smooth and gradual slopes at all places. The current permit allows a 4:1 slope to a fill
elevation of 370.33 meters above sea level (1215 ft above sea level) and then requires a 20:1
slope to the final fill elevation of 376.3 meters above sea level (1234.5 ft above sea level; Figure
2-3). Since fly ash has pozzolanic properties, water is applied to the ash after it has been
deposited to control dust (Helmuth, 1987). The hardened fly ash fulfills the same requirements
as daily and intermediate covers under the plants Title V air permit issued by ADEQ. Since the

61
ash landfill doesn’t have common municipal landfill issues, such as vector control (e.g., flies,
seagulls), blowing trash, and daily odor control, intermediate covers are not used (Carney, Plant
Environmental Coordinator, personal communications, 2011).
Current Landfill Liner
When the plant was undergoing construction, Swepco sought a permit for the ash landfill,
but the State of Arkansas did not require permits to operate solid waste landfills at that time
(Wehling, Environmental and Safety Engineer, personal communication, 2010). However,
legislation and regulation changes required the landfill to be permitted, and in 1990 a pre-
application for a permit was submitted and approved by the Arkansas Department of Pollution
Control and Ecology (Burns and McDonnell, 1993).
Since construction was prior to the implementation of Arkansas regulation 22, the landfill
did not have a clay liner installed before ash disposal began. In the western one-third of the
landfill, the topsoil was removed down to the natural clay layer and the upper 15 cm (6 inches)
of this natural clay layer was compacted to serve the purpose of a clay liner (Wehling,
Environmental and Safety Engineer, personal communication, 2010). In the eastern two-thirds
of the landfill, the topsoil was not removed before fly ash disposal began.
Current Sub-Surface Leachate Collection
Currently, a limited amount of sub-surface leachate discharging from a seep is collected
in the southeast corner of the landfill and pumped into two 34,000 L (9,000 gal) storage tanks.
As the storage tanks become full, the leachate is pumped into water trucks and transported to the

62
boiler where it is evaporated. Evaporation of the landfill’s leachate was approved by the ADEQ
Air Division on October 13, 2009 and placed in service in April 2010 (Miller, 2010).
Future Intermediate Liner and Leachate Collection System
In 2011, a permit modification was sent to the ADEQ requesting additional landfill
storage capacity and approval to install an intermediate liner and leachate collection system at
the Flint Creek ash landfill (Hull and Associates, 2011). This modification requests an additional
633,051 cubic meter (828,000 yd3) storage capacity, a 34.7 % increase from 1,189,647 to
1,822,699 cubic meters (1,556,000 to 2,384,000 yd3), and a final fill elevation of 400.8 meters
(1315 ft above sea level) with a 4:1 slope. At current disposal rates, the modified landfill would
be able to continue accepting ash for disposal until around the year 2045. However, the Flint
Creek plant should have a dry flue gas scrubber installed and operational by the year 2016. This
scrubber will reduce the life expectancy of the landfill by approximately 14 years due to the
generation of an unmarketable calcium sulfite (CaSO3) waste product during the sulfur dioxide
(SO2) removal process.
The proposed intermediate liner will consist of a 60-mil, high-density polyethylene
(HDPE) geomembrane, which will be installed over the entire landfill in one phase. The
leachate collection system will be installed in separate phases as the ash is deposited onto the
liner. Separation berms will be constructed between the active phases to direct the leachate and
prevent stormwater runoff from entering the leachate collection system. The leachate collection
system will include a double-sided geocomposite drainage layer and a 30.5 cm (12 inch) HDPE
leachate collection piping system. The leachate collection piping will be installed over the
intermediate liner and have 0.9525 cm (0.375 inch) diameter holes to allow collection of the

63
leachate. The collected leachate will then gravity-feed to a leachate storage pond. This leachate
storage pond will have a 1,099 cubic meter (290,244 gallon) capacity and be lined with a 0.61
meter (2.0 ft) compacted clay liner covered with a 60-mil, HDPE geomembrane liner. The
leachate pond will be designed to hold seven days worth of leachate and a 25-year rainfall event
directly on the pond. After collection, leachate can either be pumped to an on-site treatment
facility (ABMet™ bioreactor) or removed by a tanker truck.
Stormwater runoff from the ash landfill will be collected by a contact water storage pond,
which will act as a settling basin for total suspended solids (TSS) removal. The stormwater will
travel from the landfill, to the contact pond, through a concrete-lined channel capable of handling
a maximum flow rate of 1.59 m3 sec-1 (418.9 gal sec-1). The contact water pond will have an
11,010 m3 (2,908,426 gal) capacity and will consist of the same liner system as the previously
mentioned leachate storage pond. The contact water pond will be designed to contain a 25-year
stormwater runoff event and a 25-year direct rainfall event on the pond. After settling, the
effluent from the contact water pond will travel through a 76.2 cm (30 inch) diameter SaniTite®
pipe to the plants primary ash pond. [Note: Previously mentioned information concerning the
intermediate liner and leachate collection system was obtained from the “Permit Modification
Application for the Intermediate Liner and Leachate Collection System” (Hull and Associates,
2011)].
ABMet™ Flint Creek - Treatment Technology
Selenium removal processes, such as iron co-precipitation, strongly basic anion resins,
and constructed wetlands, were considered for the Flint Creek site. However, the ABMet™
system was chosen as the treatment process due to the high percentage of selenate (Se6+) in the

64
ash landfill leachate. Unlike selenite (Se4+), selenate (Se6+) has proven difficult to remove from
wastewater using conventional methods, such as ferrihydrite adsorption (Fujita et al., 2002;
Hayashi et al., 2009; Smith et al., 2009). Selenite (Se4+) is strongly adsorbed on the ferric
hydroxide floc, while selenate (Se6+) is loosely bound, resulting in poor removal rates (Hayashi
et al., 2009). Strongly basic anion resins were not chosen due to the high operating costs, large
amounts of sodium hydroxide needed for regenerations, and a large amount of waste regenerant
that would need disposal. Constructed wetlands were also considered for a treatment option.
However, wetlands would require a large footprint, still allow the potential for groundwater
contamination, and could result in wildlife exposure to contaminated water without adequate
reduction of selenium oxyanions.
Leachate from the Flint Creek ash landfill has an average total selenium concentration
near 400 �g Se L-1, with selenate (Se6+) accounting for approximately 95 % of this total
selenium. Even though selenate (Se6+) has proven difficult to remove with conventional
methods, the ABMet™ system has proven capable of reducing selenate (Se6+) with greater than
98 % reduction rates during full-scale operation (Lortie et al., 1992; Golder & Associates, 2009;
Sonstegard et al., 2010). A study conducted by EPRI (2010) reported similar selenate (Se6+)
removal (> 99 %) from 182 �g L-1 to 1.3 �g L-1 from waste streams.
Prior to entering one of the three ABMet™ bioreactors, leachate from the Flint Creek ash
landfill will enter a lined settling pond. This settling pond will facilitate TSS removal and aid
with flow neutralization. The normal designed influent flow rate will be 56.8 L min-1 (15.0 gal
min-1). The leachate will then be pumped from the settling pond into a feed tank. Prior to
entering the feed tank, sulfuric acid (93 %) will be mixed with the leachate at a feed rate of
approximately 1.4 L hr-1 (0.37 gal hr-1) to obtain an influent pH between 7.5 to 8.0. Sulfuric acid

65
must be added because the unprocessed leachate has a pH between 11.5 to 12.0. The neutralized
leachate will then be pumped from the feed tank into the top of the bioreactors. Before entering
the bioreactors, a nutrient mixture (molasses) will be injected into the bioreactor feed line,
downstream from the feed pumps, at a rate of approximately 0.49 L hr-1 (0.13 gal hr-1). Nutrient
injection flow rates will be adjusted to maintain an effluent ORP of approximately -300 mV.
The neutralized/nutrient-rich leachate will then enter the top of the bioreactors through a
distribution lateral header. After spending approximately six hours gravity feeding down
through the bioreactor, the processed leachate will exit through the effluent collection piping
located at the bottom of each bioreactor, which is lined with a gravel sub-fill that acts as the
support for the biomatrix (EPRI, 2010; Sonstegard et al., 2010).
Due to the reduction process, there will be accumulations of gases in the bed such as
nitrogen and carbon dioxide (Harwood, GE Water, personal communication, 2010; Sonstegard et
al., 2010). These gas pockets will be monitored by level and pressure transmitters within the
bioreactor bed and effluent piping (Sonstegard et al., 2008). The frequency of “degas”
backwashing, which from this point on will be referred to as degas, will vary depending on the
constituent loading (e.g. nitrates and selenium oxyanions) of the bioreactor beds and the pressure
differential within the bioreactor (Harwood, GE Water, personal communication, 2011). This
degas sequence requires a high pressure pump, which will introduce water into the bottom of the
reactor “lifting” the biomatrix at a design flow rate of 1,018 L min-1 (269 gal min-1). A degas
does not send water out of the top of the bioreactor like a normal backwash. Instead, the degas is
a high flow, short, “burp” of the bioreactor. This degas allows entrained gases to vent out of the
bed, which prevents channeling and head-loss within the bioreactor (Sonstegard et al., 2008). If

66
the degas does not lower the head or differential pressure, then a solid backwash will need to be
performed.
Approximately once per month, each bioreactor will need a solid backwash performed
(Harwood, GE Water, personal communication, 2010). A solid backwash removes TSS,
prevents clumping, and facilitates removal of the reduced metals (Pickett et al., 2006; Sonstegard
et al., 2008). The TSS levels have a drastic effect on effluent quality and loading of the
bioreactor beds (Harwood, GE Water, personal communication, 2010). High influent TSS levels
will require frequent solid backwashing of the beds.
An increase in selenium effluent concentrations could also indicate a need for a solid
backwash (Sonstegard et al., 2008; Sonstegard et al., 2010). This was noticed during full-scale
operation at the Progress Energy Roxboro Station located near Roxboro, North Carolina
(Sonstegard et al., 2010). A solid backwash lasts approximately 15 to 20 minutes at 2,040 L
min-1 (539 gal min-1) flow rates. The backwash high flow rate will dislodge the entrained solids,
which are carried out with the backwash water into a trough at the top of the bioreactor. From
the trough, the backwash effluent will gravity-flow to the waste tanks. After settling, the
backwash water will be pulled from the top of the tank and sent back to the feed tank for re-
processing (Sonstegard et al., 2008). After approximately three backwash cycles, the settled
“liquid” sludge will be removed from the two waste tanks and hauled off site for disposal. The
waste sludge leftover from backwashing will contain mostly precipitated elemental metals,
sulfides, and TSS (Sonstegard et al., 2008). Before proper disposal, the settled backwash sludge
will be analyzed for hazardous waste constituents (Carney, Plant Environmental Coordinator,
personal communications, 2011). Backwash solids from bench testing have passed the Toxicity
Characteristic Leaching Procedure, which have shown that waste characteristics are below

67
concentrations which would cause the backwash solids to be classified as a hazardous waste
(TCLP; Harwood, GE Water, personal communication, 2010). Based on an average influent of
30 mg L-1 TSS, there should be between a 0.5 to 2.0 % concentration of solids entrained in the
backwash water (Harwood, GE Water, personal communication, 2011).
A certain amount of headspace is required within the bioreactor to allow for adequate
expansion of the biomatrix during backwashing (Sonstegard et al., 2010). This headspace
(Figure 2-4) must be maintained to prevent loss of the granular activated carbon (GAC) during
backwashes, and will also be used as an indicator of the amount of gases and TSS developing
within the bed (Sonstegard et al., 2010). Since the GAC is not being used as an adsorptive
treatment mechanism, the GAC should only need topping off every 5 to 10 years replacing only
what is backwashed out of the bioreactor (~ 0.5 % per year; Harwood, GE Water, personal
communication, 2011). Degas and solid backwashes will need to use previously treated
bioreactor effluent to prevent upsetting the microbes within the bioreactors because high
oxidation-reduction potential (ORP) backwash water could upset the gradually reducing
conditions inside the reactor (Sonstegard et al., 2010).
Previously treated effluent will also be used for bacteria seeding and for intermittent flow
through the reactors when unit shutdown is required (EPRI, 2006b). If this is not done, an
expected 24 hours would be needed for the ORP levels to come back down and the bacteria to re-
stabilize (Dey and Kulkarni, 2010; Harwood, GE Water, personal communication, 2011).
During this period, the selenium effluent concentrations may also increase slightly if non-
processed water is used (Harwood, GE Water, personal communication, 2011). To compensate
for this, extending retention times following upsets conditions should aid in the restabilization of

68
the bio-reduction process. A flow diagram for the ABMet™ at Flint Creek can be seen in Figure
2-5.
Any major abnormal operating condition “disruption”, such as mechanical, hydraulic,
temperature, pH, or change in influent selenium concentrations, may cause an increase in
effluent selenium concentrations until the microbes re-stabilize (Dey and Kulkarni, 2010;
Harwood, GE Water, personal communication, 2010). The rate of disruption has showed to be
more of concern then just the magnitude of disruption (Harwood, GE Water, personal
communication, 2011). An increase in selenium effluent concentrations may also be
encountered if the ABMet™ system is allowed to operate below design flow and/or cycled every
few days (Harwood, GE Water, personal communication, 2011). Therefore, the bioreactors
should be placed in service for an extended period of time and not taken in and out of service
frequently. When a discontinuous-flow condition exists, the bioreactors must be shut down and
placed into the maintenance mode.
Recent data from a full-scale ABMet™ system has shown that it is possible for selenium
concentrations to remain at desired effluent levels following a long-term maintenance mode of
48 days (Harwood, GE Water, personal communication, 2011). During such an extended
shutdown, the bioreactors will need to be placed in maintenance mode with an operator replacing
a minimum of 25 % of the water/nutrient volume bi-weekly, within the bioreactor bed, to
maintain proper conditions for bacteria survivability and prevent severe anaerobic conditions
from developing within the bioreactors. This process of replacing a portion of the water within
the bioreactors is termed “refreshing”. At Flint Creek, a 25 % displacement would equal
approximately 1,579 L bioreactor-1 (417 gal bioreactor-1) that would need replacement bi-

69
weekly. Refreshing all three bioreactors weekly will require approximately 9,464 L (2,500
gallons) of leachate.
There have also been concerns whether large temperature swings encountered in
northwest Arkansas will affect the effluent selenium concentrations. As the wastestream
becomes cooler, the microbes will slow down and a longer retention time (normal retention time
is six hours) may be needed within the bioreactor beds. For example, during start-up of the
Roxboro Plant in February 2008, the wastewater influent temperatures were near 9 �C (48 �F).
During the sensitive inoculation and start-up period (first 2 weeks), the influent wastewater was
pre-heated to maintain a reaction temperature greater than 27 �C (80 �F; Sonstegard et al., 2008).
Increasing the temperature allowed for an increase in reaction rates and lower selenium effluent
concentrations. After this start-up period, the bioreactors were able to accept influent wastewater
at ambient temperatures. Similarly, warm summer temperatures at Flint Creek are not expected
to be an issue due to anaerobic bacteria thriving at temperatures near 38 �C (100 �F; Smith et al.,
2009). However, the upper tolerance limit specified by GE is 40 �C (104 �F). Therefore, the
temperature will have to be monitored closely once inlet water temperatures rise above 38 �C
(100 �F).
As part of a preventive maintenance program, the ABMet™ system should be shutdown
once per week during continuous flow to refresh the water and nutrients in the reactor (Harwood,
GE Water, personal communication, 2010). Before placing back in service, a backwash of the
bioreactors is preferred. However, the bed can be placed back in service without a backwash if
one is performed within 48 hours after startup (Harwood, GE Water, personal communication,
2011). The bioreactors should never be placed into a recirculation mode. Recirculation would

70
upset the stable ORP gradient zones within the bioreactor beds (Harwood, GE Water, personal
communication, 2010).
Bioreactor effluent is not expected to need post-treatment at Flint Creek. The effluent
will flow into the ash landfill’s contact water pond (Carney, Plant Environmental Coordinator,
personal communications, 2011). The contact water pond holds stormwater runoff collected
from the fly ash landfill. The effluent from the contact water pond will be piped into the plant’s
primary ash pond. Under normal flow conditions, the bioreactor effluent will account for only
0.6 to 1.2 % of the total influent water into the primary ash pond.
The molasses carbon source should have an average cost of $0.20 per 3,785 liters treated
($0.20 per 1,000 gal), with total operation and maintenance costs averaging between $0.35 to
$0.46 per 3,785 liters treated ($0.35 to $0.46 per 1,000 gal; Harwood, GE Water, personal
communication, 2010; Sonstegard et al., 2010). An expected time of two weeks will be needed
after installation before the correct reducing environment exists in the bed for proper selenium
reduction (Harwood, GE Water, personal communication, 2010). Flint Creek’s ABMet™
system will be designed for a maximum 95 L min-1 (25 gal min-1) influent flow rate. However,
the system should be able to handle flow rates between 19 to 38 L min-1 (5 to 10 gal min-1)
without negative effects on effluent quality (Harwood, GE Water, personal communication,
2010).
Groundwater Monitoring
The current groundwater monitoring system for the ash landfill consists of 18 monitoring
wells and a leachate collection system (AEP, 2011). The wells and leachate collection system
are sampled quarterly for parameters included in the Assessment Monitoring Constituent list

71
(AMC; Table 2-3; ADEQ, 2010). In addition to monitoring the parameters on the AMC list,
once every three years, the wells are sampled for parameters in the Expanded Parameter (EP) list
(Table 2-4; ADEQ, 2010). The sampling is performed by Eagle Environmental (Shreveport, LA)
and sample analysis is performed by Environmental Testing Group (ETG) in Bentonville
Arkansas, which is an ADEQ certified laboratory (Lab ID: 04-0574; Certification number: 10-
063-0).
The initial groundwater monitoring wells were installed as part of the hydrogeologic site
characterization that was conducted prior to landfill permitting in 1994 (Burns and McDonnell,
1992; AEP, 2010). Monitoring wells (B-01A, B-01B, B-02, B-04, and B-05) were installed in
1991 and are located at the approximate midpoint on each side of the landfill [B-01A and B-01B
(North), B-02 (West), B-04 (East), and B-05 (South)] (Figure 2-6; Burns and McDonnell, 1992).
Well B-06 was installed in 2001 just north of the northwest corner of the landfill. In May 2007,
three additional wells were installed: B-07A, B-07C, and B-08 (AEP, 2010). Wells B-07A and
B-07C are located just north of the northern edge of the landfill. Well B-08 is located to the west
of the southwest corner of the landfill. From these wells, it has been determined that the general
groundwater flow is to the west by northwest. On a few occasions, it has been observed to flow
to the northeast.
In April 2009, groundwater monitoring well B-02 experienced an exceedence for Se (50
�g Se L-1) under the Groundwater Protection Standard (GWPS; AEP, 2010). As part of a study
to determine the nature and extent (NE) of the contamination plume, Flint Creek added three new
groundwater monitoring wells down-gradient of well B-02, during the summer of 2009 (AEP,
2010). The three new wells were named NE-01, NE-02, and NE-3. Groundwater monitoring
well NE-01 is located approximately 155 meters (510 ft) north-northwest of well B-02, well NE-

72
02 is located approximately 122 meters (400 ft) west-northwest of well B-02, and well NE-03 is
located approximately 140 meters (460 ft) southwest of well B-02 (AEP, 2010). Hydraulic
conductivity values for wells B-01B, B-02, B-04, B-05, B-06, NE-1, NE-2, and NE-3 are
presented in Table 2-5 and the procedure used is described in Appendix A.
Due to Se being detected at levels above the Groundwater Protection Standard (GWPS)
at well NE-3, six new groundwater monitoring wells were installed down-gradient of current
monitoring wells NE-1, NE-2, and NE-3 as part of the Nature and Extent Workplan (ADEQ
Permit # 273-S3N-R1; Document # 59665). During June 2011, these new wells were installed
north (NE-4), northwest (NE-5), west-northwest (NE-6), west (NE-7S and NE-7D), and west-
southwest (NE-8) of current monitoring well NE-3 (See Appendix B for drilling technique and
Figure 2-6 for aerial view of well locations). Quarterly sampling of these wells began on July
19, 2011 with testing performed by the ETG laboratory. Data suggest that the Se plume has not
reached this area.
While installing well NE-7D, the drilling crew believed that this well was not capable of
producing enough water for installing the well (i.e., setting). Therefore, well NE-7S was
installed adjacent to NE-7D. However, after 24 hours, it was determined that well NE-7D would
produce enough water for final setting of the well. Therefore, sampling of wells NE-7S and NE-
7D are rotated every quarter. Another notable comment is that during drilling of well NE-5, a
void in the bedrock was encountered at a depth of 6.10 to 6.86 meters (20 to 22.5 ft), which is
below the top of the groundwater table. Water was encountered at a depth of 5.5 meters (18 ft)
below the ground surface at this well (NE-5). After sitting overnight, water had risen to a depth
of 2.2 meters (7 ft 6 inches) below the ground surface, which indicated that there is a substantial

73
amount of head on this well. Soil samples during drilling were obtained using the “split-spoon”
method.
Local Geology/Hydrology
The Flint Creek ash landfill is located on the relatively flat, southward extension of the
Springfield Plateau (Figure 2-7). The Springfield Plateau is located on the southwestern side of
the Ozark Highlands, which is an irregular, flattened, dome-like structure known as the Ozark
uplift (Sargent and Lundy Engineers, 1974). The Ozark uplift’s history has been marked by the
ingression and regression of shallow seas. However, during most if its history, the Ozark
Highlands has stood high enough to serve as a source of sediments.
The Springfield Plateau is a sub-division of the Ozark Highland Province and
differentiates itself from the rest of the Ozarks by being underlain by rocks of Mississippian age
(Fenneman, 1938). Topography in the area around the ash landfill consists of a relatively flat
plateau with a general slope of 0.3 to 0.4 % to the southwest (Sargent and Lundy Engineers,
1974). The Springfield Plateau, in the area around the ash landfill, can be divided into three
stratigraphic units: the Boone formation, the St. Joe formation, and the Chattanooga Shale
formation (Figure 2-8).
Boone Formation
Regolith around the ash landfill is a mixture of iron-rich clay, chert, and limestone
fragments, with clay comprising greater than 50 % of the total volume of the regolith (Doheny-
Skubic, 2006). Regolith is an insoluble material that is formed from the downward weathering
of cherty limestone (Doheny-Skubic, 2006). From soil boring logs, it has been determined that

74
there is approximately 6.1 to 12.2 meters (20 to 40 ft) of regolith overlying the Boone formation
at the ash landfill site.
The Boone formation is a gray limestone of lower-Mississippian age interbedded with
varying types and amounts of chert (Martin, 1993; Al-Qinna, 2003). The Boone formation is
characterized by a block-like chert and limestone that weathers into a reddish-colored regolith
(McFarland, 1975). Due to this in-situ weathering, the Boone formation around the landfill
consists of cherty limestone mixed with red to brown clay seams (Burns and McDonnell, 1992).
The Boone formation lies almost horizontally in the area around the ash landfill and has an
average thickness of 61 to 76 meters (200 to 250 ft). The Boone formation can be separated into
lower and upper divisions due to the presence of two separate types of chert: diagenetic and
penecontemporaneous.
The upper division of the Boone contains a white to tan diagenetic chert. This upper
division can contain up to 70 % chert that often shows signs of being calcitized, making it easy
to identify (Martin, 1993; Al-Qinna, 2003). This diagenetic chert was formed as silica-rich
groundwater replaced the original carbonate limestone.
The lower division of the Boone contains 45 to 65 % of a gray to blackish blue
penecontemporaneous chert (Al-Qinna, 2003; Laubhan, 2007). In the field, the lower Boone
division will appear as nodules, discontinuous bands, and anastomosing bodies that divide and
reconnect. In both the upper and lower divisions, groundwater can possibly become perched by
the bedding of the chert (Smith, 1992). At locations where the chert beds intersect the ground
surface, springs can form (Smith, 1992). Underlying the Boone formation is the St. Joe
formation.
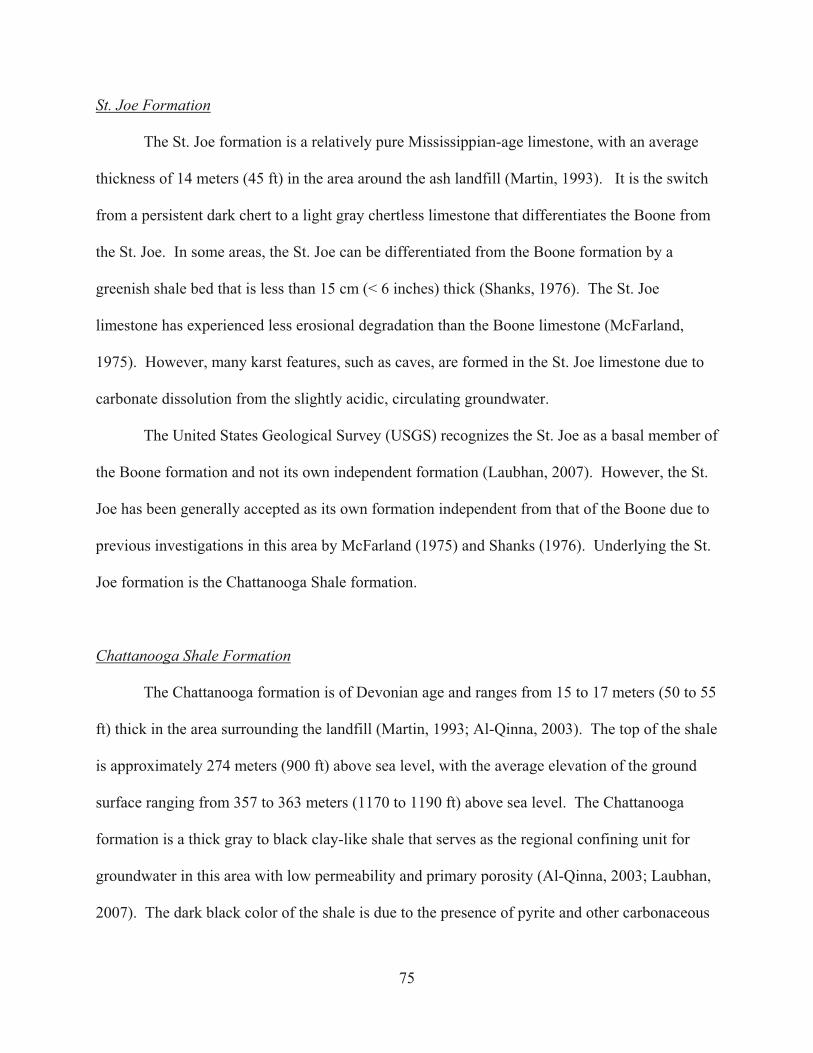
75
St. Joe Formation
The St. Joe formation is a relatively pure Mississippian-age limestone, with an average
thickness of 14 meters (45 ft) in the area around the ash landfill (Martin, 1993). It is the switch
from a persistent dark chert to a light gray chertless limestone that differentiates the Boone from
the St. Joe. In some areas, the St. Joe can be differentiated from the Boone formation by a
greenish shale bed that is less than 15 cm (< 6 inches) thick (Shanks, 1976). The St. Joe
limestone has experienced less erosional degradation than the Boone limestone (McFarland,
1975). However, many karst features, such as caves, are formed in the St. Joe limestone due to
carbonate dissolution from the slightly acidic, circulating groundwater.
The United States Geological Survey (USGS) recognizes the St. Joe as a basal member of
the Boone formation and not its own independent formation (Laubhan, 2007). However, the St.
Joe has been generally accepted as its own formation independent from that of the Boone due to
previous investigations in this area by McFarland (1975) and Shanks (1976). Underlying the St.
Joe formation is the Chattanooga Shale formation.
Chattanooga Shale Formation
The Chattanooga formation is of Devonian age and ranges from 15 to 17 meters (50 to 55
ft) thick in the area surrounding the landfill (Martin, 1993; Al-Qinna, 2003). The top of the shale
is approximately 274 meters (900 ft) above sea level, with the average elevation of the ground
surface ranging from 357 to 363 meters (1170 to 1190 ft) above sea level. The Chattanooga
formation is a thick gray to black clay-like shale that serves as the regional confining unit for
groundwater in this area with low permeability and primary porosity (Al-Qinna, 2003; Laubhan,
2007). The dark black color of the shale is due to the presence of pyrite and other carbonaceous

76
material (Duncan, 1983). In some areas of northwest Arkansas, the shale is exposed at the
ground surface. At these weathered locations, the shale will appear black, have a distinct
petroleum odor, and may have an orange staining due to pyrite oxidation within the shale
(Duncan, 1983). In the area around the landfill, the shale is deeply buried beneath the Boone and
St. Joe formations with no exposure sights nearby.
The Chattanooga Shale restricts the transportation of contaminants to the lower aquifer,
thus providing an important protection barrier for the lower Ozark aquifer (Al-Rashidy, 1999).
When the groundwater reaches the shale, it will move laterally until reaching an outlet where the
shale is exposed. Since groundwater in the vicinity of the landfill is confined by the shale, there
is no need for further discussion on any of the geological formations below the Chattanooga
Shale. The perched groundwater above the Chattanooga Shale is known as the Springfield
aquifer and below the Chattanooga Shale is the Ozark aquifer.
Hydrology - Springfield Plateau Aquifer
The Springfield Plateau aquifer lies within the Boone and St. Joe formations and is the
primary drinking water source for rural residents in Benton County (Smith, 1992). In most areas,
the aquifer is unconfined and permeable due to fractures in the limestone. However, the
Springfield aquifer can become perched (Figure 2-9) if the chert is impermeable or if the
limestone is shaley, which decreases the vertical hydraulic conductivity (Willis, 1978). The
Springfield aquifer tends to have low well-water yields of 7.5 to 75.7 liters min-1 (2 to 20 gal
min-1).
The top of the Springfield aquifer is also the top of the local groundwater table around the
landfill. Recharge to the Springfield aquifer comes from infiltration of precipitation through the

77
vadose zone. The landfill receives on average 120 cm (47 inches) of precipitation annually
(NOAA, 2011). From this 120 cm (47 inches), it has been estimated that roughly 25 cm (10
inches) percolates downward and recharges the aquifer (Imes and Emmett, 1994). The amount
of recharge into the aquifer is aided by thin soils, gentle sloping topography, fracturing of the
bedrock, and secondary permeability (Smith, 1992). The Boone formation is known to be
extensively fractured in this study area. This fracturing allows the infiltrating rainwater to
interact and dissolve the soluble CaCO3 -rich limestone, which leads to the formation of karst
features, such as sinkholes, caves, and channels (Bolyard, 2007). Concentrated groundwater
flow is governed by the size and number of karst features in an area. However, in the area
directly around the landfill, there is a limited amount of karst features present (Dr. Van Brahana,
University of Arkansas, personnel communication, 2011).
Once precipitation reaches the groundwater table, the water will move laterally and
discharge into streams, seeps, or could possibly move downward towards the regional
groundwater system (Imes and Emmett, 1994). According to Imes and Emmett (1994),
determining the quantity of water reaching the groundwater system can be difficult and nearly
impossible due to the varying thickness of the aquifer and the complexity of the lithology and
geologic formations. This downward percolation of groundwater could eventually allow water
to reach the underlying Ozark aquifer if the Chattanooga Shale confining unit was fractured in
this area (Rankin, 1998).
Local Soils
Soils at the ash landfill are derived from weathering of the Boone formation. The Boone-
derived soils consist of sand, gravel, or cobble-sized pieces of chert in a clay matrix (Phillips and
78
Harper, 1977). Soils of this origin can serve as important temporary groundwater reservoirs,
slowly releasing water into the fractures of the Boone formation below. The current ash landfill
has ash deposited over the entire 16 hectares (40 acres). Construction of the ash landfill occurred
prior to the implementation of EPA Subtitle D and Arkansas Regulation 22. Therefore, no liner
was constructed at the ash landfill. Instead, the ash was deposited directly on the topsoil in the
eastern two thirds of the landfill. In the western one third of the landfill, the topsoil was removed
down to the natural clay chert layer and compacted. Due to the topsoil being present under the
majority of the ash and a leachate Se plume extending to the west of the landfill, it is relevant to
discuss the soils and their characteristics underlying the landfill site (Figure 2-10) and directly to
the west of the landfill due to the westerly migration of the Se plume (Figure 2-11).
The soil directly below the ash landfill is comprised of five different soil series: Linker
(LrC- 79.1 %), Nixa (Nfc- 7.9 %), Elsah (Eg- 5.8 %), Captina (CnB- 5.7 %), and Noark (NoD-
1.6 %). Linker soils have a moderate water infiltration rate when thoroughly wet, moderate
permeability, low available water capacity, and are considered unfavorable for landfill use
(NRCS, 2011). Linker soils tend to exist as a thin covering of the regolith with an average depth
of only 0.66 meters (26 inches; Phillips and Harper, 1977). Descriptions of the remaining soils
are summarized in Appendix C.
Preliminary Data
Previous groundwater sampling has provided this study with a good source of
background information. Groundwater in wells B-02 and NE-3 have exceeded the groundwater
protection (GWP) standard of 50 �g Se L-1, while well B-05 has been experiencing a steady
increase in the Se concentration since 2005 followed by a leveling off below the GWP standard

79
(Figure 2-12). All non-detect (ND) values were reported as 5.0 �g Se L-1 to maintain
consistency in the results.
Sampling of the private groundwater drinking well (Bartley Well), which is
approximately 500 meters (0.31 miles) to the west of the landfill, has occurred intermittently
since 2009. All samples have been reported as either NDs or values less than 3.3 �g Se L-1, with
one sample having a reported value of 57.8 �g Se L-1. However, this sample will be considered
an outlier because of probable contamination in the field or laboratory. Swepco Lake is located
approximately 800 meters (0.5 miles) to the west of the landfill and has also been sampled
intermittently since 2009. All values reported have been NDs or values less than 1.0 �g Se L-1,
except for one sample with a reported value of 40.7 �g Se L-1. This sample will also be
considered an outlier due to probable contamination in the field or the laboratory.
Selenium speciation analysis was performed on samples from the ash landfill seep via ion
chromatography inductively coupled plasma dynamic reaction cell mass spectrometry (IC-ICP-
DRC-MS). Samples collected on February 27, 2009 were sent to Applied Speciation and
Consulting, LLC (Bothell, Washington). In these samples, selenite (Se4+) was reported as having
a value of 17.3 �g L-1 and selenate (Se6+) a value of 329 �g L-1. Samples collected on April 15,
2009 were sent to the AEP-Dolan laboratory, in which selenite (Se4+) was reported as having a
value of 18.5 �g L-1 and selenate (Se6+) a value of 285 �g L-1.
Treatments
Fly ash samples were collected at the Flint Creek plant via grab samples by an
InterSystems Model XE0118 automated collection device (InterSystems, Omaha, Ne) installed
on the fly ash collection piping on the outlet of the hot-side ESP. The ash collector took

80
approximately 5 g of ash sample, every 10 minutes, for a total of 30 days during normal plant
operation. In-situ fly ash samples were collected randomly from the fly ash landfill at a depth of
approximately 1.0 m (3.28 ft) using a backhoe. The actual age of the weathered samples is
unknown due to the disposal methods of the ash. However, weathered samples were collected
from an area of the landfill that is believed to have the oldest ash.
The gravimetric water content of the fly ash was determined by oven drying the ash at
105 ºC for 24 h. After drying, weathered fly ash samples were manually ground and sieved to
less than 2 mm. Fresh samples did not need to be ground and sieved. Pre-extraction pH and EC
of the ash samples were measured using a 1:10 solid/solution ratio of ten grams of fly ash and
100 mL of DI water. Organic matter was determined by loss-on-ignition (LOI) by oven drying
the ash at 750 ºC for 1 hour. Fresh and weathered fly ash acid-recoverable Se, As, Cr, Sb, Ba,
Be, Cd, Pb, Hg, Ni, Ag, and V were determined following EPA Method 200.7/6010B at the AEP
Analytical Chemistry Services Laboratory (Shreveport, LA) using the Varian VistaPro
inductively coupled plasma-optical emission spectrometer (ICP-OES; Agilent Technologies,
Santa Clara, CA; EPA, 2007a). Chemical analysis (e.g., silicon dioxide, aluminum oxide, iron
oxide, calcium oxide, magnesium oxide, sulfur trioxide, sodium oxide, and potassium oxide) of
the fly ash samples were performed by the Analytical Testing Service Laboratories (Joplin, MO)
using American Society for Testing and Materials (ASTM) standard method C-311 (ASTM,
2006). Fresh and weathered fly ash sample analyses were based on three replications. The
Applied Speciation and Consulting, LLC (Bothell, WA) laboratory performed fresh and
weathered ash speciation analysis via ion chromatography, inductively coupled plasma,
collision-reaction-cell, mass spectrometry (IC-ICP-CRC-MS) using an Agilent 7700 Series
Inductively Coupled Plasma Mass Spectrometer (ICP-MS; Agilent Technologies, Santa Clara,

81
CA), on four replications of each ash type. The speciation analysis was a 2-hour alkaline
extraction based on previous research by Jackson and Miller (2000).
The water-extraction treatments consisted of a 10:1 extractant-to-fly ash dilution ratio (30
mL extractant to 3 g fly ash) for all three extractant types at ambient room temperature, which is
consistent with previous studies (Wang et al., 2007, McDonald et al., 2009, Daigh et al., 2010).
Extraction was conducted using a 30 revolutions per minute (rpm) end-over-end shaker for 2 and
6 hours. Post-extraction pH and EC were measured potentiometrically before centrifuging the
samples at 6000 rpm (11.5 G) for 10 minutes, followed by filtration using a 0.45-μm Suppor-450
membrane filter (Pall Life Science, Port Washington, NY).
The filtrate was then preserved with Fisher® Optima Grade nitric acid to maintain a pH
less than 2. The combination of the pH < 2 and the presence of the nitrate ions will keep the
majority of the metals in solution preventing the formation of metal oxides and hydroxides in the
presence of oxygen. The samples were cooled to a temperature of 4 °C (39.2 °F) for storage and
shipment. Samples were labeled noting the date, time, analysis required, collection location,
preservation method, person sampling, extraction time and extractant type. Duplicate treatment
blanks were prepared to ensure proper quality assurance and quality control (QAQC). A chain of
custody (COC) form was filled out with one copy being kept in the Flint Creek laboratory and
one being sent with the samples. A total of 60 (e.g., 2 fly ash types x 3 extractants x 2 extractant
times x 5 replications) water-extractant treatment samples and 12 treatment blanks (e.g., 3
extractants x 2 extractant times x 2 replications) were sent to the ETG lab for Se, As, and Cr
analyses by Agilent 7500 Series Inductively Coupled Plasma Mass Spectrometer (ICP-MS;
Agilent Technologies, Santa Clara, CA). The ETG laboratory is certified by the Arkansas
Department of Environmental Quality (Lab ID: 04-0574; Certification number: 10-063-0) for Se,

82
As, and Cr analyses. United States EPA Method 200.8/6020 was used as the procedure
guidelines for the proper calibration and analysis of the samples (EPA, 1994; EPA, 2007b).
Water-Extractant Collection
Rainwater was collected in an agricultural field (e.g., pasture) in Washington County, AR
during a single event, using multiple open containers. The groundwater sample was collected
from an uncontaminated private well located adjacent to the landfill at a depth of approximately
61 meters (200 feet). Deionized water was collected from the outlet of the Flint Creek
demineralizer. The Flint Creek demineralizer consists of a strong-acid cation and strong-base
anion bed, followed by a mixed-bed polishing unit. Outflow from this design consistently
produces ion concentrations of <1 μg L-1. Water-extractant samples were stored at 4 ºC and until
the Se, As, and Cr concentrations of the extractant solution could be determined at the ETG
laboratory based on three replications. The pH and EC were measured potentiometrically at the
Flint Creek laboratory. AEP Analytical Chemistry Services Laboratory (Shreveport, LA)
analyzed the water-extractant samples to determine the remaining metal and water-parameter
values present.
Statistical Analyses
Using Minitab (version 13.31, Minitab Inc., State College, Penn.), a two-factor t-test was
performed to determine differences between the fresh and weathered ash sample properties.
One-factor analysis of variance (ANOVA) was performed using SAS (version 9.3, SAS Institute,
Inc., Cary, NC) to compare differences in initial water-extractant characteristics and to identify
possible contamination of treatment blanks. Two-factor ANOVA was used to determine the

83
effects of ash type, Se species, and their interaction on Se concentrations. Two-factor ANOVA
was used to evaluate the effects of extraction time, extractant type, and their interaction on pH,
EC, Se, As, and Cr concentrations in the blank samples. Three-factor ANOVA was used to
evaluate the effects of ash type, extraction time, water-extractant type, and their interaction on
pH, EC, Se, As, and Cr concentrations in the water-extractable treatment samples. Reported
values were considered significantly different if the means were separated by least significant
difference (LSD) at the 0.05 alpha level. Linear correlations were used to evaluate the effects of
water extractant, extractant property, and extraction time on the relationship between suspension
pH and EC, and water-soluble Se, As, and Cr concentrations for the weathered ash using
Microsoft Excel (version 2010, Microsoft Corporation, Redmond, WA), with correlation
coefficient (r) being significant at the 0.05 alpha level.

84
RESULTS AND DISCUSSION
Initial Ash Characteristics
Several initial chemical and physical characteristics differed between the two ash types
(i.e., fresh and weathered). The fresh ash had lower water content (0.001 g g-1) compared to the
weathered ash (0.361 g g-1; P < 0.001; Table 2-6), which was expected due to the environmental
exposure of each ash. Fresh ash was collected from the outlet piping of the ESPs where the fresh
ash had been exposed to temperatures of approximately 400 �C (752 �F), while weathered ash
was exposed to environmental weathering in the ash landfill. Organic matter differed (P <
0.001) between the fresh (0.39 %) and weathered ash (6.40 %; Table 2-6), which is consistent
with the Class C fly ash organic matter concentration range of 0.32 to 17.52 % reported by Lou
et al. (2011). At Flint Creek, normal plant operation results in fresh ash organic matter
concentration that is consistently below 1.0 %; however, fresh ash organic matter was reported as
high as 5.4 % for a short period in 1986, possibly due to poor pulverizer performance.
Furthermore, exposure to environmental conditions (i.e., wind-blown organic matter as dust) at
the landfill could contribute to the increased organic matter of the weathered ash. However,
differences in initial ash organic matter concentration were not suspected to have affected the
water-extractabilities of the trace metals because research by Lopez-Anton et al. (2006) reported
that organic matter in fly ash does not significantly influence As or Se adsorption/retention onto
the fly ash.
As expected, pH differed (P < 0.001) 0.4 units between the fresh (pH = 11.6) and
weathered ash (pH = 11.2; Table 2-6). Previous studies (EPRI, 1998, 2012) investigating eastern
bituminous, western subbituminous, low-sulfur bituminous, subbituminous, lignite, and
subbituminous PRB fly ash reported that the most alkaline (pH = 11.05 to 12.57) ash suspension

85
was from subbituminous PRB ash. Environmental weathering and leaching of Ca, Fe, and S may
have contributed to the lower pH of the weathered ash, which is supported by previous findings
that fly ash with a Fe/Ca ratio > 3 produce acidic suspensions, while ratios < 3 generate alkaline
suspensions (Mattigod et al., 1990). The fresh and weathered ash had Fe/Ca ratios of 0.21 and
0.20, respectively. Furthermore, fly ashes with Ca/S ratios < 2.5 produce acidic suspensions,
while ratios > 2.5 generate alkaline suspensions (EPRI, 1987). The fresh and weathered ash had
Ca/S ratios of 19.3 and 17.2, respectively. Both the Fe/Ca and Ca/S ratio comparisons supported
the observations that weathering and leaching resulted in a lower pH for the weathered ash
compared to the fresh ash.
Similarly, EC differed (P < 0.001) between ash types with EC being approximately two
times greater for the fresh than weathered ash (Table 2-6), likely due to the leaching of major ash
constituents such as Na, SO42-, and B from the weathered ash, due to its environmental exposure.
Due to the effects of time and exposure to water, major constituents can be released from the ash
when exposed to water percolating downward through the ash. Comparing EC between studies
can be difficult due to the wide array of solid/solution ratios, agitation times, and initial
elemental concentrations; therefore, the EC difference between fresh and weathered ash is likely
of more importance than the magnitude of the EC itself.
As expected, there were several differences in the oxide concentrations between ash
types. Due to the suspected leaching and formation of secondary ash products, ferric oxide (P <
0.01), magnesium oxide (P < 0.001), and sodium oxide (P < 0.001) concentrations were lower
for the weathered than fresh ash (Table 2-6). The sulfur trioxide concentration also differed (P <
0.05) between ash types; however, the weathered ash had a greater sulfur trioxide concentration
(1.53 %) than the fresh ash (1.39 %; Table 2-6). Unexpectedly, the calcium oxide concentration

86
did not differ between ash types and averaged 26.6 % (Table 2-6). Silica was also greater (P <
0.01) in the fresh (34.9 %) than in the weathered ash (32.0 %; Table 2-6). Results from this
study are consistent with the ASTM classification of Class C fly ash, which requires a minimum
of 50 % SiO2, Al2O3, and Fe2O3 and 20 % CaO, compared to Class F fly ash, which has a
minimum SiO2, Al2O3, and Fe2O3 concentration of 70 % and normal CaO concentration of < 10
% (ASTM, 2006).
Total acid-extractable Se and As concentrations did not differ between ash types and
averaged 4.0 mg Se kg-1 and 6.4 mg As kg-1 between ash types (Table 2-6), which were similar
to subbituminous PRB ash concentrations reported by Lou et al. (2011) and Seshadri et al.
(2011), which ranged from 2.2 to 15.0 mg Se kg-1 and from 1.8 to 26.9 mg As kg-1. In
comparison, research by EPRI (1987) reported mean bituminous ash Se and As concentrations of
12.3 and 219 mg kg-1, respectively. Coals with large sulfur concentrations (i.e., bituminous) are
expected to contain greater As concentrations compared to low-sulfur coals (i.e., subbituminous
PRB) because As is associated with Fe sulfides and sulfide minerals in the coal (EPRI, 1998). In
contrast, the acid-extractable Cr concentration was lower (P < 0.05) in the fresh (49.2 mg kg-1)
than in the weathered ash (52.0 mg kg-1; Table 2-6), which was similar to that for subbituminous
ash Cr reported by EPRI (1987), with a mean of 73 mg kg-1 and a range from 41 to 108 mg kg-1.
Other acid-extractable metals that differed (P < 0.05) between ash types were Be, Cd, Pb, Hg,
and V (Table 2-6). Unexpectedly, of these metals (i.e., Be, Cd, Pb, Hg, and V) only Be had a
greater concentration in the fresh compared to the weathered ash.
The acid-extractable Cr concentration being greater in the weathered ash may be due to
the coal mining location and/or combustion conditions that produced the ash (Lou et al., 2011).
Even if the coal was from the same mine, differences can exist between the seams of coal.

87
Similarly, varying combustion conditions could affect trace metal release and re-precipitation
onto the surface of the fly ash. Therefore, when trying to explain differences in trace metal
concentrations between fresh and weathered ash, not only should leaching of trace elements be
considered, but also factors such as coal source (i.e., differential coal seams) and combustion
conditions. Furthermore, trying to compare ash trace metal concentrations among different
studies can also be difficult because of the differences in power plant operating systems. For
example, the coal source type (i.e., lignite, sub-bituminous, bituminous, anthracite), furnace
design (i.e., wall-, tangential-, or cyclone-fired furnace), combustion conditions (i.e., combustion
temperature, flue-gas duct temperature, ash/element reaction time, and post-combustion oxygen
concentration), and differences in equipment design/environmental upgrades (i.e., cold- or hot-
side ESPs, wet- or dry-ash handling system, activated-carbon injection, wet- or dry-scrubber, and
selective catalytic reduction equipment) can have a dramatic effect on initial ash characteristics.
Another factor that may contribute to initial ash variability, but is seldom mentioned, is
the collection location and resulting differences in relative enrichment of Se onto the fly ash
particles. As fly ash particles pass through the multiple ESP fields, the ash particle size
decreases resulting in increased fly ash surface area and increased Se adsorption (Huang et al.,
2004). The first two fields of the Flint Creek ESP collect the majority of the larger diameter (i.e.,
30 to 7.5 micron) fly ash particles, while fields three through eight capture the remaining ash
particles (i.e., 7.5 to 3.5 micron). Therefore, as the fly ash passes through the eight fields of the
Flint Creek ESP, greater Se adsorption, per volume of ash, should occur in the later fields. The
first two fields will remove approximately 83 % of the ash particles (Neundorfer Particulate
Knowledge, personal communication, 2013); however, per volume, greater Se adsorption should
be occurring in the later fields. Adsorption rates differing among fields is important because if
88
samples are collected from an ash hopper underneath one of the later fields, then Se may be
greatly enriched compared to that collected from an earlier field. Andren and Klein (1975)
reported a fresh ash Se concentration of 28.0 μg L-1 at the inlet of the precipitator and
concentration of 88.3 μg Se L-1 at the outlet. Therefore, reporting the exact fly ash collection
location would provide useful insight in future studies. Collecting fly ash from an automated
collection device installed on the outlet piping of the precipitator hoppers, or from a fly ash silo,
may help reduce variability between initial trace metal concentrations in future studies.
As hypothesized, there were differences between fresh and weathered ash selenite (Se4+)
and selenate (Se6+) concentrations. Selenite (Se4+) was greater (P < 0.001) in the fresh (3.85 mg
kg-1) than in the weathered ash (0.70 mg kg-1), while selenate (Se6+) was lower (P < 0.001) in the
fresh (0.48 mg kg-1) than in weathered ash (0.67 mg kg-1; Table 2-6). Huggins et al. (2007)
reported similar results with selenite (Se4+) as the dominate species present in both fresh
bituminous and subbituminous PRB ash. Comparing speciation across ash types, fresh ash
selenite (Se4+) was greater (P < 0.001; 3.85 mg kg-1) than fresh ash selenate (Se6+; 0.48 mg kg-1).
In contrast, speciation did not differ between weathered ash selenite (Se4+) and selenate (Se6+;
0.70 and 0.67 mg kg-1; respectively). When compared to total-acid extractable Se
concentrations, the ash speciation extraction recovered 103 % of the fresh ash total Se, while
only 36 % of the weathered ash total Se was recovered, based on the assumption that all Se
species were present as selenite (Se4+) and selenate (Se6+). The difference between fresh and
weathered ash speciation recovery was likely due to the lack of selenite (Se4+) recovery in the
weathered ash.
The differences between fresh and weathered ash selenite (Se4+) concentrations were
likely due to the formation of ettringite [Ca6Al2(SO4)3(OH)12 - 26H2O] and calcium selenite

89
(CaSeO3) precipitate following hydration (Lecuyer et al., 1996; Baur and Johnson, 2003;
Huggins et al., 2007). Wang et al. (2007) reported similar conclusions that highly alkaline
washed ash acted as a sink for selenite (Se4+) through ettringite formation or precipitation with
Ca; however, almost all of the selenate (Se6+) remained in the soluble phase. Baur and Johnson
(2003) reported that the precipitation of CaSeO3 limited the solubility of selenite (Se4+) through
the formation of inner-sphere complexes, while selenate (Se6+) has a lower affinity for Ca-oxide
surfaces and forms weakly bound outer-sphere complexes. Furthermore, Solem-Tishmack et al.
(1995) and Baur and Johnson (2003) reported that selenate (Se6+) was more readily leachable
when bound to ettringite than selenite (Se4+). Selenite (Se4+) sorption by ettringite was found to
be five times greater than sorption of selenate (Se6+; Baur and Johnson, 2003).
Formation of secondary hydrated products (i.e., ettringite and CaSeO3) may take up to
several months to allow equilibrium conditions to occur (Hassett and Pflughoeft-Hassett, 2002).
Therefore, hydration during the 2-hour speciation extraction was not likely long enough to allow
formation of the secondary hydrated products within the fresh ash that binds selenite (Se4+),
which allows the selenite (Se4+) to become solubilized during the alkaline extraction. However,
the pre-hydrated weathered ash (water content = 0.361 g g-1; Table 2-6) would have stabilized
the weathered ash ettringite and CaSeO3 and prevented solubilization of selenite (Se4+; Lecuyer
et al., 1996; Wang et al., 2009).
Initial Water-Extractant Characteristics
As expected, there were several differences among initial water extractants (i.e.,
deionized water, rainwater, and groundwater) used for the laboratory extractions. The pH
differed (P < 0.05) among all three water extractants with deionized water having the most
90
alkaline pH (8.22), groundwater having a slightly alkaline, intermediate pH (7.64), and rainwater
having the most acidic pH (5.24; Table 2-7). Similarly, EC differed between all three water
extractants with groundwater being approximately 336 times greater and rainwater 4.5 times
greater than that of deionized water (Table 2-7). Selenium, As, and Cr concentrations were all
below instrument detection limits for all three water extractants (i.e., < 0.005, < 0.005, and <
0.001 mg L-1, respectively; Table 2-7). Sodium was the only other initial water-extractant
property that differed (P < 0.05) between all three water-extractants, while Mn and TSS
concentrations did not differ among the three water extractants (Table 2-7). The remaining
initial water-extractant characteristics (i.e., Al, Ba, Ca, Cu, Mg, K, Sr, Zn, HCO3, total alkalinity,
N, SiO2, and total dissolved solids) did not differ between the deionized water and rainwater;
however, groundwater Al, Ba, Ca, Cu, Mg, K, Sr, Zn, HCO3, total alkalinity, N, SiO2, and total
dissolved solid concentrations were all greater (P < 0.05) compared to deionized water and
rainwater (Table 2-7).
Treatment Effects on Extractable Fly-Ash Properties
All extractable fly-ash properties evaluated were affected by one or more treatment
factors examined. Suspension pH and EC differed (P < 0.01) between ash types, among
extraction times, and across extractant types (Table 2-8). In contrast to suspension pH and EC,
water-soluble Se and As concentrations differed (P < 0.05) between ash types across extractant
types, while water-soluble Cr concentration differed between ash types among extraction times
(P < 0.01) and differed between ash types across extractant types (P = 0.02; Table 2-8).
As expected, fresh ash suspension pH and EC extracted with deionized water, rainwater,
and groundwater for 2- and 6-hours was greater (P < 0.05) than for weathered ash extracted over

91
the same treatments (Figure 2-13). Characteristics of the initial fresh and weathered ash, such as
the Fe/Ca and Ca/S ratios, were likely responsible for the lower weathered ash suspension pH.
Similarly, due to the suspected leaching of major elements from the weathered ash from
environmental exposure, greater fresh-ash suspension EC occurred. Increasing the fresh and
weathered ash extraction time from 2- to 6-hours across extractant types resulted in greater
suspension pH and EC for all water extractants, except for the weathered ash EC extracted with
groundwater, which did not differ between extraction times (Figure 2-13).
Fresh-ash suspension EC after 2 hours of extraction differed among all water extractants;
EC averaged 2800 μS cm-1 from rainwater, 2710 μS cm-1 from deionized water, and 2500 μS cm-
1 from groundwater (Figure 2-13). In contrast, the suspension EC for the weathered ash
extracted for 2 hours did not differ (P > 0.05) among water extractants and averaged 1638 μS
cm-1 (Figure 2-13). Both the fresh and weathered ash extracted with deionized water and
rainwater for 6 hours resulted in similar suspension EC, but was 1.31 (fresh) and 1.07
(weathered) times greater than the suspension EC with groundwater after 6-hr extraction (Figure
2-13). The likely reason for differences between 2- and 6-hour suspension EC was that
extraction for 2 hours was not long enough to allow maximum extraction to occur. Furthermore,
the low ionic strength of the deionized water and rainwater, and resulting gradient difference
with the ash, could possibly explain the greater suspension EC when deionized water or
rainwater was used compared to groundwater.
Evaluating the fresh ash extracted for 2 hours, the suspension pH was lower (P < 0.05)
when rainwater (pH = 11.84) and groundwater (pH = 11.82), which did not differ, were used as
the extractants compared to deionized water (pH = 11.89; Figure 2-13). Similar to suspension
EC, suspension pH for fresh ash extracted for 6 hours was similar between extraction with

92
deionized water and rainwater, but was 0.14 (deionized water) and 0.15 (rainwater) pH units
greater than extraction with the environmentally representative groundwater (Figure 2-13).
When comparing among water-extractant types for the 2 hour extraction of weathered ash,
suspension pH was also greater with deionized water (pH = 11.41) and rainwater (pH = 11.40) as
the extractant type, which did not differ, compared to extraction with groundwater (pH = 11.31;
Figure 2-13). Weathered ash extracted for 6 hours resulted in a slightly decreasing suspension
pH when deionized water (pH = 11.55), rainwater (pH = 11.51), and groundwater (pH = 11.41)
were used (Figure 2-13). Consequently, deionized water should be used for any combination of
ash type and extraction time to obtain maximum suspension pH. However, to ensure maximum
fresh and weathered ash suspension pH and EC, it is recommended to perform a 6-hour
extraction with deionized water even though several of the treatment factors did not differ
between extraction with deionized water and rainwater. Using deionized water should ensure
maximum suspension pH and EC and is readily available as compared to the collection of
rainwater. Therefore, when focused exclusively on pH and EC, extraction with environmentally
representative rainwater and groundwater offered no distinct benefits when compared to
deionized water as the extractant of choice.
Averaged over extraction times, weathered ash Se and As concentrations differed among
water-extractant types, while fresh ash Se and As concentrations did not differ between water-
extractant types (Figure 2-14). Fresh ash extractable Se and As concentrations were reported at
or near the minimum detection limit (MDL) for all three water-extractant types, possibly
explaining the lack of difference between the three water-extractant types. The extractable As
concentration in the weathered ash was greater (P < 0.05) with rainwater (0.45 μg L-1) than with
deionized water (0.36 μg L-1), while the extractable As concentration from extraction with

93
groundwater was intermediate (0.41 μg L-1) and similar (P > 0.05) to that from both rainwater
and deionized water (Figure 2-14). In contrast, the extractable Se concentration from the
weathered ash was greater (P < 0.05) with groundwater (60.1 μg L-1) and rainwater (59.8 μg L-1),
which did not differ, than extraction with deionized water (57.6 μg L-1; Figure 2-14). The Se and
As results are consistent with previous research by Wang et al. (2009) who used a 10:1 dilution
ratio of deionized water and subbituminous ash and reported that As was not detected under most
experimental factors and that Se was more readily leachable than As.
When comparing extractable As between ash types and across water-extractant types, the
reported results could be misleading because all of the mean extractable As concentrations were
< 0.5 μg L-1 (Figure 2-14). Since these concentrations are at and near the MDL of 0.2 μg L-1, it
may be difficult to differentiate and compare reported As results with any type of confidence.
Wang et al. (2009) reported that As did not leach from subbituminous ash until a 2:1 deionized
water dilution ratio was used for a total of 30 days using a 180-revolutions-per-minute (rpm)
shaker. Therefore, a longer extraction time and lower dilution ratio may be required to obtain
more relevant data pertaining to water-soluble As concentrations.
Averaging over water-extractant types, weathered ash water-soluble Cr concentration
increased as the extraction increased from 2 hours (166.9 μg L-1) to 6 hours (174.7 μg L-1; Figure
2-15). For comparison, EPRI (1994) reported that the water-soluble Cr fraction over a one-week
laboratory extraction was 42.3 % (0.25 hr), 42.3 % (24 hr), 11.5 % (48 hr), and 3.9 % (168 hr)
using a 10:1 dilution ratio. Therefore, it is recommended that, if Cr is the trace metal of interest,
extraction occur for at least 24 hours to extract the majority of the water-soluble Cr from
weathered ash. Water-soluble Cr concentration in the fresh ash was unaffected by extraction
time and averaged 1.2 μg Cr L-1 (Figure 2-15). Similar to Se and As, fresh ash water-soluble Cr
94
concentration, averaged over extraction times, did not differ between water-extractant types as
would be expected since measured concentrations were at or near the MDL (Figure 2-14).
However, for the weathered ash, extraction with groundwater resulted in a greater (P < 0.05)
extractable Cr concentration (176.3 μg Cr L-1) compared to that from rainwater (170.1 μg Cr L-1)
and deionized water (166.0 μg Cr L-1), which did not differ (Figure 2-14).
Possible reasons for why weathered ash Se and Cr extraction was greatest with
groundwater include differences in suspension pH and EC between the water extractants (Figure
2-13). Selenium and Cr can be incorporated into ettringite by substitution with the sulfate ion at
pH > 11.5, but become unstable at a pH < 10.7 (Hassett and Pflughoeft-Hassett, 2002; EPRI,
2006c). Weathered ash extraction with groundwater resulted in the lowest suspension pH when
compared to rainwater and deionized water (Figure 2-13). Therefore, a greater amount of Se or
Cr could have been incorporated into the ettringite, due to the greater weathered ash suspension
pH from extraction with deionized water and rainwater. The ettringite can act as a sink for Se or
Cr and prevent solubilization (Lecuyer et al., 1996; Wang et al., 2007).
Furthermore, 6-hour extraction with deionized water and rainwater resulted in greater
weathered ash suspension EC compared to that from groundwater (Figure 2-13). However, there
was no difference in suspension EC between the water extractants for the 2-hour extraction.
Increased suspension EC was likely a result of increased solutes dissolved in suspension. A
portion of these solutes will be negatively charged, which may cause the negatively charged Se
and Cr oxyanions to be repulsed at a greater extent in the weathered ash suspension. Repulsion
between negatively charged anions should reduce the solubility of weathered ash Se and Cr,
assuming that Cr was present in solution as the chromate oxyanion (CrO42-; Cr6+) and not as the
trivalent cation (Cr3+; EPRI, 2011). However, more evidence is needed to determine why greater

95
weathered ash Se and Cr extraction occurred with environmentally representative groundwater.
Furthermore, previous explanations do not explain why weathered ash Se extraction with
rainwater and groundwater did not differ. Weathered ash suspension pH and EC did not differ
between rainwater and deionized water, except for the 6-hour extraction suspension pH (Figure
2-13).
From these results, it is clear that a significant difference existed between fresh and
weathered ash Se and Cr water-soluble concentrations, with possible differences between fresh
and weathered ash water-soluble As concentrations. Information regarding oxidation state (i.e.,
speciation) is essential in understanding and predicting Se, As, and Cr behavior and may help
explain the extraction differences between ash types (EPRI, 1998). For example, selenite (Se4+),
arsenate (As5+), and trivalent (Cr3+) Cr are known to be less water-soluble than selenate (Se6+),
arsenite (As3+), and hexavalent (Cr6+) Cr (EPRI, 2006a). When examining speciation, the initial
speciation within the coal is not important because virtually all of the Se, As, and the majority of
the Cr is volatized into the gas phase during combustion; therefore, the initial coal speciation has
no effect on post-combustion speciation (Huggins et al., 2007).
As fly ash weathers, trace metal speciation may also change, resulting in a change in
leaching behavior. For example, selenate (Se6+) is very soluble, while selenite (Se4+) only
sparingly soluble and limited by adsorption to hydrous oxide surfaces. EPRI (2006a) reported
that Se in weathered sub-bituminous ash landfill leachate was almost entirely in the selenate
(Se6+) form. However, Wang et al. (2009) reported that fresh sub-bituminous PRB ash exhibited
low-leaching potential, which is consistent with Se in the selenite (Se4+) form; therefore, the
field-derived data may indicate conversion from selenite (Se4+) to selenate (Se6+) from
environmental exposure in the landfill. Speciation may explain the differences noted between

96
fresh and weathered ash water-soluble Se concentrations. Assuming that all Se species were
present as selenite (Se4+) and selenate (Se6+), fresh ash Se was predominately in the less-water-
soluble selenite (Se4+) form (88.9 %), compared to selenate (Se6+; 11.1 %), likely explaining why
fresh ash water-extractable Se concentrations were at or below MDL for all three water-
extractants (Figure 2-14). Similarly, Narukawa et al. (2005) reported fresh ash water-soluble Se
concentrations were present predominately as selenite (Se4+), but the coal source was not
reported.
Mattigod and Quinn (2003) reported that selenite (Se4+) from subbituminous ash was
completely oxidized to selenate (Se6+) after one week using a 4:1 dilution ratio. In contrast,
Wang et al. (2009) reported that an extraction time of 30 days had no effect on Se speciation
conversion from selenite (Se4+) to selenate (Se6+) under natural conditions (i.e., exposed to air),
regardless of dilution ratio. Therefore, in some instances, 30 days may not be enough exposure
to stimulate a change in Se speciation. Environmental weathering in the landfill may have
affected Se speciation, promoting the oxidation of selenite (Se4+) to selenate (Se6+). The highly
water-soluble selenate (Se6+) concentrations were greater (P < 0.001) in the weathered (0.67 mg
kg-1) than the fresh ash (0.48 mg kg-1), while selenite (Se4+) concentrations were less (P < 0.001)
in the weathered (0.70 mg kg-1) than in the fresh ash (3.85 mg kg-1). Therefore, speciation likely
explains the greater water-extractable weathered ash Se concentrations across all three water-
extractants (Figure 2-14).
Compared to As, Wang et al. (2009) reported no significant change in speciation of As
during a 30 day extraction. Wang et al. (2009) also reported non-detectable As concentrations
for the fresh subbituminous PRB ash except with a 2:1 dilution ratio and 30-day extraction,
which resulted in water-soluble As concentrations of 20 μg L-1, which was primarily in the

97
arsenate (As5+) form. Narukawa et al. (2005) reported fresh ash water-soluble As concentrations
were dominated by the less mobile and less toxic arsenate (As5+) form, but did not report the coal
source. Huggins et al. (2007) reported similar results with arsenate (As5+) as the dominate
species present in both fresh bituminous and subbituminous PRB ash, thereby likely explaining
the fresh ash water-extractable As concentrations being at or the near the MDL across all three
extractants.
Minimal water-extractable weathered ash As concentrations may be explained by the
high-calcium content of the ash, which may have attributed to As precipitation with the Ca, or
substitution with ettringite [Ca6Al2(SO4)3(OH)12 - 26H2O]. Selenium, As, and Cr can be
incorporated (i.e., substituted) into ettringite at pHs > 11.5, but become unstable at a pH < 10.7
(EPRI, 2006c), which is consistent with measured suspension pH values from this study (Figure
2-13). However, ettringite formation has been reported by Hassett et al. (2005) as a long-term
process (i.e., > 18 hours) between water and ash; therefore, fresh ash extraction should not have
been affected by ettringite formation because the fresh ash was not exposed to water prior to
extraction in this study.
Speciation may also explain increased water-extraction from the weathered ash. In fresh
ash samples, Stam et al. (2011) reported that the less mobile trivalent (Cr3+) Cr was the dominate
species present. However, the alkaline pH suspension of subbituminous PRB ash promotes
conversion of trivalent (Cr3+) Cr to the more water-soluble hexavalant (Cr6+) Cr (EPRI, 1986,
2011). Similarly, in a study of 29 landfill leachates, EPRI (2006a) reported hexavalant (Cr6+) Cr
as the dominate species present when pH was greater than 6, with concentrations of 0.5 to 5,100
μg Cr L-1. Although Cr speciation analyses was not performed, a comparison can be made
between Se and Cr because of mobility similarities, results from previous research, and

98
differences between fresh and weathered ash water-extractable Cr concentrations which indicate
that trivalent (Cr3+) Cr was the likely the dominant Cr species in the fresh ash and the hexavalent
(Cr6+) Cr was the likely dominant species in the weathered ash.
Water-Soluble Se, As, and Cr Fractions
To better characterize fly ash trace metals, Narukawa et al. (2005) and Yuan (2009)
performed a chemical fractionation that distributed trace metals into five fractions: water-soluble,
acid-soluble (i.e., bound to carbonates; extracted with acetic acid), reducible (i.e., bound to Fe-
Mn oxides), oxidizable (i.e., bound to organic matter), and residual (i.e., bound to silica;
extracted with HNO3 and HCl). Of these, the water-soluble fraction is the most readily available
fraction that can be easily released into the environment through contact with rainwater and
groundwater. Averaged over extraction time and extraction type, the total water-soluble fraction
of Se, As, and Cr was determined for fresh and weathered ash. The fresh ash water-soluble
fraction for Se (0.05 %), As (< 0.01 %), and Cr (< 0.01 %) were very low since concentrations
were at, or near, MDL values. The weathered water-soluble fraction for Se, As, and Cr was 1.6,
0.01, and 0.33 %, respectively, which is lower than reported fresh-ash results by Narukawa et al.
(2005) and Yuan (2009). However, ash samples from Narukawa et al. (2005) and Yuan (2009)
were collected at eight different locations throughout the world and exhibited different initial ash
characteristics than those in this study.
Correlations among Ash Properties
Linear correlations were used to evaluate the effects of water extractant, extractant
property, and extraction time on the relationship between suspension pH, and EC, and water-
99
soluble Se, As, and Cr concentrations. Only weathered ash data were analyzed since the fresh
ash water-soluble Se, As, and Cr concentrations were all reported at or near the MDL. Water-
soluble Se concentration was positively correlated (r = 0.95; P < 0.01) with suspension EC for
weathered ash extracted for 6 hours with rainwater (Table 2-9). Similarly, weathered ash water-
soluble Se concentrations was positively correlated (r = 0.96; P < 0.01) with suspension pH for
the 2-hour extraction with deionized water (Table 2-9).
In contrast to Se, weathered ash As and Cr concentrations were unrelated to suspension
pH. Weathered ash water-soluble As concentration was inversely related (r = -1.00; P < 0.001)
to suspension EC for the 2-hour extraction with rainwater (Table 2-9); however, four of the five
replicate concentrations were 0.5 μg L-1, with the other being 0.4 μg L-1, possibly skewing the
data. Therefore, in contrast to the statistical data, no linear relationship between water-soluble
As and suspension EC was suspected. Extraction for 2 hours with deionized water resulted in an
inverse relationship (r = -0.93; P < 0.05) between weathered ash water-soluble Cr concentration
and suspension EC (Table 2-9).
Although some of the data appear to support a linear relationship between weathered ash
properties for various treatments (i.e., water extractant and extraction time), several underlying
variables/factors may be skewing this data since there appears to be little to no consistency
within combinations. For example, previous research (EPRI, 2006a; Wang et al. 2007) has
reported a strong linear relationship between water-soluble Se and pH; however, these data were
collected over a wide pH range (i.e., 2-12), while site-specific, weathered ash suspension pH
from this study only varied by 0.26 units. Therefore, treatment effects on linear relationships
among weathered ash properties can neither be proved nor disproved for this body of work.

100
Environmental Implications
The relatively long lag period (~24 years) before Se became mobilized and transported
with the groundwater past the boundaries of the landfill was likely due to the low moisture
content of fresh ash deposited at the landfill (Table 2-6). Since the ash moisture content was
extremely low compared to the underlying soils, minimal drainage from the ash would have
occurred until the ash approached or surpassed field moisture capacity (EPRI, 2002; Hillel,
2004). Fresh ash continually deposited in the landfill would also have prolonged this lag period
(EPRI, 2002). However, eventually the moisture content increased until the ash was moist
enough to allow infiltration into the ash and drainage through the material in the landfill (EPRI,
2002; Hillel, 2004).
Following installation of the intermediate liner and leachate collection system, contact
between percolating rainwater and the fly ash underneath the intermediate liner should be
eliminated. However, immediate mitigation will not occur because accumulated moisture within
the fly ash will likely continue to leach out the readily available water-soluble Se, and other trace
metals, in the weathered ash (Figure 2-14; EPRI, 2001). Once the moisture source is eliminated,
the fly ash will reach field capacity and recharge beneath the landfill should be eliminated (EPRI,
2002; Hillel, 2004). It is unknown what the lag time will be before Se concentrations are
reduced below the GWPS of 50 μg Se L-1. Previous research by EPRI (2002), reported effective
remediation (i.e., groundwater concentrations < 5 μg Se L-1) of Se from groundwater within four
years after installation of a 60 mil HDPE liner. Hydraulic conductivity values between the EPRI
(2002) research site (i.e., 2.4 x 10⁻³ cm s-1) and the Flint Creek site (Table 2-5) are similar;
however, groundwater Se concentrations were lower (~ 60 μg Se L-1) at the EPRI (2002)
research site. Eliminating the Se source should reduce groundwater Se concentrations and

101
prevent concentrations from increasing down gradient of the plume through adsorption to soil,
biological reduction, and dilution processes.
Following installation of the liner, percolating rainwater will have considerably less
contact with the fly ash deposited on top of the liner. This will especially be true within the
years directly after installation of the liner because the depth at which the fly ash will be
deposited on top of the intermediate liner will be substantially less compared to the average
thickness (i.e., 10.7 m; 35 feet) of the current weathered ash. With less contact between the ash
and percolating rainwater, the speciation could be different and the release of Se could be lower
than compared to the characteristics of the pre-liner leachate. The reaction kinetics of the
oxidation of selenite (Se4+) to selenate (Se6+) are not well understood, but appear to be a slow
process (Seby et al., 1998). Therefore, results from this extraction study may also provide
insight into the post-liner leachate Se concentrations entering the ABMet™ bioreactors.
�
SUMMARY AND CONCLUSIONS
When performing an environmental assessment of the potential environmental impact of
trace elements in fly ash, the total concentration is not nearly as important as knowing the water-
soluble and speciation fractions. The water-soluble fraction is the most likely fraction to be
released into the environment and the speciation is what determines the mobility and toxicity
once released. Fresh and weathered subbituminous PRB fly ash had significantly different
water-soluble Se, As, and Cr leaching characteristics, with fresh ash water-soluble concentrations
at or very near the MDL across all treatments. Differences between fresh and weathered ash
were likely due to the speciation present in the ash. Selenite (Se4+) was shown to be the
dominate species present in the fresh ash, likely preventing the release of Se during the water-
102
extraction study. Once landfilled, environmental weathering promotes the oxidation of selenite
(Se4+) to the highly mobile, water-soluble selenate (Se6+).
Although Cr and As speciation analyses was not performed, differences between fresh
and weathered ash water-soluble Cr concentrations indicate that the less water-soluble trivalent
(Cr3+) Cr was likely dominate in the fresh ash and the more water-soluble hexavalent (Cr6+) Cr
was likely dominate in the weathered ash. Weathered ash water-soluble Se and Cr
concentrations indicate that there is still a significant amount of Se and Cr readily available to be
released into the environment if allowed to come in contact with rainwater or groundwater.
Fresh and weathered ash water-soluble As concentrations at or near the MDL were likely due to
As existing and remaining in the arsenate (As5+) form. Previous research indicates that the less
water-soluble arsenate (As5+) is the dominate species present in fresh subbituminous PRB ash
and it is unlikely that the arsenate (As5+) is being reduced to the more water-soluble arsenite
(As3+) in the landfill (Huggins et al., 2007). Therefore, results from this study indicate that
speciation is likely responsible for the differences between extraction behavior of fresh and
weathered ash Se, As, and Cr concentrations.
Weathered ash water-soluble Se concentrations were greatest when extraction occurred
with environmentally representative rainwater and groundwater. Similarly, weathered ash water-
extractable Cr concentration was greatest with groundwater. Selenium and As extraction was
unaffected by extraction time; however, weathered ash water-soluble Cr concentration increased
as the extraction time increased from 2- to 6-hours. This research was not able to demonstrate if
6 hours was enough time to ensure maximum Cr extraction; therefore, a 24-hour extraction is
recommended for Cr (EPRI, 1994). Water-soluble As concentrations were too near the MDL to
make an informed decision for both fresh and weathered ash. Therefore, a longer extraction time

103
and lower dilution ratio may be required to obtain measurable water-extractable As
concentrations from a Class C fly ash (Wang et al., 2009). To obtain maximum fresh and
weathered ash suspension pH and EC, it is recommended to perform at minimum a 6-hour
extraction with deionized water for both fresh and weathered ash. Extraction with
environmentally representative rainwater and groundwater offered no distinct benefits when
compared to deionized water as the extractant of choice for suspension pH and EC.
It should be re-iterated that results from this study were derived from the extraction of a
Class C fly ash produced from the combustion of a subbituminous PRB coal and may not be
comparable to extraction from Class F fly ash, whereas the goal of this study was to better
understand the behavior of a site-specific fly ash and not fly ash in a holistic sense.

104
REFERENCES
Ahlrichs, J.S., and L.R. Hossner. 1987. Selenate and selenite mobility in overburden by saturated flow. J. Environ. Qual. 16:95-98. Al-Rashidy, S.M. 1999. Hydrogeologic controls of groundwater in the shallow mantled karst aquifer, Copperhead Spring, Savoy Experimental Watershed, northwest Arkansas. M.S. Thesis. University of Arkansas, Fayetteville, AR. Al-Qinna, M.I. 2003. Measuring and modeling soil water and solute transport with emphasis on physical mechanisms in karst topography. PhD. Diss. University of Arkansas, Fayetteville, AR. American Coal Ash Association (ACAA). 2011. Corrected 2009 coal combustion product (CCP) production and use survey. Available at http://acaa.affiniscape.com/ associations/8003/files/2009_CCP_Production_Use_Survey_Corrected_020811.pdf (verified 03 Mar. 2014). American Electric Power (AEP). 2010. Landfill nature and extent report: Southwestern electric power company, Flint Creek power plant. Available at http://www.adeq.state.ar.us/ftproot /Pub/WebDatabases/SolidWaste/PermittedFacilities/GenDocs/58471 (verified 03 Mar. 2014). American Electric Power (AEP). 2011. Second quarter 2011 groundwater analysis report. Available at http://www.adeq.state.ar.us/ftproot/Pub/WebDatabases/SolidWaste/ PermittedFacilities/GenDocs/608 (verified 03 Mar. 2014). American Society for Testing and Materials (ASTM). 2006. Standard test methods for sampling and testing fly ash or natural pozzolans for use in portland-cement concrete: ASTM C311. Available at http://www.astm.org.standards/C311.htm (verified 03 Mar. 2014). Andren, A.W., and D.H. Klein. 1975. Selenium in coal-fired steam plant emissions. Environ. Sci. Technol. 9:856-858. Arkansas Department of Environmental Quality (ADEQ). 2010. Permit for the construction and operation of a class 3N solid waste disposal facility: Permit 0273-S3N-R1. Available at http://www.adeq.state.ar.us/ftproot/Pub//SolidWaste/PermittedFacilities/GenDocs/ 57847 (verified 03 Mar. 2014). Arkansas Department of Environmental Quality (ADEQ). 2014. Fourth quarter groundwater analysis report. Available at http://www.adeq.state.ar.us/ftproot/Pub//SolidWaste/ Permitted Facilities/GenDocs/65447 (verified 03 Mar. 2014). Barceloux, D. 1999. Selenium. J. Toxicol. Clin. Toxicol. 37:145-172.

105
Baur, I. and C.A. Johnson. 2003. Sorption of selenite and selenate to cement materials. Environ. Sci. Technol. 37(15):3442-3447. Bolyard, S.E. 2007. Migration of landfill contaminants in a tilted-block mantled-karst setting in northwestern Arkansas. M.S. Thesis. University of Arkansas, Fayetteville, AR. Burns and McDonnell. 1992. Hydrogeologic site characterization at the existing ash landfill: Flint Creek power plant. Available at http://www.adeq.state.ar.us/ftproot/Pub/ WebDatabases/SolidWaste/PermittedFacilities/GenDocs/26121 (verified 03 Feb. 2014). Burns and McDonnell. 1993. Permit application and engineering report: Flint Creek power plant solid waste disposal facility. Overland Park, KS. Capp, J.P., and J.D. Spencer. 1970. Fly ash utilization: A summary of applications and technology. US Bureau of Mines. Information Circular. 8483:1-72. Chapman, P.M., W.J. Adams, M.L. Brooks, C.G. Delos, S.N. Luoma, W.A. Maher, H.M. Ohlendorf, T.S. Presser, and D.P. Shaw. 2009. Ecological assessment of selenium in the aquatic environment: Summary of a SETAC Pellston workshop. Soc. Environ.Toxicol. Chem. (SETAC). Available at http://www.setac.org/sites/ default/files/SELSummary.pdf (verified 03 Mar. 2014). Daigh, A.L., K.R. Brye, A.N. Sharpley, D.M. Miller, and E.E. Gbur. 2010. Broiler litter composition as affected by water extractant, dilution ratio, and extraction time. Comm. Soil Sci. and Plant Anal. 41:2340-2357. Dey, A., and R. Kulkarni. 2010. Selenium removal from refinery wastewater. UltraPure Water. Available at http://www.ultrapurewater.com (verified 4 Feb. 2014). Doheny-Skubic, M. 2006. Characterizing ground water basin flow in a regolith-covered, mantled karst terrain in northwest Arkansas. Carleton College, Northfield, MN. Duncan, R.C. 1983. Geochemical investigation of the Chattanooga shale, northwest Arkansas. M.S. Thesis, University of Arkansas, Fayetteville, AR. Electric Power Research Institute (EPRI). 1982. Electrostatic precipitator reference manual. Available at http://www.epri.com (verified 03 Mar. 2014). CS-2809. Electric Power Research Institute (EPRI). 1986. Geochemical behavior of chromium species. Available at http://www.epri.com (verified 08 Feb. 2014). EA-4544. Electric Power Research Institute (EPRI). 1987. Chemical characterization of fossil fuel wastes. Available at http://www.epri.com (verified 07 Feb. 2014). EA-5321.

106
Electric Power Research Institute (EPRI). 1994. A field and laboratory study of solute release from sluiced fly ash. Available at http://www.epri.com (verified 07 Feb. 2014). TR- 104585. Electric Power Research Institute (EPRI). 1998. Leaching of inorganic constituents from coal combustion by-products under field and laboratory conditions. Available at http:// www.epri.com (verified 07 Feb. 2014). TR-111773-V1. Electric Power Research Institute (EPRI). 2001. Evaluation of a remedial action at an unlined coal ash landfill: CS site. Available at http://www.epri.com (verified 26 Feb. 2014). TR- 1005214. Electric Power Research Institute (EPRI). 2002. Evaluation of a remedial action at an unlined coal ash landfill: PI site. Available at http://www.epri.com (verified 26 Feb. 2014). TR- 1005262. Electric Power Research Institute (EPRI). 2005. Arsenic and selenium speciation in fly ash and wastewater. Available at http://www.epri.com (verified 03 Mar. 2014). TR-1005567. Electric Power Research Institute (EPRI). 2006a. Characterization of field leachates at coal combustion product management sites: arsenic, selenium, chromium, and mercury speciation. Available at http://www.epri.com (verified 03 Mar. 2014). TR-1012578. Electric Power Research Institute (EPRI). 2006b. Review of water treatment technologies for selenium removal implemented at power plants. Available at http://www.epri.com (verified 03 Mar. 2014). TR-1020813. Electric Power Research Institute (EPRI). 2006c. Weathering processes and secondary minerals formed in coal ash. Available at http://www.epri.com (verified 07 Feb. 2014). IR- 1012582. Electric Power Research Institute (EPRI). 2010. Pilot-scale and full scale evaluation of treatment technologies for the removal of mercury and selenium in flue gas desulphurization water. Available at http://www.epri.com (verified 03 Mar. 2014). TR- 1017955. Electric Power Research Institute (EPRI). 2011. Chromium in coal combustion products. Available at http://www.epri.com (verified 10 Feb. 2014). TB-1022143. Electric Power Research Institute (EPRI). 2012. Adsorption of trace elements on fresh and weathered coal fly ash. Available at http://www.epri.com (verified 12 Feb. 2014). TR- 1023740. Elrashidi, M.A., D.C. Adriano, S.M. Workman, and W.L. Lindsay. 1987. Chemical equilibria of selenium in soils: A theoretical development. Soil Sci. 144:141-152.
107
Environmental Protection Agency (EPA). 1994. Determination of trace elements in waters and wastes by inductively coupled plasma-mass spectrometry. Available at http://www.epa.gov/region9/qa/pdfs/200_8dqiI1.pdf (verified 03 Mar. 2014). Environmental Protection Agency (EPA). 2004. Draft aquatic life water quality criteria for selenium. Available at http://water.epa.gov/scitech/swguidance/standards/criteria /aqlife/selenium/upload/complete-2.pdf (verified 12 Feb. 2014). Environmental Protection Agency (EPA). 2007a. Inductively coupled plasma atomic emission spectometry: Method 6010C. Available at http://www.epa.gov/osw/hazard/testmethods /sw846/pdfs/6010c.pdf (verified 03 Mar. 2014). Environmental Protection Agency (EPA). 2007b. Inductively coupled plasma mass spectrometry: Method 6020A. Available at http://www.epa.gov/osw/hazard/ testmethods/sw846/pdfs/6020a.pdf (verified 03 Mar. 2014). Environmental Protection Agency (EPA). 2011. Groundwater and drinking water standards. Available at http://water.epa.gov/drink/index.cfm (verified 03 Mar. 2014). Fenneman, N.M. 1938. Physiography of eastern United States. McGraw-Hill Book Co., New York. Fujita, M., M. Ike, M. Kashiwa, R. Hashimoto, and S. Soda. 2002. Laboratory-scale continuous reactor for soluble selenium removal using selenate-reducing bacterium, bacillus sp. sf-1. Biotechnol. Bioeng. V. (7):755-760. Goh, K.H., and T.T. Lim. 2004. Geochemistry of inorganic arsenic and selenium in a tropical soil: Effect of reaction time, pH, and competitive anions on arsenic and selenium adsorption. Chemosphere 55:849-859. Goldberg, S., S. Hyun, and L.S. Lee. 2008. Chemical modeling of arsenic (III, V) and selenium (IV, VI) adsorption by soils surrounding ash disposal facilities. Vadose Zone J. 7:1231- 1238. Golder & Associates. 2009. Literature review of treatment technologies to remove selenium from mining influenced water. Available at http://www.golder.com (verified 4 Feb. 2014). Hassett, D. J., and D.F. Pflughoeft-Hassett. 2002. Evaluating coal combustion by- products (CCBs) for environmental performance. In “Coal Combustion By-Products and Western Coal Mines: A Technical Interactive Forum”. Hassett, D. J., D.F. Pflughoeft-Hassett, L.V. Heebink. 2005. Leaching of CCBs: observations from over 25 years of research. Fuel 84:1378-1383.
108
Hayashi, H., K. Kanie, K. Shinoda, A. Muramatsu, S. Suzuki, and H. Sasaki. 2009. pH- dependence of selenate removal from liquid phase by reductive Fe(II)-Fe(III) hydroxysulfate compound, green rust. Chemosphere 76:638-643. Helmuth, R.A. 1987. Fly ash in cement and concrete. Portland Cement Co., Skokie, IL. Hillel, D. 2004. Introduction to environmental soil physics. Academic Press, New York. Huang, Y., B. Jin, Z. Zhong, R. Xiao, Z. Tang, and H. Ren. 2004. Trace elements (Mn, Cr, Pb, Se, Zn, Cd, and Hg) in emissions from a pulverized coal boiler. Fuel Process Technol. 86:23-32. Huggins, F., C.L. Senior, P. Chu, K. Ladwig, and G.P. Huffman. 2007. Selenium and arsenic speciation on fly ash from full-scale coal-burning utility plants. Environ. Sci. Technol. 41:3284-3289. Hull and Associates. 2011. Permit modification application for the intermediate liner and leachate collection system. Available at http://www.adeq.state.ar.us/ftproot/Pub/ WebDatabases/SolidWaste/PermittedFacilities/GenDocs/59803 (verified 03 Mar. 2014). Imes, J.L., and L.F. Emmett. 1994. Geohydrology of the Ozark plateaus aquifer system in parts of Missouri, Arkansas, Oklahoma, and Kansas. USGS. US Geological Survey Professional Paper: 1414-D. Jackson, B.P., and W.P. Miller. 2000. Effectiveness of phosphate and hydroxide for desopriton of arsenic and selenium species from iron oxides. Soil Sci. Am. J. 64:1616-1622. Kitto, J.B., and S.C. Stultz. 2005. Steam its generation and use: 41st Edition. Babcock & Wilcox Company, Barberton. Kiwerska, K.N. 2002. Crushed aggregates from class C fly ash. Diss. University of Missouri, Kansas City, MO. Laubhan, A.C. 2007. A hydrogeologic and water-quality evaluation of the Springfield aquifer in the vicinity of north-central Washington county, Arkansas. M.S. Thesis University of Arkansas, Fayetteville, AR. Lecuyer, I., S. Bicocchi, P. Ausset, and R. Lefevre. 1996. Physico-chemical characterization and leaching of desulphurization coal fly ash. Waste Manage. Res. 14(1):15-28. Lemly, A.D. 1999. Selenium impacts on fish: An insidious time bomb. Hum. Ecol. Risk Assess. 5:1139-1151. Lopez-Anton, M.A., M. Diaz-Somoano, D.A. Spears, and M.R. Martinez-Tarazona. 2006. Arsenic and selenium capture by fly ashes at low temperature. Environ. Sci. Technol. 40:3947-3951.

109
Lortie, L., W.D. Gould, S. Rajan, R.G.L. McCready, and K.J. Cheng. 1992. Reduction of selenate and selenite to elemental selenium by a Pseudomonas stutzeri isolate. Appl. Environ. Microbiol. 58:4042-4044. Lou, Y., D.E. Giammar, B.L. Huhmann, and J.G. Catalano. 2011. Speciation of selenium, arsenic, and zinc in class C fly ash. Energy Fuels 25:2980-2987. Martens, D.C., M.G. Schnappinger, J.W. Doran, and F.R. Mulford. 1970. Ash utilization: Fly ash as a fertilizer. US Bureau of Mines. Information Circular 8488:310-330. Martin, J.W. 1993. Controls on groundwater flow and quality in the Boone-St. Joe aquifer in north-central Benton county, Arkansas. M.S. Thesis. University of Arkansas, Fayetteville, AR. Mattigod, S.V., D. Rai, L.E. Eary, and C.C. Ainsworth. 1990. Geochemical factors controlling the mobilization of inorganic constituents from fossil fuel combustion residues: I. Review of the major elements. J. Environ. Qual. 19:188-201. Mattigod, S.V. and T.R. Quinn. 2003. Selenium content and oxidation states in fly ashes from western US coals. 2003. p. 143-153. In Sajwan et al., (eds). Chemistry of Trace Elements In Fly Ash. New York. McDonald, M., K.R. Brye, D.M. Miller, and E.E. Gbur. 2009. Broiler-litter application and soil- depth effects on arsenic sorption. Soil Sci. 174:661-675.
McFarland, J.D. III. 1975. Lithostratigraphy and conodont biostratigraphy of lower Mississippian strata, northwest Arkansas. M.S. Thesis, University of Arkansas, Fayetteville, AR. Miller, D.A. 2010. Bi-weekly e-mail update: NPDES permit tracking number AR0037842. Available at http://www.adeq.state.ar.us/ftproot/Pub/WebDatabases/SolidWaste/ PermittedFacilities/GenDocs/57028 (verified 03 Mar. 2014). Narukawa, T., A. Takatsu, K. Chiba, K.W. Riley, and D.H. French. 2005. Investigation on chemical species of arsenic, selenium, and antimony in fly ash from coal fuel thermal power stations. J. Environ. Monit. 7:1342-1348. National Oceanic and Atmospheric Administration (NOAA). 2011. Annual precipitation. Available at http://noaa.gov/ (verified 03 Mar. 2014). Natural Resource Conservation Service (NRCS). 2008. Soil map Benton county, Arkansas. Available at http://www.websoilsurvey.nrcs.usda.gov/app/WebSoilSurvey.aspx (verified 03 Mar. 2014).

110
National Resource Conservation Services (NRCS). 2011. Web soil survey. Available at http://websoilsurvey.nrcs.usda.gov/app/HomePage.htm (verified 03 Mar. 2014). Neal, R.H., and G. Sposito. 1989. Selenate adsorption on alluvial soils. Soil Science Soc. Am. J. 53:70-74. Otero-Rey, J.R., M.J. Mato-Fernandez, J. Moreda-Pineiro, E. Alonso-Rodriguez, S. Muniategui-Lorenzo, P. Lopez-Mahia, and D. Prada-Rodriguez. 2005. Influence of several experimental parameters on As and Se leaching from coal fly ash samples. Anal. Chim. Acta 531:299-305. Peak, D., and D.L. Sparks. 2002. Mechanisms of selenate adsorption on iron oxides and hydroxides. Environ. Sci. Technol. 36:1460-1466. Phillips, W.W., and M.D. Harper. 1977. Soil survey of Benton county, Arkansas. USDA Soil Conservation Service. Washington. Pickett, T., J. Sonstegard, and B. Bonkoski. 2006. Using biology to treat selenium. Power Engineering. Available at http://www.powergenworldwide.com (verified 3 Feb. 2014). Rankin, R.A. 1998. Ground water atlas of the United States: Arkansas, Louisiana, Mississippi. USGS. Information Circular: HA 730-F. Sargent and Lundy Engineers. 1974. Flint Creek power plant environmental report. Chicago, IL. Seby, F., M. Potin-Gautier, E. Giffaut, and O.F.X. Donard. 1998. Assessing the speciation and the biogeochemical processes affecting the mobility of selenium from a geological repository of radioactive wastes to the biosphere. Analusis. 26:193-198. Seshadri, P., D. Sisk, F. Bowman, S. Benson, and W. Seames. 2011. Leachability of arsenic and selenium in submicron coal fly ash. World of Coal Ash Conference. Available at http:// www.flyash.info/ (verified 03 Mar. 2014). Shanks, J.L. 1976. Petrology of the St. Joe limestone in its type area, north-central Arkansas. M.S. Thesis. University of Arkansas, Fayetteville, AR. Smith, C.R. 1992. Ground water chemistry and quality in Benton county, Arkansas with a suggested ground water flow model for northwestern Arkansas. M.S. Thesis. University of Arkansas, Fayetteville, AR. Smith, K., A.O. Lau, and F.W. Vance. 2009. Evaluation of treatment techniques for selenium removal. International Water Conference. IWC-09-05. Solem-Tishmack, J.K., G.J. McCarthy, B. Docktor, K.E. Eylands, J.S. Thompson, and D.J. Hassett. 1995. High-calcium coal combustion byproducts: Engineering properties,

111
ettringite formation, and potential application in solidification and stabilization of selenium and boron. Cement and Concrete Research 25(3):658-670. Sonstegard, J., and T. Pickett. 2005. ABMet biological selenium removal from FGD wastewater. International Water Conference. IWC-05-72. Available at http://www.regulations.gov/ fdmspublic (verified 4 Feb. 2014). Sonstegard, J., T. Pickett, J. Harwood, and D. Johnson. 2008. Full scale operation of GE ABMet biological technology for the removal of selenium from FGD wastewaters. International Water Conference. IWC-08-31. Sonstegard, J., J. Harwood, and T. Pickett. 2010. ABMet: Setting the standard for selenium removal. GE Water and Process Technologies. Water Environment Federation. IWC-10- XX. Available at http://www.wef.org (verified 3 Feb. 2014). Spallholz, J.E., and D.J. Hoffman. 2002. Selenium toxicity: Cause and effects in aquatic birds. Aquatic Toxicol. 57:27-37. Stam, A.F., R. Meij, H.T. Winkel, R.J. Eijk, F.E. Huggins, and G. Brem. 2011. Chromium speciation in coal and biomass co-combustion products. Environ. Sci. Technol. 45(6):2450-2456. Terracon Consulting (Terracon). 2006. NOD response to major permit modification revisions. Available at http://www.adeq.state.ar.us/ftproot/Pub/WebDatabases/ SolidWaste/PermittedFacilities/GenDocs/38963 (verified 03 Mar. 2014). United States Census Bureau (US Census). 2010. Population. Available at http://www. census.gov/ (verified 03 Mar. 2014). United States Energy Information Administration (EIA). 2010. Monthly electric usage/home. Available at http://www.eia.doe.gov/ (verified 03 Mar. 2014). United States Energy Information Administration (EIA). 2011. Electric power annual. Available at http://www.eia.doe.gov/ (verified 03 Mar. 2014). Wang, J., T. Wang, and J.G. Burken. 2007. The leaching characteristics of selenium from coal fly ashes. J. Environ. Qual. 36:1784-1792. Wang, T., J. Wang, Y. Tang, H. Shi, and K. Ladwig. 2009. Leaching characteristics of arsenic and selenium from coal fly ash: role of calcium. Energy Fuels 23:2959-2966. Wesche, K. 1991. Fly ash in concrete: Properties and performance. E & FN Spoon., Great Britian.

112
Willis, W.H. 1978. Relationship of photo-lineaments for well yields and ground water chemistry on north central Benton county. M.S. Thesis. University of Arkansas. Fayetteville, AR. Wolniak, D.E., D.A. Haley, W. Millard, D.E. Tubbs, S.M. Stawasz, and R.B. Gutekunst. 1978. Engineering data: Flint Creek power plant. Sargent & Lundy Engineers, Chicago, IL. World Health Organization (WHO). 1996. Trace elements in human nutrition and health. Available at http://www.who.int/nutrition/publications/micronutrients/ 9241561734/ en/index.html (verified 03 Mar. 2014). Yeheyis, M.B. 2008. Evaluation of coal fly ash for use in mine waste management. PhD.Diss. University of Western Ontario, Canada. Ylaranta, T. 1982. Volatilization and leaching of selenium added to soils. Ann. Agric. Fenn. 21:103-114. Yuan, C.G. 2009. Leaching characteristics of metals in fly ash from coal-fired power plant by sequential extraction procedure. Microchim. Acta 165:91-96. �
�
�
�
�
�
�
�
�
�
�
�
�
�
�

113
Table 2-1. Analysis of sub-bituminous coal used at the Flint Creek Power Plant for electrical generation.†
Parameter Values Proximate Analysis (wt %) Moisture 28.4 Ash, dry 6.4 Volatile Matter, dry 43.8 Fixed Carbon, dry 49.8 Ultimate Analysis (wt %) Carbon 69.7 Hydrogen 4.8 Nitrogen 0.9 Chlorine < 0.01 Sulfur 0.31 Ash 6.4 Oxygen Trace Elements (mg kg-1) Arsenic Barium Beryllium Boron Cadmium Chlorine Chromium Copper Fluorine Lead Manganese Mercury Molybdenum Nickel Selenium Silver Strontium Thallium Tin Vanadium Zinc
17.89 < 1 346 0.2 27 < 0.2 13 4 11 70 2 7 0.06 < 2 3 < 1 < 0.2 160 < 1 < 1 10 7
Zirconium 14 †Samples were collected and analyzed at the Rochelle/ North Antelope mine (Wyodak-Anderson Seam in Wyoming.
�
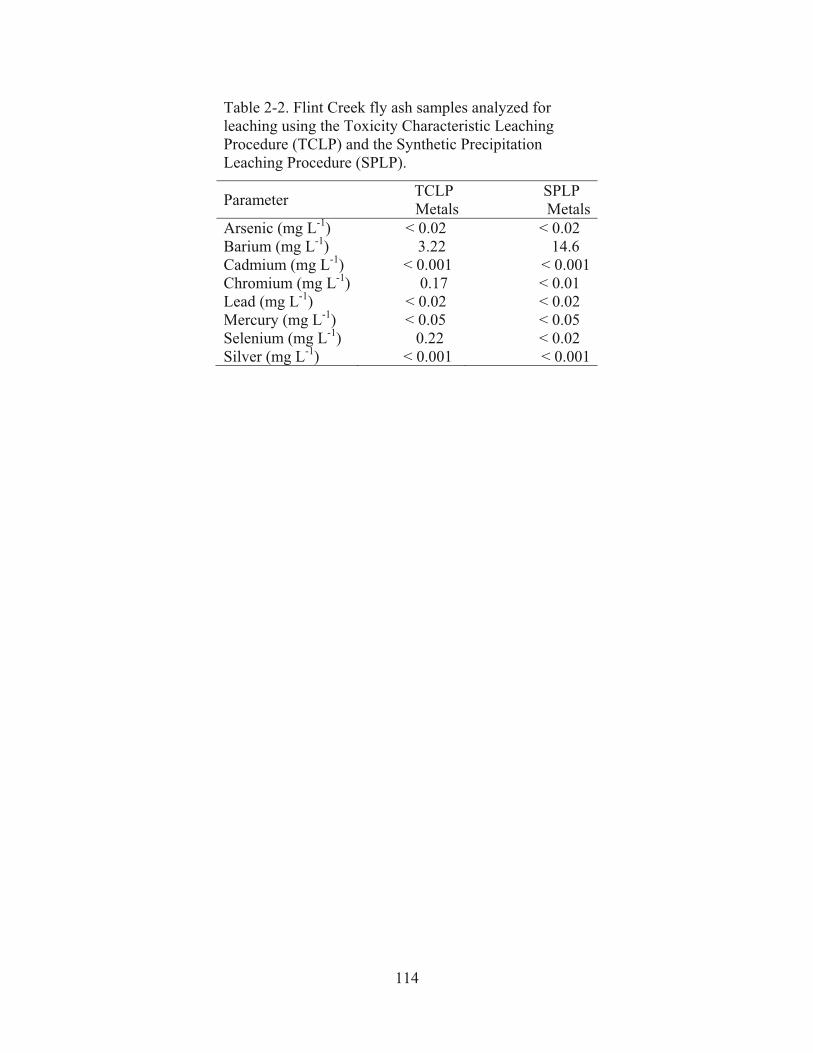
114
�
Table 2-2. Flint Creek fly ash samples analyzed for leaching using the Toxicity Characteristic Leaching Procedure (TCLP) and the Synthetic Precipitation Leaching Procedure (SPLP).
Parameter TCLP Metals
SPLP Metals
Arsenic (mg L-1) < 0.02 < 0.02 Barium (mg L-1) 3.22 14.6 Cadmium (mg L-1) < 0.001 < 0.001 Chromium (mg L-1) 0.17 < 0.01 Lead (mg L-1) < 0.02 < 0.02 Mercury (mg L-1) < 0.05 < 0.05 Selenium (mg L-1) 0.22 < 0.02 Silver (mg L-1) < 0.001 < 0.001

115
Table 2-3. Assessment monitoring constituent (AMC) list for the groundwater protection standard (GWPS) sampled quarterly (AEP, 2010; EPA, 2011).
Constituent GWPS Arsenic, total (mg L-1) 0.01 Barium, total (mg L-1) 2.0 Boron, total (mg L-1) 7.3 Cadmium, total (mg L-1) 0.005 Chloride (mg L-1) Standard not applicable Chromium, total (mg L-1) 0.1 Copper, total (mg L-1) 1.3 Fluoride (mg L-1) 4.0 Iron, total (mg L-1) 11.0 Lead, total (mg L-1) 0.015 Manganese, total (mg L-1) 1.7 Mercury, total (mg L-1) 0.002 Molybdenum, total (mg L-1) 0.18 pH (field) 3.79 to 9.0 Selenium, total (mg L-1) 0.05 Silver, total (mg L-1) 0.18 Sulfate (mg L-1) 1200 Total Dissolved Solids (mg L-1) Standard not applicable Turbidity (field) Standard not applicable Zinc, total (mg L-1) 11.0

116
Table 2-4. Expanded Parameter (EP) list for the groundwater protection standard (GWPS) sampled once every three years (AEP, 2010; EPA, 2011).
Constituent GWPS Aluminum, total (mg L-1) 37.0 Antimony, total (mg L-1) 0.006 Arsenic, total (mg L-1) 0.01 Barium, total (mg L-1) 2.0 Beryllium, total (mg L-1) 0.004 Boron, total (mg L-1) 7.3 Cadmium, total (mg L-1) 0.005 Chloride (mg L-1) Standard not applicable Chromium, total (mg L-1) 0.1 Cobalt, total (mg L-1) 0.73 Copper, total (mg L-1) 1.3 Flouride, total (mg L-1) 4.0 Iron, total (mg L-1) 0.015 Manganese, total (mg L-1) 1.7 Mercury, total (mg L-1) 0.002 Molybdenum, total (mg L-1) 0.18 Nickel, total (mg L-1) 0.73 pH (field) 3.79 to 9.0 Potassium, total (mg L-1) Standard not applicable Selenium, total (mg L-1) 0.05 Silver, total (mg L-1) 0.18 Sodium (mg L-1) Standard not applicable Strontium, total (mg L-1) 22.0 Sulfate (mg L-1) 1200 Sulfide (mg L-1) Standard not applicable Thallium (mg L-1) 0.002 Tin, total (mg L-1) 22.0 Total dissolved solids (mg L-1) Standard not applicable Total suspended solids (mg L-1) Standard not applicable Vanadium, total (mg L-1) 0.037 Zinc, total (mg L-1) 11.0
�
�
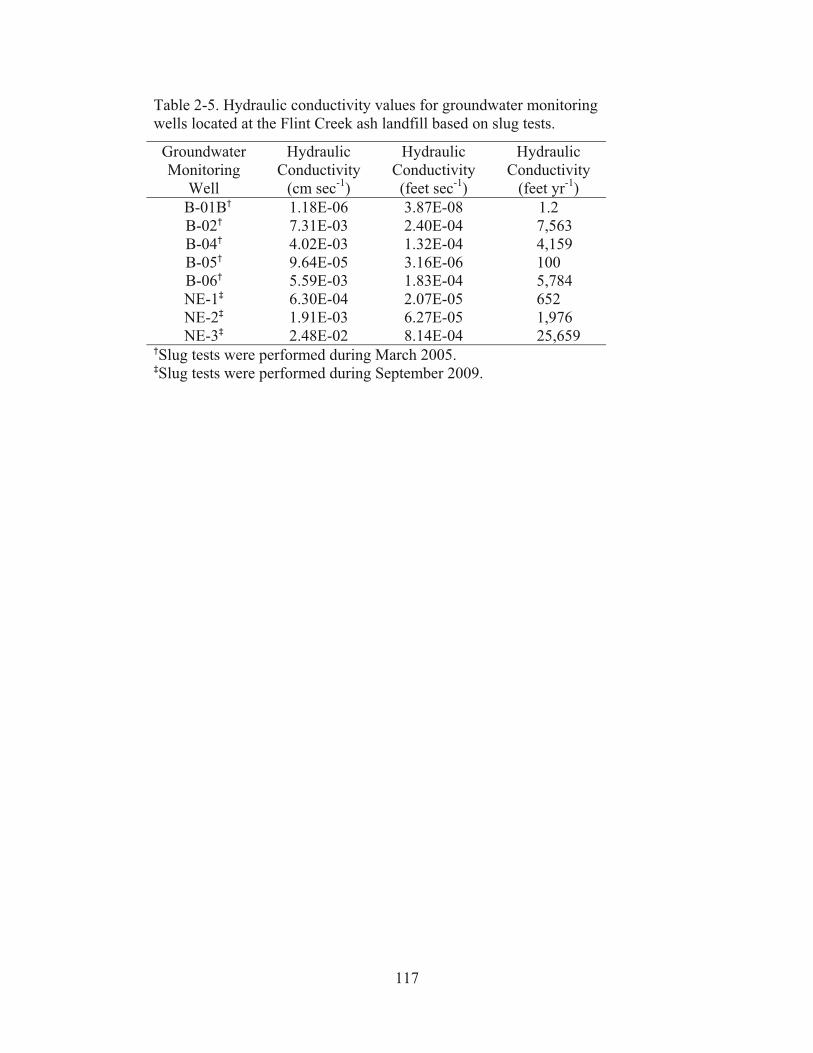
117
Table 2-5. Hydraulic conductivity values for groundwater monitoring wells located at the Flint Creek ash landfill based on slug tests.
Groundwater Monitoring
Well
Hydraulic Conductivity
(cm sec-1)
Hydraulic Conductivity (feet sec-1)
Hydraulic Conductivity
(feet yr-1) B-01B� 1.18E-06 3.87E-08 1.2
B-02� 7.31E-03 2.40E-04 7,563 B-04� 4.02E-03 1.32E-04 4,159 B-05� 9.64E-05 3.16E-06 100
B-06� 5.59E-03 1.83E-04 5,784 NE-1� 6.30E-04 2.07E-05 652 NE-2� 1.91E-03 6.27E-05 1,976 NE-3� 2.48E-02 8.14E-04 25,659
�Slug tests were performed during March 2005. �Slug tests were performed during September 2009.
�
�
�
�
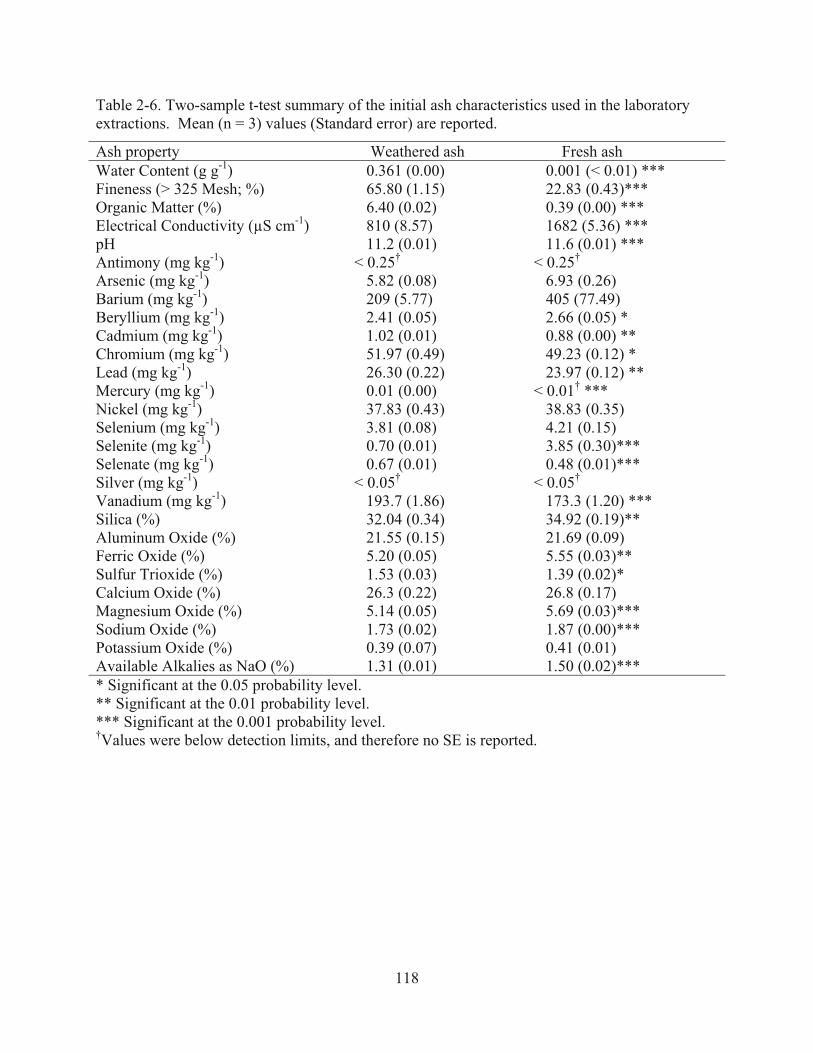
118
Table 2-6. Two-sample t-test summary of the initial ash characteristics used in the laboratory extractions. Mean (n = 3) values (Standard error) are reported.
Ash property Weathered ash Fresh ash Water Content (g g-1) 0.361 (0.00) 0.001 (< 0.01) *** Fineness (> 325 Mesh; %) 65.80 (1.15) 22.83 (0.43)*** Organic Matter (%) 6.40 (0.02) 0.39 (0.00) *** Electrical Conductivity (μS cm-1) 810 (8.57) 1682 (5.36) *** pH 11.2 (0.01) 11.6 (0.01) *** Antimony (mg kg-1) < 0.25† < 0.25† Arsenic (mg kg-1) 5.82 (0.08) 6.93 (0.26) Barium (mg kg-1) 209 (5.77) 405 (77.49) Beryllium (mg kg-1) 2.41 (0.05) 2.66 (0.05) * Cadmium (mg kg-1) 1.02 (0.01) 0.88 (0.00) ** Chromium (mg kg-1) 51.97 (0.49) 49.23 (0.12) * Lead (mg kg-1) 26.30 (0.22) 23.97 (0.12) ** Mercury (mg kg-1) 0.01 (0.00) < 0.01† *** Nickel (mg kg-1) 37.83 (0.43) 38.83 (0.35) Selenium (mg kg-1) 3.81 (0.08) 4.21 (0.15) Selenite (mg kg-1) 0.70 (0.01) 3.85 (0.30)*** Selenate (mg kg-1) 0.67 (0.01) 0.48 (0.01)*** Silver (mg kg-1) < 0.05† < 0.05† Vanadium (mg kg-1) 193.7 (1.86) 173.3 (1.20) *** Silica (%) 32.04 (0.34) 34.92 (0.19)** Aluminum Oxide (%) 21.55 (0.15) 21.69 (0.09) Ferric Oxide (%) 5.20 (0.05) 5.55 (0.03)** Sulfur Trioxide (%) 1.53 (0.03) 1.39 (0.02)* Calcium Oxide (%) 26.3 (0.22) 26.8 (0.17) Magnesium Oxide (%) 5.14 (0.05) 5.69 (0.03)*** Sodium Oxide (%) 1.73 (0.02) 1.87 (0.00)*** Potassium Oxide (%) 0.39 (0.07) 0.41 (0.01) Available Alkalies as NaO (%) 1.31 (0.01) 1.50 (0.02)*** * Significant at the 0.05 probability level. ** Significant at the 0.01 probability level. *** Significant at the 0.001 probability level. †Values were below detection limits, and therefore no SE is reported. �
�
�
�
�
�

119
Table 2-7. Analysis of variance summary of the initial water extractant characteristics used during the laboratory extractions. Mean (n = 3) values (Standard error) are reported. For the purpose of conducting statistical analyses, concentrations below instrument detection limits were reported as the detection limit value.
Extractant Extractant property Deionized water Rainwater Groundwater Electrical Conductivity (μS cm-1) 0.88 (< 0.01)a† 4.11 (< 0.01)b 295.6 (0.58)c pH 8.22 (0.01)a 5.24 (0.02)b 7.64 (0.02)c Aluminum (mg L-1) < 0.005‡a < 0.005‡a 0.007 (0.00)b Arsenic (mg L-1) < 0.005‡ < 0.005‡ < 0.005‡ Barium (mg L-1) < 0.001‡a < 0.001‡a 0.031 (0.00)b Calcium (mg L-1) 0.025 (0.01)a 0.193 (0.014)a 71.85 (0.55)b Chromium (mg L-1) < 0.001‡ < 0.001‡ < 0.001‡ Copper (mg L-1) 0.001 (0.00)a < 0.001‡a 0.002 (0.00)b Hardness, Ca (mg L-1) 0.06 (0.01)a 0.481 (0.035)a 179.5 (1.50)b Hardness, Mg (mg L-1) < 0.04‡a 0.055 (0.01)a 3.21 (0.02)b Hardness, Total (mg L-1) 0.075 (0.01)a 0.532 (0.039)a 182.5 (1.50)b Magnesium (mg L-1) < 0.01‡a 0.01 (0.00)a 0.780 (0.01)b Manganese (mg L-1) 0.002 (0.00) < 0.001‡ < 0.001‡ Potassium (mg L-1) < 0.01‡a 0.02 (0.00)a 0.487 (0.01)b Selenium (mg L-1) < 0.005‡ < 0.005‡ < 0.005‡ Sodium (mg L-1) < 0.01‡a 0.06 (0.00)b 1.77 (0.02)c Strontium (mg L-1) < 0.001‡a < 0.001‡a 0.036 (0.00)b Zinc (mg L-1) < 0.005‡a < 0.005‡a 0.015 (0.00)b Bicarbonate (mg L-1) 10 (0.00)a 10 (0.00)a 161.5 (0.50)b Total Alkalinity (mg L-1) 10 (0.00)a 10 (0.00)a 161.5 (0.50)b Nitrate-N (mg L-1) < 1.0‡a < 1.0‡a 1.2 (0.00)b Residue, Total (mg L-1) 9.50 (2.50)a 31.5 (23.50)a 202 (2.00)b Silica (mg L-1) < 0.1‡a < 0.1‡a 8.3 (0.00)b Total Dissolved Solids (mg L-1) 9.00 (3.00)a 12 (4.00)a 199.5 (4.50)b Total Suspended Solids (mg L-1) < 1‡ < 1‡ < 1‡ †Means followed by different letters in a row are significantly different at the 0.05 level. ‡Values were below detection limits, and therefore no SE is reported. �
�
�
�
�
�

120
Table 2-8. Analysis of variance summary of the effects of ash type, extraction time, extractant type, and their interaction on suspension pH and electrical conductivity (EC), and water-extractable selenium (Se), arsenic (As), and chromium (Cr) concentrations.
Source of Variation pH EC Se As Cr ____________________________________P______________________________________ Ash Type (Ash) < 0.01 < 0.01 < 0.01 < 0.01 < 0.01 Extraction Time (Time) Extractant Type (Extractant)
< 0.01 < 0.01
< 0.01 < 0.01
0.41 0.03
0.86 0.44
0.01 < 0.01
Ash x Time 0.69 < 0.01 0.41 0.39 < 0.01 Ash x Extractant 0.62 < 0.01 0.03 0.04 0.02 Time x Extractant < 0.01 < 0.01 0.80 0.44 0.68 Ash x Time x Extractant < 0.01 < 0.01 0.80 0.22 0.99 �
�
�
�
�
�
�

120
Tabl
e 2-
9. S
umm
ary
of th
e ef
fect
s of w
ater
ext
ract
ant a
nd e
xtra
ctan
t pro
perty
on
linea
r cor
rela
tions
(r) b
etw
een
susp
ensi
on p
H
and
EC, a
nd w
ater
-sol
uble
sele
nium
(Se)
, ars
enic
(As)
, and
chr
omiu
m (C
r) c
once
ntra
tions
for t
he w
eath
ered
ash
sam
ples
.
2
hr
6
hr
Extra
ctan
t Pro
perty
Ex
tract
ant
Se
A
s
Cr
S
e A
s C
r pH
D
I 0
.96*
*
-0
.64
0
.54
-
0.45
0.4
0 -0
.29
R
W
0
.19
0
.78
0.6
9
0.85
0.3
3
0.0
8
G
W
-0
.34
-0
.27
0.37
-0.
72
0
.34
-0.8
6 EC
† (μS
cm-1
) D
I
-0.7
2
0.4
5
-0.9
3*
0.
59
0
.09
0
.31
R
W
0
.29
-1.0
0***
-0.
23
0
.95*
*
0
.64
0
.59
GW
-0.2
2
0.1
2
-0.
29
0.8
0
-0
.06
0
.46
*
Sign
ifica
nt a
t the
0.0
5 pr
obab
ility
leve
l. **
Sig
nific
ant a
t the
0.0
1 pr
obab
ility
leve
l. **
* Si
gnifi
cant
at t
he 0
.001
pro
babi
lity
leve
l. † El
ectri
cal c
ondu
ctiv
ity
121

122
�Figure 2-1. Basic diagram of the boiler at the Flint Creek Power Plant. Selenium that is naturally enriched in the coal volatizes upon combustion and is carried with the flue gas stream through the convective section of the boiler. The flue gas enters the convective section around 1371 ºC (2500 ºF) and cools to a temperature of 399 ºC (750 ºF) before exiting the convective section. Selenium will condense on the surface of the fly ash at temperatures below 500 ºC (932 ºF; Sargent and Lundy Engineers, 1974).�

123
�Figure 2-2. Topographic map showing the property boundary for the Flint Creek Power Plant in relation to the ash landfill. Total property owned by American Electric Power (AEP) is approximately 607 hectares (1,500 acres). Modified from AEP Real Estate Asset Mgmt. Dept. (2010).

123
�� Fi
gure
2-3
. Cro
ss-s
ectio
n m
ap o
f the
ash
land
fill s
how
ing
the
final
gra
de, t
op o
f was
te, i
nter
med
iate
line
r, ex
istin
g as
h an
d bo
ttom
gr
ade
elev
atio
ns; m
odifi
ed fr
om A
EP (2
011)
. El
evat
ions
list
ed o
n le
ft an
d rig
ht y
-axi
s are
in fe
et a
bove
sea
leve
l. �
124

124
�
Figu
re 2
-4. S
impl
ified
cro
ss-s
ectio
n of
the
AB
Met
™ b
iore
acto
r. E
noug
h fr
ee-b
oard
mus
t be
mai
ntai
ned
with
in th
e bi
orea
ctor
to
allo
w fo
r ade
quat
e ex
pans
ion
of th
e bi
omat
rix d
urin
g th
e ba
ckw
ash
sequ
ence
to p
reve
nt w
asho
ut o
f the
bio
mat
rix.
125

125
�
�Fi
gure
2-5
. Mod
ified
flow
dia
gram
of t
he G
E A
BM
et™
bio
reac
tor t
o be
use
d at
the
Flin
t Cre
ek a
sh la
ndfil
l to
redu
ce se
leni
um
oxya
nion
s (Se
6+ a
nd S
e4+) t
o th
eir e
lem
enta
l for
m (G
E, 2
010)
. O
nly
one
of th
e th
ree
bior
eact
ors a
re sh
own
to si
mpl
ify th
e pi
ping
sc
hem
atic
.
AB
Met
Flo
w D
iagr
am
126

125
Figu
re 2
-6. A
eria
l im
age
of th
e gr
ound
wat
er m
onito
ring
wel
ls in
rela
tion
to th
e as
h la
ndfil
l. M
onito
ring
wel
ls th
at h
ave
exce
eded
th
e G
roun
dwat
er P
rote
ctio
n St
anda
rd o
f 50
μg S
e L-1
are
indi
cate
d in
red.
Wel
ls w
ith n
o Se
con
tam
inat
ion
are
indi
cate
d in
gre
en,
incl
udin
g th
e pr
ivat
e w
ell i
ndic
ated
in y
ello
w.
The
assu
med
mig
ratio
n of
the
Se p
lum
e is
indi
cate
d by
the
dash
ed re
d lin
e.
126 127

128
��Figure 2-7. Physiography map of the area surrounding the Flint Creek ash landfill. The ash landfill is located on the relatively flat, southward extension of the Springfield Plateau. Modified from Fenneman (1938).
CENTRAL
LOWLANDPROVINCE
OZARK
PLATEAUS
PROVINCE
PROVINCE
COASTAL PLAIN
PROVINCE
QUACHITA
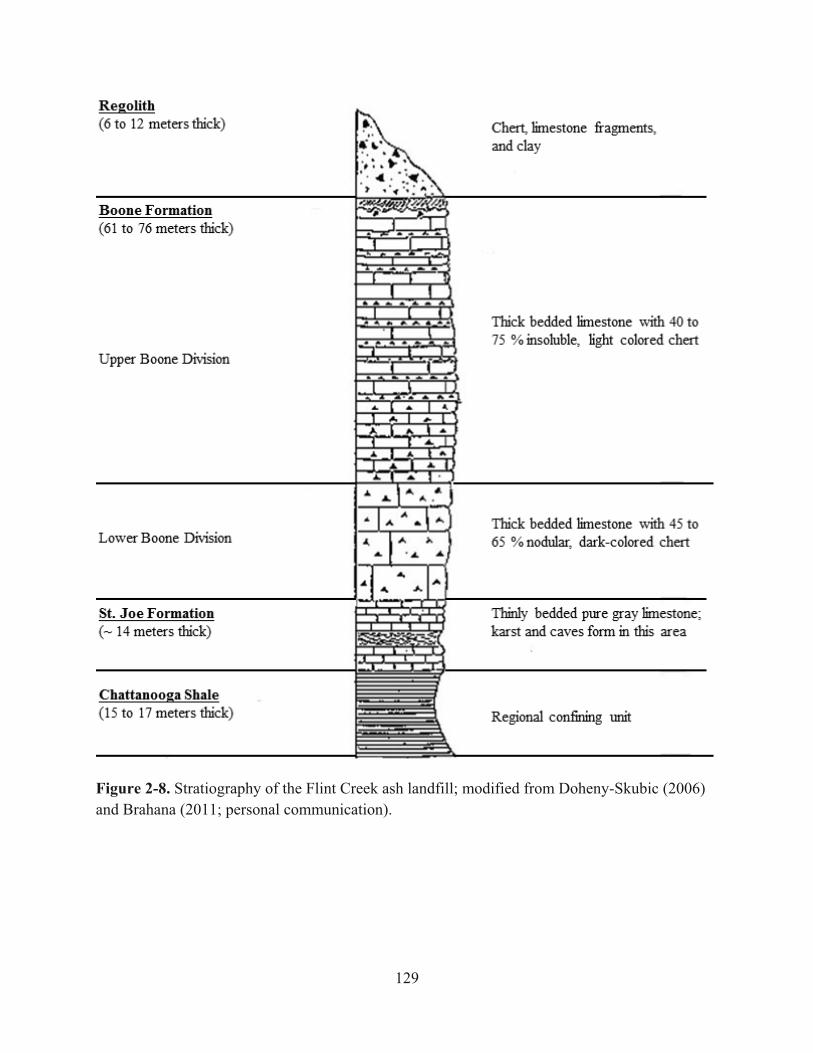
129
�
�Figure 2-8. Stratiography of the Flint Creek ash landfill; modified from Doheny-Skubic (2006) and Brahana (2011; personal communication).

129
�
Figu
re 2
-9. C
ross
-sec
tiona
l sch
emat
ic o
f the
per
ched
sele
nium
con
tam
inat
ion
in th
e re
golit
h at
the
Flin
t Cre
ek a
sh la
ndfil
l; no
t dra
wn
to sc
ale.
130

130
Figu
re 2
-10.
Und
erly
ing
soils
map
of t
he F
lint C
reek
ash
land
fill a
rea.
Lin
ker f
ine
sand
y lo
am (L
rC),
Nix
a ve
ry g
rave
lly si
lt lo
am
(NfC
), C
aptin
a si
lt lo
am (C
nB),
Elsa
h so
ils (E
g), a
nd N
oark
ver
y gr
avel
ly si
lt lo
am (N
oD) a
re so
il se
ries l
ocat
ed b
enea
th th
e as
h la
ndfil
l. M
odifi
ed fr
om N
RC
S- N
atur
al R
esou
rces
Con
serv
atio
n Se
rvic
es.
131
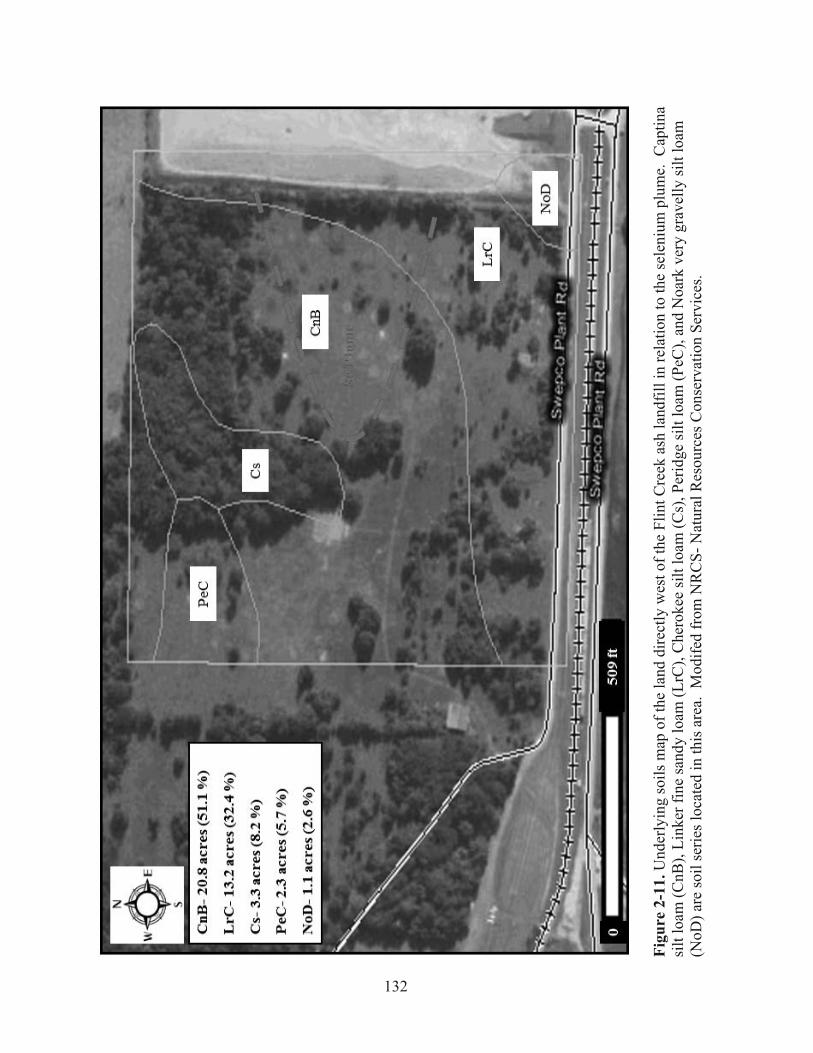
131
Figu
re 2
-11.
Und
erly
ing
soils
map
of t
he la
nd d
irect
ly w
est o
f the
Flin
t Cre
ek a
sh la
ndfil
l in
rela
tion
to th
e se
leni
um p
lum
e. C
aptin
a si
lt lo
am (C
nB),
Link
er fi
ne sa
ndy
loam
(LrC
), C
hero
kee
silt
loam
(Cs)
, Per
idge
silt
loam
(PeC
), an
d N
oark
ver
y gr
avel
ly si
lt lo
am
(NoD
) are
soil
serie
s loc
ated
in th
is a
rea.
Mod
ifed
from
NR
CS-
Nat
ural
Res
ourc
es C
onse
rvat
ion
Serv
ices
.
132

132
Figu
re 2
-12.
Gro
undw
ater
Se
conc
entra
tions
(μg
Se L
-1) a
s mon
itore
d at
thre
e w
ells
(B-0
2, N
E-3,
and
B-0
5) o
ver a
12-
yr p
erio
d at
the
Flin
t Cre
ek c
oal a
sh la
ndfil
l. B
-02
expe
rienc
ed a
n ex
ceed
ence
of t
he g
roun
dwat
er p
rote
ctio
n (G
WP)
stan
dard
in Ja
nuar
y 20
09 a
fter
four
con
secu
tive
read
ings
gre
ater
than
50
μg S
e L-1
. A
fter t
he e
xcee
denc
e, m
onito
ring
wel
l NE-
3 w
as in
stal
led
to d
eter
min
e th
e na
ture
an
d ex
tent
of t
he S
e pl
ume
dow
n-gr
adie
nt o
f wel
l B-0
2.
133

134
Figure 2-13. Suspension pH and electrical conductivity (EC) as affected by ash type (fresh and weathered), extraction time (2 and 6 hr), and water-extractant type [deionized water (DI), rainwater (RW), and groundwater (GW)]. Different letters atop bars within a property are significantly different at the 0.05 level.
B A C A C B F D F E G F
D
A
CE
A
B
H FG GH F FGH H
2 hr6 hr

135
Figure 2-14. Water-soluble selenium (Se), arsenic, (As), and chromium (Cr) concentration differences between ash types (fresh and weathered) across water-extractant types [deionized water (DI), rainwater (RW), and groundwater (GW)], averaged over extraction times. Different letters atop bars within a property are significantly different at the 0.05 level.
C
r (µ
g L
-1)
A
s (µg
L-1
) S
e (µ
g L
-1)

136
Figure 2-15. Water-soluble chromium (Cr) concentration differences between ash types (fresh and weathered) among extraction times (2 and 6 hr), averaged over water-extractant types. Different letters atop bars are significantly different at the 0.05 level.

137
APPENDICES Appendix A
AEP-Engineering has determined the hydraulic conductivity values for the groundwater
monitoring wells B-01B, B-02, B-04, B-05, B-06, NE-1, NE-2, and NE-3 based on slug tests.
These slug tests were performed by placing a Solinst LeveloggerII (serial number 1016823) at
the bottom of the groundwater monitoring wells (AEP, 2010). There were two types of PVC
slugs used during the testing; 1.52 meter x 3.18 cm (5 ft x 1.25 inch) and 1.52 meter x 2.54 cm (5
ft x 1.00 inch). The LeveloggerII measures the water pressure inside the groundwater
monitoring well before and after insertion of the PVC slug and converts this measured pressure
to a water depth value (AEP, 2010). To perform the necessary calculations, Aqtesolv® software
was used. It should be noted that slug tests for groundwater monitoring wells NE-1, NE-2, and
NE-3 were performed during September 2009 and slug tests for groundwater monitoring wells
B-01B, B-02, B-04, B-05, and B-06 were performed during March 2005.

138
Appendix B
New groundwater monitoring wells west of the ash landfill were constructed during June
2011 by Terracon. As part of the Nature and Extent Report, Terracon followed ASTM D5092
“Standard Practice for Design and Installation of Groundwater Monitoring Wells in Aquifers”
Regulation 22.1103. Below is a brief description of the techniques used to install the monitoring
wells.
An auger was used to drill down until weathered limestone was encountered. After auger
refusal, a 7.6 cm (3 inch) diameter Tri-cone air bit was then used to drill through the bedrock
until groundwater was encountered. When at least 3.1 meters (10 ft) of water was present in the
monitoring well, setting of the wells began. To allow groundwater penetration, the bottom 4.6
meters (15 ft) of each well utilized 5.1 cm (2 inch) diameter 0.254 mm (0.010 inch) machine
slotted PVC well screen. This procedure was followed by placing a 5.1 cm (2 inch) diameter
threaded, flush-joint PVC riser pipe to the ground surface. The well was then lined with pre-
sieved 12/20 grade silica sand around the well screen from the bottom of the boring to
approximately 0.6 meters (2 ft) above the top of the well screen. Above the sand liner, 0.6
meters (2 ft) of hydrated bentonite pellets were used to seal off the monitoring well to prevent
intrusion of surface water. The remainder of the well was lined with Portland cement/bentonite
slurry to the ground surface. All wells are protected with monument type protective covers.

139
Appendix C
(Information below was derived from Phillips and Harper, 1977; NRCS, 2008).
The soil directly below the ash landfill is comprised of five different soil series: Linker
(LrC- 79.1 %), Nixa (Nfc- 7.9 %), Elsah (Eg- 5.8 %), Captina (CnB- 5.7 %), and Noark (NoD-
1.6 %). Linker soils cover approximately 13.8 hectares (34.1 acres) under the weathered fly ash
and are classified with a “B” hydrologic soil group rating (moderate water infiltration rate when
thoroughly wet). Linker soils are formed from weathering of sandstone (i.e, residuum), consist
of a fine sandy loam that is well-drained at the surface, has moderate permeability, low available
water capacity, and is considered unfavorable for landfill use.
Nixa soils cover approximately 1.4 hectares (3.4 acres) and have a “C” hydrologic soil
group rating (slow water infiltration rate when thoroughly wet). Nixa soils are formed from
weathering of cherty limestone (i.e., residuum), have very slow permeability, medium available
water capacity, and are very favorable for landfill use.
Elsah soils cover approximately 1.0 hectares (2.5 acres) and have a “B” hydrologic soil
group rating (moderate water infiltration rate when thoroughly wet). Elsah soils are formed from
sediment being washed from cherty upland soils (i.e., alluvium, colluvium), have moderately
rapid permeability, low available water capacity, and are unfavorable for landfill use.
Captina soils cover approximately 1.0 hectares (2.5 acres) and have a “C” hydrologic soil
group rating (slow water infiltration rate when thoroughly wet). Captina soils are formed from
loamy material overlying cherty limestone (i.e., residuum), have low water permeability,
medium available water capacity, and are moderately favorable for landfill use.
Noark soils cover approximately 0.3 hectares (0.7 acres) and have a “B” hydrologic soil
group rating (moderate water infiltration rate when thoroughly wet). Noark soils are a very

140
gravelly silty loam at the surface, well-drained, formed from weathering of cherty limestone (i.e.,
residuum), have moderate water permeability, medium available water capacity, and are
moderately favored for landfill use.

141
CONCLUSION
When performing an environmental assessment of the potential environmental impact of
trace elements in fly ash, the total concentration is not nearly as important as knowing the water-
soluble and speciation fractions. The water-soluble fraction is the most likely fraction to be
released into the environment and the speciation is what determines the mobility and toxicity
once released. Fresh and weathered subbituminous PRB fly ash had significantly different
water-soluble Se, As, and Cr leaching characteristics, with fresh ash water-soluble concentrations
at or very near the MDL across all treatments. Differences between fresh and weathered ash
were likely due to the speciation present in the ash. Selenite (Se4+) was shown to be the
dominate species present in the fresh ash, likely preventing the release of Se during the water-
extraction study. Once landfilled, environmental weathering promotes the oxidation of selenite
(Se4+) to the highly mobile, water-soluble selenate (Se6+).
Although Cr and As speciation analyses was not performed, differences between fresh
and weathered ash water-soluble Cr concentrations indicate that the less water-soluble trivalent
(Cr3+) Cr was likely dominate in the fresh ash and the more water-soluble hexavalent (Cr6+) Cr
was likely dominate in the weathered ash. Weathered ash water-soluble Se and Cr
concentrations indicate that there is still a significant amount of Se and Cr readily available to be
released into the environment if allowed to come in contact with rainwater or groundwater.
Fresh and weathered ash water-soluble As concentrations at or near the MDL were likely due to
As existing and remaining in the arsenate (As5+) form. Previous research indicates that the less
water-soluble arsenate (As5+) is the dominate species present in fresh subbituminous PRB ash
and it is unlikely that the arsenate (As5+) is being reduced to the more water-soluble arsenite
(As3+) in the landfill (Huggins et al., 2007). Therefore, results from this study indicate that

142
speciation is likely responsible for the differences between extraction behavior of fresh and
weathered ash Se, As, and Cr concentrations.
Weathered ash water-soluble Se concentrations were greatest when extraction occurred
with environmentally representative rainwater and groundwater. Similarly, weathered ash water-
extractable Cr concentration was greatest with groundwater. Selenium and As extraction was
unaffected by extraction time; however, weathered ash water-soluble Cr concentration increased
as the extraction time increased from 2- to 6-hours. This research was not able to demonstrate if
6 hours was enough time to ensure maximum Cr extraction; therefore, a 24-hour extraction is
recommended for Cr (EPRI, 1994). Water-soluble As concentrations were too near the MDL to
make an informed decision for both fresh and weathered ash. Therefore, a longer extraction time
and lower dilution ratio may be required to obtain measurable water-extractable As
concentrations from a Class C fly ash (Wang et al., 2009). To obtain maximum fresh and
weathered ash suspension pH and EC, it is recommended to perform at minimum a 6-hour
extraction with deionized water for both fresh and weathered ash. Extraction with
environmentally representative rainwater and groundwater offered no distinct benefits when
compared to deionized water as the extractant of choice for suspension pH and EC.
It should be re-iterated that results from this study were derived from the extraction of a
Class C fly ash produced from the combustion of a subbituminous PRB coal and may not be
comparable to extraction from Class F fly ash, whereas the goal of this study was to better
understand the behavior of a site-specific fly ash and not fly ash in a holistic sense.

143
REFERENCES
Electric Power Research Institute (EPRI). 1994. A field and laboratory study of solute release from sluiced fly ash. Available at http://www.epri.com (verified 07 Feb. 2014). TR- 104585. Huggins, F., C.L. Senior, P. Chu, K. Ladwig, and G.P. Huffman. 2007. Selenium and arsenic speciation on fly ash from full-scale coal-burning utility plants. Environ. Sci. Technol. 41:3284-3289. Wang, T., J. Wang, Y. Tang, H. Shi, and K. Ladwig. 2009. Leaching characteristics of arsenic and selenium from coal fly ash: role of calcium. Energy Fuels 23:2959-2966.