lead isotopic ratios, icp and xrf analyses, and fluid...
TRANSCRIPT

December31, 1998 Price: $2.00
Division of Geological & Geophysical Surveys
PUBLIC-DATA FILE 98-43
LEAD ISOTOPIC RATIOS, ICP AND XRF ANALYSES, AND FLUID INCLUSION DATA FROM THE
KADY Zn-Pb-Cu-Ag VEIN-BRECCIA PROSPECT, NORTHERN BROOKS RANGE, ALASKA
by
Melanie Werdon Department of Geology and Geophysics
University of Alaska Fairbanks
1998
THIS REPORT HAS NOT BEEN REVIEWED FOR TECHNICAL CONTENT (EXCEPT AS NOTED IN TEXT) OR FOR
CONFORMllY TO 1HE EDITORIAL STANDARDS OF DGGS.
Released by
STATE OF ALASKA
DEPARTMENT OF NATURAL RESOURCES
Division of Geological & Geophysical Surveys 794 University Avenue, Suite 200
Fairbanks, Alaska 99709-3645

INTRODUCTION
This paper presents ICP, XRF, Pb isotopic ratio and fluid inclusion data from the Kady Zn-Pb-Cu-Ag vein
breccia and disseminated sulfide prospect, located in the southwestern part of the Killik River Quadrangle, in the
north-central Brooks Range, Alaska. The Kady prospect is located within Gates of the Arctic National Park near the
headwaters of a tributary to Outwash Creek, at a latitude of 68° 12' N and longitude 154° 58' W in T32N, Rl 7E in
the Katee! River Meridian.
The north-central and northwestern Brooks Range of Alaska hosts widespread Zn-Pb-Ag sedimentary
exhalative massive sulfide (Sedex), vein-breccia, and disseminated sulfide deposits. The vein-breccia and
disseminated sulfide occurrences are not spatially associated with igneous rocks, and are hosted by a deformed but
only weakly metamorphosed package of Upper Devonian to Lower Mississippian mixed continental and marine
elastic rocks (the Endicott Group). The Sedex deposits (e.g. Red Dog) are hosted by black siliceous carbonaceous
shale and mudstone of the Mississippian to Pennsylvanian Kuna Formation. Most of the vein-breccia and
disseminated sulfide occurrences are Carboniferous in age (Werdon and others, 1998), and along with the Sedex
deposits, formed as part of a regional Carboniferous basinal dewatering event (Werdon, in review).
GEOCHEMICAL ANALYSES
The distribution of sulfide mineralization at the Kady vein-breccia and disseminated sulfide prospect is shown
in figure 1. Numerous Zn-Pb-Ag vein-breccia prospects, including Kady, were sampled in 1991 by the U.S. Bureau
of Mines as part of their study of the Colville Mining District (Meyer and Kurtak, 1992). Mineralized hand samples
were analyzed by Bondar Clegg by the ICP emission spectrometry and fire assay methods. In the U.S. Bureau of
Mines data set, rocks from vein-breccia occurrences in the northern Brooks Range show detectable levels of Te, Bi,
Mo, and W in ICP analyses (Meyer and Kurtak, 1992), elements that are not generally associated with sediment
hosted sulfide deposits (Goodfellow and others, 1993). These element concentrations correlated unusually well with
Zn, Cu, and (or) Pb (e.g. Zn-W; R2 = 0.999), particularly in samples in which Zn, Pb, and Cu approached or
exceeded Bondar Clegg's ICP saturation limits (2 percent Zn, 2 percent Cu, 1 percent Pb). The Zn interference on
tungsten in ICP analyses is a common problem. For example, the W 207.911 spectral line is used for the
determination of tungsten, however, ifthe concentration of Zn becomes too high, then the tungsten 224.875 spectral
line is used to overcome interference problems (David Tye, written communication, 1998). This interference was
not corrected for in the Meyer and Kurtak (1992) database (David Tye, personal comm., 1993). XRF analyses of
several pulps from the Meyer and Kurtak ( 1992) data set suggest Bi is not present in significant quantities, and that
Mo is present at low concentration levels. The very high level of Bi and Mo in Kady sample 5455 is interpreted to
reflect an interference problem in the XRF analyses between Pb and Bi and Mo, since the sample contains about 60
percent Pb (table 1 ). It appears that interference in spectral lines caused false concentrations for Bi, Mo, and W
values. It is unlikely that elevated Te concentrations are present within the vein-breccia occurrences, but this
hypothesis was not tested with XRF or other methods.
2

Relatively high levels of Sn, As and Au were also reported in ICP analyses (Meyer and Kurtak, 1992; Kelley
et al., 1997), and in emission spectrographic data (Duttweiler, 1987; Kelley et al., 1997); and Sn was reported in
XRF analyses (table 1). At Kady, high Sn values occur within veins with high Zn ICP analyses, and there is a weak
correlation between the elements. No Sn, Au or As bearing minerals were observed in polished thin sections.
Table 2 contains the U.S. Bureau of Mines geochemical data set (Meyer and Kurtak, 1992) for the Kady
deposit. Their data set is keyed to map locations (Werdon, in press) to provide a record of where the samples were
taken.
3

I 11 155"00 '(:S
.. ·.· . ... '. ·. · .. ·. · .' .
A lm wide Sp-dominant vein with lesser Q, Cp & GI. Numerous <2 cm Q veins over 150m area Bleached gray sandst. w/ tr dissem. Sp & GI.
B 25m wide zone of Q+Cp+Py bx w/ peripheral veinlets (<2cm) ofQ+Gl+Cal; Bleached, gray sandst w/ iron-stainrng, tr dissem. Sp & GI.
C Sandst. bx, cemented & cut by Q+Sp+tr GI, cut by late Cal veins. Sm wide gossanous area of massive zinc-carbonate.
EXPLANATION
Gray sandstone of the Kanayut Conglomerate
Disseminat~ sphalerite, galena and (or) limonite after sphalente
Strike and dip ofvein-breccia zone; letter refers to mineralized areas
Vertically dipping vein-breccia zone
Plunging monocline
High angle fault
Thrust fault
Location of 40Art 3k sample
Pb>0.8% Cu>1% As> lOOppm Co+Ni>lOOppm
Killik River (A-4) Quadrangle, T32N, RI 7E
0 O.SMILES
0 SOOMETERS
G 65m wide zone w/ barren Q veins+/- late Cal. p Q Discontinuous between P&Q . . Sm wide zone of X Bleached, iron-stained, gray sandst. cut by Q
Largest Q vem l.7m wide, numerous smaller parallel Q ve~ns to 7..Scm at pornt Q. Q-vemmg, veins w/ Sp+ min~r Cp, GI.& Cal. Trends over
Q vems to 25cm Large Q vem shghtly folded bleach mg & rron-stammg of gray sandst. at P. towards Y. Zone JS approximately !Om wide.
H Numerous O veins w/ Cp+Sp+tr Gl+/-late Cal (up R 3.8-1 Om wide, complex vein-breccia zone. Clasts y Z Bleached, iron-stained, gray sandst Porous,
to 25cm wide). Carbonate cement removal halos, of sandst , shale & sulfides. Barren 0 veining to likely contains disseminated Sp or GI. Sandst
& bleaching near veins. Secondary Azur. & Mal. north. Q, Sp & Cp dominant, minor GI, Py & Cal. partially cemented by zinc carbonate.
IJ Bleached, iron-stained, gray sandst Very porous, S 30m zone ofstockwork Q veins +/- Cal . Fault at AA l m wide zone of thin (<3cm) parallel Q veins.
likely contains dissemmated Sp or GI. Cut by a base of outcrop contains an inversely-graded Paragenesis from Q to tr Gl+dark Sp+tr Py+
few minor Q veins (<2cm wide) w/ tr Sp. breccia w/ clasts of sandst. cemented liy Q +tr Py. Cp(?) to light Sp.
D 1 Om by 40m zone of bx oriented parallel to axis of KL Discontinuous vein-breccia zone up to I Om T l.5m wide breccia zone. Sandst clasts to 75cm & AB 50m by !Om breccia zone of sandst clasts w/
antiform. General paragenesis: sandst. breccia to wide. Q w/ lesser Sp & GI, mostly in sandst., 2 clasts ofSp+Q, cemented by Q+tr Sp+ late Cal. Q cement. Intergrown Q & light to medium
chalce<I. Q to blk. Sp to chalced. Q to yell . Sp to Q. minor amt in shale. Minor Q-Cal veins at L. 5-15cm wide Sp vein along breccia zone footwall. orange Sp w/ net texture in Sm by 2m area.
E 30m wide zone of numerous Q veins (<6cm wide) M +/-Sp+/-Gl. Some brecciation of sandst. Minor black shale in sheared area.
Bleached, iron-stained, porous, gray sandst. which 30-37m wide major fault zone. Sandst. blocks AC Bleached, porous, iron-stained, gray sandst.
likely contains disseminated Sp or GI. Cut by Q UV to 20m. Dominantly Q veining w/ variable Sp w/ trace disseminated Sp(?). 1 Om by Im zone
veins (<2cm wide) w/ tr Sp. Zone width vanes. & G~ and trace Cp. Zone narrows towards V of thin Q veins w/ minor Sp+Gl.
F 25m wide area of brecciated, quartz veined sandstone with minor Sp & GI.
NO Bleached! iron-stained, gray sandst w/ dissem. W 120m by 60m area cut by numerous sub-parallel AD -AE Bleached, porous, iron-stained, gray
Sp and G. Cut by several(..! veins (<2cm veins ofQ+Sp+/-Gl+/-Cp+/-Py. Width varies sandst. w/ dissem. GI & tr Sp (up to
wide) w/ tr Sp+Gl. between 2mm & 50cm. I barren sandst. bx w/ Q. 2%, average < 0.1%).
Figure 1. Mineralization map oftbe Kady prospect (Werdon, in press). Letters refer to the location of mineralized vein-breccia or disseminated sulfide zones.

Table 1. ICP, XRF, and fire assay (F.A.) analyses of mineralized hand samples from Zn-Pb-Ag occurrences in the northern Brooks Range, AK.
Element: Cu Pb Zn Mo Mo Bi Bi Sb Sb Te Sn Sn Au
Detection Limit: 1 ppm-2% 2ppm-1% 1 ppm-2% ppm 1 ppm ppm 5-2000 ppm ppm 5-2000 ppm 25ppm-0.2% ppm 20ppm-0.2% 1 ppb
Analytical method: ICP ICP ICP XRF ICP XRF ICP XRF ICP ICP XRF ICP F.A
Prospect name: Sample#:
W. Kivliktort Mountain 5601 30 4949 100000 8 183 0 155 421 103 0 45 88 13
Kady 5455 2798 597600 7799 58 0 8580 34 3111 2000 55 143 0 133
Kady 4183 109100 160 53 5 0 0 0 0 0 0 95 88 15
StoryCk. 5432 359 8765 100000 14 311 0 247 1759 621 413 84 165 86
Husky H-55.3' 84 1006 16294 16 15 0 16 114 35 13 11 23
Husky H-CROCK 268 16700 164700 8 2 0 7 545 118 0 34 24
Husky H-CSPHL 553 10000 465300 19 2 0 12 1628 224 0 164 73
Husky H-139B 1400 9979 2503 18 17 0 28 1384 858 33 21 33
Husky H-56.0' 1103 7122 103000 19 14 0 6 466 178 0 5 0
Husky H-LJ2 1406 3436 49000 16 13 0 0 304 140 0 40 21
Husky H-26.8' 292 263000 241100 6 6 2000 0 28
Notes: I - All ICP and fire assay (F.A.) analyses were determined by Bondar Clegg.
2 -The west Kivliktort Mountain, Kady, and Story Creek ICP and F.A. data are from Meyer and Kurtak. 1992.
3 -The Husky ICP data were determined as part of this study.
4 - XRF analyses of standard pressed pellets were determined by Dr. R.J. Newberry using the University of Alaska Fairbanks wavelength-dispersive XRF machine.
The procedures ofNorrish and Hutton (1969) were followed, including the use of well-characterized natural rock standards.

Table 2. Geochemical data for the Kady vein-breccia prospect. Data are from Meyer and Kurtak, 1992. Analyses
are from individual, select, visibly mineralized rock samples. Vein names refer to locations in figure 1.
Vein Sample Ag Cu Pb Zn Sn2 Ni Co Cd As Sb2 Fe(%) Au name # LDL 10.5 1 2 1 20 1 1 2 5 5 0.05 1 ppb
AC 4176 <0.5 52 1561 297 0 5 0 0 <5 <5 0.47 6 B 4183 >100 109100 160 53 88 148 18 0 61 0 9.84 15 B 5457 26.1 14560 2372 127 36 64 39 0 43 19 2.73 18 E 4181 5.0 5342 923 5457 0 9 6 31 70 0 1.03 12 E 4182 >100 240 89900 9337 0 21 5 54 91 105 0.37 29 E 5563 7.9 163 17100 14400 21 15 14 114 574 63 0.72 32 E 5564 2.2 172 172 97500 48 15 35 675 142 48 2.59 26 F 4210 5.8 2266 1840 47300 0 19 15 235 100 41 1.17 43 F 5604 16.5 108 18300 7559 0 8 4 31 20 10 0.68 13 H 4222 7.1 26900 545 3881 0 35 22 19 64 19 3.25 12 H 4223 1.5 14459 132 280 0 28 16 3 76 0 0.67 19 H 5603 4.9 17280 525 2310 21 15 9 11 15 0 2.38 17 0 4140 0.9 40 1585 125 0 7 2 0 104 0 0.40 5
Q 4174 6.2 431 2902 55000 48 11 16 296 96 27 0.89 32 R 4155 5.5 5260 6333 56900 44 90 69 517 186 37 2.38 64 R 4171 1.7 3589 43 19935 0 45 19 184 94 9 0.93 16 R 4172 8.2 12213 3281 108900 83 202 95 1167 110 54 2.60 31 R 4173 5.7 36400 303 220100 140 113 115 >2000 176 58 6.08 13 R 5556 11.4 16585 965 109500 82 15 37 1107 87 59 2.25 82 R 5557 1.1 719 156 11742 0 14 11 78 19 13 0.61 8 R 5558 3.0 2454 104 51200 0 20 20 450 131 32 1.20 15 R 5562 6.3 5419 997 151400 89 251 230 1784 151 85 1.91 27 s 5559 1.1 1559 135 104700 62 70 50 837 161 30 1.33 22 T 4074 3.6 3454 731 12461 0 19 5 106 44 9 0.82 9 T 4075 5.1 844 207 357900 81 20 87 >2000 242 89 1.14 31
T 4076 0.9 688 154 238800 84 32 63 1808 269 57 0.87 11
T 5560 16.0 397 18000 357600 0 73 130 >2000 226 105 1.13 63
T 5561 2.8 264 154 12630 0 13 6 112 72 16 0.53 10
u 4071 >100 387 2900 229800 0 10 55 880 131 199 1.06 58
u 4072 >100 354 235600 234600 63 19 32 1140 116 173 0.55 59
u 4073 12.6 5428 864 124500 56 38 61 1067 120 67 1.58 30
u 5443 >100 332 532000 729 24 211 40 7 334 961 0.23 100
u 5444 8.2 1746 1626 22200 96 5 11 207 50 43 1.36 47
u 5445 12.9 330 5765 482100 30 0 166 >2000 157 132 1.91 73
u 5446 11.5 470 8503 28600 55 2 16 135 70 32 1.65 115
u 5447 15.1 259 19600 125200 77 3 44 975 144 75 2.03 29
u 5456 4.7 497 9100 12924 0 19 10 154 28 25 0.69 4
v 5454 >100 2905 107500 8054 0 23 10 49 69 350 0.79 31
v 5455 >100 2798 597600 7799 0 143 22 46 102 >2000 0.33 133
w 5448 8.3 563 8600 271700 56 23 88 >2000 125 101 1.13 25
w 5449 17.2 558 560 77900 0 3 30 702 89 112 1.59 16
w 5451 3.6 3594 148 6952 0 5 10 58 47 9 1.20 4
w 5452 0.9 513 243 4708 0 0 4 29 39 0 0.60 2
w 5453 4.9 131 4580 5047 0 0 6 35 43 0 0.58 48
x 5450 1.7 339 559 4472 0 0 3 26 0 0 0.63 19
1 LDL - lower detection limit; all elements in ppm except as noted. 2 semi-quantitative. All elements analyzed by Bondar Clegg by ICP except gold (fire assay).
6

LEAD ISOTOPES
Table 3. Lead isotopic ratios for galena from the Kady prospect. Vein names refer to locations in figure 1.
18.404
18.382
15.605
15.588
208Pb/204Pb Sample Description Reference
38.315 galena
38.228 galena
R 18.381 15.628 38.361 galena from a quartz+ sphalerite + chalcopyrite 2 + pyrite + minor galena sulfide breccia within a complex vein-breccia zone
V 18.369 15.594 38.271 galena from a deformed and brecciated quartz+ 2 galena vein
B 18.414 15.656 38.465 galena from a quartz+ galena+ calcite vein 2 peripheral to the main quartz + chalcopyrite + minor pyrite vein-breccia zone
U 18.331 15.559 38.143 galena from center of a growth-zoned quartz 2 vein with paragenetically late galena
AE 18.369 15.583 38.220 galena disseminated in gray, bleached, iron- 2 stained, porous sandstone
Gaccetta and Church ( 1989); 2 Galena for this study was analyzed by Dr. R. W. Hurst, Chem pet Research Corporation. Errors in lead isotope ratios are < 0.1 % at the 95% standard error of the mean confidence interval. Isotope ratios are corrected for a 0.1 % per atomic mass unit fractionation relative to NBS SRM 981.
FLUID INCLUSIONS
Fluid inclusion data for Kady were obtained from the Fluid Inc.® fluid inclusion heating-freezing stage at
the U. S. Geological Survey in Anchorage, Alaska. The system was calibrated daily with a pure water standard (0°
C freezing temperature) and a pure C02 standard (-56.6° C freezing temperature). The iterative calibration process
was repeated until 5 consistent measurements were obtained at the one decimal-place level on both standards.
Equivalent weight percent NaCl values were calculated from measured freezing temperatures using the least squares
equation of Potter and others ( 1978).
The fluid inclusions range from sub-microscopic to 13 microns in diameter, with the former composing the
greater proportion of the fluid inclusion population. The average size of fluid inclusions measured was 3-8 microns.
Fluid inclusions less than 3 microns in diameter could not be optically resolved during heating and freezing
measurements. Fluid inclusions were classified into three types: primary, pseudo-secondary and secondary using
the criteria ofRoedder (1976, 1979). Primary fluid inclusions in distinct growth zones within quartz were trapped
during quartz deposition. Pseudo-secondary fluid inclusions occur in planes which internally cross-cut, and
terminate within the quartz crystal at a growth zone. This indicates the quartz was fractured, the fluid was trapped in
the inclusion, and then additional quartz was deposited. Secondary fluid inclusions along fracture planes which
completely cross-cut quartz crystals are post-quartz deposition.
All fluid inclusion measurements were obtained from quartz in sulfide-bearing quartz veins (table 4). Fluid
inclusions larger than 3 microns were not present in sphalerite or in quartz from breccia textured ore. Therefore the
7
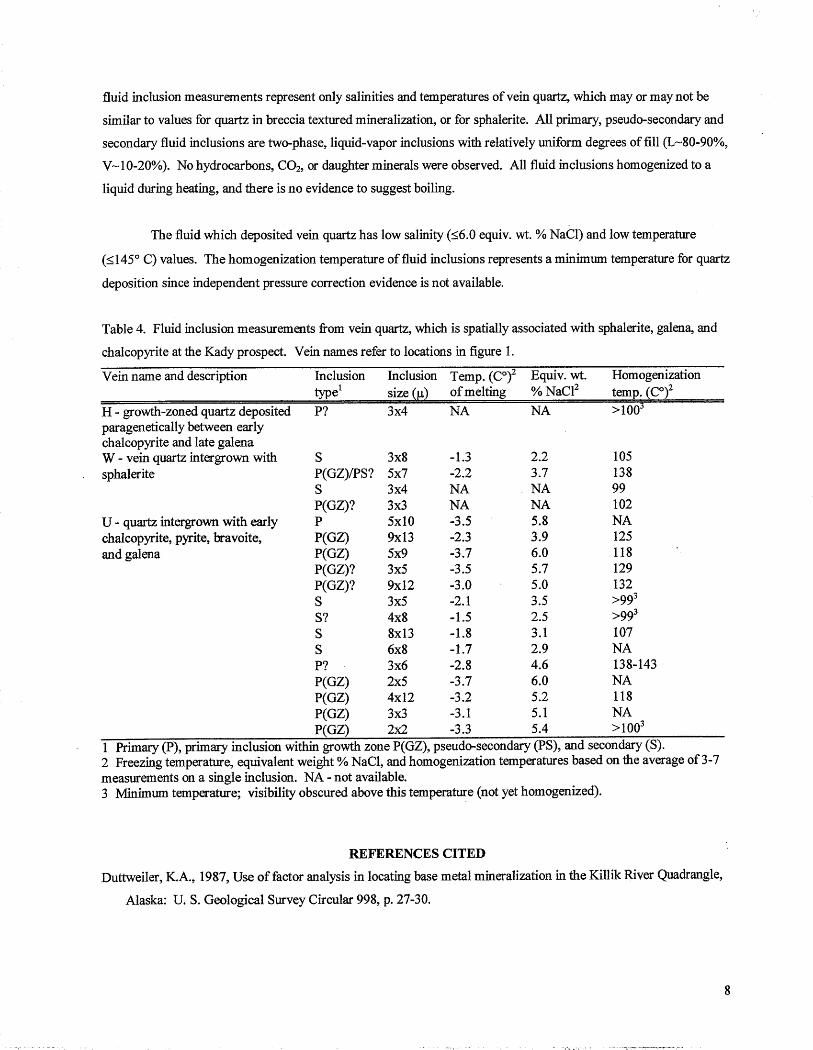
fluid inclusion measurements represent only salinities and temperatures of vein quartz, which may or may not be
similar to values for quartz in breccia textured mineralization, or for sphalerite. All primary, pseudo-secondary and
secondary fluid inclusions are two-phase, liquid-vapor inclusions with relatively uniform degrees of fill (L-80-90%,
V~I0-20%). No hydrocarbons, C02, or daughter minerals were observed. All fluid inclusions homogenized to a
liquid during heating, and there is no evidence to suggest boiling.
The fluid which deposited vein quartz has low salinity (:s;6.0 equiv. wt.% NaCl) and low temperature
(:s;145° C) values. The homogenization temperature of fluid inclusions represents a minimum temperature for quartz
deposition since independent pressure correction evidence is not available.
Table 4. Fluid inclusion measurements from vein quartz, which is spatially associated with sphalerite, galena, and
chalcopyrite at the Kady prospect. Vein names refer to locations in figure 1.
Vein name and description
H - growth-zoned quartz deposited paragenetically between early chalcopyrite and late galena W - vein quartz intergrown with sphalerite
U - quartz intergrown with early chalcopyrite, pyrite, bravoite, and galena
Inclusion type1
P?
Inclusion Temp. (C0 )2 Equiv. wt. size (µ) of melting % NaC12
3x4 NA NA
Homogenization temp. (C0 )2 >1003
S 3x8 -1.3 2.2 105 P(GZ)/PS? 5x7 -2.2 3.7 138 S 3x4 NA NA 99 P(GZ)? 3x3 NA NA 102 P 5xl0 -3.5 5.8 NA P(GZ) 9xl3 -2.3 3.9 125 P(GZ) 5x9 -3.7 6.0 118 P(GZ)? 3x5 -3.5 5.7 129 P(GZ)? 9x12 -3.0 5.0 132 S 3x5 -2.1 3.5 >993
S? 4x8 -1.5 2.5 >993
S 8x 13 -1. 8 3 .1 107 S 6x8 -1.7 2.9 NA P? 3x6 -2.8 4.6 138-143 P(GZ) 2x5 -3.7 6.0 NA P(GZ) 4x12 -3.2 5.2 118 P(GZ) 3x3 -3.1 5.1 NA P(GZ) 2x2 -3.3 5.4 >1003
1 Primary (P), primary inclusion within growth zone P(GZ), pseudo-secondary (PS), and secondary (S). 2 Freezing temperature, equivalent weight% NaCl, and homogenization temperatures based on the average of 3-7 measurements on a single inclusion. NA - not available. 3 Minimum temperature; visibility obscured above this temperature (not yet homogenized).
REFERENCES CITED
Duttweiler, K.A., 1987, Use of factor analysis in locating base metal mineralization in the Killik River Quadrangle,
Alaska: U. S. Geological Survey Circular 998, p. 27-30.
8

Gaccetta, J.D. and Church, S.E., 1989, Lead isotope data base for sulfide occurrences from Alaska: U. S.
Geological Survey Open File Report 89-688, 58 p.
Goodfellow, W.D., Lydon, J. W., and Turner, R.J. W., 1993, Geology and genesis of stratiform sediment-hosted
(SEDEX) zinc-lead-silver sulfide deposits: in Kirkham, R. V., Sinclair, W.D., Thorpe, RI., and Duke, J.M.,
eds., Mineral Deposit Modeling: Geological Association of Canada, Special Paper 40, p. 201-251.
Kelley, K.D., Taylor, C.D., and Cieutat, B.A., 1997, Silver-lead-zinc mineral occurrences in the Howard Pass
Quadrangle, Brooks Range, Alaska: in Dumoulin, J. and Gray, J., eds., Geological Studies in Alaska by the
U.S. Geological Survey, 1995, U.S. Geological Survey Professional Paper 1574, p. 101-110.
Meyer, M.P. and Kurtak, J.M., 1992, Results of the 1991 U.S. Bureau of Mines Colville Mining District Study: U.
S. Bureau of Mines Open File Report 75-92, 101 p.
Norrish, K. and Hutton, J.T., 1969, An accurate X-ray spectrographic method for the analysis ofa wide range of
geological samples: Geochimica et Cosmochimica Acta, v. 33, p. 431-453.
Potter, R. W., Clynne, M.A. and Brown, D.L., 1978, Freezing point depression of aqueous sodium chloride
solutions: Economic Geology, v. 73, p. 284-285.
Roedder, E., 1976, Fluid inclusion evidence on the genesis of ores in sedimentary and volcanic rocks: in Wolf,
K.H., ed., Handbook ofStratabound and Stratiform Ore Deposits, Elsevier, Amsterdam, v. 2, p. 67-110.
Roedder, E., 1979, Fluid inclusions as samples of ore fluids: in Barnes, H.L., ed., Geochemistry of Hydrothermal
Ore Deposits, 2nd ed., Wiley-Interscience, New York, p. 684-737.
Tye, David, 1998, Chemex Labs Ltd., 212 Brooksbank Ave., North Vancouver, BC V7J 2Cl, Canada: Written
communication, 3 p.
Werdon, M.B., in press, Geologic setting of Mississippian vein-breccias at the Kady Zn-Pb-Cu-Ag prospect:
plumbing system for a failed Sedex deposit?: in Riehle, J. and Kelley, K., eds., Geologic Studies in Alaska by
the U.S. Geological Survey, U.S. Geological Survey Professional Paper, in press.
Werdon, M.B., in review, Geology and timing of Zn-Pb-Ag mineralization, northern Brooks Range, Alaska:
University of Alaska Fairbanks, unpublished Ph.D. dissertation, 129 p.
Werdon, M.B., Newberry, R.J., and Layer, P. W., 1998, 40 Ar/39 Ar laser step-heating data and spectra from sandstone
and volcanic rocks in the northern Brooks Range, Alaska: Alaska Division of Geological and Geophysical
Surveys Public Data File 98-33, 25 p.
9