lead-lag relationship between the cds and the stock market
TRANSCRIPT
1.�INTRODUCTION
� Credit�derivatives�markets�have�experienced�substantial�growth�over� the�past�decade.�The�most�popular�instrument�in�these�markets�is�the�credit�default�swap�(CDS),�which�allows�investors�to�trade�credit�protection.�The�periodic�payment�(known�as�the�CDS�spread),�which�is�expressed�as�a�percentage�(in�basis�points)�of�the�bond’s�notional�value,�is�expected�to�provide�a�measure�of�the�reference�entities’�credit�risk.�� Credit�risk�of�firms�concerns�almost�all�financial�activities,�and�should�be�reflected�by�the�market�prices�of� financial�claims�on�these� firms,�such�as�bonds,�stocks�and�CDS.� In�efficient�capital�markets,� credit� risk�changes�should�be�reflected� in�both�equity�and�debt�claims�of�the� firm�simultaneously.�However,� in�reality,�different�claims�may� incorporate� information�at�different�speeds�if�markets�differ�in�the�characteristics�of�traders,�the�liquidity,�the�transaction�
* �College�of�Business�Administration,�Hankuk�University�of�Foreign�Studies,�270�Imun-dong�Dongdaemun-gu,�Seoul�130-791,�Korea.�Tel:�+82-2-2173-3175,�E-mail:�[email protected]
** �Faculty�of�Economics,�Yamaguchi�University,�1677-1�Yoshida,�Yamaguchi�753-8541,�Japan.�Tel:�+81-83-933-5561,�E-mail:�[email protected].
***�Corresponding�author:�Business�School,�Jiangsu�Normal�University,�101�Shanghai�Road,�Xuzhou,�Jiangsu�221116,�China.�Tel:�+86-151-6225-1930,�E-mail:�[email protected]
Journal of East Asian Studies, No.17, 2019.3. (pp.41-59)
(Abstract)This�paper�investigates�the�dynamic�relationship�between�CDS�and�stock�market�whether�informed�trading�occurs�in�Japanese�market.�We�find�that�the�lead-lag�relationship�between�CDS�and�stock�market� is�not�stable�and�that�CDS�market’s�contribution�to� the�price�discovery�process� is�much�higher�in�times�of�crisis.�In�addition,�the�unconditional�information�flow�from�CDS�to�stock�market�exists,�but�primarily� for�keiretsu-affiliated� firms.�Furthermore,� the� flow�of� information� from�CDS�market�to�stock�market,�which�is�conditional�on�there�being�a�bad�credit�event�ahead,�exists�only�in�times�of�crisis�and�only�for�keiretsu-affiliated�firms.
Keywords:��Credit�risk,�CDS�(credit�default�swap),�Lead-lag�relationship,�Information�flow,�Informed�trading
Lead-lag relationship between the CDS and the stock market and informed trading: Evidence from the
Japanese CDS market
PARK Jinwoo*
SHIROSHITA Kengo**
SUN Naili***
-41-

cost,�and�the�ability�to�short� (Qiu�and�Yu,�2012;�Bittlingmayer�et�al.,�2013).� It� is� important�to�know�if� information�transfer,�which� is�also�called�the� lead-lag�relationship�between�the�stock�and� the�CDS�markets� is�observable�since� this�would�help� to�understand� information� flows�between�financial�markets�and�the�mechanism�of�pricing�discovery�process�in�CDS�market.� Early�studies�examine�the�lead-lag�relationship�across�CDS�spread�changes,�corporate�bond�spreads,�and�stock�returns.�These�empirical� studies�provide�evidence� that� the�stock�market�leads�the�CDS�and�bond�markets�(Norden�and�Weber,�2009;�Forte�and�Peña,�2009)�and�that�the�CDS�market� leads�the�corporate�bond�market� (Longstaff�et�al.,�2005;�Blanco�et�al.,�2005;�Zhu,�2006;�Norden�and�Weber,�2009;�Forte�and�Peña,�2009).� However,� regarding� the� lead-lag�relationship�between� the�CDS�and� the�stock�market,�conflicting�opinions�continue�to�exist.�First,�the�CDS�and�stock�markets�have�different�investor�compositions.�The�main�participants� in� the�CDS�market�are�banks,�hedge� funds,�and�major�institutional� traders.�Due� to� the�possibility� that� these� selected�groups� of� investors�may�participate�in�informed�trading�of�CDS,�it�has�been�argued�that�information�discovery�might�be�more�efficient�in�the�CDS�market�(Angelopouos�and�Glamouridis,�2012).�In�addition,�the�privacy�provided�in�the�CDS�market�as�well�as�no�restriction�on�short�position�reinforce�the�likelihood�that� the�CDS�market�reveals�new�information�ahead�of� the�stock�market� (Qiu�and�Yu,�2012;�Bittlingmayer�et�al.,�2013).�On�the�other�hand,�Hilscher�et�al.� (2011)�argue�against�the�opinion�that�the�CDS�market�reflects�information�ahead�of�the�stock�market.�In�order�to�maximize�the�expected�profits�an�informed�investor�chooses�a�market�with�low�transaction�costs�and�a�high�proportion�of�uninformed�traders.�In�fact,�CDS�bid-ask�spreads�are�much�higher�than�those�of�equities,�and�the�proportion�of�uninformed�traders�in�the�CDS�market�are�very�low�relative�to�the�equity�market.�These�empirical�evidence�on�the�lead-lag�relationship�between�the�CDS�and�the�stock�market�documents�that�on�average,�stocks�lead�quotes�in�the�CDS�market�whereas�the�CDS�barely� leads�stocks.�However,� these�studies�are�based�on�a�cross-sectional�analysis,�providing�an�unconditional�relationship�between�the�CDS�and�the�stock�market.� More�recent�studies�are�concerned�with�the�conditional�relationship�between�the�CDS�and�the�stock�market�by� investigating�a�time-varying�behavior�of�price�discovery.�These�studies�provide�evidence� for�an�asymmetric� information�spillover�between� the�CDS�and� the�stock�market.�For�instance,�Forte�and�Lovreta�(2015)�document�that�the�stock�market’s�informational�dominance�reported� in�previous�studies�holds� in� times�of� financial� crisis�whereas� the�CDS�market’s�contribution�to�price�discovery�tends�to�be�higher�during�tranquil�times.� Another�group�of�studies�are�motivated�by� the�possibility�of� information-based�trading�in� the�CDS�market.�Their�underlying�reasoning� is�as� follows:� the�main�participants� in� the�CDS�market,�such�as�banks,�hedge�funds,�and�major� institutional�traders,�are�typically�better�informed�than�retail�investors;�thus,�they�may�participate�in�informed�trading�of�CDS�in�order�to�exploit� their� (insider)�knowledge,�causing�a�significant� incremental� information�revelation�in� the�CDS�market.�They�also�argue� that� this� type�of� insider� trading� tends� to� take�place�
-42-
Journal of East Asian Studies

prior�to�severe�credit�deterioration,�suggesting�that� incremental� information�revelation�in�the�CDS�market�is�asymmetric�between�good�and�bad�credit�events�(Acharya�and�Johnson,�2007;�Acharya�and�Johnson�,�2008;�Qiu�and�Yu,�2012).1
� Given�this�literature�on�the�dynamic�relationship�between�the�CDS�and�stock�market,�we�notice�that�most�previous�empirical�studies�have�focused�on�a�sample�of�North�American�and�European�companies.2�However,�for�the�following�reasons,�the�Japanese�CDS�market�could�not�be�neglected�by�academicians�as�well�as�practitioners.� First�of�all,� in� terms�of�market�size�and� liquidity�of�CDS�for�major�Japanese� firms,� it� is�worth�investigating�whether�prior�empirical�evidence�on�the�lead-lag�relationship�between�the�CDS�and�the�stock�market,�which�is�primarily�based�on�U.S.�and�European�data,�still�holds�for�the�sample�of�Japanese�CDS.� Meanwhile,� relatively� less�shock� is�observed� in� the�Japanese�stock�market,� except� for�a� sharp�decline� in� stock�prices� and� increase� in�CDS�spread� just� after� “Great�East� Japan�Earthquake”�on�March�11,�2011� (Figure�1).3�These�dramatically�contrasting�periods� (tranquil�vs.� chaotic)�divided�by� the�Great�Earthquake�provide�us�with�a�unique�opportunity� to� test�whether�the�lead-lag�relationship�between�the�CDS�and�the�stock�market� is�stable�over�time�and�whether,�depending�on�the�market�conditions�(tranquil�vs.�chaotic),�the�leading�role�in�the�price�discovery�process�is�different�between�the�CDS�market�and�the�stock�market.�In�addition,�by�focusing�on�the�difference�in�the�results�between�the�tranquil�and�chaotic�periods�divided�by�the�Great�Earthquake,�we�may�examine�whether�informed�trading�in�the�CDS�market�tends�to�take�place�prior�to�severe�credit�deterioration.� Furthermore,�some� institutional� features�specific� to� the�Japanese�CDS�market�may� lead�to�some�different�results� from�those�evidenced�by�prior�research,�which�has� focused�on�the�U.S.�and�European�CDS�markets.� Japanese�corporate�bonds�are� illiquid�due�to� the�buy-and-hold�behavior�of�Japanese�bond�investors�as�well�as�the�inactive�repo�(repurchase�agreements)�market� for� corporate�bonds� (Baba�and� Inada,� 2007).�Accordingly,� trading�activity� related�to� firms’� credit� risk� takes�place�mainly�on� the�CDS�market,� and�CDS�spreads� reflect� the�credit� risks�of� Japanese� firms�more�sensitively�compared� to�bond�spreads.4�Therefore,� the�CDS�market�plays�a�critical� role� in� the�credit�market� in�Japan�as�compared�with� the�U.S.�and�European�countries,�where�secondary�bond�markets�are�well� established.5�Ever� since�the�beginning�of�CDS�trading� in� the�Japanese�market� in�early�1998,�main�protection�buyers�of� Japanese�CDS�are� Japanese�banks�while� foreign�securities�companies�and�hedge� funds�participate�as�protection�sellers.�One�of�the�unique�governance�structures�of�Japanese�firms�is�the�keiretsu,�a�group�of�closely�related�companies�with�interlocking�business�relationship�and�ownership.6�Because�a�core�bank�is�centered�on�the�keiretsu,�the�main�bank�maintains�a�special�relationship�with� the�keiretsu-affiliated� firms,� and� thus� retains� insider� information.7�These�unique� institutional� features� in�Japan�provide�us�with�an�opportunity� to� investigate�whether�insider�trading� in�the�CDS�market�occurs� in�entities�which�subsequently�experience�adverse�
-43-
Lead-lag relationship between the CDS and the stock market and informed trading: Evidence from the Japanese CDS market

credit�events�and� furthermore,� this�phenomenon� is�more�distinct�as�banking�relationships�increase.� In�particular,�due� to� the� fact� that� Japanese�banks�participate� in� the�CDS�market�usually�as�protection�buyers,� they�may�take�buying�positions� for� the�CDS�of� firms�that�are�expected�to�subsequently�experience�severe�credit�deterioration.
0
4000
8000
12000
16000
0
50
100
150
200
250
300
2009.07.21 2012.10.16CDS Premium Nikkei Index
CDS Premium(basis points)
Nikkei 225Index
2011.03.11the Great Earthquake
Figure 1: Trend of average CDS premium and Nikkei index for the period from July 21, 2009 to October 16, 2012 surrounding the Great Earthquake
� Given� these�motivations,� this�paper�analyzes� the�dynamic�relationship�between�credit�default�swaps�(CDS)�and�stock�markets�for�a�sample�of�Japanese�companies�during�the�period�from�July�21,�2009�to�October�16,�2012,�which�includes�797�trading�days�surrounding�the�“Great�East�Japan�Earthquake”�on�March�11,�2011.�The�empirical�analysis�is�largely�divided�into�two�part.� In�the�first�part,� focusing�on�the�difference� in�the�results�between�the�two� (tranquil�vs.�chaotic)�periods�divided�by�the�Great�Earthquake,�we� investigate� the� intertemporal� lead-lag�relationship�between�the�CDS�and�the�stock�market.�In�the�second�part,�this�paper�investigates�whether� informed�trading�occurs� in� the�Japanese�CDS�market�similar� to� insider� trading� in�the�U.S.�CDS�market,�which�is�empirically�evidenced�by�Acharya�and�Johnson�(2007)�and�Qiu�and�Yu�(2012).�Furthermore,�this�paper�investigates�whether�informed�trading�patterns�in�the�Japanese�CDS�market�is�different�between�firms�that�are�keiretsu-affiliated�or�not.� The�remainder�of� the�paper� is�organized�as� follows.�Section�2�describes� the�data�and�research�methodology�used� in� this� paper.� Section� 3�provides� evidence� of� a� time-varying�relationship�between� Japanese�CDS�spreads�and� stock� returns,� and�analyzes� the� relative�informational�dominance�of�the�CDS�and�stock�market�in�tranquil�vs.�turmoil�periods.�In�section�4,�by�focusing�on�any�differences�in�informed�trading�patterns�between�the�tranquil�and�chaotic�periods�we�examine� informed� trading� in� the�Japanese�CDS�market.�Section�5�presents� the�
-44-
Journal of East Asian Studies

summary�and�conclusions.
2.�DATA�AND�METHOLOGY
2.1. Data collection and sample composition� Our�Japanese�CDS�data,�which�are�based�on�the�daily�closing�prices�of�the�dealers’�book�of�records,�come�from�Quick�Corp.,�a�financial�information�service�provider�in�Japan.�As�a�sample�of�this�study,�we�use�5-year�single-name�CDS�contracts�on�senior�unsecured�obligations,�which�are�the�most�liquid�among�a�variety�of�CDS�maturities�and�are�used�as�samples�in�most�prior�studies.�Because�one�of�our�main�interests�in�this�research�is�to�examine�the�time-varying�lead-lag�relationship�between�the�CDS�and�the�stock�market�and�different�informed�trading�patterns�between�the�tranquil�and�chaotic�periods,�the�sample�period�is�selected�from�July�21,�2009�to�October�16,�2012�surrounding�the�Great�Earthquake�on�March�11,�2011.�This�sample�period�is�divided�into�two�sub-periods,�which�includes�401�and�396�trading�days�before�and�after�the�Great�Earthquake,�respectively.� One�of� the�major�concerns� in�using�CDS�data� is�stale�price�quotes.8�Thus,�all� the�prior�studies�using�daily�CDS�data�apply�a�filter�rule�in�order�to�minimize�the�problem�of�illiquidity�of�their�CDS�sample.9�In�this�study,�we�also�control�for�the�Japanese�CDS�with�stale�price�quotes�by�excluding�companies�with�more� than�30%�of� the�daily�observations�unchanged� from�the�previous�day�in�any�of�the�two�sub-periods.10�As�a�result,�our�sample�of�Japanese�CDS�consists�of�82�firms�for�the�period�from�July�21,�2009�to�October�16,�2012�(see�Appendix�A).�It�includes�most�major�Japanese�firms,�which�constitute�more�than�80%�of�the�market�value�of�the�Tokyo�Stock�Exchange�(TSE).11
2.2. Summary statistics� Table�1�presents� the� summary�statistics�of� firms�and� their�CDS� included� in�our� final�sample.�For�82�Japanese�companies�in�the�sample,�the�mean�of�the�average�CDS�level�is�103.84�for�the�pre-earthquake�period,�and� it�significantly� increases�to�154.61� for�the�post-earthquake�period,� indicating�that� the�Great�Earthquake�caused�credit�deterioration� for�many�Japanese�firms.12�The�median� is�69.27�and�124.23� for�the�pre-earthquake�and�post-�earthquake�periods,�respectively,� suggesting�that� the�distribution�of� the�CDS�premium�is�positively�skewed.�The�increase� in�the�mean�and�median�for�the�average�daily�CDS�changes�as�well�as�the� increase�in�the�volatility� from�the�pre-earthquake�to�post-�earthquake�period�also�suggests�a�shock� in�the�Japanese�credit�market�by�the�Great�Earthquake.�To�a� lesser�extent,�a�similar�shock� is�observed�in�the�Japanese�stocks�in�our�sample.�In�addition,�we�find�that�firms�included�in�our�sample�are�mostly�large�ones�with�positive�skewness.
-45-
Lead-lag relationship between the CDS and the stock market and informed trading: Evidence from the Japanese CDS market

2.3. Research methodology� In�this�paper,�three�research�models�are�mainly�utilized.�First,�a�firm-specific�VAR�model�(vector�autoregressive)�is�used�to�analyze�the�daily�lead-lag�relationship�between�the�Japanese�CDS�and�stock�markets.�Second,� the�GARCH�model� is�used�to� investigate� the� transmission�mechanism�of�mean�and�variance�between�the�CDS�and�the�stock�market.�Third,� in�order�to�investigate�informed�trading�in�the�Japanese�CDS�market�we�utilize�the�methodology�employed�by�Acharya�and�Johnson�(2007)�and�Qiu�and�Yu�(2012).� The�vector�autoregressive�(VAR)�model�is�a�multivariate�time�series�model,�in�which�the�interaction�between�several�variables�is�used�to�forecast�each�variable.�The�VAR�analysis�is�a�useful�methodology� for�estimating�the�dynamic�responses�of�each�variable�to�the� innovations�in�other�variables� in� the� system.�The�VAR�model� treats�all� the�variables� in�a� system�as�endogenous.�The�VAR�model� estimates� the� parameters� in� a� dynamic� system�without�imposing�any�a�priori�restrictions�on�the�presence�of�variables� in�an�equation.�Therefore,�the�relationships�among�the�variables�are�determined�by�the�data�themselves.� This�paper�estimates�a�firm-specific�VAR�model,�which�is�composed�of�the�daily�changes�in�the�CDS�premium�and�stock�returns.�The�estimation�is�conducted�for�each�82�firms�in�the�sample�for�the�period�from�July�21,�2009�to�March�10,�2011�(401�trading�days)�and�the�period�from�March�11,�2011�to�October�16,�2012�(396�trading�days).�Each�VAR�model�is�expressed�as:
Table 1: Summary statistics of 82 companies and their CDS in the samplePanel A: Pre-earthquake period (2009.7.21- 2011.3.11)
Mean Std.dev Median Min MaxAvg.�CDS�premium�level�(b.p) 103.84 116.39 69.27 24.64 874.44Avg.�daily�CDS�changes�(%) -0.11 0.12 -0.11 -0.48 0.16Volatility�of�CDS�changes�(%) 3.07 0.48 3.05 2.20 5.02Avg.�daily�stock�returns�(%) 0.04 0.07 0.03 -0.12 0.22Volatility�of�stock�returns�(%) 1.83 0.51 1.91 0.80 3.96
Firm’s�market�value�(¥�billion) 1,203 1,601 727 22 10,758Firm’s�total�asset�(¥�billion) 6,348 17,150 2,773 429 152,723Firm’s�leverage�(%) 0.71 0.14 0.74 0.25 0.97
Panel B: Post-earthquake period (2011.3.14- 2012.10.16)Mean Std.dev Median Min Max
Avg.�CDS�premium�level�(b.p) 154.61 116.68 124.23 48.53 692.44Avg.�daily�CDS�changes�(%) 0.22 0.21 0.14 -0.13 1.15Volatility�of�CDS�changes�(%) 3.10 1.17 2.88 1.50 10.41Avg.�daily�stock�returns�(%) -0.06 0.11 -0.04 -0.51 0.20Volatility�of�stock�returns�(%) 2.17 0.69 2.09 0.92 6.33
Firm’s�market�value�(¥�billion) 1,383 1,720 805 37 11,551Firm’s�total�asset�(¥�billion) 6,888 18,266 2,858 310 160,812Firm’s�leverage�(%) 0.69 0.14 0.71 0.28 0.96Note:��The�firm�market�value,�asset�and�leverage�are�based�on�the�data�as�of�the�fiscal�year�end�of�2009�for�the�
pre-earthquake�period�and�the�fiscal�year�end�of�2011�for�the�post-earthquake�period.
-46-
Journal of East Asian Studies

� � � ΔCDSt�=�α1+∑k=1
p
β1k ΔCDSt-k+∑k=1
p
γ1k�Rett-k�+�ε1t� �(1)
� � � Rett�=�α1+∑k=1
p
β2k ΔCDSt-k+∑k=1
p
γ2k�Rett-k�+�ε2t� (2)
� where,�ΔCDSt� is� the�daily�%�change� in�CDS�premium�at�day� t,�Rett� � is� the�daily�stock�return�at�day� t,�p� is� the�number�of� lags,�and�εt� is� the�disturbance� term� in� t.�Using�Akaike’s�minimum� final�prediction�error� (FPE)�criterion�and�Schwartz’s� information�criterion,�we�determine�order�5�as�an�optimal�lag�in�this�paper.13
� In� the�VAR�model,� the�F-statistics� refer� to� the�null�hypothesis� that�all� of� the� lagged�coefficients�are� jointly�equal� to�zero.� In� this� sense�we� test�whether�Granger�causality�or�a� lead-lag� relationship�exists� among� the�variables� in� the�VAR�model� (Granger,� 1969).�For�example,�we�test�whether�a�change�in�the�CDS�premium�‘causes’�or�leads�a�stock�return�of�the�corresponding�firm�by�means�of�the�Wald�test� for�γ11=γ12=…=γ1p.� In�addition,� the�VAR�model�provides� the�decomposition�of� forecast�error�variance,�which�measures� the�overall� relative�importance�of�individual�variables�in�the�system�in�generating�the�fluctuation�of�their�own�and�other�variables.�Given�a�variable’s� forecast,�an�expected� forecast�error�exists.�This� forecast�error�can�be�accounted� for�by� its�own� innovations�and�the� innovations�of�other�variables� in�the�system.�The�effects�that�the�variables�in�the�system�have�on�each�other�over�time�can�be�measured�by�decomposing�this�forecast�error�variance.�For�example,�by�measuring�the�forecast�error�of�the�CDS�spread�changes�and�stock�returns�for�each�company�in�the�sample,�we�may�determine�the�contribution�percentage�of�each�innovation.� Once�the�causality�between�change� in�CDS�premium� (ΔCDSt)�and�stock�return� (Rett)� is�identified,� this�paper�employs� the� following�GARCH�model� to� investigate� the� transmission�mechanism�of�mean�and�variance�between�ΔCDSt�and�Rett.14
� � � Yt�=�α�+�βXt�+�εt�+�θεt-1,�εt│Ωt-1�~�N(0,ht)� � � ht�=�a�+�bε2
t-1�+�cht-1�+�δε2Xt�� (3)
� In�this�equation�Xt�and�Yt�can�be�either�ΔCDSt�or�Rett,�depending�on�the�direction�of�the�causality�between�ΔCDSt�and�Rett.�That� is,�Xt�and�Yt�are�ΔCDSt�and�Rett,� respectively� if� the�causality�exists�from�CDS�to�stock�return�whereas�Xt�and�Yt�are�Rett�and�ΔCDSt,�respectively�if�the�causality�exists�from�stock�return�to�CDS.�In�this�equation�the�coefficients,�β�and�δ,�measure�the�transmission�effects�of�mean�and�variance,�respectively.�In�other�words,�the�significance�of�these�coefficients� indicates�that� information�occurring�at�variable�Xt� influences�the�mean�and�variance�of�variable�Yt.� In� the� second�part� of� this� paper,� another� research�methodology� is� used� in� order� to�investigate� the� informed�trading� in� the�Japanese�CDS�market.�Acharya�and�Johnson� (2007)�
-47-
Lead-lag relationship between the CDS and the stock market and informed trading: Evidence from the Japanese CDS market

propose�a�standard�approach�for�isolating�credit�market�specific�information,�which�is�also�used�in�Berndt�and�Ostrovnaya�(2008),�Qiu�and�Yu�(2012),�and�Angelopouos�and�Glamouridis�(2012).�Following�Acharya�and�Johnson� (2007),�we�extract� information�unique�to�the�CDS�market�at�day�t�by�running�the�time-series�regression�for�each�firm�in�the�sample�as�follows:
� � � ΔCDSit�=�αi+∑k=0
5
βik+γit CDSit
�Reti,t-k +∑k=0
5
δikΔCDSi,t-k+uit� (4)
where,�ΔCDSit�is�the�daily�%�change�in�the�CDS�premium�for�firm�i�at�day�t,�CDSit�is�the�CDS�premium� level� for� firm� i�at�day�t,�Reti,t-k� is� the�stock�return� for� firm� i�at�day� t-k,�and�uit� is�the�residual�term�for�firm�i�at�day�t.�The� interaction�terms�of�stock�returns�and�the� inverse�of� the�CDS�spread�are� included�to�account� for� the�non-linear�dependence�between�the�CDS�changes�and�stock�returns.� In�this�specification�of� the�model,� the�residual� term,�uit,� refers�to�the�independent�news�arriving�in�the�CDS�market�for�firm�i�at�day�t,�which�is�termed�as�‘CDS innovations’�in�Acharya�and�Johnson�(2007).� Then,� following�Acharya�and�Johnson� (2007)�and�Qiu�and�Yu� (2012),�we�use� the�panel�regression�shown�below,�and�investigate�whether�CDS innovation,�which�is�the�residual�term�obtained�from�the�estimation�of�equation�(3),�is�relevant�for�future�stock�returns.
� � � Retit =�a+∑k=1
5
(bk+bkD(Credit�condition�dummy)it)×(CDS�innovation)i,t-k
� � � � � +∑k=1
5
(ck+ckD(Credit�condition�dummy)it)×Reti,t-k+εit� (5)
� In� particular,� (Credit� condition�dummy)it� is� included� in� equation� (4)� as� a� conditional�term,�which� identifies�the�occurrence�of�a�credit�event�for�firm�i.�According�to�Acharya�and�Johnson� (2007),� insider�trading� in�the�CDS�market� tends�to�take�place�prior� to�severe�credit�deterioration.�If�this�argument�holds�for�the�Japanese�CDS�market,�we�may�observe�significant�value�of�the�coefficient,�∑5
k=1bkD,�which�measures�the�incremental�information�flow�from�the�CDS�
market�to�the�stock�market�conditional�on�there�being�some�bad�credit�events�ahead.�Since�∑5k=1bk�measures�the�unconditional� information� flow�from�the�CDS�market�to�the�stock�market,�the�coefficient�∑5
k=1(bk+bkD)�represents�the�flow�of�information�from�the�CDS�market�to�the�stock�
market�conditional�on�there�being�a�bad�credit�event�ahead.� In�this�paper�we�assume�more�than�a�10%�jump�in�the�daily�CDS�spread�changes�as�a�bad�credit�event,�and�assign�a�value�of�1�to�(Credit�condition�dummy)it�for�periods�up�to�ten�days�prior�to�the�credit�events.15
3.��LEAD-LAG�RELATIONSHIP�BETWEEN�JAPANESE�CDS�AND�STOCK�MARKETS
� Before�we�analyze� the�dynamic� lead-lag� relationship�between� the�CDS�and� the� stock�
-48-
Journal of East Asian Studies
market� using� a�VAR�model,�we� examine� the� contemporaneous� association�between� the�daily�CDS�premium�changes�and�stock�returns�since� the�VAR�model�does�not�allow� for�a�contemporaneous�correlation.�The�stock�returns�and�the�CDS�premium�changes�are�affected�by�the�credit�information�of�the�underlying�firm�in�a�way�that�negative�(positive)�credit�news�is�related�with�an� increase� (decrease)� in� the�reference�entity’s�credit�spread�and�a�decrease�(increase)�in�the�corresponding�stock�price.�In�efficient�capital�markets,�the�credit�news�should�be�reflected� in�CDS�and�stock�prices�simultaneously,�exhibiting�a�negative�contemporaneous�correlation�between�the�daily�CDS�premium�changes�and�stock�returns.� Consistent�with�prior�evidence� that� is�primarily�based�on�U.S.�and�European�data,� the�contemporaneous�correlation�between�daily�CDS�premium�changes�and�stock�returns�are�significantly�negative� in� the�Japanese�market.�All� contemporaneous�correlations� for� the�82�cases� in�our�sample�are�significantly�negative�with�a�mean� (median)�value�of� -0.175� (-0.177)�for�the�pre-earthquake�period,�and�with�an�exception�of�only�one�case�in�the�post-earthquake�period�the�correlations�are�more�negative�with�a�mean� (median)�value�of� -0.258� (-0.276).16�The�magnitude�of�negative�contemporaneous�correlation�is�similar�to�that�observed�by�prior�studies�using� the�U.S.� and�European�data,� suggesting� that� the�credit� risk� is�priced� to�generate�a�negative�contemporaneous�relationship�between�CDS�premium�changes�and�stock�returns� in�the�Japanese�market�as�in�the�U.S.�and�European�markets.� Even�though�credit� related�news� is�contemporaneously�reflected� in� the�CDS�and�stock�markets,�prior�studies�provide�evidence�of�some� lead-lag�relationship�between�CDS�premium�changes�and�stock�returns�and�predictability�with�a� time� lag.17�However,�since�these�results�are�primarily�obtained�from�the�analysis�of�U.S.�and�European�data,�this�paper�investigates�the�lead-lag�relationship�between�Japanese�CDS�and�stock�markets.�More�importantly,�more�recent�studies�argue�that� the� lead-lag�relationship�between�the�CDS�and�the�stock�market� is� time-varying�depending�on�the�market�conditions� (i.e.,� tranquil� times�vs.�crisis).�The�dramatically�contrasting�periods�(tranquil�vs.�chaotic)�divided�by�the�Great�Earthquake�in�Japan�provide�us�with�a�unique�opportunity�to�analyze�the�time-varying�lead-lag�relationship�between�the�CDS�and�the�stock�market.� In� this�paper,� following�Norden�and�Weber� (2009),� a� firm-specific�VAR�model� (vector�autoregressive)� is�used�to�analyze�the�daily� lead-lag�relationship�between�Japanese�CDS�and�stock�markets.�A�VAR�model� implicitly�assumes� functional�dependence�among�some�or�all�of� the�variables.18� In� this�sense�we�test�whether�Granger�causality�or�a� lead-lag�relationship�between�daily�CDS�premium�changes�and�stock�returns�exists.�The�F-statistic� tests� if� all�the�coefficients�of� the� lagged�stock�returns�are� jointly�statistically�significant�and�help� in�the�explanation�of�the�current�CDS�premium�changes�in�the�VAR�model�represented�in�equation�(1),�and�vice�versa�in�the�VAR�model�represented�in�equation�(2).�The�summary�results�of�the�Granger�causality� test�conducted�on�each�of� the�82�Japanese�companies� in�our�sample�are�presented�in�Table�2.
-49-
Lead-lag relationship between the CDS and the stock market and informed trading: Evidence from the Japanese CDS market

� First,�during�the�pre-earthquake�period�we�observe�more�cases�of�causality�from�the�stock�to� the�CDS�market� than� that� from�the�CDS�to� the�stock�market.�However,� the�proportion�of�causality� from�the�stock� to� the�CDS�market� (e.g.,� 18�of�82�at� the�0.05�significance� level)�is�much�smaller�as�compared�to� the�empirical�results�based�on�the�U.S.�and�European�data,�which�report�60-70%�of�cases�with�causality�from�the�stock�to�the�CDS�market.�For�the�same�period,�the�proportion�of�causality�from�the�CDS�to�the�stock�market�(e.g.,�12�of�82�at�the�0.05�significance� level)� is� similar� to� the�evidence�on�U.S.� and�European�markets.�These�results�suggest�that�the�stock�market’s�leading�role�in�the�price�discovery�process�is�very�weak�in�the�Japanese�market�relative�to�the�informational�dominance�of�the�stock�market�observed�in�the�U.S.�and�European�markets.� More� interesting� results� are� observed� in� the� post-earthquake�period.�Though�both�causalities�from�the�stock�to�the�CDS�market�and�from�the�CDS�to�the�stock�market�increase,�a�more�sizable�increase�is�observed�in�the�latter�at�all�the�significance�levels.�For�example,�at�the�0.05�significance�level�cases�of�causality�from�the�CDS�to�the�stock�market�increase�from�12�in�the�pre-earthquake�period�to�34�in�the�post-earthquake�period,�whereas�those�from�the�stock�to�the�CDS�market�increase�from�18�to�30.�As�a�result,�during�the�post-earthquake�period�we�observe�that�the�Japanese�CDS�market�more�often�leads�the�stock�market�than�vice�versa.� This�evident�shift� in� the� lead-lag�relationship�between� the�CDS�and� the�stock�market�presents�some�important�implications.�First�of�all,�this�result�suggests�that�the�relationship�is�not�stable�over�time.�In�particular,�the�significant�increase�in�the�CDS’s�leading�role�during�the�post-earthquake�period�suggests� that� the�CDS�market’s�contribution�to� the�price�discovery�process�is�much�higher�in�times�of�crisis.�These�empirical�results�based�on�the�Japanese�CDS�data�are�consistent�with�the�contention�of�Acharya�and�Johnson�(2007)�and�Qiu�and�Yu�(2012)�that� the� information� flow� from�the�CDS�market� to� the�stock�market�becomes�stronger� in�times�of�credit�deterioration.�However,�our�results�observed� in�the�Japanese�CDS�contradict�the�empirical�evidence�of�Forte�and�Lovreta�(2015),�in�which�the�stock�market’s�informational�dominance�holds� only� in� times�of� crisis�whereas� the�CDS�market’s� contribution� to�price�discovery�tends�to�be�higher�during�tranquil�times.� As�a�complement� to� the�causality� tests�we�also�examine� the�decomposition�of� forecast�
Table 2: Number of Granger-causal cases
Direction of Causality 0.01
Significant Level0.05 0.10
Pre-earthquake Period (2009.07.21-2011.03.11)
S→C 8 18 32C→S 6 12 14
Post-earthquake Period (2011.03.14-2012.10.16)
S→C 20 31 38C→S 20 34 43
Note:��‘S→C’�refers�to�‘stock�returns�do�Granger-cause�CDS�premium�changes’,�while�‘C→S’�refers�to�‘CDS�premi-um�changes�do�Granger-cause�stock�returns’.
-50-
Journal of East Asian Studies

error�variance.�For�a� time�horizon�of�5�and�10�days�we�measure�the� forecast�error�of�CDS�premium�changes�and� stock� returns� for�each�company� in� the� sample,� and�determine� the�percentage� that�each� innovation�contributes.�As�shown� in�Table�3,� for�both�pre-earthquake�and�post-earthquake�periods�a�relatively�large�part�of�the�forecast�error�variance�of�the�stock�returns� is�explained�by� innovations� in� the�CDS�premium�changes,�whereas� the� influence�of�innovations� in� the�stock�returns�on�CDS�premium�changes� is� slight.�By�contrast�with� the�evidence�based�on�the�U.S.�and�European�data,�this�result�indicates�the�relative�informational�dominance�of�CDS�premium�changes� in�the�price�discovery�process� in�the�Japanese�market.�We�may�attribute� this�result� to� the�unique� features�of� the�Japanese�bond�market,�which� is�illiquid�due�to�the�buy-and-hold�behavior�of�Japanese�bond�investors�as�well�as�the�inactive�repo�(repurchase�agreements)�market� for�corporate�bonds.�Accordingly,� trading�activity�related�to�firms’�credit�risk�takes�place�mainly�on�the�CDS�market�in�Japan.
Table 3: Average (median) decomposition of forecast error variances
Forecast Explained
Horizon Days
By Innovation inStock CDS
Pre-earthquake Period(2009.07.21-2011.03.11)
Stock5 94.91 (95.79) 5.09 (4.21)10 94.68 (95.50) 5.32 (4.50)
CDS5 1.79 (1.65) 98.21 (98.35)10 2.07 (1.85) 97.93 (98.15)
Post-earthquake Period(2011.03.14-2012.10.16)
Stock5 88.97 (89.63) 11.03 (10.37)10 88.64 (89.24) 11.36 (10.76)
CDS5 2.60 (2.16) 97.40 (97.84)10 2.86 (2.50) 97.14 (97.50)
Note:��Numbers� in�parenthesis� indicate�the�median�decomposition�of� forecast�error�variances�for�82�firms� in�the�sample.
� More�importantly,�the�leading�role�of�the�CDS�market�significantly�increases�in�the�post-earthquake�period.�For�example,�the�proportion�of�stock�returns’�forecast�errors�explained�by�CDS�premium�changes�for�the�horizon�of�10�days�exhibits�a�mean�(median)�of�11.36%�(10.76%)�during�the�post-earthquake�period�whereas�its�mean�(median)�is�5.32%�(4.50%)�during�the�pre-earthquake�period.�Thus,�combined�with�the�results�of�Granger�causality�tests�shown�in�Table�2,�this�result�confirms�that�the�relative�informational�dominance�of�CDS�premium�changes�in�the�price�discovery�becomes�stronger�during�the�times�of�crisis.� Next,�using� the�GARCH�model� shown� in�equation� (3),�we� investigate� the� transmission�mechanism� of�mean� and� variance� between� change� in�CDS�premium�and� stock� return.�Specifically,�based�on� the�results� in�Table�2,�we� identify� the�direction�of�causality�between�change�in�CDS�premium�(hereafter,�“C”)�and�stock�return�(hereafter,�“S”)�for�82�Japanese�firms.�Then,�at�the�0.05�significance�level�we�select�18�cases�of�causality�from�S�to�C�and�12�cases�of�causality�from�C�to�S�during�the�pre-earthquake�period�and�31�cases�of�causality�from�S�to�C�
-51-
Lead-lag relationship between the CDS and the stock market and informed trading: Evidence from the Japanese CDS market

and�34�cases�of�causality�from�C�to�S�during�the�post-earthquake�period.�Using�these�samples,�we�estimate�GARCH�model,�where� change� in�CDS�premium� is�dependent�variable�while�stock�return�is�included�as�exogenous�variable�if�causality�exists�from�S�to�C,�and�vice�versa�if�causality�exists�from�C�to�S.�As�mentioned�before,�the�coefficients,��β�and��δ,�in�the�GARCH�model�measure�the�transmission�effects�of�mean�and�variance,�respectively.�The�average�of�the�coefficients,��β�and��δ,�is�reported�in�Table�4.
Table 4: Transmission effect of mean and variance
Direction ofCausality
Meanβ
Varianceδ
Pre-earthquake Period(2009.07.21-2011.03.11)
S→C -0.1810 0.2524C→S -0.1146 0.0116
Post-earthquake Period (2011.03.14-2012.10.16)
S→C -0.1520 0.1898C→S -0.1464 0.0253
Note:��‘S→C’�refers�to�‘stock�returns�do�Granger-cause�CDS�premium�changes’,�while�‘C→S’�refers�to�‘CDS�premi-um�changes�do�Granger-cause�stock�returns’.
� We� find� that� the�coefficients,� �β,�which�measure� the� transmission�effect� of�mean,� are�all� negative,� suggesting� that�CDS�premium�changes� and� stock� returns� influence� in� the�opposite�direction�to�each�other.�During�the�pre-earthquake�period�the�magnitude�of�negative�coefficients,� �β,� is� larger� in�absolute�value� for� the�case�of�causality� from�S� to�C.�However,�during�the�post-earthquake�period�the�magnitude�of�negative�coefficients,��β,�becomes�close�to�each�other.�This�result�suggests�that�as�compared�to�the�pre-earthquake�period�the�influence�of�stock�return�on�CDS�premium�changes�decreases�during�the�post-earthquake�period�while�the�influence�of�CDS�premium�changes�on�stock�return�increases�during�the�same�time�period.� In�Table�4�we�observe� that� the�coefficients,�δ,�which�measure� the� transmission�effect�of�variance,� are� large�and�positive� for� the�case�of� causality� from�S� to�C,� implying� that� a�volatility�surprise�in�stock�return�affect�the�volatility�of�CDS�premium�changes.�However,�their�magnitude�declines�during�the�post-earthquake�period,�implying�that�the�volatility�transmission�effect� from�stock�return� to�CDS�premium�changes�weakens�after� the�Great�Earthquake� in�Japan.�On�the�other�hand,�we�find�that�the�transmission�effect�of�variance�from�CDS�premium�changes�to�stock�return�is�very�weak�in�the�Japanese�market.
4.�INFORMED�TRADING�IN�THE�JAPANESE�CDS�MARKET� Given� this�evidence�of� the� leading�role�of� the�CDS�market� in�Japan,�we�are�motivated�to� investigate�the�possibility�of� informed�trading� in�the�Japanese�CDS�market.�Acharya�and�Johnson� (2007)� argue� that� though�asymmetric� information� and� insider� trading�problems�potentially�exist� in�most�markets,� the�CDS�market� is�especially�vulnerable�because�the�main�
-52-
Journal of East Asian Studies

participants� in�the�CDS�market�such�as�banks,�hedge�funds,�and�major� institutional� investors�are�typically�informed�traders.�Thus,�their�informed�trading�of�CDS�may�engender�a�significant�incremental�information�revelation�in�the�CDS�market,�yet�insider�trading�occurs�only�for�firms�that�are�expected�to�experience�credit�deterioration.�In�their�empirical�investigation�of�insider�trading� for� the�sample�of� the�U.S.�CDS,�Acharya�and�Johnson� (2007)�and�Qiu�and�Yu� (2012)�provide�evidence�consistent�with�the�above-mentioned�argument.� In� the� Japanese�CDS�market� the�main�protection�buyers� are� Japanese�banks�while�foreign�securities�companies�and�hedge� funds�participate�as�protection�sellers.�Considering�the�important�role�of�the�main�banks�in�corporate�governance�in�Japan,19�Japanese�banks�may�possess�more�inside�information�compared�to�the�banks�in�the�U.S.,�and�take�buying�positions�for�the�CDS�of�firms�that�are�expected�to�subsequently�experience�severe�credit�deterioration.�Therefore,� following�the�same�methodology�as�Acharya�and�Johnson� (2007)�and�Qiu�and�Yu�(2012),�this�paper�investigates�informed�trading�in�the�Japanese�CDS�market�for�the�two�(tranquil�vs.�chaotic)�periods�divided�by�the�Great�Earthquake.�The�results�are�reported�in�Table�5.
Table 5: Information flow from the CDS to Stock market for adverse credit conditions
Pre-earthquake period(2009.07.21-2011.03.11)
Post-earthquake period(2011.03.14-2012.10.16)
a0.020** -0.049***(1.84) (3.82)
∑5k=1bk
-0.038*** 0.038***(-4.16) (3.20)
∑5k=1bk
D -0.018 -0.086***(-0.59) (-3.34)
∑5k=1ck
-0.056*** 0.035**(-4.13) (2.49)
∑5k=1ck
D -0.055 0.137***(-1.14) (3.65)
Note:�***,�**,�*�indicate�a�statistical�significance�at�1%,�5%�and�10%�respectively.
� Of�key� importance� in�Table�5�are�∑5k=1bk�and�∑5
k=1bkD.�For� the�pre-earthquake�period�we�
observe�significantly�negative�∑5k=1bk,� indicating� the�unconditional� information� flow� from�the�
CDS�market�to�the�stock�market.�However,�∑5k=1bk
D�is�not�statistically�significant,�suggesting�that�there�is�no�incremental�information�flow�from�the�CDS�to�the�stock�market�conditional�on�there�being�a�bad�credit�event�ahead.�These�results�for�the�Japanese�CDS�are�different�from�those�of�Acharya�and�Johnson�(2007)�and�Qiu�and�Yu�(2012),�which�present�the�existence�of�information�flow�from�the�CDS�to�the�stock�market�only�for�firms�that�are�expected�to�experience�a�bad�credit�event�in�the�future.� However,� for� the�post-earthquake�period�∑5
k=1bkD� is�significantly�negative,�suggesting�that�
the�conditional�information�flow�from�the�CDS�to�the�stock�exists�in�times�of�crisis.�Although�∑5
k=1bk� is�significantly�positive,� its�magnitude�is�smaller�than�that�of�∑5k=1bk
D.�By�adding�the�two�
-53-
Lead-lag relationship between the CDS and the stock market and informed trading: Evidence from the Japanese CDS market
terms�we� find� that�∑5k=1(bk+bk
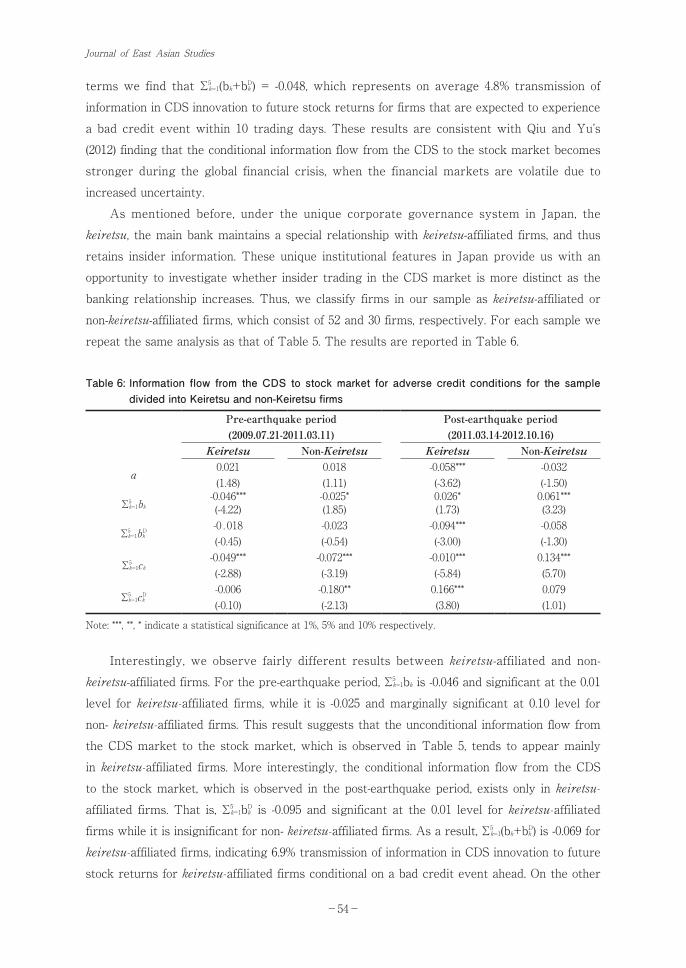
D)�=� -0.048,�which�represents�on�average�4.8%� transmission�of�information�in�CDS�innovation�to�future�stock�returns�for�firms�that�are�expected�to�experience�a�bad�credit�event�within�10� trading�days.�These�results�are�consistent�with�Qiu�and�Yu’s�(2012)�finding�that�the�conditional�information�flow�from�the�CDS�to�the�stock�market�becomes�stronger�during� the�global� financial� crisis,�when� the� financial�markets�are�volatile�due� to�increased�uncertainty.�� As�mentioned�before,� under� the�unique� corporate�governance� system� in� Japan,� the�keiretsu,�the�main�bank�maintains�a�special�relationship�with�keiretsu-affiliated�firms,�and�thus�retains� insider� information.�These�unique� institutional� features� in�Japan�provide�us�with�an�opportunity�to�investigate�whether�insider�trading�in�the�CDS�market�is�more�distinct�as�the�banking�relationship� increases.�Thus,�we�classify� firms� in�our�sample�as�keiretsu-affiliated�or�non-keiretsu-affiliated�firms,�which�consist�of�52�and�30�firms,�respectively.�For�each�sample�we�repeat�the�same�analysis�as�that�of�Table�5.�The�results�are�reported�in�Table�6.
Table 6: Information flow from the CDS to stock market for adverse credit conditions for the sample divided into Keiretsu and non-Keiretsu firms
Pre-earthquake period(2009.07.21-2011.03.11)
Post-earthquake period(2011.03.14-2012.10.16)
Keiretsu Non-Keiretsu Keiretsu Non-Keiretsu
a0.021 0.018 -0.058*** -0.032(1.48) (1.11) (-3.62) (-1.50)
∑5k=1bk
-0.046*** -0.025* 0.026* 0.061***(-4.22) (1.85) (1.73) (3.23)
∑5k=1bk
D -0.018 -0.023 -0.094*** -0.058(-0.45) (-0.54) (-3.00) (-1.30)
∑5k=1ck
-0.049*** -0.072*** -0.010*** 0.134***(-2.88) (-3.19) (-5.84) (5.70)
∑5k=1ck
D -0.006 -0.180** 0.166*** 0.079(-0.10) (-2.13) (3.80) (1.01)
Note:�***,�**,�*�indicate�a�statistical�significance�at�1%,�5%�and�10%�respectively.
� Interestingly,�we�observe� fairly�different� results�between�keiretsu-affiliated�and�non-keiretsu-affiliated�firms.�For�the�pre-earthquake�period,�∑5
k=1bk�is�-0.046�and�significant�at�the�0.01�level� for keiretsu-affiliated� firms,�while� it� is� -0.025�and�marginally�significant�at�0.10� level� for�non- keiretsu-affiliated�firms.�This�result�suggests�that�the�unconditional�information�flow�from�the�CDS�market�to�the�stock�market,�which� is�observed� in�Table�5,� tends�to�appear�mainly�in keiretsu-affiliated� firms.�More� interestingly,� the�conditional� information� flow�from�the�CDS�to�the�stock�market,�which� is�observed�in�the�post-earthquake�period,�exists�only� in keiretsu-affiliated� firms.�That� is,�∑5
k=1bkD� is� -0.095�and�significant�at� the�0.01� level� for keiretsu-affiliated�
firms�while�it�is�insignificant�for�non- keiretsu-affiliated�firms.�As�a�result,�∑5k=1(bk+bk
D)�is�-0.069�for keiretsu-affiliated�firms,�indicating�6.9%�transmission�of�information�in�CDS�innovation�to�future�stock�returns�for keiretsu-affiliated�firms�conditional�on�a�bad�credit�event�ahead.�On�the�other�
-54-
Journal of East Asian Studies

hand,�∑5k=1(bk+bk
D)�is�0.003�for�non-keiretsu-affiliated�firms,�suggesting�that�conditional�information�flow�from�the�CDS�market�to�the�stock�market�does�not�exist�for�non- keiretsu-affiliated�firms.�Thus,�we�know�that�the�result�of�∑5
k=1bk+bkD)=�-0.048�observed�in�Table�5�is�mainly�incurred�by�
keiretsu-affiliated�firms.� Collectively,� these� findings�suggest� that� in� the�Japanese�CDS�market� the�unconditional�information�flow�from�the�CDS�market�to�the�stock�market�exists�mainly�for�keiretsu-affiliated�firms.� In�addition,� the� flow�of� information� from�the�CDS�market� to� the�stock�market� that� is�conditional�on�there�being�a�bad�credit�event�ahead�exists�only�in�times�of�crisis�and�moreover,�only�for�keiretsu-affiliated�firms.�This�result�supports�Acharya�and�Johnson’s�(2007)�contention�that� insider� trading� in� the�CDS�market� occurs� for� entities� that� subsequently�experience�adverse�credit�events�and� that� this�phenomenon� is�more�distinct�as�banking�relationships�increase.
5.�SUMMARY�AND�CONCLUSIONS� This�paper�analyzes�the�dynamic�relationship�between�the�CDS�and�the�stock�market�for�a�sample�of�Japanese�companies�during�the�period�from�July�21,�2009�to�October�16,�2012.�In�particular,�by� focusing�on�the�difference� in�the�results�between�the�two� (tranquil�vs.�chaotic)�periods�divided�by�the�Great�Earthquake�on�March�11,�2011,�we�investigate�the�intertemporal�lead-lag�relationship�between�the�CDS�and�the�stock�market.�In�addition,�this�paper�investigates�whether� informed�trading�occurs� in� the�Japanese�CDS�market�similar� to� insider� trading� in�the�U.S.�CDS�market,�which�is�empirically�evidenced�by�Acharya�and�Johnson�(2007)�and�Qiu�and�Yu�(2012).�Furthermore,�this�paper�investigates�whether�informed�trading�patterns�in�the�Japanese�CDS�market�is�different�between�firms�that�are�keiretsu-affiliated�or�not.� The�results�are�summarized�as� follows.�First,� consistent�with�prior�evidence�primarily�based�on� the�U.S.�and�European�data,� the�contemporaneous�correlation�between�daily�CDS�premium�changes�and�stock�returns�are�significantly�negative�in�the�Japanese�market.�Second,�we� find�that� the�stock�market’s� leading�role� in� the�price�discovery�process� is�very�weak� in�the�Japanese�market�relative� to� the� informational�dominance�of� the�stock�market�observed�in�the�U.S.�and�European�markets.�Third,�we�observe�that� the� lead-lag�relationship�between�the�Japanese�CDS�and�the�stock�market�is�not�stable�and�that�the�CDS�market’s�contribution�to�the�price�discovery�process�is�much�higher�in�times�of�crisis.�Fourth,�in�the�Japanese�CDS�market�an�unconditional� information� flow�from�the�CDS�market� to� the�stock�market�exists,�but�primarily�for keiretsu-affiliated�firms.�Fifth,�the�flow�of� information�from�the�CDS�market�to�the�stock�market�that�is�conditional�on�there�being�a�bad�credit�event�ahead�exists�only�in�times�of�crisis�and�moreover,�only� for�keiretsu-affiliated� firms.�This�result�supports�Acharya�and�Johnson’s�(2007)�contention�that�insider�trading�in�the�CDS�market�occurs�for�entities�that�subsequently�experience�adverse�credit�events�and�that�this�phenomenon� is�more�distinct�as�
-55-
Lead-lag relationship between the CDS and the stock market and informed trading: Evidence from the Japanese CDS market

the�banking�relationship�increases.� In�conclusion,�prior�empirical�evidence�on�the�lead-lag�relationship�between�the�CDS�and�the�stock�market�and�informed�trading�in�the�CDS�market,�which�is�mainly�based�on�U.S.�and�European�data,�generally�holds� for�a�sample�of�Japanese�CDS.�For�example,�similar�evidence�includes�negative�contemporaneous�correlation�between�daily�CDS�premium�changes�and�stock�returns,� the�time-varying� lead-lag�relationship�between�the�CDS�and�the�stock�market,�occurrence�of� informed�trading� in�the�CDS�market� for�entities�that�subsequently�experience�adverse�credit�events,�etc.�However,� if�we�examine�the�details,� some�differences�exist.�First�of�all,�the�CDS�market’s�leading�role�in�the�price�discovery�process�is�relatively�strong�in�the�Japanese�market�as�compared�to�the� informational�dominance�of� the�stock�market�observed�in�the�U.S.�and�European�markets.�We�may�attribute�this�result�to�the�unique�features�of�the�Japanese�bond�market,�which� is� illiquid�due� to� the�buy-and-hold�behavior�of�Japanese�bond�investors�as�well�as� the� inactive�repo� (repurchase�agreements)�market� for�corporate�bonds.�Accordingly,� in� Japan,� the� trading�activity�related� to� firms’� credit� risk� takes�place�mainly�on� the�CDS�market.�More� interestingly,� this� information� flow� from�the�CDS�market� to� the�stock�market� is�mainly�concentrated� in keiretsu-affiliated� firms.�Under�the�unique�corporate�governance�system�(the�keiretsu)�in�Japan,�the�main�bank�maintains�a�special�relationship�with keiretsu-affiliated�firms,�and�thus�retains� insider� information.�Hence,� this�result�suggests�that�informed�trading�in�the�CDS�market�is�more�distinct�as�banking�relationship�increases.
Note1.��In�this�paper,�the�definition�of� informed�trading�comes�from�Ahn�et�al.� (2008),�which�means�trading�on�
information�not�yet�reflected� in�claims�price.�Traders�may�have�obtained�this� information�from�astute�analysis�of�varied�bits�of�publicly�available� information,�newly�disclosed�public� information�yet� to�be�incorporated� into�claims’�price,�or�confidential� information�possessed�by�firm� insiders�or�other�entities.�On�the�contrary,�insider�trading�usually�means�trading�on�information�that�originate�inside�the�company.
2.��Norden�and�Weber� (2009)�and�Forte�and�Lovreta� (2015)� include�Japanese�CDS�data� in� their�sample.�However,�the�number�of�Japanese�samples�is�limited�to�less�than�10,�and�the�sample�period�is�covered�for�pre-2008.
3.��On�March�11,�2011,�the�earthquake�had�a�little�impact�on�the�stock�market�because�the�main�earthquake�occurred�at�14:46,�just�14�minutes�before�the�market�closing�at�15:00.�On�the�following�Monday,�March�14,�the�Nikkei�market� index�opened�at�10,044.17�points�and�continued�to�drop�to�9,620.49�points,�which�recorded� -6.18%�from�the�closing�price�of�10,254.43�points�on� the�previous�Friday.�The�Nikkei� index�marked�the�local�minimum�point�at�8,227�on�March�15,�and�then�bounced�back�to�over�9,000�points�by�the�end�of� the�week.� In� terms�of� individual� firm� level,�however,�depending�on�the�nature�of�business�or�the�location�of�factory,�uncertainty�continued�to�persist�for�a�while.�For�example,�the�electric�power�industry,� insurance�firms,�and�social� infra-related�firms�are�more�exposed�to�uncertainty.� In�particular,�Tokyo�Electric�Power�Co.� (TEPCO)�experienced�an�extremely�difficult� time�due� to�accidents�at� the�nuclear�power�plants�and�the�radiation�problem.�Meanwhile,� for�our�sample�of�82�Japanese� firms,� the�average�(median)�CDS�premium�is�103.84�(69.27)�basis�points�during�the�period�from�July�21,�2009�until�the�day�before� the�Great�Earthquake�on�March�11,�2011,�while� the�average� (median)�CDS�premium�is�154.61� (124.23)�basis�points�during� the�period� from�the�earthquake�day� to�October�16,�2012.�More�
-56-
Journal of East Asian Studies

importantly,�the�average�volatility,�which�is�measured�as�the�standard�deviations�of�daily�CDS�premium�changes�of�82�sample�firms,�significantly�increases�from�28.98�in�the�pre-earthquake�period�to�60.16�in�the�post-�earthquake�period.
4.��In�the�investigation�of�price�discovery�of�credit�spreads�for�Japanese�Mega-banks,�Baba�and�Inada�(2007)�find�that�the�CDS�spread�plays�a�more�dominant�role�in�price�discovery�than�the�bond�spread�and�that�there�is�significant�information�spillover�from�the�CDS�to�the�bond�spread.
5.��Ito�and�Harada�(2004)�document�that�CDS�is�a�good�measure�of�the�soundness�of�Japanese�banks�rather�than�the�Japan�premium,�which�is�calculated�as�the�interbank�interest�rate�spread�over�the�LIBOR�(London�Interbank�Offered�Rates)
6.��Although�recently�the�keiretsu�is�losing�its�grip,�this�unique�corporate�governance�system�in�Japan�has�attracted�numerous�studies.�However,�some�studies�present�a�negative�view�on�this�system�in�terms�of�aggravation�of�agency�costs�(among�them,�e.�g.,�Weinstein�and�Yafeh,�1998;�Morck,�2000).�In�particular,�as�another�pathology�of�the�keiretsu,�Hiraki�and�Ito�(2009)�report�that�keiretsu-affiliated�money�managers�drive� their�portfolio�decisions� toward� financially�weak� firms�of� their�keiretsu�at� the�expense�of� their�client�investors.
7.��After�major�structural�changes�in�the�early�2000,�there�are�three�mega-banks�in�Japan�such�as�the�Bank�of�Tokyo-Mitsubishi�UFJ,�Sumitomo�Mitsui�Banking�Corporation,�and�Mizuho�Corporate�Bank,�which�respectively�belong�to�Mitsubishi,�Mitsui,�and�Mizuho�group.�Ito�and�Harada�(2004)�mention�that�the�main�reference�entities�are�these�mega-banks�in�the�Japanese�CDS�market.
8.��For�example,�Bittlingmayer�et�al.�(2013)�observe�that�in�the�CDS�data�set�from�Markit�Group,�which�is�frequently�used�in�CDS�studies,�73.21%�of�the�daily�observations�is�unchanged�from�the�previous�day�in�2001.�This�percentage�of�unchanged�quotes�decreases�every�year,�declining�to�5.75%�in�2010.
9.��For�example,�Norden�and�Weber� (2009)�select� firms�with�at� least�100�daily�CDS�quotes� in�each�of�the�years�2000–2002.�Forte�and�Lovreta�(2015)�exclude�companies�with�quotes�and�trades�available�for�less�than�5%�of�the�trading�days�in�any�of�the�years�2002-2008.
10.��Given� that�no� trading�volume�data�are�available� in� the�CDS�data� set,�prior� studies�conjecture� the�illiquidity�of�CDS�contracts�with�slight�price�variation�over�a�certain�period�of�time.
11.��Out�of�82�sample�firms�71�firms’�stocks�are�included�in�the�Nikkei�225�index.�as�of�October�16,�2012.12.��Among�82�firms�in�our�sample,�only�one�company�(ACOM�Co.,�Ltd.)�exhibits�a�decrease�in�its�average�
CDS�premium�from�the�pre-earthquake�to�post-�earthquake�period.13.��Norden�and�Weber�(2009)�also�use�lag�of�order�5�in�their�VAR�model�for�daily�data.14.��This�paper�adopts�GARCH(1,1)�model�by� the� results� of�AIC� (Akaike’s� Information�Criterion)� and�
SBC(Schwartz�Bayesian�Criterion)�tests.15.��In�fact,�the�actual�definition�of�a�major�credit�event�is�critical�in�empirical�studies�on�informed�trading�
in�CDS�markets.�For�example,�Acharya�and�Johnson� (2007)�define�a�credit�event� in� three�different�specifications�as�when� (i)� the� firm�experiences�a�credit�deterioration�of�more� than�50�basis�points�between�date�t�and�the�end�of�the�sample;�(ii)�the�firm’s�credit�spread�level�remains�at�a�level�greater�than�100�basis�points�between�time�t�and�end�of�the�sample�period;�and�(iii)�the�credit�rating�of�the�firm�at� time�t� is� low,� that� is,�A3/A-�or�worse.�However,�similar�results�are�obtained� from�three�different�specifications.�Qiu�and�Yu� (2012)�also�provide�similar�results�between�two�alternative�definitions�of�a�credit�event�when�(i)�an�increase�in�the�daily�CDS�spread�increases�by�more�than�50�basis�points�and�(ii)�the�one-day�increase�in�the�CDS�premium�is�greater�than�4�standard�deviations�of�the�rolling�60-day�period�average�percentage�CDS�change.
16.��The�detailed�results�are�omitted�in�this�paper,�but�are�available�upon�request.17.��Hilscher�et�al.�(2011)�mention�the�transaction�costs�for�CDS�contracts�and�inattentive�participants�in�the�
CDS�market�as�reasons� for�the�delay� in�the�adjustment�of�CDS�premiums�to�publicly�available�stock�return�data.
18.��Because�the�VAR�model�is�a�reduced�form�model,�it�is�not�meaningful�to�interpret�the�coefficients,�and�for�this�reason�they�are�not�reported�in�this�paper.
19.��See,�for�example,�Hoshi�et�al.�(1993),�Kaplan�(1994),�Kaplan�and�Minton�(1994),�Kang�and�Shivdasani�(1995),�
-57-
Lead-lag relationship between the CDS and the stock market and informed trading: Evidence from the Japanese CDS market

Kang�and�Shivdasani�(1997),�and�Imai�(2007).
ReferencesAcharya,�V.V.�and�Johnson,�T.C.�2007.�Insider�trading�in�credit�derivatives. Journal of Financial Economics,�
84:�110-141.Angelopouos,�G.�and�Glamouridis,�D.�2012.�Dissecting�insider�trading�in�credit�derivatives,�Working paper,�
Athens�University.Ahn,�HJ.,�Kang,�J.�and�Ryu,�D.�2008.�Informed�trading�in�the�index�option�market:�The�case�of�KOSPI�200�
options.�Journal�of�Futures�Markets,�28:�1118–1146.Baba,�N.�and�Inada,�M.�2007.�Price�discovery�of�credit�spreads�for�Japanese�mega-banks:�Subordinated�bond�
and�CDS.�Discussion paper,�Institute�for�Monetary�and�Economic�Studies,�Bank�of�Japan.Berndt,�A.�and�Ostrovnaya,�A.�2008.�Do�equity�market� favor�credit�market�news�over�options�market�
news?�Working paper,�Carnegie�Mellon�University.Bittlingmayer,�G.,�Du,�L.�and�Huang,�J.�2013.�When�do�stocks�lag�credit�derivatives?�The�role�of�information�
uncertainty�and�short-sale�constraints.�Working paper,�University�of�Kansas.Blanco,�R.,�Brennan,�S.� and�Marsh,� I.W.�2005.�An�empirical� analysis�of� the�dynamic� relation�between�
investment-grade�bonds�and�credit�default�swaps.�Journal of Finance,�60:�2255-2281.Forte,�S.�and�Peña,�J.I.�2009.�Credit�spreads:�An�empirical�analysis�on�the�informational�content�of�stocks,�
bond,�and�CDS.�Journal of Banking & Finance,�33:�2013-2025.Forte,�S.�and�Lovreta,�L.�2015.�Credit�risk�discovery�in�the�stock�and�CDS�markets:�Who�leads�in�times�of�
financial�crisis?�European Financial Management,�21:�430-461.Granger,�C.W.J.� 1969.� Investigating�causal� relations�by�econometric�model�and�cross-spectral�method.�
Econometrica,�37:�424-438.Hilscher,� J.,� Pollet,� J.M.� and�Wilson,�M.� 2011.�Are� credit� default� swaps� a� sideshow?�Evidence� that�
information�flows�from�equity�to�CDS�markets.�Working paper,�Brandeis�University.�Hiraki,�T.�and�Ito,�A.�2009.�Investor�biases�in�Japan:�Another�pathology�of�Keiretsu. Pacific-Basin Finance
Journal,�17:�100-124.Hoshi,�T.,�Kashyap,�A.�and�Scharfstein,�D.�1990.�The�role�of�banks�in�reducing�the�costs�of�financial�distress�
in�Japan. Journal of Financial Economics,�27:�67–88.Imai,�M.�2007.�The�emergence�of�market�monitoring� in�Japanese�banks:�Evidence�from�the�subordinated�
debt�market.�Journal of Banking and Finance,�31:�1441-1460.Ito,�T.�and�Harada,�K.�2004.�Credit�derivatives�premium�as�a�new�Japan�premium.� Journal of Money,
Credit, and Banking,�36:�965-968.Kang,�J.K.�and�Shivdasani,�A.�1995.�Firm�performance,�corporate�governance,�and�top�executive�turnover�in�
Japan. Journal of Financial Economics,�38:�29–58.Kang,�J.K.�and�Shivdasani,�A.�1997.�Corporate�restructuring�during�performance�declines�in�Japan. Journal
of Financial Economics,�46:�29–65.Kaplan,�S.N.�and�Minton,�B.A.�1994.�Appointments�of�outsiders� to� Japanese�boards:�Determinants�and�
implications�for�managers. Journal of Financial Economics,�36:�225–258.Kaplan,�S.N.�1994.�Top�executive�rewards�and�firm�performance:�A�comparison�of�Japan�and�the�United�
States.�Journal of Political Economy,�102:�510–546.Longstaff,�F.A.,�Mithal,� S.� and�Neis,�E.� 2005.�Corporate�yield� spreads:�Default� risk�or� liquidity?�New�
evidence�from�the�credit-default�swap�market.�Journal of Finance,�60:�2213-2253.Morck,�R.,�Nakamura,�M.�and�Shivdasani,�A.�2000.�Banks,�ownership�structure,�and� firm�value� in�Japan.�
Journal of Business,�73:�539–567.Norden,�L.�and�Weber.�M.�2009.�The�co-movement�of�credit�default� swap,�bond�and�stock�market:�An�
empirical�analysis.�European Financial Management,�15:�529-562.Qiu,�J.�and�Yu,�F.�2012.�Endogenous� liquidity� in�credit�derivatives. Journal of Financial Economics,�103:�
611-631.Weinstein,�D.E.�and�Yafeh,�Y.�1998.�On�the�costs�of�a�bank-centered�financial�system:�Evidence�from�the�
-58-
Journal of East Asian Studies

changing�main�bank�relations�in�Japan.�Journal of Finance,�53:�635–672.Zhu,�H.�2006.�An�empirical�comparison�of�credit�spreads�between�the�bond�market�and�the�credit�default�
swap�market.�Journal of Financial Services Research,�29:�211-235.
-59-
Lead-lag relationship between the CDS and the stock market and informed trading: Evidence from the Japanese CDS market