leadership champlain energy day “the future ain’t what it use to be” february 8, 2011
Post on 19-Dec-2015
214 views
TRANSCRIPT

Leadership ChamplainEnergy Day
“The Future Ain’t What it Use to Be”
February 8, 2011
Four Key Factors Shaping our Future
• Energy Costs• Climate Change• Demographics• Funding

Which Sector uses the most Energy in Vermont?
A.ResidentialB. CommercialC. IndustrialD.Transportation

Vermont Energy Use by Sector, 2007
Residential 47,676 billion BTU 30%Commercial 31,249 billion BTU 19%Industrial 30,282billion BTU 18%TRANSPORTATION 54,505 billion BTU 33%
Vermont
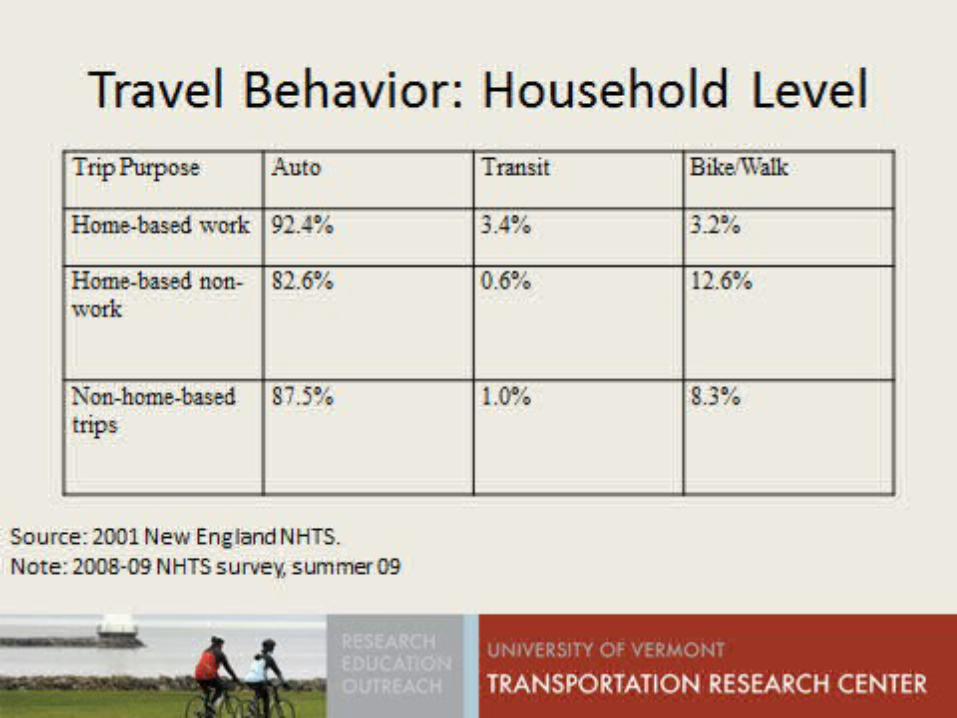

Vehicle Occupancy by Trip Purpose


Vermonters’ Trip Length

Distance home to school (miles)


How is climate change affecting our transportation system?
A. Increased freeze thaw cycle reduces structural life expectancy B. Increased temperatures leads to pavement and rail bucklingC. Increased rainfall/intensity leads to more flooding and associated bridge, culvert and roadway washoutsD. Increased wind force increase scour impact on bridgesE. All of the above and more


What percentage of Vermonters do not have full time access to a vehicle?
A. 10%B. 25%C. 35%D. 40%E. 50%

Non-Drivers2010
32% of Vermonters do not have full time access to a vehicle.


Transit-Supportive Areas

Bicycle and Pedestrian Resources in Vermont Municipalities, 2005
Public Resource Average Miles
Percent of Municipalities Providing Resources
Sidewalk 4.1 41.5 %
Bicycle Lanes 0.4 8.1 %
Off-Road Bicycle/Pedestrian Paths 1.9 21.5 %
Foot Paths (Hiking and Walking Trails) 3.2 37.8 %


How much money is spent annually in Vermont on Transportation?
A. $200 millionB. $400 millionC. $800 millionD. $1.6 billionE. $3.2 billion

• $50 million- total expenditures reported by school districts for transportation (FY 2009)
• $941 million – total expenditures for the purchase of petroleum in Vermont (CY 2009)
• $11.8 million – Medicaid Transportation expenditures (FY 2009)• $46.5 million expenditures on motor vehicle purchase and use (FY 2010)• $93.7 million on motor vehicle fees and other fees and taxes (FY 2010)• $395 million – expenditures by the Vermont Agency of Transportation (FY 2009)• ~$228 million- expenditures by Vermont Municipalities on Transportation (60% of PVR
total municipal property taxes collected, 2009) • ~$1.9 billion – personal cost of motor vehicle ownership (not operation)*
• ~$ 3.6 BILLION - Total expenditures Public and Private on transportation in Vermont
Vermont Public and Private Annual Expenditures on Current Transportation System


80% renewables by 20301. Electrify entire fleet2. Increase efficient driving 3. Support and increase programs and infrastructure to reduce vehicle
miles traveled but not necessarily travel:• Support CarShare Vermont and similar programs• TDM measures at both employer and household level• Complete streets• Use of social networks for car pooling (increase vehicle occupancy
rate)• Build the missing links of paths, sidewalks, bike lanes• Shift the 10% of all trips of less than a mile that are currently made
by personal vehicle to active transportation• Smart growth• Improve transit options
4. Adopt Vehicle to Grid technology

Hybrid Ownership by Vermont County, 2010 (percent of total registered vehicles)

Potential Energy Savings from Transportation Efficiency
• Employer based TDM: SOV trip reduction of 25%
• Household-based TDM: SOV trip reduction of 2-6%
By 2020, an AEV fleet of 50,0000 in Vermont could represent a power resource of 300 MW with the ability to store 1,000 MWh of energy.
VEHICLE TO GRID

Increased Electrical Need to Electrify Current Fleet with Current Travel Behavior

“The Future Ain’t What it Use to Be”