leadership, integrity, service and teamwork
TRANSCRIPT

Leadership, Integrity, Service and Teamwork Council Goal #5: to promote and enhance the City’s safe
community and neighborhood programs and initiatives

Chief of Police (Major)
Administrative Captain (1)
Administrative Specialist II (2)
SET Sergeant (1)
SET Detectives (4)
Detective Sergeant (1)
Detectives (4) Crime
Prevention Officer (1)
Community Service Officer
(1)
Operations Captain (1)
Patrol Sergeants (5)
Patrol Deputies (23)
School Resource Officer (1)
Traffic Sergeant (1)
Traffic Deputies (5)
2
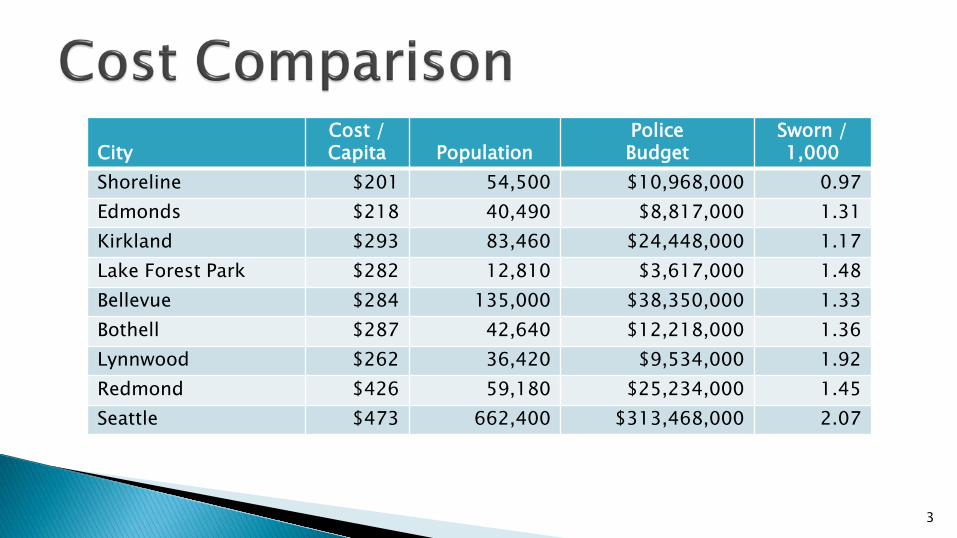
City
Cost / Capita
Population
Police Budget
Sworn / 1,000
Shoreline $201 54,500 $10,968,000 0.97 Edmonds $218 40,490 $8,817,000 1.31 Kirkland $293 83,460 $24,448,000 1.17 Lake Forest Park $282 12,810 $3,617,000 1.48 Bellevue $284 135,000 $38,350,000 1.33 Bothell $287 42,640 $12,218,000 1.36 Lynnwood $262 36,420 $9,534,000 1.92 Redmond $426 59,180 $25,234,000 1.45 Seattle $473 662,400 $313,468,000 2.07
3

Feel safe in their own neighborhoods during the day: 92%
Overall feeling of safety in: ◦ Shoreline: 80% ◦ Other public areas in Shoreline: 70% ◦ Their neighborhood during the night: 69%
Area of Focus: ◦ Enforcement of local traffic laws ◦ City’s efforts to prevent crime
20%
14%
13%
13%
12%
9%
56%
49%
50%
39%
39%
40%
19%
25%
28%
37%
34%
36%
4%
9%
8%
8%
11%
12%
1%
3%
1%
3%
4%
3%
Overall quality of local policeprotection
Enforcement of local trafficlaws
The City's efforts to preventcrime
Enforcement of prostitutionlaws
Enforcement of drug laws
Enforcement of propertycrime laws
Q9. Respondent Overall Satisfaction with Public Safety Services
Very Satisfied Satisfied Neutral Dissatisfied Very Dissatisfied
52%
18%
15%
21%
12%
40%
62%
55%
48%
46%
6%
17%
26%
21%
31%
2%
2%
3%
8%
9%
0%
1%
1%
2%
2%
In your neighborhood duringthe day
Overall feeling of safety inShoreline
In other public areas inShoreline
In your neighborhood atnight
In city parks and trails
Q11. Respondent Rating of How Safe They Feel
Very Safe Safe Neutral Unsafe Very Unsafe
Source: 2014 Citizen Satisfaction Survey 4

29,554 Police events in 2015 14,872 Dispatched Calls for Service 14,682 On-views, self-initiated activity
5
444 408 355 314 259 148
10,981 11,343 12,045 13,139 14,873 14,872
0
5,000
10,000
15,000
20,000
2010 2011 2012 2013 2014 2015
Calls for Police Assistance
Alternative Call HandlingDispatched Calls for Service
4.20 4.48 3.39 3.42 3.92 3.57
7.36 6.91 6.01 6.48 6.82 7.37
11.24 10.35 9.20 9.51 9.90 10.88
0.00
2.50
5.00
7.50
10.00
2010 2011 2012 2013 2014 2015
Ave. Response Times to High Priority Calls (in minutes)
Priority X Priority 1 Priority 2

Firearms, Defensive Tactics, Driving
On-line training
Active Shooter and Patrol (ASAP)
LEED Principals
Specialized Investigations
6

Cross Department effort with City Manager’s Office and Departments
42 Crime Prevention Meetings (2015)
Park Safety Problem Solving Projects Quality of Life Concerns Communication
7 CrimeReports website: http://www.crimereports.com/

Neighborhoods School Zones Speed Differential Map Traffic Complaints 2015: Citations: 4,799 Warnings: 3,812 Abandoned Vehicles: 221 Impounds: 67 Court Transports: 211
8

9
1.01 0.99 0.99 0.96 0.97 0.97
0.00
1.00
2.00
2010 2011 2012 2013 2014 2015
Commissioned Officers per 1,000 Residents
30 34 33 34 34 27
0204060
2010 2011 2012 2013 2014 2015
Part I Crimes per 1,000 Residents
1 1 3
0 1
0 0246
2010 2011 2012 2013 2014 2015
Homicides 44
35 41 23
33 26
0204060
2010 2011 2012 2013 2014 2015
Robbery

10
More statistics are provided and discussed in the Annual Police Service Reports available online at http://cityofshoreline.com/government/departments/police-department/crime-reports-maps/annual-police-service-reports
115 136 111 201 240
164
0100200300
2010 2011 2012 2013 2014 2015
Vehicle Theft
321 395 394 410
320 305
91 53 73 65 87 74
0100200300400500
2010 2011 2012 2013 2014 2015
Thefts from Vehicles and Attempted Thefts ("Prowls")
Thefts fromVehicles
AttemptedThefts fromVehicles("Prowls")
1,054 1,221 1,123 1,098 1,014 825
0
1,000
2,000
2010 2011 2012 2013 2014 2015
Larceny (except vehicles)
319 351 418 426 455 370
0200400600800
2010 2011 2012 2013 2014 2015
Burglary

Risk Analysis De-Escalation And Referral: provide officers with information to reduce use of force incidents
Relationships Shorelineradar.org Safety ◦ Tasers ◦ AEDs ◦ Policy/Pursuits
11

Community Service Officer Building relationships with at-risk community ◦ Bullying ◦ Discipline ◦ Teen Suicide ◦ Narcotics ◦ Domestic Violence
School Resource Officer ◦ Partnership with Shoreline School District covering 26% of cost and City covering 74%
of cost COPS Officer: crime prevention Annual Police Service Reports
12
