leading dragons phenomenon - world bank · leading dragons phenomenon new opportunities for...
TRANSCRIPT
Policy Research Working Paper 6000
Leading Dragons Phenomenon
New Opportunities for Catch-Up in Low-Income Countries
Vandana ChandraJustin Yifu Lin
Yan Wang
The World BankDevelopment Economics Vice PresidencyPoverty Reduction and Economic Management NetworkWorld Bank InstituteMarch 2012
WPS6000P
ublic
Dis
clos
ure
Aut
horiz
edP
ublic
Dis
clos
ure
Aut
horiz
edP
ublic
Dis
clos
ure
Aut
horiz
edP
ublic
Dis
clos
ure
Aut
horiz
edP
ublic
Dis
clos
ure
Aut
horiz
edP
ublic
Dis
clos
ure
Aut
horiz
edP
ublic
Dis
clos
ure
Aut
horiz
edP
ublic
Dis
clos
ure
Aut
horiz
ed
Produced by the Research Support Team
Abstract
The Policy Research Working Paper Series disseminates the findings of work in progress to encourage the exchange of ideas about development issues. An objective of the series is to get the findings out quickly, even if the presentations are less than fully polished. The papers carry the names of the authors and should be cited accordingly. The findings, interpretations, and conclusions expressed in this paper are entirely those of the authors. They do not necessarily represent the views of the International Bank for Reconstruction and Development/World Bank and its affiliated organizations, or those of the Executive Directors of the World Bank or the governments they represent.
Policy Research Working Paper 6000
Modern economic development is accompanied by the structural transformation from an agrarian to an industrial economy and occurs through a process of continuous industrial and technological upgrading. Since the 18th century, all countries that industrialized successfully in Europe, North America and East Asia followed their comparative advantage and leveraged the late-comer advantage to emulate the leader-follower flying geese pattern of industrial upgrading. The large dynamic emerging market countries such as China, India and Brazil are also engaged in industrial upgrading but with a critical difference. In particular, because of its sheer size, China has absorbed nearly all labor-intensive jobs and become the world’s largest exporter of labor-intensive products. The current view is that China’s dominance hinders poor countries from developing similar industries. The authors argue that industrial upgrading has increased wages and is
This paper is a joint product of Development Economics Vice Presidency, Poverty Reduction and Economic Management Network, and World Bank Institute. It is part of a larger effort by the World Bank to provide open access to its research and make a contribution to development policy discussions around the world. Policy Research Working Papers are also posted on the Web at http://econ.worldbank.org. The authors may be contacted at [email protected], [email protected], and [email protected].
causing China to graduate from labor-intensive to more capital- and technology-intensive industries. These industries will shed labor and create a huge opportunity for lower wage countries to start a phase of labor-intensive industrialization. This process, called the Leading Dragon Phenomenon, offers an unprecedented opportunity to low-income Sub-Saharan Africa where the industrial sector is underdeveloped and investment capital and entrepreneurial skills are leading constraints to manufacturing. It can seize the opportunity and resolve the constraints by attracting some of the OFDI flowing currently from China, India and Brazil into the manufacturing sectors of other developing countries. All low-income countries will compete but to catch the jobs spillover from China, the winner must implement credible economic development strategies that are consistent with its comparative advantage.
Leading Dragons Phenomenon: New Opportunities for Catch-Up
in Low-Income Countries
Vandana Chandra
Justin Yifu Lin
Yan Wang
Keywords: Structural Transformation, China, Africa, flying geese
JEL code: O25
2
Introduction
To reduce poverty and catch-up with the developed countries is a common aspiration of all
developing countries but the pace and pattern of catch up has varied significantly. In the wake of
the industrial revolution, there was a large divergence in the per capita income levels of the rich
countries and the developing countries. The divergence continued in spite of many efforts by
developing countries to catch up with the industrialized developed countries. Only a limited
number of developing countries, mostly in East Asia, realized the dream by the end of 20th
century. Entering into the 21st century, Brazil, China, India and a number of other large
developing countries achieved dynamic growth. For the first time, these large dynamic emerging
market countries have become the drivers of global growth in a new pattern of a multi-polar
world.1
Lin (2011) and Lin and Monga (2011) explore the nature of modern growth and show that a
developing country can achieve dynamic growth for several decades and catch up with the
developed countries by developing industries that are aligned with its comparative advantage as
determined by its endowment structure and exploiting the latecomer advantage in the process of
industrial upgrading. We build on this theme in this paper. We show that because of the
similarity in the comparative advantage of low-income countries and the dynamic emerging
market economies, when the latter upgrade their industrial sectors, they will create a huge space
for low-income countries. The latter can use the opportunity to tap the potential latecomer
advantage to start industrialization and achieve dynamic growth and poverty reduction.
This paper constructs a new paradigm to explain how structural transformation lay at the core of
the catch-up in the Western countries in the 19th
century as well as the catching up of East Asia
in the 20th
century. Moreover, it elucidates how China‘s spectacular structural transformation is
fueling its emergence and contributing to a multi-polar world. In contrast to the common
thinking that China‘s dominance in the global economy dooms poor countries to even more
economic backwardness, China‘s amazing growth spiral may, in fact, be a boon for them. As
China upgrades its labor intensive industries and cedes market shares, it will relocate millions of
labor intensive jobs to poor countries and accelerate their industrialization. The manufacturing
industries China relocates will be compatible with the comparative advantage of low wage
countries, just as it was when rising wages pushed East Asian jobs to China. Which countries
will succeed in harvesting the jobs spillover from China will depend upon how efficiently they
facilitate the entry of domestic private firms and FDI into industries in which they have a
comparative advantage. Similar stories apply to the industrial upgrading of other large emerging
markets such as Brazil, India, Indonesia, etc. To the skeptics who doubt that Sub-Saharan Africa
can seize the opportunity, we point to current trends. Current outward FDI flows from large
emerging market countries, including China, to manufacturing industries in developing countries
can be leveraged to drive industrialization in even the poorest countries where financial capital
1 In the old pattern, the drivers of global growth were developed countries.
3
and entrepreneurial skills are binding constraints. If other emerging market countries such as
Brazil and India follow China‘s growth trajectory, they will create even more labor-intensive
jobs in low-income countries.
Part 1 motivates the analysis by providing a review of the background and structural
transformation in the world. In light of the available evidence, Part 2 examines the experiences
of industrial revolution, the post WWII period, and East Asian successes in catching up. Part 3
first discusses the frustrations or failures in catching up in various countries that followed
protectionist strategies. It then analyzes China‘s meteoric rise in the context of its comparative
advantage following growth strategy. Part 4 investigates the impact of rising labor costs in China
on its employment structure, and the industrial upgrading and job relocation that is happening
and is being facilitated through outward foreign direct investment (OFDI). Part 5 concludes by
exploring the implications of industrialization in currently low-income countries.
Part 1. Structural Transformation and Catch-Up
Section 1.1: Catch-up in a multi-polar world
Sustained and rapid income growth is a modern phenomenon which appeared only after the
Industrial Revolution in the 18th century. Before that time, for a long period, almost all countries
in the world had agrarian economies and were poor relative to today. The income gap among
countries was very small. The richest country‘s per capita income was about five times greater
than the poorest country‘s per capita income (Maddison 2010). From what was an insignificant
difference at the beginning of the 18th century, the Industrial Revolution in England marked the
start of a new era in economic history. In the decades that followed, several other countries
notably the Western European countries, United States, and other Western offshoots were able to
follow in the footsteps of England accelerating growth and catching up with the U.K.
Most other countries failed to do so. As a consequence, there is a great divergence in the income
levels between the developed and developing countries, and between developing countries with
dynamic growth and those trapped in low-income or middle-income status (Lin 2011 and Figure
1.1). By the end of the 20th century, the gap in per capita income between the industrialized
high-income countries and the low-income countries was more than 50 times (Maddison 2010).
4
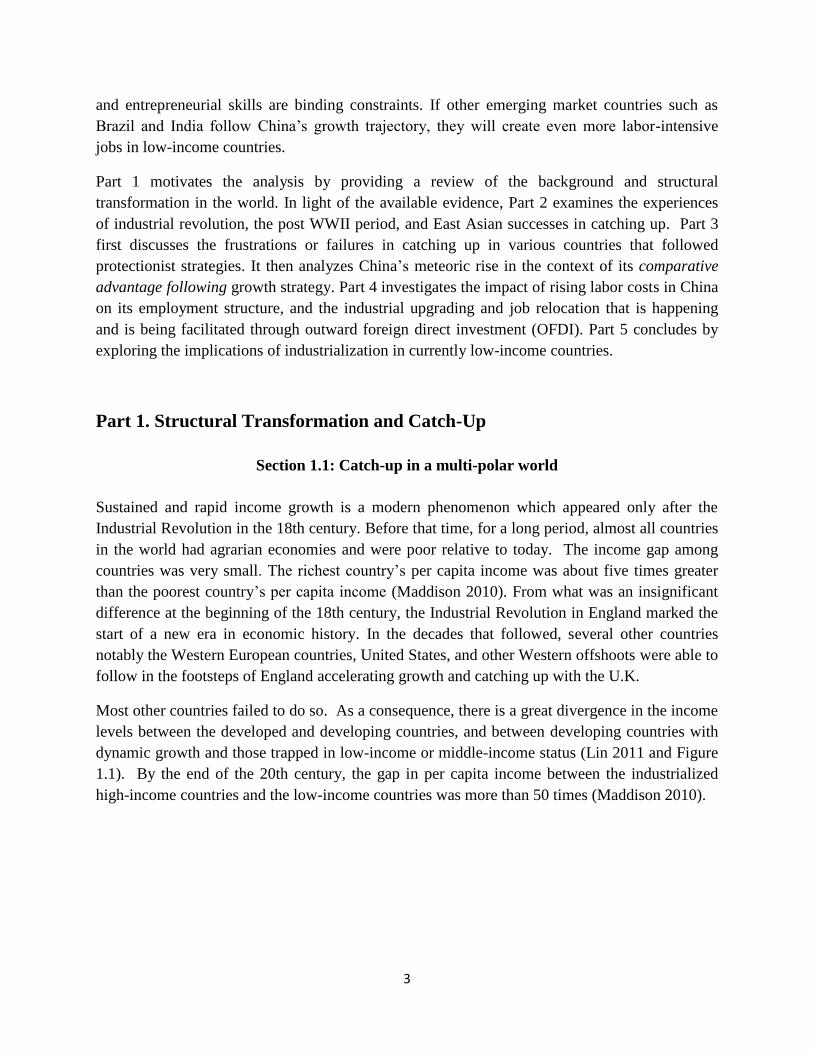
Figure 1.1: Per capita income trends in a multi-polar world
- emergence of Brazil, China and India
Source: Angus Maddison Data Base (http://www.ggdc.net/maddison/)
Among the set of developing countries, most raced to close the income gap with the developed
countries under the leadership of their respective governments and support of international
development agencies in the second half of the twentieth century but only a handful were
successful in transforming their aspirations into reality. Among them were Japan and the East
Asian Tigers (Hong Kong SAR, China; the Republic of Korea; Singapore; and Taiwan, China)
(Figure 1.1).
The growth poles in the past were all high-income countries such as England, US, Japan and
Germany. In the last quarter of the twentieth century this changed and for the first time, large
developing countries such as China, India, and Brazil become growth poles. If the new growth
poles continue to maintain their dynamic growth trends, their industries will upgrade to more
capital intensive ones and leave a large space of labor-intensive industries for other low-income
countries to enter. This paper tries to explore the implication of this new phenomenon for other
developing countries, which still face the daunting challenges of achieving dynamic growth to
reduce poverty.
Multi-polarity and its potential dividends
Since the last quarter of the twentieth century, developing countries have played an increasingly
important role in the global economy lending credence to the idea of multipolar growth being the
new economic paradigm. In the 1980s and 1990s, among the top five contributors to global
$0
$5,000
$10,000
$15,000
$20,000
$25,000
$30,000
$35,000
1950 1965 1970 1975 1980 1985 1990 1995 2000 2005 2008South Korea Brazil China
India United States Japan
Singapore Taiwan SSA-Madagascar
5
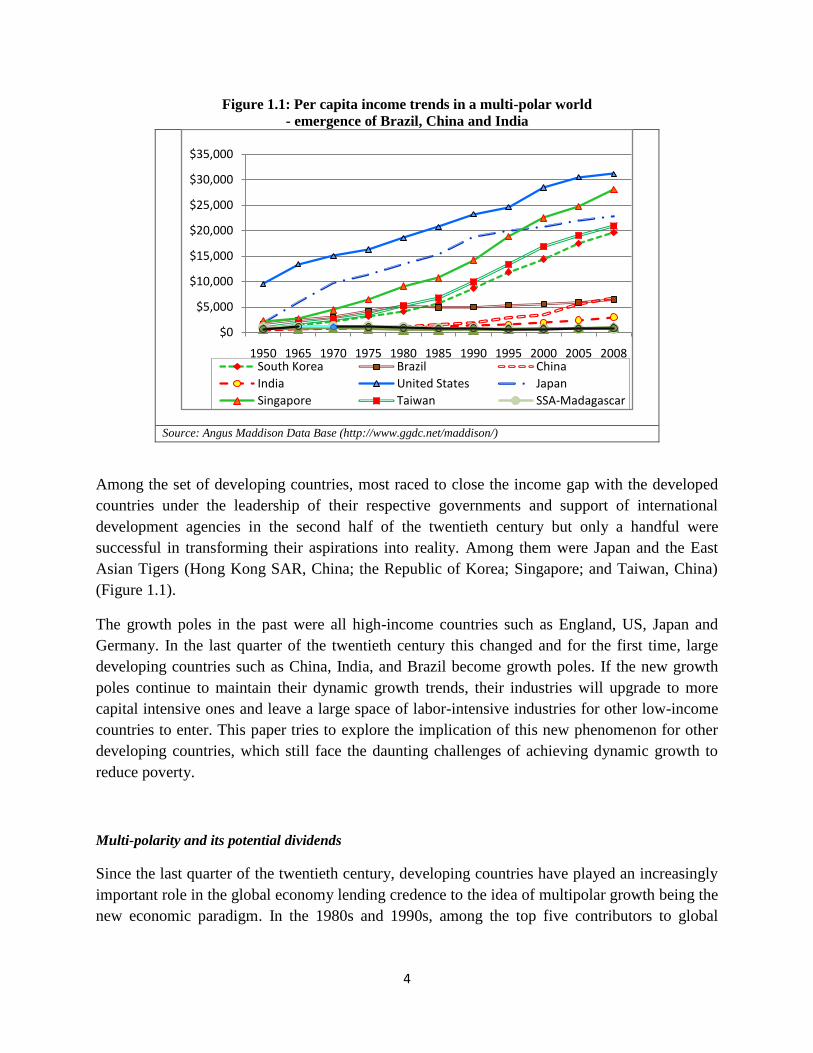
growth, all but China were G7‘s industrial countries. By 2009, all except the United States were
emerging economies—with China as the top contributor (Figure 1.2).
The replacement of G7 by the G20 as the prime economic forum in the world since the eruption
of the global crisis in 2008 has underscored the emergence of a multipolar world. The sheer size
of the large emerging economies combined with dynamic and sustained growth has elevated
Brazil, Russia, India, and China (BRIC) to the largest contributors to economic growth in the
world (Figure 1.2). In 2006-10, almost 45 percent of global GDP was generated in the BRIC.
The era of a multi-polar world is firmly established.
Figure 1.2: The 21st. Century is marked with the emergence of a multipolar world
Source: World Development Indicators, 2012
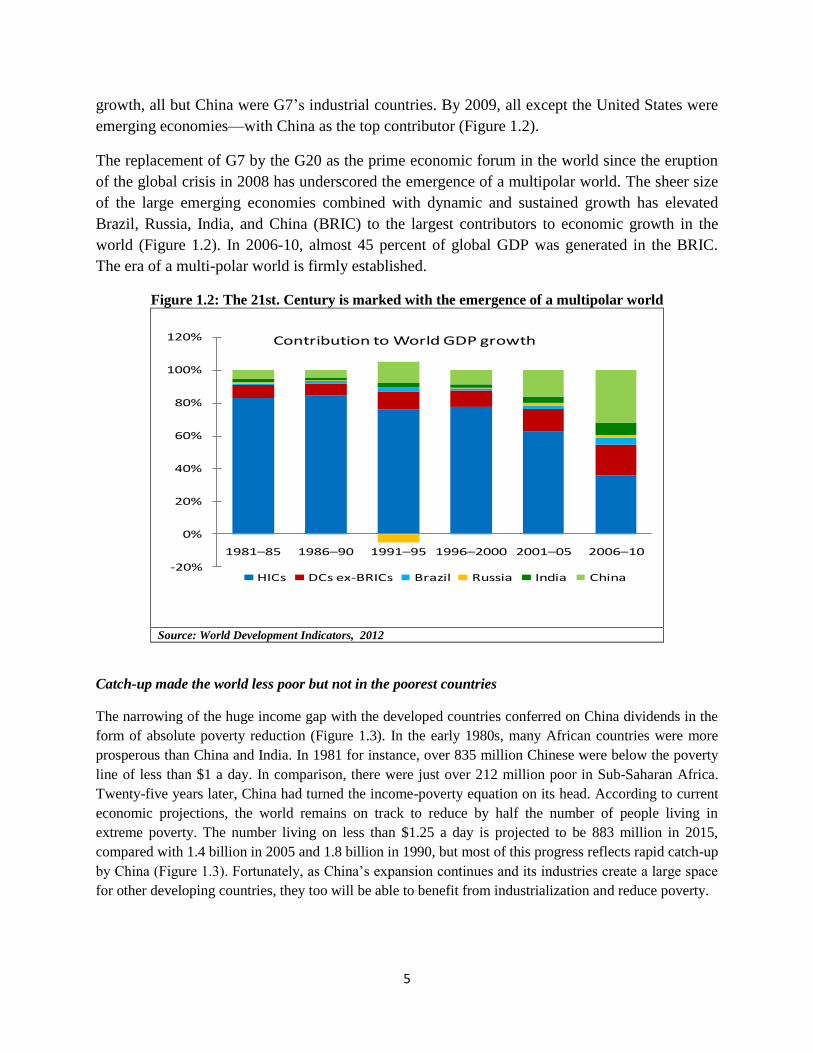
Catch-up made the world less poor but not in the poorest countries
The narrowing of the huge income gap with the developed countries conferred on China dividends in the
form of absolute poverty reduction (Figure 1.3). In the early 1980s, many African countries were more
prosperous than China and India. In 1981 for instance, over 835 million Chinese were below the poverty
line of less than $1 a day. In comparison, there were just over 212 million poor in Sub-Saharan Africa.
Twenty-five years later, China had turned the income-poverty equation on its head. According to current
economic projections, the world remains on track to reduce by half the number of people living in
extreme poverty. The number living on less than $1.25 a day is projected to be 883 million in 2015,
compared with 1.4 billion in 2005 and 1.8 billion in 1990, but most of this progress reflects rapid catch-up
by China (Figure 1.3). Fortunately, as China‘s expansion continues and its industries create a large space
for other developing countries, they too will be able to benefit from industrialization and reduce poverty.
-20%
0%
20%
40%
60%
80%
100%
120%
1981–85 1986–90 1991–95 1996–2000 2001–05 2006–10
Contribution to World GDP growth
HICs DCs ex-BRICs Brazil Russia India China
6
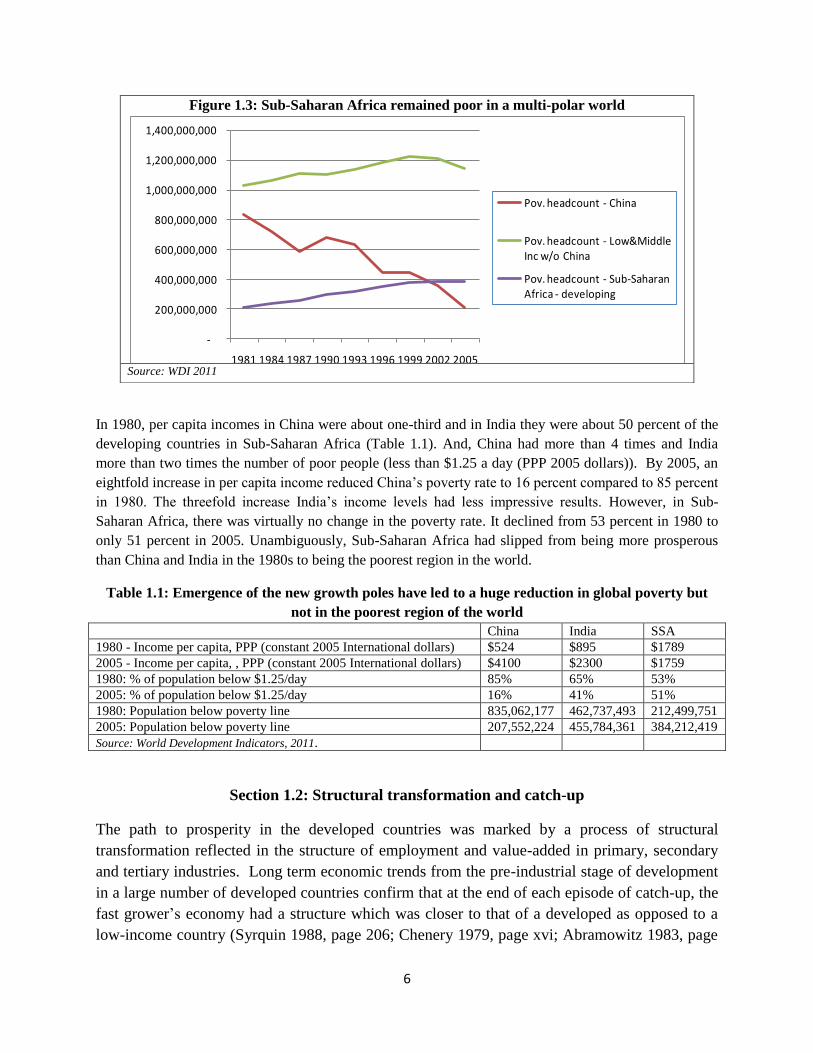
In 1980, per capita incomes in China were about one-third and in India they were about 50 percent of the
developing countries in Sub-Saharan Africa (Table 1.1). And, China had more than 4 times and India
more than two times the number of poor people (less than $1.25 a day (PPP 2005 dollars)). By 2005, an
eightfold increase in per capita income reduced China‘s poverty rate to 16 percent compared to 85 percent
in 1980. The threefold increase India‘s income levels had less impressive results. However, in Sub-
Saharan Africa, there was virtually no change in the poverty rate. It declined from 53 percent in 1980 to
only 51 percent in 2005. Unambiguously, Sub-Saharan Africa had slipped from being more prosperous
than China and India in the 1980s to being the poorest region in the world.
Table 1.1: Emergence of the new growth poles have led to a huge reduction in global poverty but
not in the poorest region of the world
China India SSA
1980 - Income per capita, PPP (constant 2005 International dollars) $524 $895 $1789
2005 - Income per capita, , PPP (constant 2005 International dollars) $4100 $2300 $1759
1980: % of population below $1.25/day 85% 65% 53%
2005: % of population below $1.25/day 16% 41% 51%
1980: Population below poverty line 835,062,177 462,737,493 212,499,751
2005: Population below poverty line 207,552,224 455,784,361 384,212,419
Source: World Development Indicators, 2011.
Section 1.2: Structural transformation and catch-up
The path to prosperity in the developed countries was marked by a process of structural
transformation reflected in the structure of employment and value-added in primary, secondary
and tertiary industries. Long term economic trends from the pre-industrial stage of development
in a large number of developed countries confirm that at the end of each episode of catch-up, the
fast grower‘s economy had a structure which was closer to that of a developed as opposed to a
low-income country (Syrquin 1988, page 206; Chenery 1979, page xvi; Abramowitz 1983, page
Figure 1.3: Sub-Saharan Africa remained poor in a multi-polar world
Source: WDI 2011
-
200,000,000
400,000,000
600,000,000
800,000,000
1,000,000,000
1,200,000,000
1,400,000,000
1981 1984 1987 1990 1993 1996 1999 2002 2005
Pov. headcount - China
Pov. headcount - Low&Middle Inc w/o China
Pov. headcount - Sub-Saharan Africa - developing
7
85; Lin 2009, 2010 and 2011). Kuznets (1966) identified these trends as the four stylized facts
of modern economic growth.
According to the first Kuznets‘s fact, structural transformation occurs when the share of the
nonagricultural sectors in an economy increases. A reconstruction of national accounts from a
variety of sources for Western countries shows that such a transformation raised overall
productivity and increased the returns to workers and capital. Between 1800-1849 and 1951-
1960 for example, as a share of GDP, agriculture declined from 30 to only 5 percent in the U.K.,
and from 20 to 4 percent in the U.S. And, the share of industry inclusive of manufacturing
increased from 23 to 56 percent in the U.K. and from 33 to 43 percent in the U.S. (Kuznets,
1966, Table 3.1). As industrialization progressed, the predominance of manufacturing was
replaced by the services sector.
A similar pattern of structural transformation also evolved in the East Asian Tigers (South
Korea; Singapore; Hong Kong SAR, China; and Taiwan, China) in the 1960s and 1970s, and the
new growth poles – Brazil, China and India starting in the 1980s. Between 1965 and 2009, as a
share of GDP, agriculture value-added decreased from 39 to 3 percent, while manufacturing
increased from 14 to 28 percent in South Korea. Similar transformation occurred in China, the
share of agriculture value added in GDP declined from 38 to 10 percent and manufacturing
increased from 29 to 34 percent in the same period. In comparison, the slow pace of structural
transformation in Sub-Saharan Africa explains why it lags more prosperous countries by such a
huge margin (Table 1.2). In Ghana for example, between 1965 and 2009, as a share of GDP,
agriculture value-added decreased from 50 to 32 percent, but the transformation was not in favor
of manufacturing which also decreased from 11 to 7 percent. In Tanzania, between 1990 and
2006, the share of agriculture decreased slightly from 46 to 45 percent and of manufacturing
declined from 9 to 7 percent (World Development Indicators, 2011). These patterns also
corroborate the empirical analysis by McMillan and Rodrik and are elaborated in Lin and Lin
and Monga (2011).
Trends in the allocation of labor usually reflect value addition at the sector level as also noted by
Kuznets. In the developed countries, in the aftermath of the Industrial Revolution as the share of
manufacturing increased, labor moved from agriculture to manufacturing to support growth in
the latter. This pattern continued until the 1960s when rising wages in manufacturing dampened
the sector‘s growth and created space for the service sectors. Today, the predominance of
services is notable in all Western countries (Figure 1.4).
8
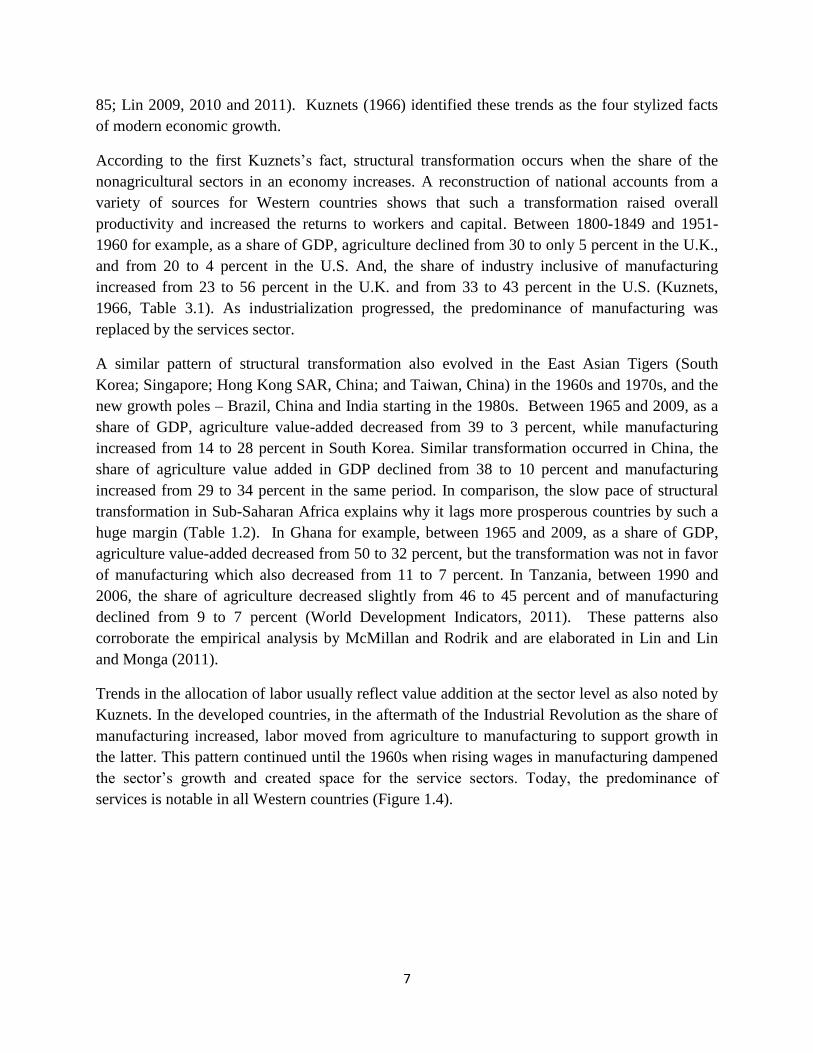
Table 1.2: Lack of Structural Transformation in Africa
Value Added by Sector, 1960-2009
1960 1970 1980 1990 2000 2005 2009
Ghana Agriculture
54 60 45 39 41 32
Manufacturing
13 8 10 10 9 7
Industry
8 4 7 18 18 12
Services
25 28 38 32 32 49
Kenya Agriculture 38 33 33 30 32 27 23
Manufacturing 9 12 13 12 12 12 9
Industry 9 8 8 7 5 7 7
Services 44 47 47 51 51 54 62
South
Africa Agriculture 11 7 6 5 3 3 3
Manufacturing 20 23 22 24 19 18 15
Industry 18 15 27 16 13 13 16
Services 51 55 45 55 65 66 66
Tanzania Agriculture
46 33 32 29
Manufacturing
9 9 9 10
Industry
8 10 14 15
Services
36 47 46 47
Note: Industry is the sum of mining, construction, electricity, water, and gas.
Source: World Development Indicators, 2011
Figure 1.4: Structural transformation in the developed countries: a reallocation of labor from
agriculture to manufacturing industries
Source: S.Kuznets: Modern Economic Growth - Rate, Structure and Spread, Yale University, 1966. New Haven and London, table 3.2
Countries that caught up with the Western countries in the post-World War II period also
experienced a reallocation of labor from agriculture to industry. By the end of the 1980s, in
0
10
20
30
40
50
60
1871 1910 1930 1950 1990Sh
are
of
agri
cult
ura
l em
plo
ym
ent
in t
ota
l em
plo
ym
ent
(%)
US UK Germany
10
15
20
25
30
35
40
1871 1910 1930 1950 1990
Sh
are
of
man
ufa
ctu
rin
g
emp
loym
ent
in t
ota
l em
plo
ym
ent
(%)
US UK Germany
9
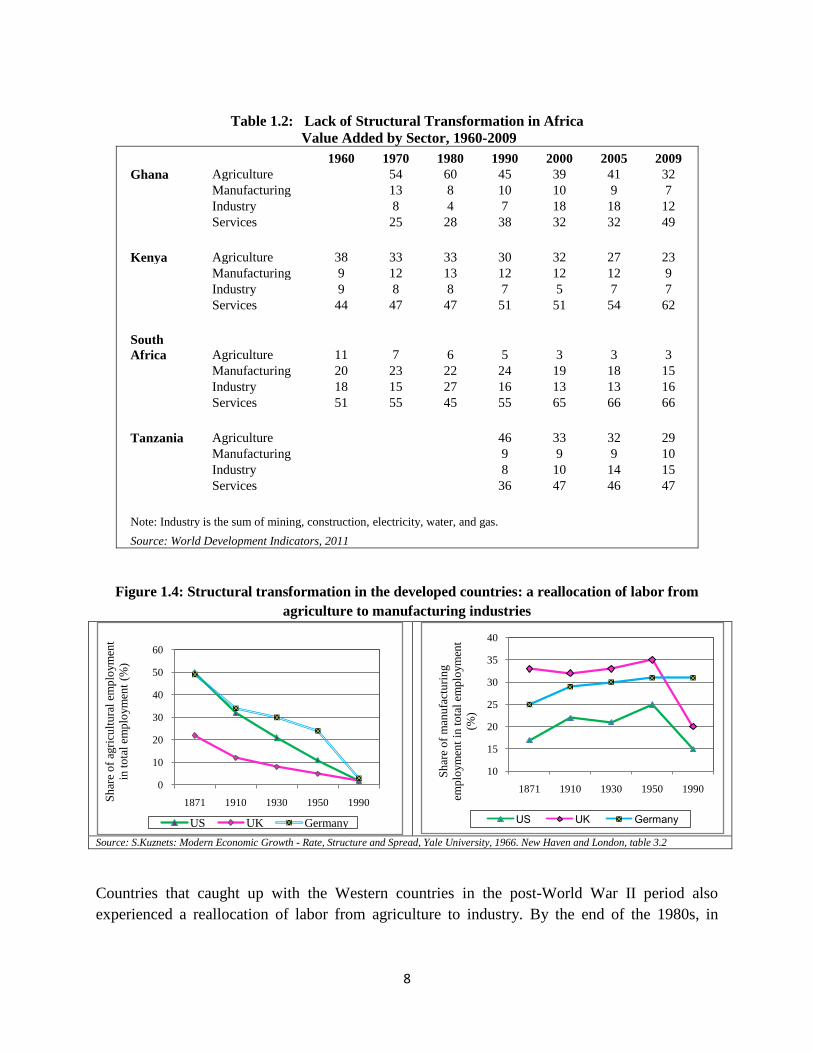
Japan and the Asian Tiger countries, the share of employment in agriculture was near negligible
and the dominance of manufacturing had been replaced by service industries.
In China and India, a reallocation of labor from agriculture to manufacturing is ongoing. The
crux of the impressive decline in Chinese poverty rates lies in the absorption of large pools of
relatively unskilled agricultural workers first in light and then more sophisticated manufacturing
industries. In India, the pick-up in manufacturing employment has been slower than in China.
Thus far, agricultural labor has been absorbed more by services than manufacturing industries
(Figure 1.5).
At least two characteristics make the structural transformation of the Chinese and Indian
economies remarkable. First, it is unfolding in a fiercely competitive globalized world where
the competitive edge of firms in manufacturing and services is dependent upon wage levels,
and the firms‘ ability to exploit the latecomer advantage by adapting modern technologies
innovated by the developed countries. And second, given that the proportion of the labor force
engaged in agriculture was as high as 80 percent until the 1960s, the speed of their
transformation from agrarian to modern economies is significantly more impressive than richer
countries. Both characteristics provide useful pointers for other low-income countries.
Figure 1.5: Structural transformation in successful developing countries:
reallocation of labor from agriculture to manufacturing
Note: After 2002. The employment statistics for China is not comparable with earlier years because the NBS stopped publishing
data for rural employment.
Source: ILO,UNIDO and UNCTAD
In general, the factors that powered structural transformation in the Western, East Asian and
emerging market countries have been elusive in Sub-Saharan Africa (excluding South Africa),
and suggest that there are no shortcuts to catching up (Figure 1.6). As an example, with the
0%
10%
20%
30%
40%
50%
60%
70%
80%
90%
AS
ha
re o
f a
gri
cu
ltu
ral e
mp
loym
en
t in
to
tal
em
plo
ym
en
t (%
)
Japan India South KoreaSingapore Taiwan, China China
0%
5%
10%
15%
20%
25%
30%
35%
1870 1890 1910 1930 1950 1970 1990Shar
e of
Man
ufac
turi
ng e
mpl
oym
ent
in t
otal
em
ploy
men
t
India South Korea Singapore
Taiwan, China China Japan
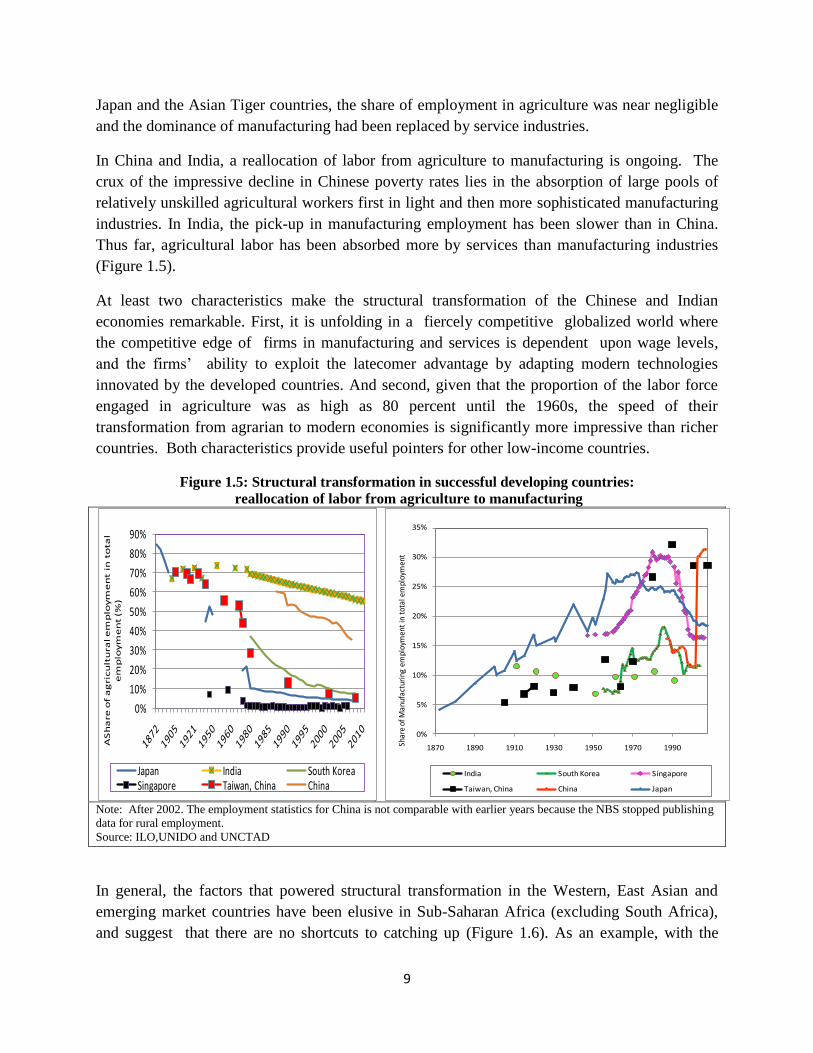
10
exception of Mauritius, Botswana and Lesotho, while all six countries displayed in Figure 1.6
had a consistently declined trend in the share of labor employed in the agriculture, the share was
still over 70 percent in 2010. When this evidence is combined with the trend in manufacturing,
including in Mauritius, Botswana and Lesotho, the absence of structural transformation is
striking.
Figure 1.6: Still to catch – stalling structural transformation in select African countries: trends in
the share of employment in agriculture and manufacturing
Source: Constructed from UNCTAD, UNIDO and ILO
To some, economic growth rates of over 6 – 9 percent in many mineral-rich Sub-Saharan African
countries in the decade preceding the current financial crisis seem to suggest that structural
transformation is not necessary for catch-up. This contention is erroneous. Typically, agricultural
workers earn only subsistence wages and are the poorest. If the share of agricultural employment
is any indicator, then the case for structural transformation seems the strongest for resource-rich
countries where the predominance of mining stymies the shift of labor from agriculture to
manufacturing and services. As an example, until 2000, in the copper-dominated Zambian
economy, only 28 percent of the labor force was employed in industry and services; the
remaining 72 percent was in agriculture. In the minerals and cocoa-dominated Ghanaian
economy, in 1990, the share of employment in manufacturing was merely 9 percent; in 2009, it
had declined to 8 percent (UNSTAT 2011). Although data limitations do not permit better
comparisons, it is clear that the agricultural sector continues to host an overwhelming majority of
the labor force in resource-rich Sub-Saharan African countries.
In what is often termed the third Kuznets‘s fact, structural transformation is characterized by a
redistribution of the population from rural to urban areas during. Growth in both manufacturing
and services, which are invariably in urban locations, leads to a decline in the share of the rural
0%
10%
20%
30%
40%
50%
60%
70%
80%
90%
100%
1980 1985 1990 1995 2000 2005 2010
Sh
are
of
ag
ricu
ltu
ral e
mp
loym
en
t in
to
tal
(%)
Share of Agricultural Employment in Total Employment (%)
Botswana Ethiopia Kenya
Lesotho Madagascar Malawi
Mauritius Uganda Tanzania
0%
5%
10%
15%
20%
25%
0%
2%
4%
6%
8%
10%
12%
14%
1999 2000 2001 2002 2003 2004 2005 2006 2007
Sh
are
of M
an
uf E
mp
in T
ota
l = M
au
riti
us
(%)
Shar
e o
f Man
ufa
ctu
rin
g Em
ploy
men
t in
To
tal (
%)
Share of Manufacturing Employment In Total Employment
(%)
Botswana Ethiopia KenyaLesotho Madagascar MalawiUganda Tanzania Mauritius
11
population. Global settlement patterns show that with the exception of the Western countries,
this phenomeon has been slow to emerge in most other countries. In most developing countries,
until the 1960s, at least 70 percent of the population resided in the rural areas. By the 1990s, in
Brazil, Russia and the Asian Tigers, the share of the rural population had declined to about 30
percent. However, as late as 2010, at 70 percent in India, it indicated the enormous challenges to
structural transformation when the industrial sectors are not competitive.
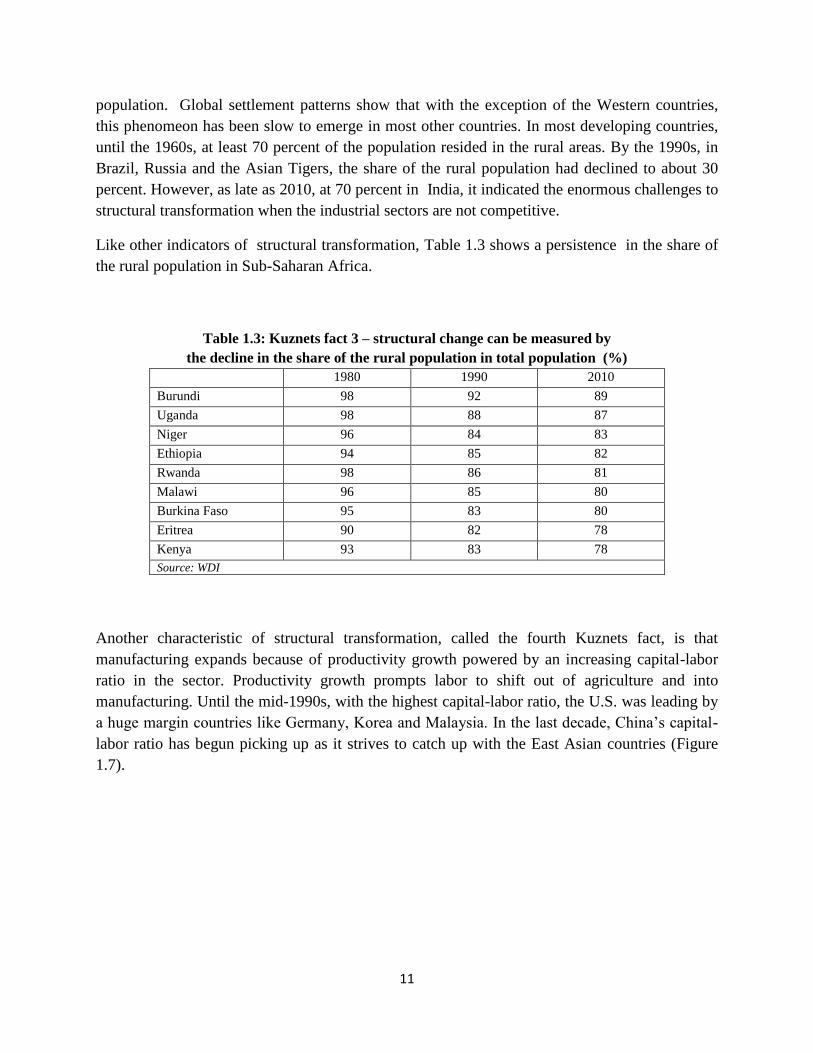
Like other indicators of structural transformation, Table 1.3 shows a persistence in the share of
the rural population in Sub-Saharan Africa.
Table 1.3: Kuznets fact 3 – structural change can be measured by
the decline in the share of the rural population in total population (%)
1980 1990 2010
Burundi 98 92 89
Uganda 98 88 87
Niger 96 84 83
Ethiopia 94 85 82
Rwanda 98 86 81
Malawi 96 85 80
Burkina Faso 95 83 80
Eritrea 90 82 78
Kenya 93 83 78
Source: WDI
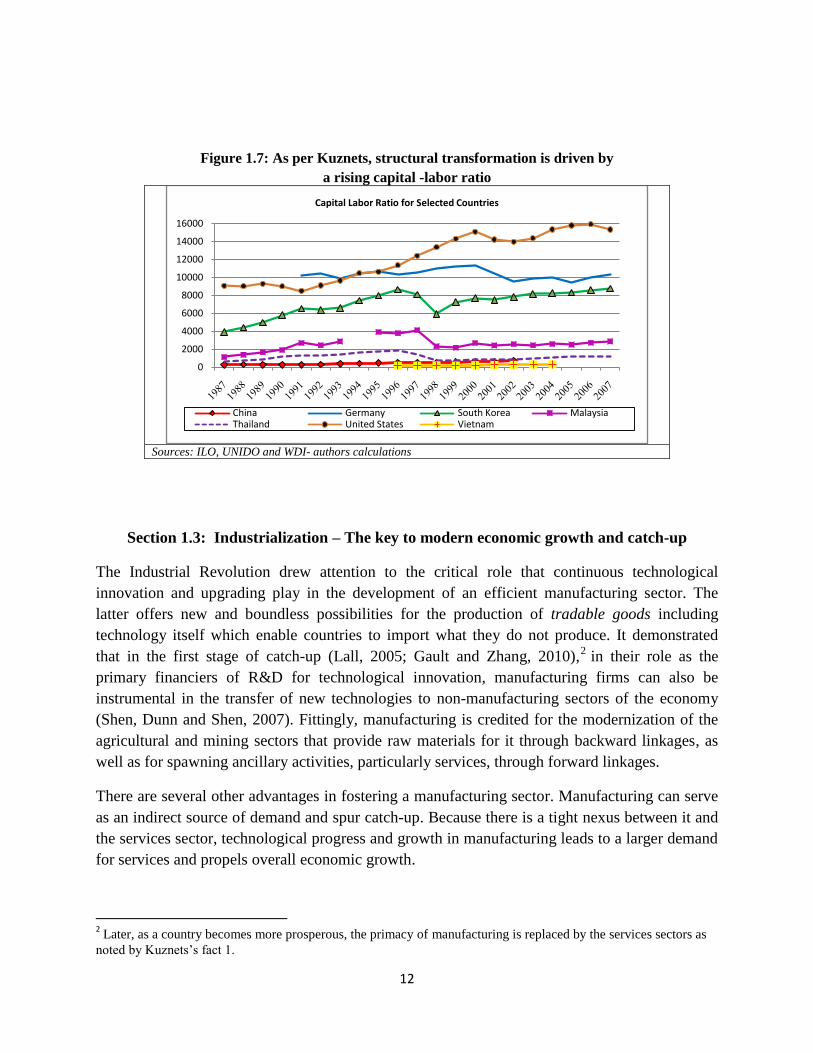
Another characteristic of structural transformation, called the fourth Kuznets fact, is that
manufacturing expands because of productivity growth powered by an increasing capital-labor
ratio in the sector. Productivity growth prompts labor to shift out of agriculture and into
manufacturing. Until the mid-1990s, with the highest capital-labor ratio, the U.S. was leading by
a huge margin countries like Germany, Korea and Malaysia. In the last decade, China‘s capital-
labor ratio has begun picking up as it strives to catch up with the East Asian countries (Figure
1.7).
12
Figure 1.7: As per Kuznets, structural transformation is driven by
a rising capital -labor ratio
Sources: ILO, UNIDO and WDI- authors calculations
Section 1.3: Industrialization – The key to modern economic growth and catch-up
The Industrial Revolution drew attention to the critical role that continuous technological
innovation and upgrading play in the development of an efficient manufacturing sector. The
latter offers new and boundless possibilities for the production of tradable goods including
technology itself which enable countries to import what they do not produce. It demonstrated
that in the first stage of catch-up (Lall, 2005; Gault and Zhang, 2010),2 in their role as the
primary financiers of R&D for technological innovation, manufacturing firms can also be
instrumental in the transfer of new technologies to non-manufacturing sectors of the economy
(Shen, Dunn and Shen, 2007). Fittingly, manufacturing is credited for the modernization of the
agricultural and mining sectors that provide raw materials for it through backward linkages, as
well as for spawning ancillary activities, particularly services, through forward linkages.
There are several other advantages in fostering a manufacturing sector. Manufacturing can serve
as an indirect source of demand and spur catch-up. Because there is a tight nexus between it and
the services sector, technological progress and growth in manufacturing leads to a larger demand
for services and propels overall economic growth.
2 Later, as a country becomes more prosperous, the primacy of manufacturing is replaced by the services sectors as
noted by Kuznets‘s fact 1.
0
2000
4000
6000
8000
10000
12000
14000
16000
Capital Labor Ratio for Selected Countries
China Germany South Korea MalaysiaThailand United States Vietnam
13
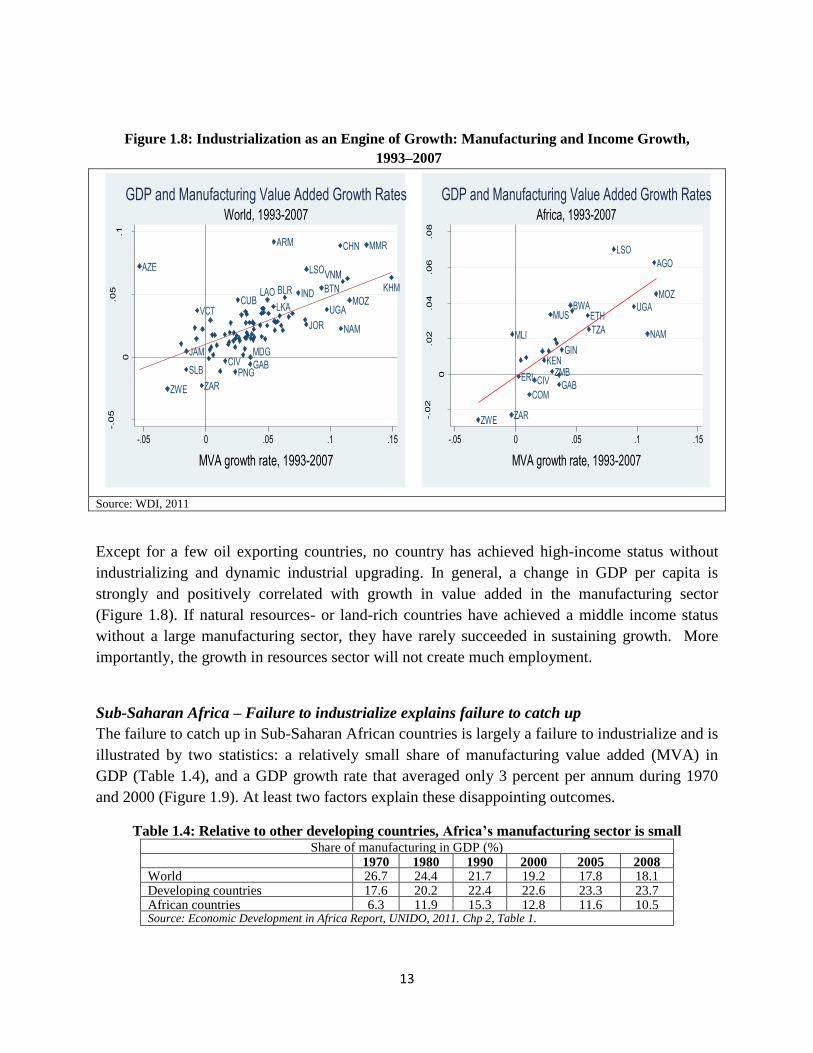
Figure 1.8: Industrialization as an Engine of Growth: Manufacturing and Income Growth,
1993–2007
Source: WDI, 2011
Except for a few oil exporting countries, no country has achieved high-income status without
industrializing and dynamic industrial upgrading. In general, a change in GDP per capita is
strongly and positively correlated with growth in value added in the manufacturing sector
(Figure 1.8). If natural resources- or land-rich countries have achieved a middle income status
without a large manufacturing sector, they have rarely succeeded in sustaining growth. More
importantly, the growth in resources sector will not create much employment.
Sub-Saharan Africa – Failure to industrialize explains failure to catch up
The failure to catch up in Sub-Saharan African countries is largely a failure to industrialize and is
illustrated by two statistics: a relatively small share of manufacturing value added (MVA) in
GDP (Table 1.4), and a GDP growth rate that averaged only 3 percent per annum during 1970
and 2000 (Figure 1.9). At least two factors explain these disappointing outcomes.
Table 1.4: Relative to other developing countries, Africa’s manufacturing sector is small Share of manufacturing in GDP (%)
1970 1980 1990 2000 2005 2008 World 26.7 24.4 21.7 19.2 17.8 18.1 Developing countries 17.6 20.2 22.4 22.6 23.3 23.7 African countries 6.3 11.9 15.3 12.8 11.6 10.5 Source: Economic Development in Africa Report, UNIDO, 2011. Chp 2, Table 1.
ARM
AZE
BLR BTN
CHN
CIV
CUB
GAB
IND
JAM
JOR
KHMLAOLKA
LSO
MDG
MMR
MOZ
NAM
PNGSLB
UGAVCT
VNM
ZARZWE
-.05
0
.05
.1
GD
P p
er
ca
pita
, ch
an
ge
19
93
-20
07
-.05 0 .05 .1 .15
MVA growth rate, 1993-2007
World, 1993-2007GDP and Manufacturing Value Added Growth Rates
AGO
BWA
CIVCOM
ERI
ETH
GAB
GINKEN
LSO
MLI
MOZ
MUS
NAMTZA
UGA
ZAR
ZMB
ZWE-.02
0
.02
.04
.06
.08
GD
P p
er
ca
pita
, ch
an
ge
19
93
-20
07
-.05 0 .05 .1 .15
MVA growth rate, 1993-2007
Africa, 1993-2007GDP and Manufacturing Value Added Growth Rates
14
First, most African countries failed to develop manufacturing industries. In 1970, the share of
manufacturing in Africa‘s GDP was only 6 percent. In the two decades that followed, African
governments employed state-owned enterprises and import substitution policies to expand the
manufacturing sector. Although the share of MVA in GDP increased to 15 percent by 1990, it
could not be sustained primarily because protectionism favored industries that were ‗comparative
advantage defying‘ (CAD). The reforms of the late 1990s fostered liberalization, privatization of
public enterprises and competition which led private firms to naturally engage in resource-
intensive sectors in which Africa had a comparative advantage. Consequently, by 2008, the share
of manufacturing in GDP had shrunk to about 10 percent and was, relative to 1990, a sign of de-
industrialization.3
In comparison to Sub-Saharan Africa, manufacturing was the source of Asian industrialization
mirrored earlier in the East Asian miracle and more recently by the emergence of China as the
second largest global power. In Asia, the share of MVA in GDP increased from 22 percent in
2000 to 35 percent in 2008.
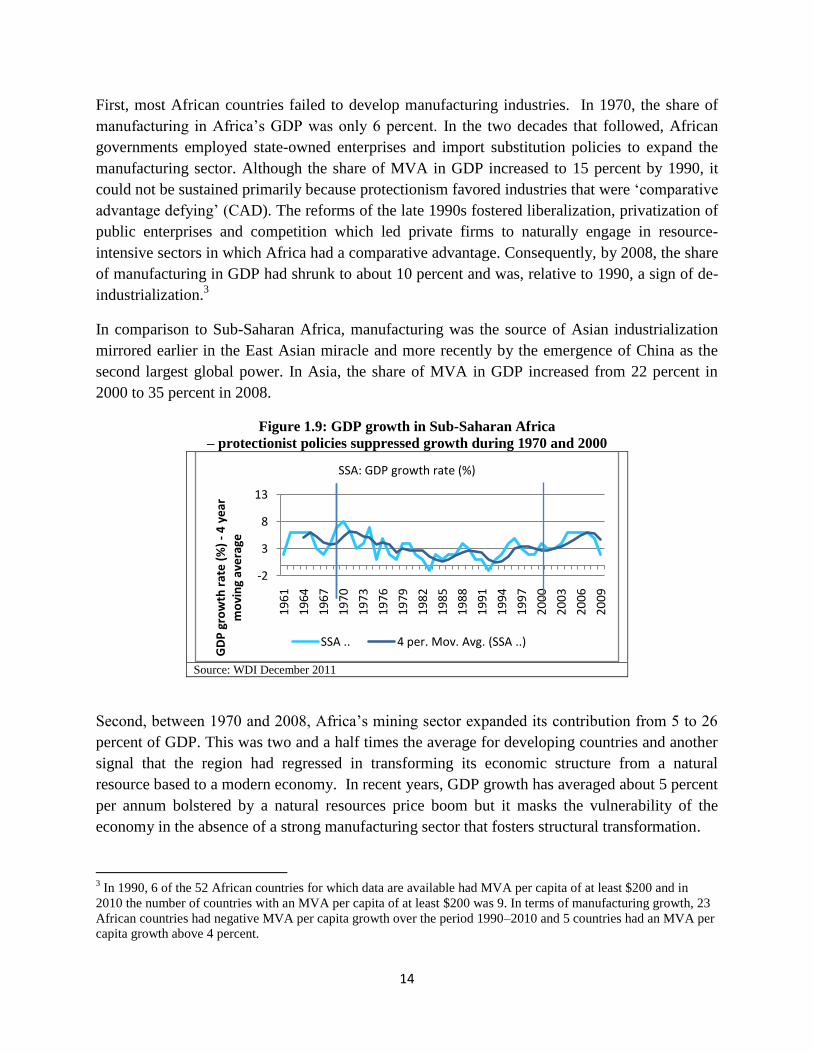
Figure 1.9: GDP growth in Sub-Saharan Africa
– protectionist policies suppressed growth during 1970 and 2000
Source: WDI December 2011
Second, between 1970 and 2008, Africa‘s mining sector expanded its contribution from 5 to 26
percent of GDP. This was two and a half times the average for developing countries and another
signal that the region had regressed in transforming its economic structure from a natural
resource based to a modern economy. In recent years, GDP growth has averaged about 5 percent
per annum bolstered by a natural resources price boom but it masks the vulnerability of the
economy in the absence of a strong manufacturing sector that fosters structural transformation.
3 In 1990, 6 of the 52 African countries for which data are available had MVA per capita of at least $200 and in
2010 the number of countries with an MVA per capita of at least $200 was 9. In terms of manufacturing growth, 23
African countries had negative MVA per capita growth over the period 1990–2010 and 5 countries had an MVA per
capita growth above 4 percent.
-2
3
8
13
19
61
19
64
19
67
19
70
19
73
19
76
19
79
19
82
19
85
19
88
19
91
19
94
19
97
20
00
20
03
20
06
20
09
GD
P g
row
th r
ate
(%
) -
4 y
ear
m
ovi
ng
ave
rage
SSA: GDP growth rate (%)
SSA .. 4 per. Mov. Avg. (SSA ..)
15
Part 2: Industrialization, the Flying Geese Pattern and Catching up in a
Historical Perspective
History shows that following comparative advantage to tap the late-comer advantage is the best
way for developing countries to start and sustain a dynamic growth path for diversification and
industrialization (Lin 2009a, Lin and Monga 2010). The spread of industrialization in Western
Europe in the 19th
century, rapid catch-up in the post WWII period, and the East Asian miracle in
the 1980-2000 are all reminiscent of the flying geese pattern.
In the 1930s, economists researching ―catch-up growth models‖ argued that catch-up was not
random- Kuznets and Akamatsu explored the conditions under which the industrial revolution
occurred in Great Britain, and how it spread only to those countries with sufficient accumulation
of capital, skilled labor and other conditions. Why was Great Britain overtaken by some of the
late-comers but not by others? Simon Kuznets observed that
―Some nations seem to have led the world at one time, others at another. Some industries were
developing most rapidly at the beginning of the century, others at the end. ….Great Britain has
relinquished the lead in the world economy. She has been overtaken by rapidly developing
Germany and the United States. The textile industries … ceded first place to pig iron, then to
steel,‖ (Kuznets 1930 pp. 3-4)4 …while, in turn, the electrical industries assumed the leadership
in the 1980s and 1990s.
The focus on structural transformation, industrial upgrading (Rostow 1960, 1990) and cross-
country catch-up (Gerschenkron 1962) is to be found in Akamatsu‘s work on Japan, a country
starting from a much lower level of income than the Western European countries. In a seminal
paper in the 1930s Akamatsu documented what he called the ―wild-geese-flying pattern‖ in
economic development,5 and noted that ―Wild geese fly in orderly ranks forming an inverse V,
just as airplanes fly in formation‖.6
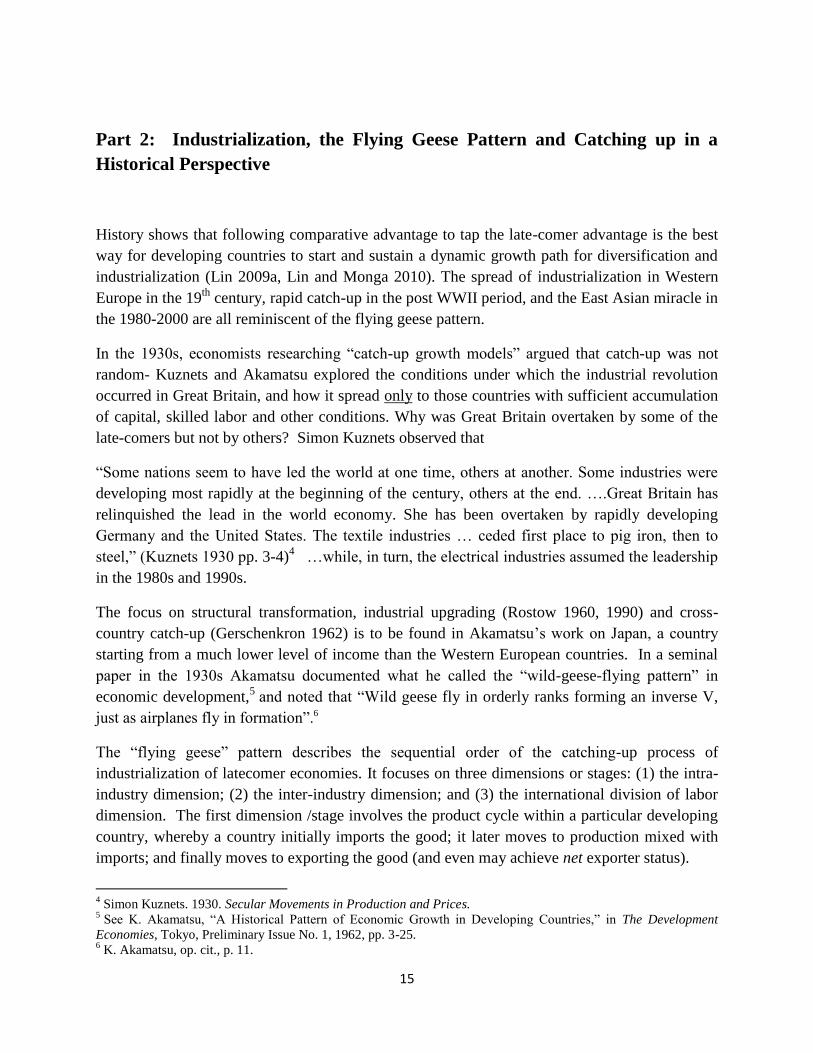
The ―flying geese‖ pattern describes the sequential order of the catching-up process of
industrialization of latecomer economies. It focuses on three dimensions or stages: (1) the intra-
industry dimension; (2) the inter-industry dimension; and (3) the international division of labor
dimension. The first dimension /stage involves the product cycle within a particular developing
country, whereby a country initially imports the good; it later moves to production mixed with
imports; and finally moves to exporting the good (and even may achieve net exporter status).
4 Simon Kuznets. 1930. Secular Movements in Production and Prices.
5 See K. Akamatsu, ―A Historical Pattern of Economic Growth in Developing Countries,‖ in The Development
Economies, Tokyo, Preliminary Issue No. 1, 1962, pp. 3-25. 6 K. Akamatsu, op. cit., p. 11.
16
Figure 2.1: The International Dimensions:
Asian Wild-Geese Flying Pattern
Source: GRIPS, http://www.grips.ac.jp/module/prsp/FGeese.htm
The second dimension /stage involves the sequential appearance and development of industries
in a particular developing country, with industries being diversified and upgraded from consumer
goods to capital goods and/or from simple to more sophisticated products. The third element
/stage involves the process of relocation of industries across countries, from advanced to
developing countries during the latter's process of convergence. A prominent feature in this stage
is that exports of consumer goods start declining and capital goods start being exported. In this
stage a group of economies advance together through emulation and learning-by-doing.
The second and third dimensions, the focus of this paper, are illustrated in Figure 2.1.
Akamatsu only described the flying geese pattern without linking it to a country‘s endowment
structure and comparative advantage. He did not recognize that the market mechanism is a
necessary condition for a country to follow its comparative advantage successfully. However, he
noted that the accumulation of capital, technological adaptability of people and government's
protection policy to promote the consumer goods industries matter for the flying geese pattern
(Akamatsu 1962, page 13).
There is a fundamental difference between the traditional Structuralist views and the New
Structural Economics (NSE). The NSE contends that the flying geese model can be used by
latecomers to catch up successfully only if the latecomers follow the comparative advantage of
17
their country to move up the value chain when its endowment structure upgrades. This is called
the ―comparative advantage following‖ or CAF approach. In other words, with the CAF, the
latecomers can follow the lead goose whose income levels and endowment structure are not too
far apart, and can tap into the latecomer‘s comparative advantage and reduce their risk and cost
of innovation. As long as the industrialization is CAF, there is no need for government to adopt
protectionist policies as the firms are able to withstand market competition. Rather the
government‘s role is limited to facilitate the firms‘ entry into new industries where the country
has latent comparative advantage by overcoming the externalities and coordination issues
inherent in the industrial upgrading and diversification process.7
Section 2.1 The spread of industrial revolution: Leaders and late comers
The Industrial Revolution started in Great Britain in the 1730-1780s, although at that time,
Belgium and Netherland were more industrialized than Britain.8 And for about 50 years it did not
spread because the British government forbade the export of machinery, manufacturing
techniques, and skilled workers to other countries. Eventually in the 19th
century, it gradually
spread to other countries in Western Europe, the United States, Russia, and Japan. The earliest
center of industrial production in continental Europe was Belgium, where the production of coal,
iron, textile, glass, and armaments flourished. By 1830 French firms had employed many skilled
British workers to help establish the textile industry, and railroad lines began to appear across
Western Europe. Germany was a latecomer in developing industry, mainly because no
centralized government existed there.
The first steam locomotive was invented in Britain in 1804, but other European countries did not
start railroad building until the 1830s. Germany for example, produced its first locomotive in
1835 but railway construction lagged for the lack of an integrated central government. After the
1840s, German coal and iron production skyrocketed, and by the 1850s construction began on a
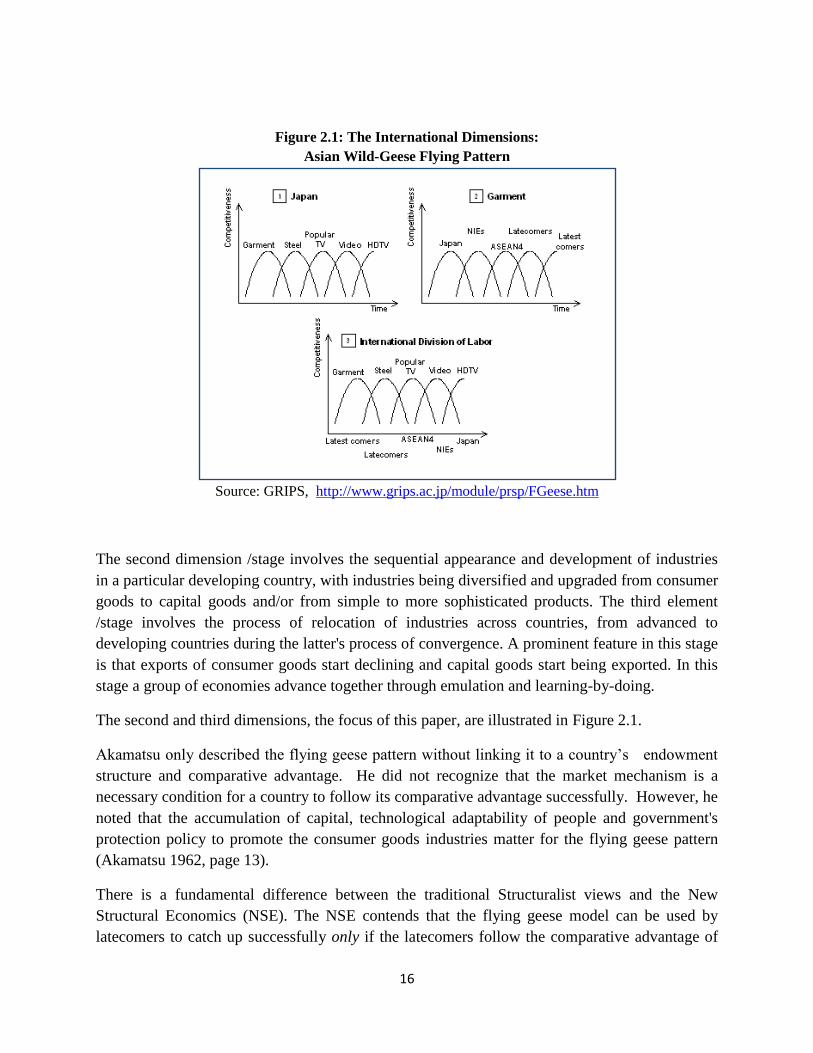
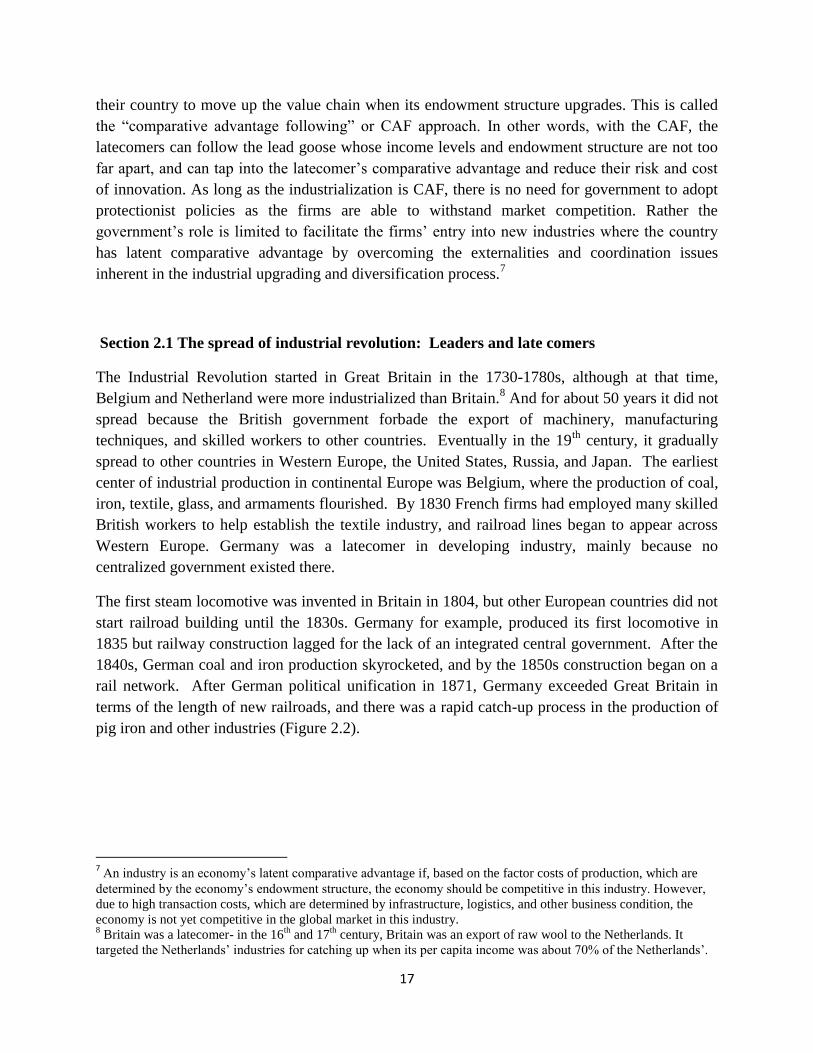
rail network. After German political unification in 1871, Germany exceeded Great Britain in
terms of the length of new railroads, and there was a rapid catch-up process in the production of
pig iron and other industries (Figure 2.2).
7 An industry is an economy‘s latent comparative advantage if, based on the factor costs of production, which are
determined by the economy‘s endowment structure, the economy should be competitive in this industry. However,
due to high transaction costs, which are determined by infrastructure, logistics, and other business condition, the
economy is not yet competitive in the global market in this industry. 8 Britain was a latecomer- in the 16
th and 17
th century, Britain was an export of raw wool to the Netherlands. It
targeted the Netherlands‘ industries for catching up when its per capita income was about 70% of the Netherlands‘.
18
Figure 2.2 Spread of the Industrial Revolution: Late Comers Catching Up
(1800-1914)
Length of Railroad Lines open in kilometers (1km=5/8 mile)
Source: Compilation based on the statistical appendices in the Fontana Economic History of
Europe Vol 4, accessible on the web, Modern History Sourcebook.
Relative to the Britain, industrialization was delayed in the United States because the country
lacked the basic factor endowments, labor and capital to invest in business. When it finally began
in the 1820s after the country had enough capital and labor, relative to continental Europe, its
growth was ―explosive.‖ Both laborers and capital came from Europe where political revolutions
sent immigrants to the U.S. The first locomotive emerged in 1826, the first railroad started in
1827, and the length of railroad surpassed Britain in 1850, reaching 9,021 miles; and then
expanding rapidly to the west in 1890, reaching 129,774 miles,9 longer than the length of
railroads in the entire continental Europe. Rapid industrialization and structural transformation
then followed. In 1800, 85 percent of the US population was comprised of farmers, but in 1860
this had declined to 50 percent.
Gerschenkron observed that rapid industrialization could start from vastly different levels of
―economic backwardness‖. In fact, ―the more backward a country‘s economy, the greater was the
part played by special institutional factors (government agencies, banks) designed to increase the
supply of capital to the nascent industries,‖ (Gerschenkron 1962, p. 354). Like Akamatsu, a
weakness of Gerschenkron‘s theory is that he did not stress that for the latecomer to be
competitive, the latecomer must identify industries that are consistent with its comparative
9 Source: Chauncey Depew (ed.), One Hundred Years of American Commerce 1795-1895 p 111.
0
10000
20000
30000
40000
50000
60000
1830 1840 1850 1860 1870 1880 1890 1900
Great Britain
France
Germany
Belgium
Austria-Hungary
Russia
Italy
Netherlands
Spain
Sweden
G.Britainthe leader
Late comersGermanyRussia
19
advantage or CAF. Industrialization can start from a low level of economic development.
However, if the level of development is too low, industries that are too advanced will be
comparative advantage defying (CAD) and require heavy subsidies and protection from the state.
With government support, it is possible to set up advanced industries but as long as they are
CAD, they will be neither viable nor competitive.
Section 2.2 Japan’s catch-up in the Meiji Period: Learning by importing then exporting
Starting with an income level which was only one-third of the West in 1850s, Japan achieved
rapid catch-up in 50 years to become the first industrial country in Asia by 1904. After opening
up trade in 185410
, its government encouraged learning from Western technology and institutions
by sending high level missions including about half of the ministers to America and Europe for
nearly two years (Shimposha, 2000, p.48). 11
―Japan at the time did not receive any direct investment…. Factory construction in the early
Meiji period was mainly achieved through public works or financed from domestic savings,
private capital or joint stock companies. Japan adopted technology from abroad enthusiastically,
but funding for the most part was self-generated.‖ (Shimposa 2000, p. 38)
After signing the Ansei Treaty in 1858, Japan lost control of its tariff policy but the government
provided facilitation by building Japan‘s modern infrastructure and by encouraging learning by
doing. Telegraph services between Tokyo and Yokohama began in 1870. The first Japanese
railroad connecting Yokohama and Shinbashi was built in 1872, and by 1900 Japan had 3,875
miles of railroad (Ito 1992). The government also actively introduced foreign technology by
importing modern machines and hiring thousands of foreign experts to instruct Japanese workers
and managers in the late 1800s. Throughout the Meiji period (1868-1912) Japan‘s top exports
were raw silk yarn, tea, and marine products and the main market was America. As Japan‘s
cotton industry grew, its imports fell steadily, and in 1890, it began to export large quantities of
cotton yarn and cloth to neighboring Asian countries (intra-sector upgrading as in Akamatsu
1962). On the institutional side, a banking system was organized and a central bank was
established in 1882; the gold acquired from China as a indemnity of the war of 1894-95 was used
as a part of the gold reserve, and enabled a well–functioning gold standard system that was
established in 1897 (Ito 1992 p. 21).
10
In 1853 the United States dispatched Commodore Matthew Perry to force Japan to open a port for free trading in
order to supply ships to and from China. From 1854-1858 a series of treaties were signed and in 1859 three ports
were open: Kanagawa, Nagasaki, and Hakodate. (p. 11, The Japanese Economy, by Takatoshi Ito 1992, The MIT
Press). 11
Toyo Keizai Shimposha, 2000. Chapter 5 in ―Globalization of Developing Countries: Is Autonomous
Development Possible?‖ (Tojokoku no Globalization: Jiritsutechi Hatten wa Kanoka). The book won the Suntory
Prize for Social Sciences and Humanities and the Osaragi Jiro Award for Critical Works in 2001.
20
In sum, historical experiences of the industrial revolution offer several insights. First, countries
that are on the technological frontier can play the role of the ―lead geese‖ as the U.K. did.
Second, late comers have the economic advantage of ―backwardness,‖ and under certain
conditions, can catch up quickly and even overtake the lead geese. Third, capital accumulation
was necessary but not sufficient for success. Political stability, openness to trade, and labor
mobility were also important for the country to acquire the new technology and develop new
industries. Fourth, the government was required to play a facilitating role, as in the case of
Germany, the US, and Japan. Without the existence of a centralized state in Germany before
1871, there would have been no railroad or industrial revolution.
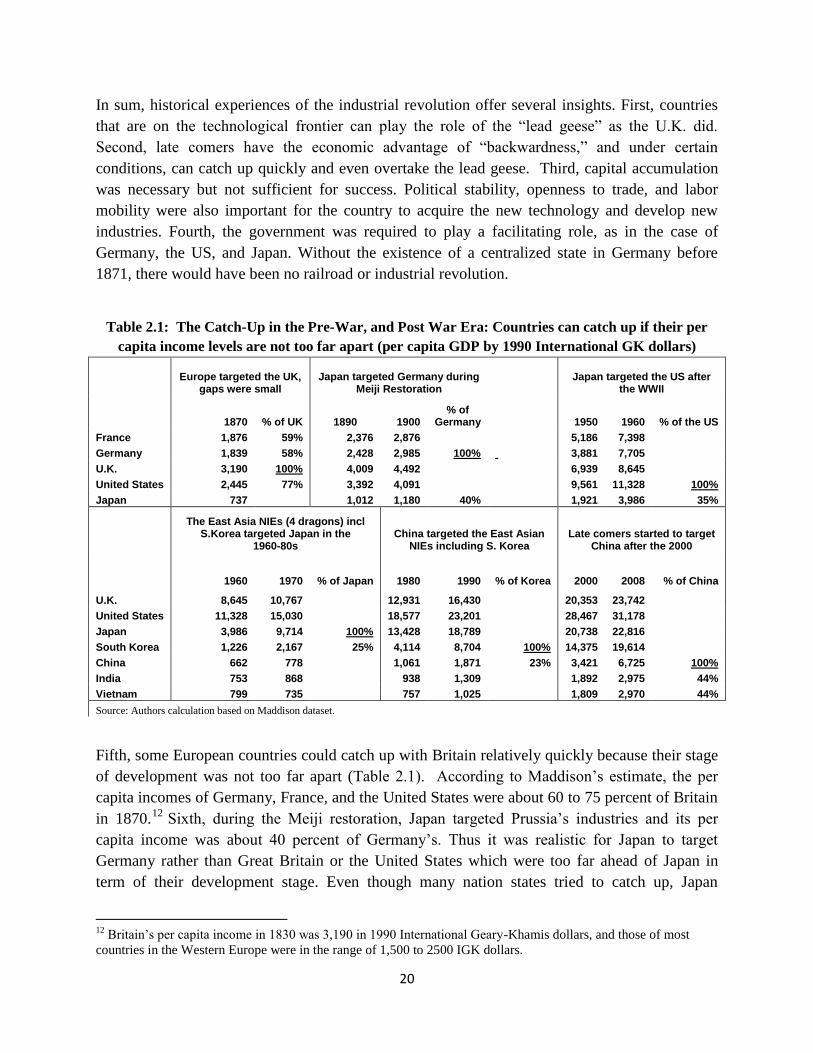
Table 2.1: The Catch-Up in the Pre-War, and Post War Era: Countries can catch up if their per
capita income levels are not too far apart (per capita GDP by 1990 International GK dollars)
Europe targeted the UK,
gaps were small Japan targeted Germany during
Meiji Restoration Japan targeted the US after
the WWII
1870 % of UK 1890 1900 % of
Germany
1950 1960 % of the US
France 1,876 59% 2,376 2,876
5,186 7,398
Germany 1,839 58% 2,428 2,985 100% 3,881 7,705
U.K. 3,190 100% 4,009 4,492
6,939 8,645
United States 2,445 77% 3,392 4,091
9,561 11,328 100%
Japan 737 1,012 1,180 40% 1,921 3,986 35%
The East Asia NIEs (4 dragons) incl S.Korea targeted Japan in the
1960-80s China targeted the East Asian
NIEs including S. Korea Late comers started to target
China after the 2000
1960 1970 % of Japan 1980 1990 % of Korea 2000 2008 % of China
U.K. 8,645 10,767 12,931 16,430 20,353 23,742
United States 11,328 15,030 18,577 23,201 28,467 31,178
Japan 3,986 9,714 100% 13,428 18,789 20,738 22,816
South Korea 1,226 2,167 25% 4,114 8,704 100% 14,375 19,614
China 662 778 1,061 1,871 23% 3,421 6,725 100%
India 753 868 938 1,309 1,892 2,975 44%
Vietnam 799 735 757 1,025 1,809 2,970 44%
Source: Authors calculation based on Maddison dataset.
Fifth, some European countries could catch up with Britain relatively quickly because their stage
of development was not too far apart (Table 2.1). According to Maddison‘s estimate, the per
capita incomes of Germany, France, and the United States were about 60 to 75 percent of Britain
in 1870.12
Sixth, during the Meiji restoration, Japan targeted Prussia‘s industries and its per
capita income was about 40 percent of Germany‘s. Thus it was realistic for Japan to target
Germany rather than Great Britain or the United States which were too far ahead of Japan in
term of their development stage. Even though many nation states tried to catch up, Japan
12
Britain‘s per capita income in 1830 was 3,190 in 1990 International Geary-Khamis dollars, and those of most
countries in the Western Europe were in the range of 1,500 to 2500 IGK dollars.
21
succeeded and became the first industrialized nation from the East because of the right choice of
targeting countries.
Section 2.3 The post WWII era: The US showed the way to Japan and other geese
The economies of Western Europe and Japan have enjoyed unprecedented growth and
technological upgrading in the decades since World War II, or, the so-called Golden Age of
Capitalism (1950-1974). During this period, nearly all developing countries pursued ―dirigiste
capitalism‖ but except for Japan, Korea and other East Asian Tigers, they did not succeed. Why?
The NSE contends that the crux of Japan and East Asia‘s success was that their development
followed closely their comparative advantage or was CAF and their governments played the
facilitation role (Lin 2010, Lin and Monga 2010, Lin and Monga 2011). Just before WWII,
textiles and other light industrial goods accounted for 60 – 75 percent of all Japanese exports.
Japan‘s textile industry was at its peak before the Second World War (Ito 1992, p. 24). In the
1960s, when its per capita GDP was about 40 percent of that of the US and it had established a
strong industrial base, Japan targeted U.S.‘s industries (Table 2.1). Japan‘s historical labor
statistics record that a rising share of labor in Japan‘s manufacturing sector coincided with a
declining share of labor in the US‘s manufacturing sectors. In the 1960s-1970s, Japan supported
its heavy manufacturing sectors including machinery and automobiles. In the 1980s-1990s, just
as the US was upgrading its industrial base, Japan acquired shares in the home appliances,
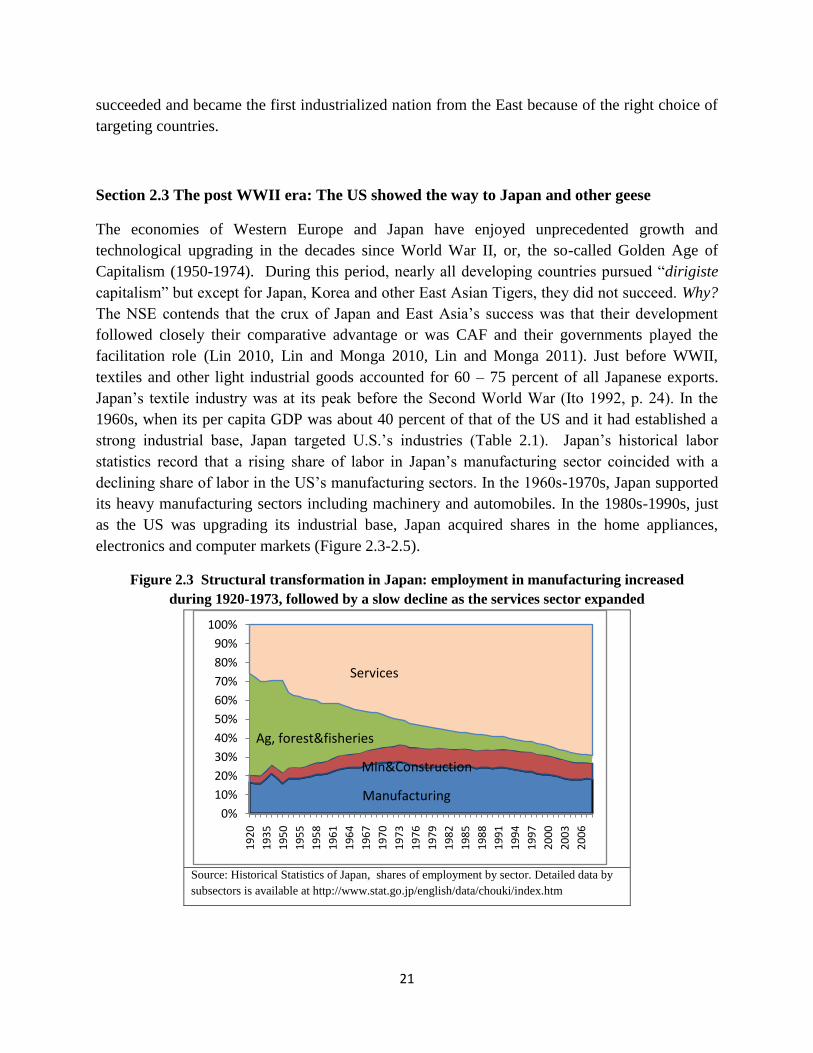
electronics and computer markets (Figure 2.3-2.5).
Figure 2.3 Structural transformation in Japan: employment in manufacturing increased
during 1920-1973, followed by a slow decline as the services sector expanded
Source: Historical Statistics of Japan, shares of employment by sector. Detailed data by
subsectors is available at http://www.stat.go.jp/english/data/chouki/index.htm
0%
10%
20%
30%
40%
50%
60%
70%
80%
90%
100%
19
20
19
35
19
50
19
55
19
58
19
61
19
64
19
67
19
70
19
73
19
76
19
79
19
82
19
85
19
88
19
91
19
94
19
97
20
00
20
03
20
06
Services
Ag, forest&fisheries
Manufacturing
Min&Construction
22
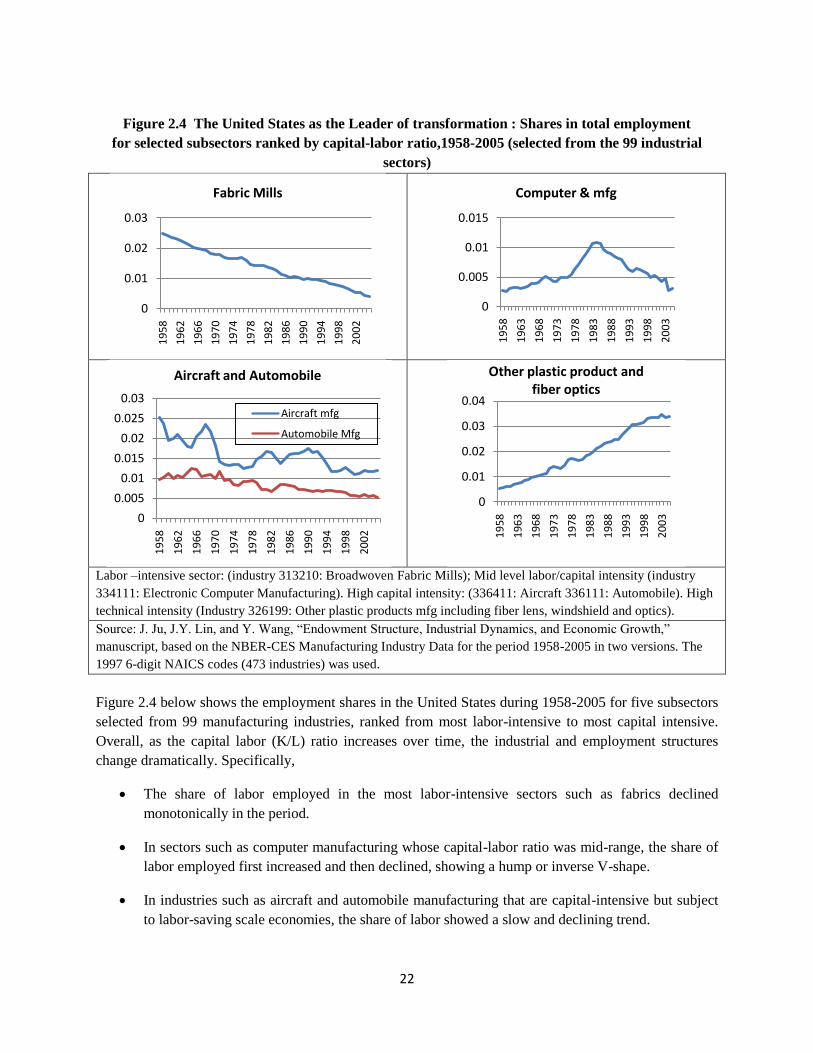
Figure 2.4 The United States as the Leader of transformation : Shares in total employment
for selected subsectors ranked by capital-labor ratio,1958-2005 (selected from the 99 industrial
sectors)
Labor –intensive sector: (industry 313210: Broadwoven Fabric Mills); Mid level labor/capital intensity (industry
334111: Electronic Computer Manufacturing). High capital intensity: (336411: Aircraft 336111: Automobile). High
technical intensity (Industry 326199: Other plastic products mfg including fiber lens, windshield and optics).
Source: J. Ju, J.Y. Lin, and Y. Wang, ―Endowment Structure, Industrial Dynamics, and Economic Growth,‖
manuscript, based on the NBER-CES Manufacturing Industry Data for the period 1958-2005 in two versions. The
1997 6-digit NAICS codes (473 industries) was used.
Figure 2.4 below shows the employment shares in the United States during 1958-2005 for five subsectors
selected from 99 manufacturing industries, ranked from most labor-intensive to most capital intensive.
Overall, as the capital labor (K/L) ratio increases over time, the industrial and employment structures
change dramatically. Specifically,
The share of labor employed in the most labor-intensive sectors such as fabrics declined
monotonically in the period.
In sectors such as computer manufacturing whose capital-labor ratio was mid-range, the share of
labor employed first increased and then declined, showing a hump or inverse V-shape.
In industries such as aircraft and automobile manufacturing that are capital-intensive but subject
to labor-saving scale economies, the share of labor showed a slow and declining trend.
0
0.01
0.02
0.03
19
58
19
62
19
66
19
70
19
74
19
78
19
82
19
86
19
90
19
94
19
98
20
02
Fabric Mills
0
0.005
0.01
0.015
19
58
19
63
19
68
19
73
19
78
19
83
19
88
19
93
19
98
20
03
Computer & mfg
0
0.005
0.01
0.015
0.02
0.025
0.03
19
58
19
62
19
66
19
70
19
74
19
78
19
82
19
86
19
90
19
94
19
98
20
02
Aircraft mfg
Automobile Mfg
Aircraft and Automobile
0
0.01
0.02
0.03
0.04
19
58
19
63
19
68
19
73
19
78
19
83
19
88
19
93
19
98
20
03
Other plastic product and fiber optics
23
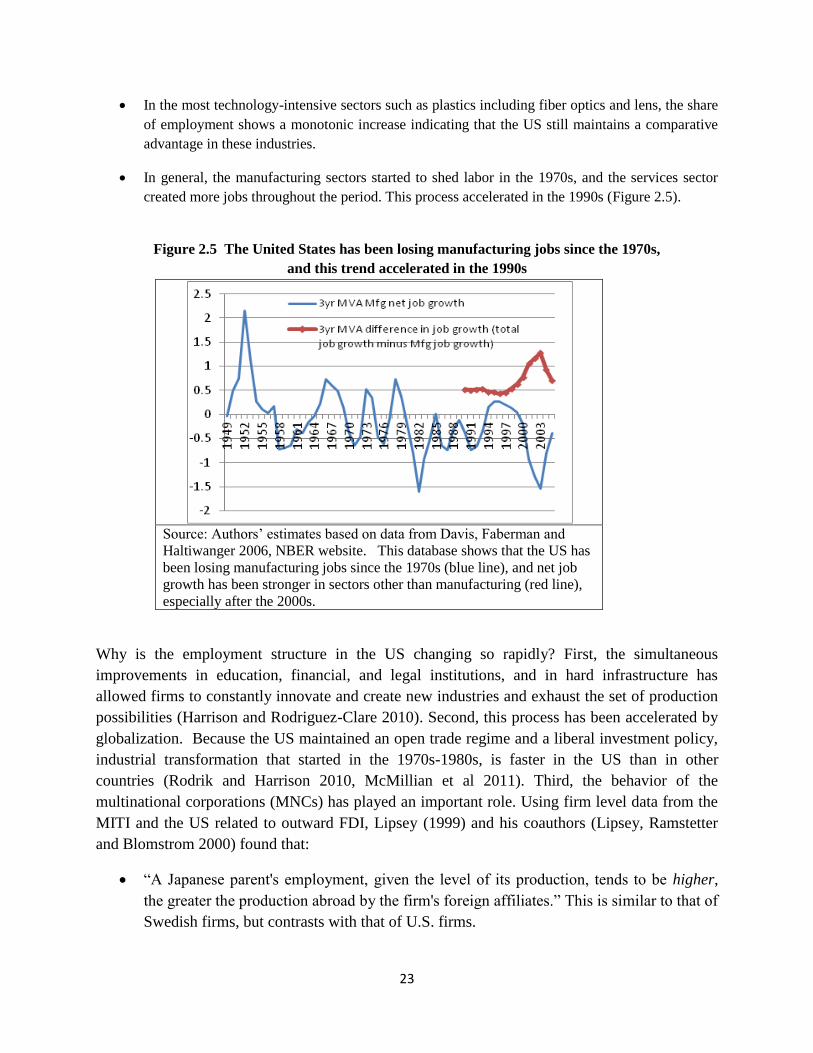
In the most technology-intensive sectors such as plastics including fiber optics and lens, the share
of employment shows a monotonic increase indicating that the US still maintains a comparative
advantage in these industries.
In general, the manufacturing sectors started to shed labor in the 1970s, and the services sector
created more jobs throughout the period. This process accelerated in the 1990s (Figure 2.5).
Figure 2.5 The United States has been losing manufacturing jobs since the 1970s,
and this trend accelerated in the 1990s
Source: Authors‘ estimates based on data from Davis, Faberman and
Haltiwanger 2006, NBER website. This database shows that the US has
been losing manufacturing jobs since the 1970s (blue line), and net job
growth has been stronger in sectors other than manufacturing (red line),
especially after the 2000s.
Why is the employment structure in the US changing so rapidly? First, the simultaneous
improvements in education, financial, and legal institutions, and in hard infrastructure has
allowed firms to constantly innovate and create new industries and exhaust the set of production
possibilities (Harrison and Rodriguez-Clare 2010). Second, this process has been accelerated by
globalization. Because the US maintained an open trade regime and a liberal investment policy,
industrial transformation that started in the 1970s-1980s, is faster in the US than in other
countries (Rodrik and Harrison 2010, McMillian et al 2011). Third, the behavior of the
multinational corporations (MNCs) has played an important role. Using firm level data from the
MITI and the US related to outward FDI, Lipsey (1999) and his coauthors (Lipsey, Ramstetter
and Blomstrom 2000) found that:
―A Japanese parent's employment, given the level of its production, tends to be higher,
the greater the production abroad by the firm's foreign affiliates.‖ This is similar to that of
Swedish firms, but contrasts with that of U.S. firms.
24
U.S. firms appear to reduce employment at home by allocating labor-intensive parts of
their production to affiliates in developing countries. ―Among U.S. firms, production in
developing countries is associated with lower parent employment at home, given the
level of parent output.‖ (page 18)13
This could be interpreted as the U.S. multinationals
are ―footloose‖, allocating the more labor-intensive parts of their output to developing
countries and keeping the more capital intensive or skill intensive parts in the home or
parent facilities.
Why was economic growth in Japan not sustained after the 1970s? From mid-1950s to 1973, for
a variety of reasons, Japan was able to sustain rapid growth for nearly 20 years. Domestic
investment accounted for 30-35 percent of Japan‘s GNP throughout the 1960s. The World Bank
(1993) study on ―the East Asian Miracle‖ documents in detail the Japanese government's policy
of importing technology for the development of key industries, and the provision of institutional
arrangements between the government, banks and the businesses. In addition, the government
created contests14
that combined competition with the benefits of cooperation among firms and
banks, so individual firms endeavored to choose, adapt, and then perfect imported technologies,
including the world renowned ―just-in-time‖ automobile assembly lines. In our view, Japan‘s
success is mainly attributable to its identification of the right target countries in both pre- and
post-war periods, and selection of industries that were consistent with its comparative advantage
or were CAF: textiles in the Meiji period, heavy manufacturing including automobiles in the
1960-1970s, and electronics in the 1980s-1990s.
In 1973, Japan‘s rapid growth started declining for three reasons: oil crises, decrease in
investment, and the slowdown in technological progress. It is reasonable to suggest that ―Japan
finally caught up with the U.S. and the Western European countries technologically in the mid-
1970s. Since it was harder to develop a country‘s own new technology compared to merely
obtaining a license, Japan‘s growth rate then had to fall‖ (Ito 1992, p. 72). In other words,
Japan‘s ―advantage of backwardness‖ had been exhausted. The Japanese economy was then
constrained mainly by the speed of indigenous innovations on the global technology frontier.
Japan had to relocate some of its production base to Korea; Taiwan, China; and other NIEs due
to rising labor cost domestically leading to the loss of its comparative advantage in the labor
intensive sectors.
Section 2.4: The flying geese pattern in East Asia
It has been well documented that several generations of lead geese played significant roles in the
rapid development of the East Asian economies. From 1965 to 1990, Japan emerged as the
13
Lipsey, Robert E., Eric D. Ramstetter and Mangus Blomstrom. "Outward FDI And Apparel Exports And
Employment: Japan, The United States, And Sweden," Global Economy Journal, 2000, v1(4,Oct), Article 1. 14
Recent studies by Aghion, Dewatripont, Du, Harrison and Legros (2011) have provided a theoretical model and
empirical evidence to confirm that ―targeted sectoral policies if combined with competition could be growth and
welfare enhancing.‖ This is consistent with the experiences in Japan by the World Bank 1993 study.
25
world‘s biggest exporter of manufactured goods, increasing its share of the world market from
about 8 to almost 12 percent. Japan‘s success was followed in the 1970s by a second generation
of economies (Hong Kong SAR, China; South Korea; Singapore; and Taiwan, China), in the
1980s by a third generation (Indonesia, Malaysia, the Philippines and Thailand (ASEAN4)), and
in the 1990s by a fourth generation (China and Vietnam), (Gill and Kharas 2007, p.81).
What is less well studied, however, is how this flying geese pattern evolved at the subsector
level, and how the ―jumping‖ of an industry from one country to another evolved, and how
Korea has ceded its dominance in labor–intensive sub-sectors to the third generation of geese—
ASEAN4, and China and Vietnam. Using COMTRADE data we show graphically that:
There is an inverse U shape in some subsectors where the lead goose loses comparative
advantage to its followers (as in Akamatsu 1961 and 1962). Since Akamatsu‘s
transformation cycle can last for over 100 years, the inverse U shape emerges only when
simple measures such as share of exports in the sector are used to illustrate the pattern.
Each specific sector may have several generations of countries playing the role of lead
goose sequentially in different periods as the country‘s endowment structure changes.
This is reminiscent of Akamatsu‘s theory on the international dimensions of the flying
geese model (Figure 2.1).
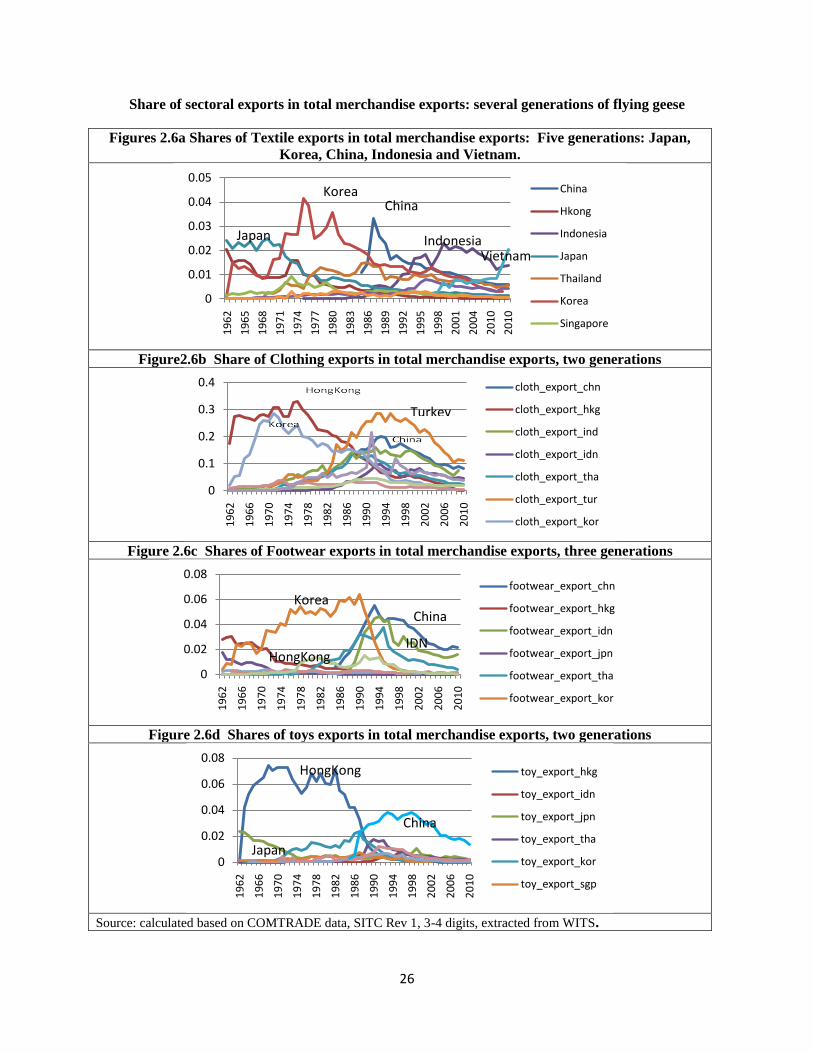
In textiles, an upstream but labor-intensive industry, five generations emerged
sequentially. Japan ceded to Korea in the 1980s, then China emerged in the 1990s but
now its textile exports are losing steam as labor costs are rising and employment shares
are declining. ASEAN4, in particular, Indonesia and Vietnam, and countries which can
expand market share rapidly would have a better chance to benefit by following China
(fig 2.6a).
In the apparel and clothing sector, long ago in the 1970s, Japan lost its leading position to
Korea, whose clothing exports show a clear hump shape as it ceded its leading position
to China in 1989. China emerged later than ASEAN4, but its low wages and efficient
industrial clusters in many provinces enabled it to gain dominance. After many years in
the dominant position, China is now losing its comparative advantage due to rising wages
and will gradually cede its market shares to ASEAN4, Vietnam, and countries which can
seize the opportunity to rapidly expand exports (fig 2.6b).
In footwear and toys, China is recently losing market shares in the EU and the US
markets (UBS investment), and their shares in total exports have been declining (fig 2.6c
and 2.6d). This is consistent with what other studies found but these shares vacated by
China have not yet been taken up by African countries (Maswana 2011, UBS 2011).
There are large opportunities for other low-income countries to benefit from China‘s
graduation from these labor-intensive industries.
26
Share of sectoral exports in total merchandise exports: several generations of flying geese
Figures 2.6a Shares of Textile exports in total merchandise exports: Five generations: Japan,
Korea, China, Indonesia and Vietnam.
Figure2.6b Share of Clothing exports in total merchandise exports, two generations
Figure 2.6c Shares of Footwear exports in total merchandise exports, three generations
Figure 2.6d Shares of toys exports in total merchandise exports, two generations
Source: calculated based on COMTRADE data, SITC Rev 1, 3-4 digits, extracted from WITS.
0
0.01
0.02
0.03
0.04
0.05
19
62
19
65
19
68
19
71
19
74
19
77
19
80
19
83
19
86
19
89
19
92
19
95
19
98
20
01
20
04
20
10
20
10
China
Hkong
Indonesia
Japan
Thailand
Korea
Singapore
Japan
KoreaChina
IndonesiaVietnam
0
0.1
0.2
0.3
0.4
19
62
19
66
19
70
19
74
19
78
19
82
19
86
19
90
19
94
19
98
20
02
20
06
20
10
cloth_export_chn
cloth_export_hkg
cloth_export_ind
cloth_export_idn
cloth_export_tha
cloth_export_tur
cloth_export_kor
Turkey
0
0.02
0.04
0.06
0.08
19
62
19
66
19
70
19
74
19
78
19
82
19
86
19
90
19
94
19
98
20
02
20
06
20
10
footwear_export_chn
footwear_export_hkg
footwear_export_idn
footwear_export_jpn
footwear_export_tha
footwear_export_kor
KoreaChina
IDNHongKong
0
0.02
0.04
0.06
0.08
19
62
19
66
19
70
19
74
19
78
19
82
19
86
19
90
19
94
19
98
20
02
20
06
20
10
toy_export_hkg
toy_export_idn
toy_export_jpn
toy_export_tha
toy_export_kor
toy_export_sgp
HongKong
China
Japan
27
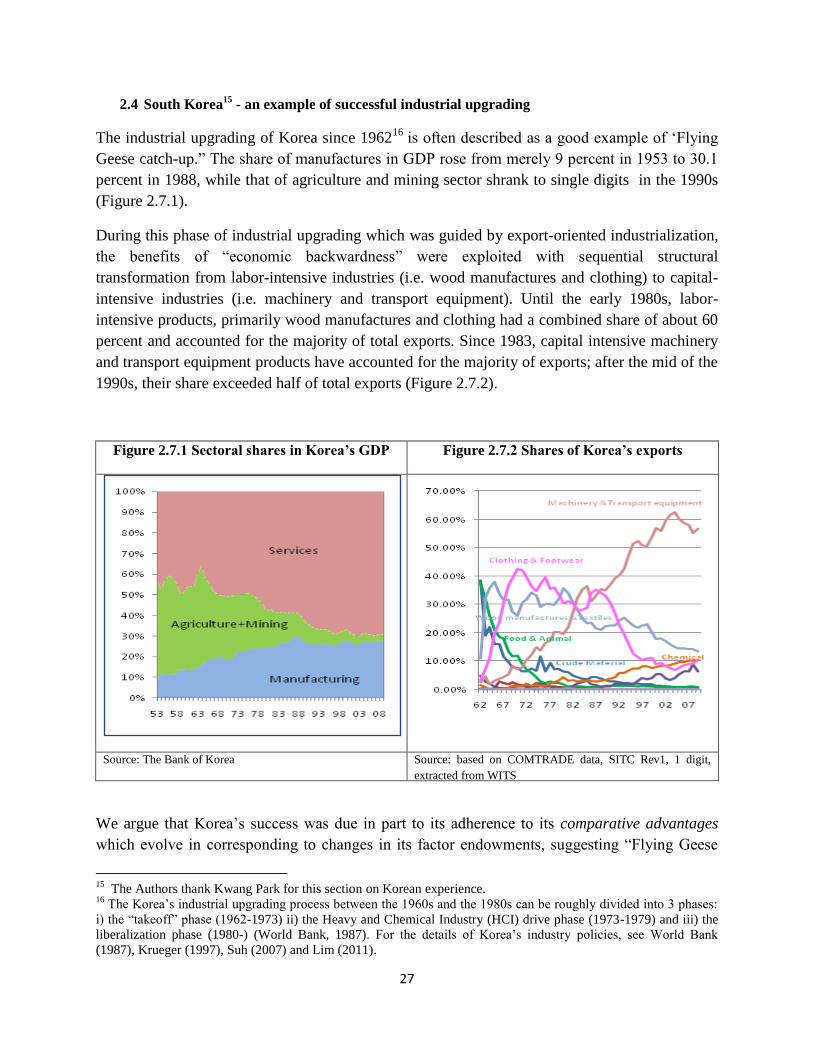
2.4 South Korea15
- an example of successful industrial upgrading
The industrial upgrading of Korea since 196216
is often described as a good example of ‗Flying
Geese catch-up.‖ The share of manufactures in GDP rose from merely 9 percent in 1953 to 30.1
percent in 1988, while that of agriculture and mining sector shrank to single digits in the 1990s
(Figure 2.7.1).
During this phase of industrial upgrading which was guided by export-oriented industrialization,
the benefits of ―economic backwardness‖ were exploited with sequential structural
transformation from labor-intensive industries (i.e. wood manufactures and clothing) to capital-
intensive industries (i.e. machinery and transport equipment). Until the early 1980s, labor-
intensive products, primarily wood manufactures and clothing had a combined share of about 60
percent and accounted for the majority of total exports. Since 1983, capital intensive machinery
and transport equipment products have accounted for the majority of exports; after the mid of the
1990s, their share exceeded half of total exports (Figure 2.7.2).
Figure 2.7.1 Sectoral shares in Korea’s GDP Figure 2.7.2 Shares of Korea’s exports
Source: The Bank of Korea Source: based on COMTRADE data, SITC Rev1, 1 digit,
extracted from WITS
We argue that Korea‘s success was due in part to its adherence to its comparative advantages
which evolve in corresponding to changes in its factor endowments, suggesting ―Flying Geese
15
The Authors thank Kwang Park for this section on Korean experience. 16
The Korea‘s industrial upgrading process between the 1960s and the 1980s can be roughly divided into 3 phases:
i) the ―takeoff‖ phase (1962-1973) ii) the Heavy and Chemical Industry (HCI) drive phase (1973-1979) and iii) the
liberalization phase (1980-) (World Bank, 1987). For the details of Korea‘s industry policies, see World Bank
(1987), Krueger (1997), Suh (2007) and Lim (2011).
28
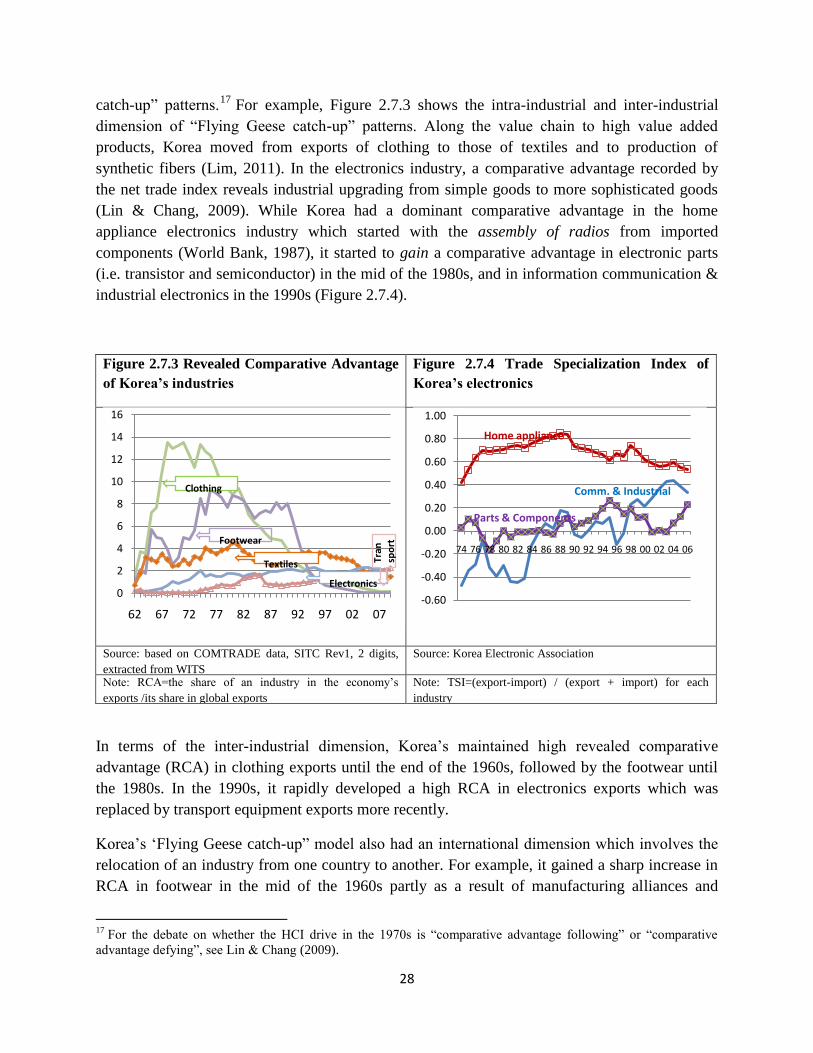
catch-up‖ patterns.17
For example, Figure 2.7.3 shows the intra-industrial and inter-industrial
dimension of ―Flying Geese catch-up‖ patterns. Along the value chain to high value added
products, Korea moved from exports of clothing to those of textiles and to production of
synthetic fibers (Lim, 2011). In the electronics industry, a comparative advantage recorded by
the net trade index reveals industrial upgrading from simple goods to more sophisticated goods
(Lin & Chang, 2009). While Korea had a dominant comparative advantage in the home
appliance electronics industry which started with the assembly of radios from imported
components (World Bank, 1987), it started to gain a comparative advantage in electronic parts
(i.e. transistor and semiconductor) in the mid of the 1980s, and in information communication &
industrial electronics in the 1990s (Figure 2.7.4).
Figure 2.7.3 Revealed Comparative Advantage
of Korea’s industries
Figure 2.7.4 Trade Specialization Index of
Korea’s electronics
Source: based on COMTRADE data, SITC Rev1, 2 digits,
extracted from WITS
Source: Korea Electronic Association
Note: RCA=the share of an industry in the economy‘s
exports /its share in global exports
Note: TSI=(export-import) / (export + import) for each
industry
In terms of the inter-industrial dimension, Korea‘s maintained high revealed comparative
advantage (RCA) in clothing exports until the end of the 1960s, followed by the footwear until
the 1980s. In the 1990s, it rapidly developed a high RCA in electronics exports which was
replaced by transport equipment exports more recently.
Korea‘s ‗Flying Geese catch-up‖ model also had an international dimension which involves the
relocation of an industry from one country to another. For example, it gained a sharp increase in
RCA in footwear in the mid of the 1960s partly as a result of manufacturing alliances and
17
For the debate on whether the HCI drive in the 1970s is ―comparative advantage following‖ or ―comparative
advantage defying‖, see Lin & Chang (2009).
0
2
4
6
8
10
12
14
16
62 67 72 77 82 87 92 97 02 07
Clothing
Footwear
Textiles
Electronics
Tran
spo
rt
-0.60
-0.40
-0.20
0.00
0.20
0.40
0.60
0.80
1.00
74 76 78 80 82 84 86 88 90 92 94 96 98 00 02 04 06
Home appliance
Parts & Components
Comm. & Industrial
29
technology cooperation among firms from Korea and Japan prompted by increasing wages in
Japan which were weakening the latter‘s competitiveness in the sector. A steep decrease in its
RCA in the mid of 1990s indicates that higher wages in Korea have led to a relocation of
factories to China, Indonesia and Vietnam (The Committee for the Sixty Year History of the
Korean Economy, 2010). Since the end of the 1980s when a liberal policy on outward foreign
investment was adopted, outward foreign investment of Korea‘s labor-intensive industries has
increased and its main destination has been Asian countries (See Section 4 on FDI).
Part 3: Heavy Industrialization, Import Substitution and Structural
Transformation
In the post WWII period, most developing countries were keenly aware of the role that
industrialization played in accelerating structural transformation and catch-up in the U.S., Europe
and Japan. Keen to emulate them, developing countries adopted the prevailing Structuralist
paradigm which advocated an import substitution-led (IS) industrialization strategy to develop
advanced industries similar to those in the industrial countries. Examples include heavy
industries such as iron and steel, chemicals, machinery and transport equipment in countries as
diverse as India, Brazil, Ghana, Egypt, and South Korea. As this section will show, in spite of a
large variety of protectionist measures including high tariffs, even the most well intended policy
interventions failed in sustaining comparative advantage defying (CAD) industries. We argue
that the defining characteristic of countries that succeeded in sustaining industrialization was the
dominance of comparative advantage following (CAF) industries that facilitated the upgrading
and diversification of industries that were the country‘s latent comparative advantage. In fact,
governments in the successful catching up countries even provided subsidies or protection to
their pioneer firms. Some subsidies or protection to pioneer firms are desirable as (i) they help
the pioneers to offset the asymmetry in losses associated with failure and gains related with
success, and (ii) compensate for the information externalities that they generate.
Most developing countries adopted IS strategies in the belief that ―the market encompassed
insurmountable defects and the state was a powerful supplementary means to accelerate the pace
of economic development. Many development economists at that time advocated that the state
should overcome market failures by playing a leading role in the industrialization push, directly
allocating the resources for investment, and setting up public enterprises in the large heavy
industries to control the commanding heights‖ (Hirschman 1958; Nurkse 1953; Rosenstein-
Rodan 1943). As an example, in Latin America which was overly dependent on primary
commodity exports, a temporary deterioration in the terms of trade was perceived as a secular
trend by political leaders and social elites. They believed that it would lead to a transfer of
income from resource-intensive developing countries to capital-intensive developed countries
and the only way to end exploitation was to develop domestic manufacturing industries through
IS (Lin 2010, page 7).
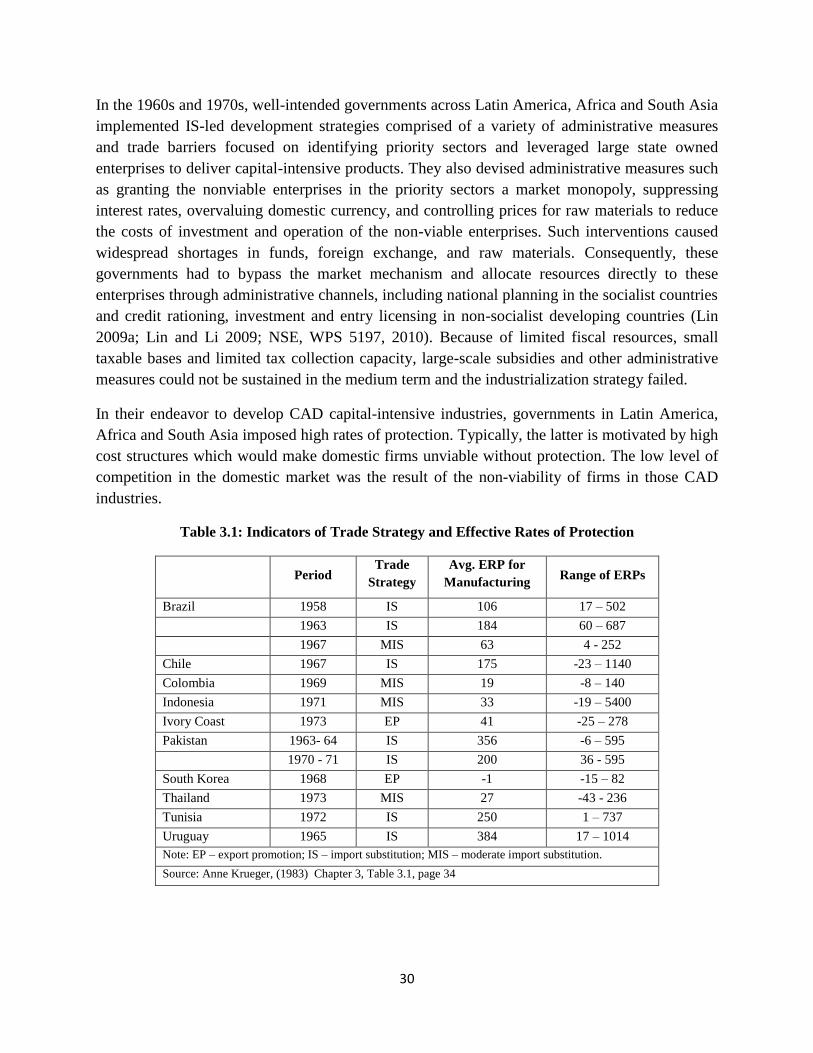
30
In the 1960s and 1970s, well-intended governments across Latin America, Africa and South Asia
implemented IS-led development strategies comprised of a variety of administrative measures
and trade barriers focused on identifying priority sectors and leveraged large state owned
enterprises to deliver capital-intensive products. They also devised administrative measures such
as granting the nonviable enterprises in the priority sectors a market monopoly, suppressing
interest rates, overvaluing domestic currency, and controlling prices for raw materials to reduce
the costs of investment and operation of the non-viable enterprises. Such interventions caused
widespread shortages in funds, foreign exchange, and raw materials. Consequently, these
governments had to bypass the market mechanism and allocate resources directly to these
enterprises through administrative channels, including national planning in the socialist countries
and credit rationing, investment and entry licensing in non-socialist developing countries (Lin
2009a; Lin and Li 2009; NSE, WPS 5197, 2010). Because of limited fiscal resources, small
taxable bases and limited tax collection capacity, large-scale subsidies and other administrative
measures could not be sustained in the medium term and the industrialization strategy failed.
In their endeavor to develop CAD capital-intensive industries, governments in Latin America,
Africa and South Asia imposed high rates of protection. Typically, the latter is motivated by high
cost structures which would make domestic firms unviable without protection. The low level of
competition in the domestic market was the result of the non-viability of firms in those CAD
industries.
Table 3.1: Indicators of Trade Strategy and Effective Rates of Protection
Period Trade
Strategy
Avg. ERP for
Manufacturing Range of ERPs
Brazil 1958 IS 106 17 – 502
1963 IS 184 60 – 687
1967 MIS 63 4 - 252
Chile 1967 IS 175 -23 – 1140
Colombia 1969 MIS 19 -8 – 140
Indonesia 1971 MIS 33 -19 – 5400
Ivory Coast 1973 EP 41 -25 – 278
Pakistan 1963- 64 IS 356 -6 – 595
1970 - 71 IS 200 36 - 595
South Korea 1968 EP -1 -15 – 82
Thailand 1973 MIS 27 -43 - 236
Tunisia 1972 IS 250 1 – 737
Uruguay 1965 IS 384 17 – 1014
Note: EP – export promotion; IS – import substitution; MIS – moderate import substitution.
Source: Anne Krueger, (1983) Chapter 3, Table 3.1, page 34
31
Most tariffs on manufactures led to effective rates of protection (ERP) well in excess of 100
percent in most countries (Table 3.1). In a sample of 10 countries chosen for a special study,
Krueger (1983) found that all except the Ivory Coast and South Korea were pursuing IS
strategies in the 1960s and 1970s. The average ERP on manufactured products varied from 356
percent in Pakistan to 384 percent in Uruguay. In contrast, in the same period, South Korea
followed an export promotion strategy.
Governments following CAD were not indifferent to the type of industries they were protecting.
The range of the ERPs indicates further distortions in the government‘s policy stance which
favored certain industries more than others. Brazil is notable for starting out with high ERPs in
the late 1950s but gradually shifting to a moderately IS strategy (MIS) by 1967. The ERPs on
manufactures varied significantly, indicating that domestic firms could produce some products
better than others. Between 1963 and 1966, the ERP on mining was reduced from 34 to 24
percent, on machinery from 68 to 30 percent, on chemicals from 146 to 56 percent, transport
equipment from 147 to 103 percent and electrical equipment from 169 to 112 percent. After the
reform, although ERP levels of around 100 percent or less were relatively high, their reduction
was a signal that the industries they protected were Brazil‘s comparative advantage following
(CAF) industries. In comparison, when ERPs were high and remained so pre and post reform, the
protected industries were invariably CAD, i.e., not Brazil‘s competitive edge. Examples are the
plastics industry where the ERP declined from 489 to 332 percent, textiles where it declined
from 298 to 232 percent, and clothing where it changed from 481 to 321 percent (Fishlow
summary, pp 58a, Table X.1). While tariffs were the main instrument of protection, zealous
governments also leveraged other protectionist policies tailored to a specific CAD industry. As
an example, in Brazil, firms importing goods that were available in the domestic market were not
eligible to receive government contracts. In general, there were few offsetting export subsidies.
In Brazil and Pakistan, protection was first granted to consumer goods and later to capital goods
to protect consumer goods industries. In Pakistan, during 1970-71, the ERPs on most consumer
and intermediate goods were between 100-200 percent except for motor vehicles which had an
ERP of 595 percent and were CAD products (Guisinger, 1978).
In Colombia, the pattern of protection also reflected the difference in industries that were CAF
and CAD. In 1969, when Colombia was pursuing an IS strategy, the ERP on agricultural
products, simple consumer goods and simple machinery were in the range of 2 – 25 percent
(Hutcheson and Schydlowsky, 1976, Appendix Table 4.A.1). However, the fact that at the same
time the ERP of transport equipment was 135 percent suggested that it was a CAD industry that
required special protection to survive.
The Indian government had an elaborate brand of IS. At the start of the second five year plan
(1957 – 62), policymakers in India envisioned a country that was not dependent on imports of
either consumer or producer goods. This was achieved by using IS to ―make machines to make
machines,‖ as well as to make consumer products, i.e., imposing import licensing requirements
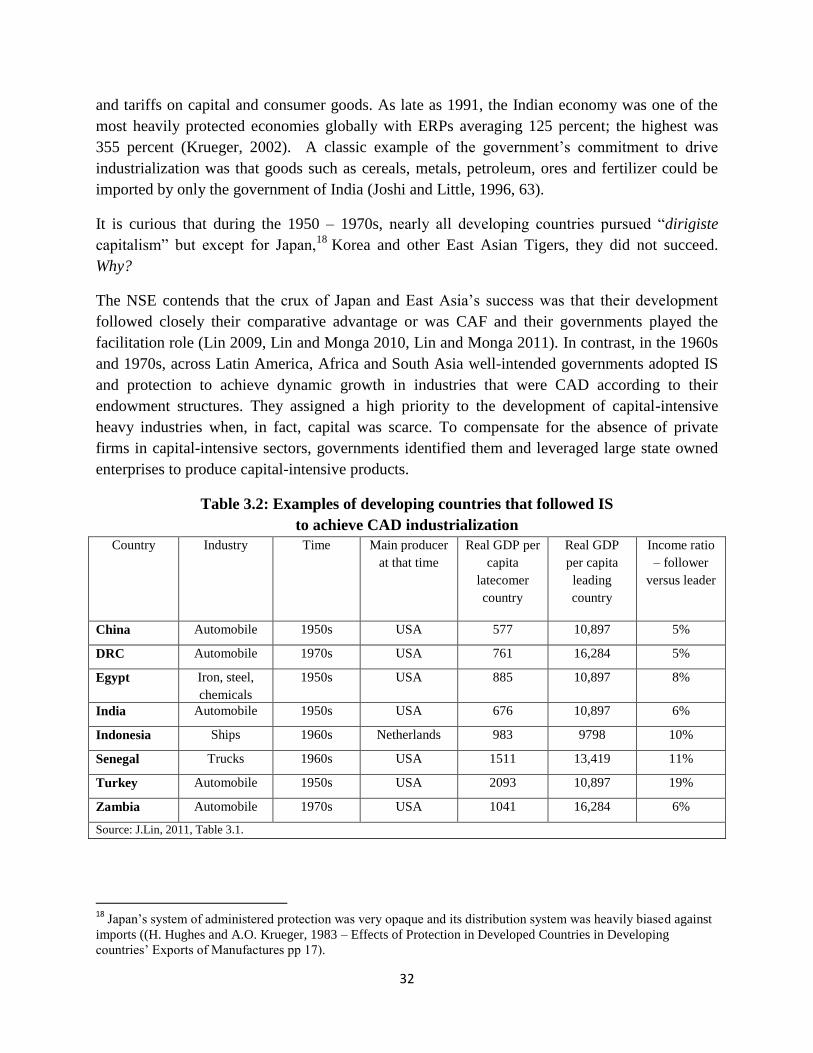
32
and tariffs on capital and consumer goods. As late as 1991, the Indian economy was one of the
most heavily protected economies globally with ERPs averaging 125 percent; the highest was
355 percent (Krueger, 2002). A classic example of the government‘s commitment to drive
industrialization was that goods such as cereals, metals, petroleum, ores and fertilizer could be
imported by only the government of India (Joshi and Little, 1996, 63).
It is curious that during the 1950 – 1970s, nearly all developing countries pursued ―dirigiste
capitalism‖ but except for Japan,18
Korea and other East Asian Tigers, they did not succeed.
Why?
The NSE contends that the crux of Japan and East Asia‘s success was that their development
followed closely their comparative advantage or was CAF and their governments played the
facilitation role (Lin 2009, Lin and Monga 2010, Lin and Monga 2011). In contrast, in the 1960s
and 1970s, across Latin America, Africa and South Asia well-intended governments adopted IS
and protection to achieve dynamic growth in industries that were CAD according to their
endowment structures. They assigned a high priority to the development of capital-intensive
heavy industries when, in fact, capital was scarce. To compensate for the absence of private
firms in capital-intensive sectors, governments identified them and leveraged large state owned
enterprises to produce capital-intensive products.
Table 3.2: Examples of developing countries that followed IS
to achieve CAD industrialization
Country Industry Time Main producer
at that time
Real GDP per
capita
latecomer
country
Real GDP
per capita
leading
country
Income ratio
– follower
versus leader
China Automobile 1950s USA 577 10,897 5%
DRC Automobile 1970s USA 761 16,284 5%
Egypt Iron, steel,
chemicals
1950s USA 885 10,897 8%
India Automobile 1950s USA 676 10,897 6%
Indonesia Ships 1960s Netherlands 983 9798 10%
Senegal Trucks 1960s USA 1511 13,419 11%
Turkey Automobile 1950s USA 2093 10,897 19%
Zambia Automobile 1970s USA 1041 16,284 6%
Source: J.Lin, 2011, Table 3.1.
18
Japan‘s system of administered protection was very opaque and its distribution system was heavily biased against
imports ((H. Hughes and A.O. Krueger, 1983 – Effects of Protection in Developed Countries in Developing
countries‘ Exports of Manufactures pp 17).
33
A simple metric of a CAD policy was protection for products that were produced by countries
whose income levels were significantly higher than the protecting country (Table 3.2). Examples
of such strategies include Indonesia launching a ship building industry in the 1960s when its
GDP per capita was only 10 percent of its main competitor, the Netherlands; and Zaire‘s (now
the Democratic Republic of Congo) attempt to build an auto industry in the 1970s when the
country‗s GDP per capita was only 5 percent of the U.S., the industry leader (Lin 2011).
The case of South Korea suggests that because its government was actively fostering CAF
industries through an export promotion (EP) strategy, it could afford to keep protection rates
lower than governments fostering CAD industries. In 1968, Korea‘s ERP on agriculture was 18
percent, on mining 3 percent and on average on manufacturing minus 1 percent pointing to the
fact that manufacturing industries were clearly CAF. Krueger (1983) notes that even so, the
average ERP on import-competing industries was still 92 percent while that on export industries
and non-competing industries was minus 10 percent.
The Korean case, together with Japan‘s and other East Asian Tigers‘ discussed earlier suggest
that developing country governments had two options to accelerate industrialization after World
War II. They could adopt an IS strategy to foster CAD industries or they could pursue export
promotion to nurture CAF industries. As noted above, CAD industrialization through IS
strategies not only failed but it also diverted governments‘ attention and resources away from
CAF, export-oriented industrialization. Would EP strategies have failed anyway because of
Western protectionism aimed at limiting developing country exports? Given the empirical
evidence, Hughes and Krueger note that ―it seems reasonable to conclude that at least in the
1970s, protectionist actions were not sufficient to prevent those developing countries with open
economies from significantly increasing their share of world markets,‖ (Hughes and Krueger,
1983, page 38). In spite of protectionism in the Western countries, growth in world trade
accelerated to 30 percent per annum in the 1970s offering many export opportunities to
developing countries who had a comparative advantage in labor-intensive exports which
corresponded with lower wage levels or were CAF. When developing country exports to the
Western Countries grew from US$ 21 to US$ 151 billion between 1970 and 1980, East Asia was
the only region that increased its share from 15 to 25 percent while Latin America that fostered
CAD industries lost its share from 35 to 27 percent (Hughes and Krueger 1983, page 25). In the
1970s, when higher wages prompted the garments and textiles industry to relocate first from the
Western countries to Hong Kong SAR, China and Taiwan, China, and then from the latter group
to countries such as Thailand and Malaysia, it was an opportune time for India and some
countries in Latin America that already had these traditional industries to seize the export
opportunities and accelerate industrialization. Unfortunately, preoccupation with IS distracted
them from filling even the basic export quotas of garments and textiles to the Western countries.
34
Pursuit of CAF industrialization through EP also enabled the East Asian Tigers to upgrade their
industries according to the changes in their endowments structures.19
Some countries used direct
interventions to accelerate upgrading. In Taiwan, China private initiative to upgrade the
industrial structure by developing more technologically sophisticated industries was supported
by public liberalization measures (Hughes and Krueger, 1983, page 35). In Korea the
government and private sectors worked together to identify and develop industries that were the
country‘s latent comparative advantages (Lim 2011).
In general, where governments pursued IS to support CAD industries, the outcomes were
unsustainable and took a heavy toll on exports and growth. Even though they were abandoned
when governments finally liberalized trade, IS came at the cost of EP. Based on findings from
his empirical research which were also corroborated by Krueger and others, Balassa (1978)
reported that ―the increase in Korea‘s GDP would have been 37 percent smaller if its export
growth rate equaled the average for all countries concerned. The corresponding proportion is 25
percent for Taiwan, China. At the other extreme, In Chile, India and Mexico respectively, the
increase in GNP would have been 14, 12 and 8 percent greater if those countries had average
export growth rates. [p. 187]‖.
3.1 Industrialization in China and India led to deindustrialization in Africa
Starting in the 1980s, China‘s and to some extent India‘s industrialization caused many
developing countries to become resource providers to these two countries and importers of
manufactured products from these countries. This is attributable first to rapid economic growth
in China which required large amounts of energy and raw materials to support its development,
and in the process, pushed upward pressure on the prices of these resources. Many developing
countries, particularly in Africa, are resources providers today. Secondly, China became the
world‘s factory producing and exporting the majority of global light manufactured exports.
In the last quarter of the twentieth century, Chinese exports transformed from predominantly primary and
resource-based (export share of 55 percent) to manufactured products that accounted for 90 percent of
total exports (Figure 3.1). In particular, light manufactures grew from a share of 30 percent of total
exports in 1980-85 to nearly 43 percent in 1995-00 before being overtaken by medium and high tech
manufactures. In transitioning from light to higher tech manufactures, China was fostering CAF industries
which explain why it experienced sustained industrialization and export growth throughout the last
quarter of the last century.
19
The upgrading of endowment structure is a consequence of the accumulation of capital at a faster pace than the
growth of labor. The private firms will not target the upgrading of endowment structure. However, to remain
competitive, the private firms need to upgrade their industries in accordance with the changes in comparative
advantages due to the changes in endowment structure.
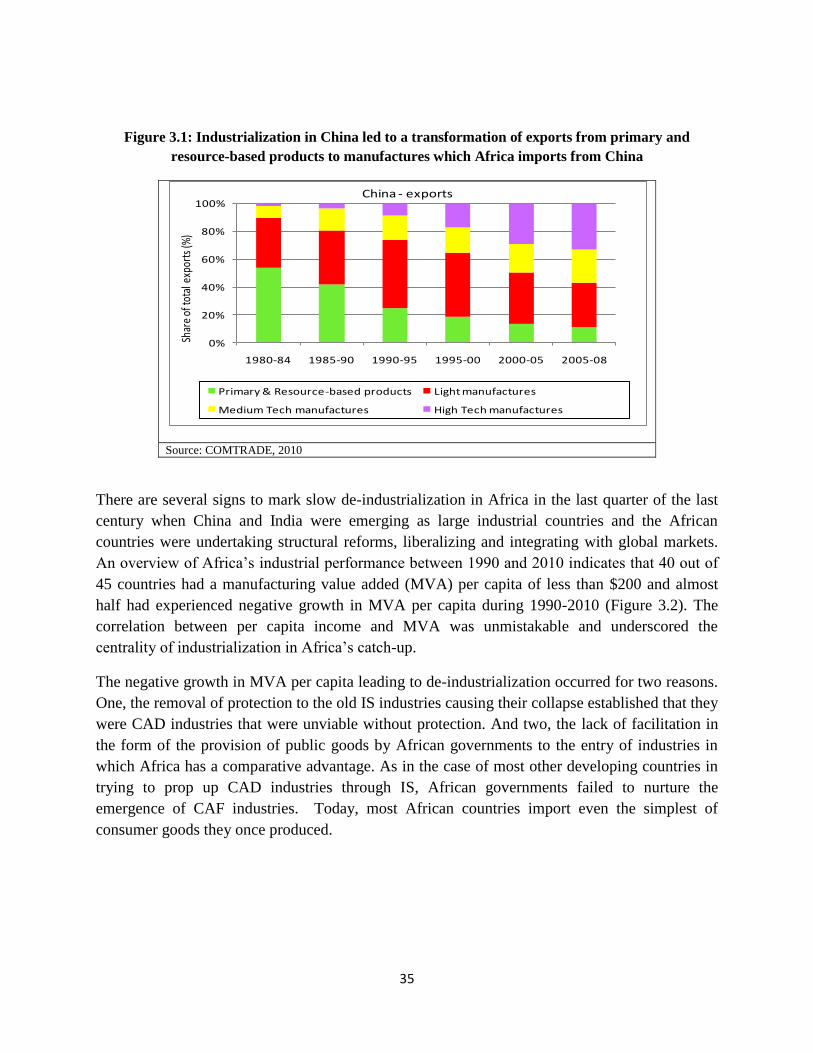
35
Figure 3.1: Industrialization in China led to a transformation of exports from primary and
resource-based products to manufactures which Africa imports from China
Source: COMTRADE, 2010
There are several signs to mark slow de-industrialization in Africa in the last quarter of the last
century when China and India were emerging as large industrial countries and the African
countries were undertaking structural reforms, liberalizing and integrating with global markets.
An overview of Africa‘s industrial performance between 1990 and 2010 indicates that 40 out of
45 countries had a manufacturing value added (MVA) per capita of less than $200 and almost
half had experienced negative growth in MVA per capita during 1990-2010 (Figure 3.2). The
correlation between per capita income and MVA was unmistakable and underscored the
centrality of industrialization in Africa‘s catch-up.
The negative growth in MVA per capita leading to de-industrialization occurred for two reasons.
One, the removal of protection to the old IS industries causing their collapse established that they
were CAD industries that were unviable without protection. And two, the lack of facilitation in
the form of the provision of public goods by African governments to the entry of industries in
which Africa has a comparative advantage. As in the case of most other developing countries in
trying to prop up CAD industries through IS, African governments failed to nurture the
emergence of CAF industries. Today, most African countries import even the simplest of
consumer goods they once produced.
0%
20%
40%
60%
80%
100%
1980-84 1985-90 1990-95 1995-00 2000-05 2005-08
Shar
e of
tota
l exp
orts
(%)
China - exports
Primary & Resource-based products Light manufactures
Medium Tech manufactures High Tech manufactures
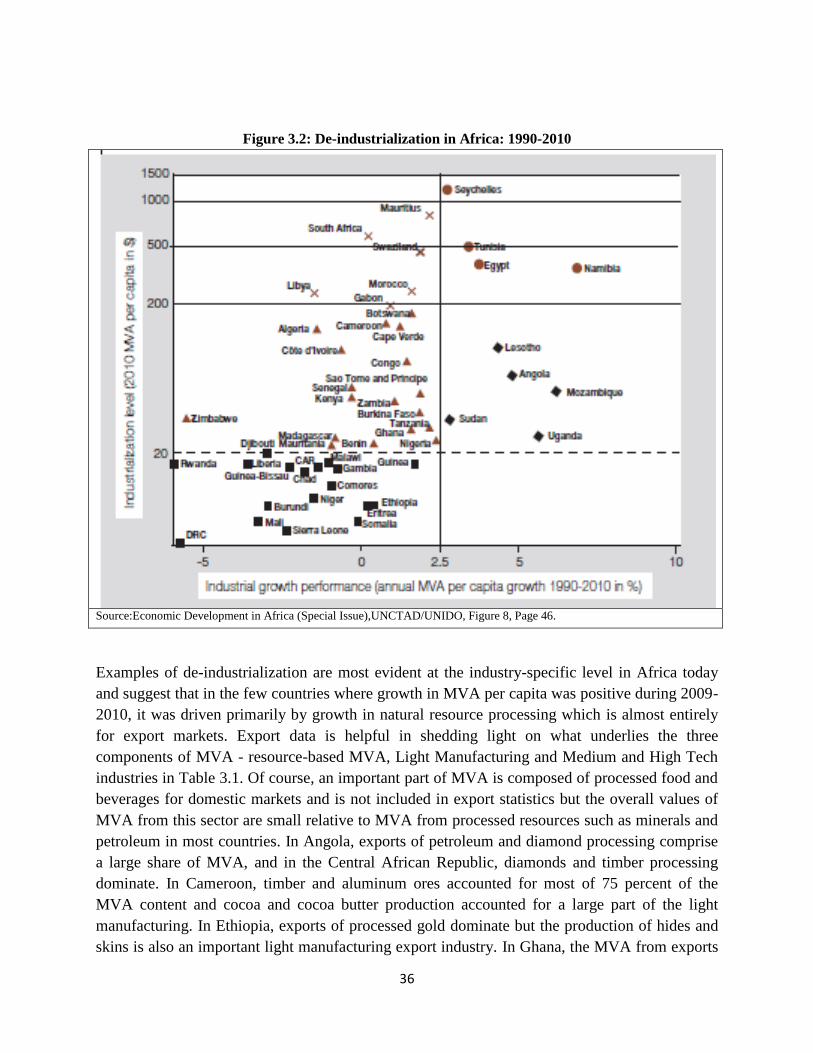
36
Figure 3.2: De-industrialization in Africa: 1990-2010
Source:Economic Development in Africa (Special Issue),UNCTAD/UNIDO, Figure 8, Page 46.
Examples of de-industrialization are most evident at the industry-specific level in Africa today
and suggest that in the few countries where growth in MVA per capita was positive during 2009-
2010, it was driven primarily by growth in natural resource processing which is almost entirely
for export markets. Export data is helpful in shedding light on what underlies the three
components of MVA - resource-based MVA, Light Manufacturing and Medium and High Tech
industries in Table 3.1. Of course, an important part of MVA is composed of processed food and
beverages for domestic markets and is not included in export statistics but the overall values of
MVA from this sector are small relative to MVA from processed resources such as minerals and
petroleum in most countries. In Angola, exports of petroleum and diamond processing comprise
a large share of MVA, and in the Central African Republic, diamonds and timber processing
dominate. In Cameroon, timber and aluminum ores accounted for most of 75 percent of the
MVA content and cocoa and cocoa butter production accounted for a large part of the light
manufacturing. In Ethiopia, exports of processed gold dominate but the production of hides and
skins is also an important light manufacturing export industry. In Ghana, the MVA from exports
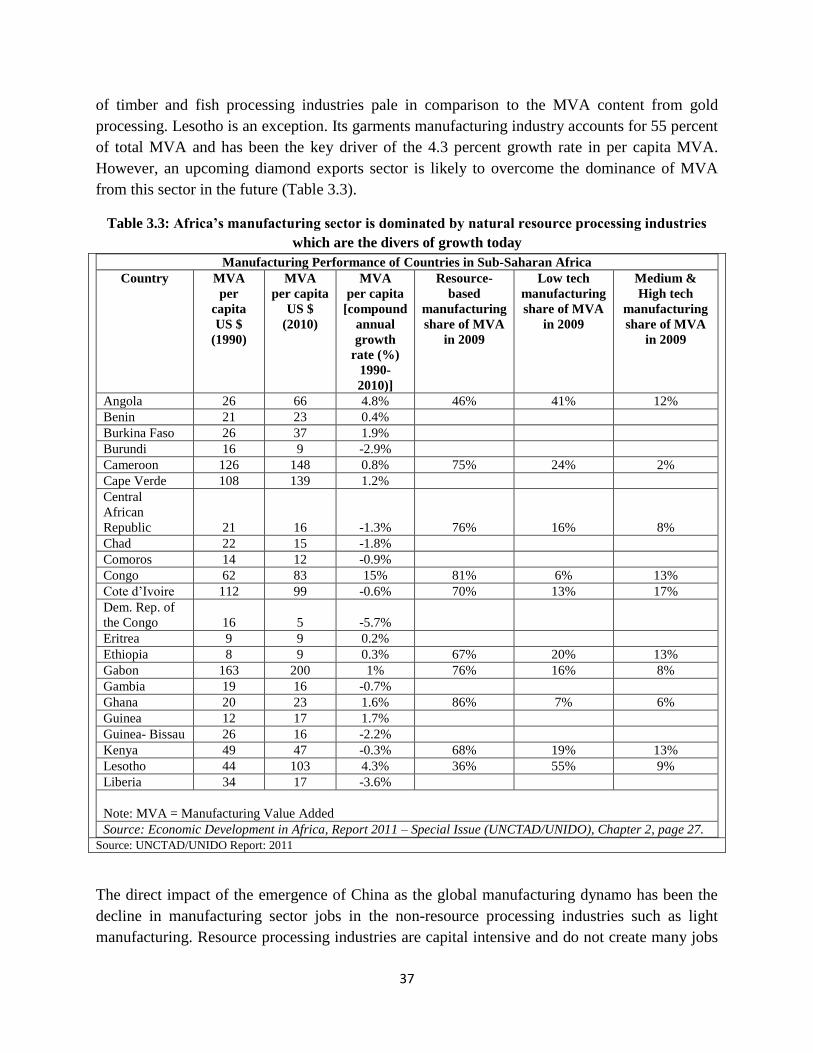
37
of timber and fish processing industries pale in comparison to the MVA content from gold
processing. Lesotho is an exception. Its garments manufacturing industry accounts for 55 percent
of total MVA and has been the key driver of the 4.3 percent growth rate in per capita MVA.
However, an upcoming diamond exports sector is likely to overcome the dominance of MVA
from this sector in the future (Table 3.3).
Table 3.3: Africa’s manufacturing sector is dominated by natural resource processing industries
which are the divers of growth today
Manufacturing Performance of Countries in Sub-Saharan Africa
Country MVA
per
capita
US $
(1990)
MVA
per capita
US $
(2010)
MVA
per capita
[compound
annual
growth
rate (%)
1990-
2010)]
Resource-
based
manufacturing
share of MVA
in 2009
Low tech
manufacturing
share of MVA
in 2009
Medium &
High tech
manufacturing
share of MVA
in 2009
Angola 26 66 4.8% 46% 41% 12%
Benin 21 23 0.4%
Burkina Faso 26 37 1.9%
Burundi 16 9 -2.9%
Cameroon 126 148 0.8% 75% 24% 2%
Cape Verde 108 139 1.2%
Central
African
Republic 21 16 -1.3% 76% 16% 8%
Chad 22 15 -1.8%
Comoros 14 12 -0.9%
Congo 62 83 15% 81% 6% 13%
Cote d‘Ivoire 112 99 -0.6% 70% 13% 17%
Dem. Rep. of
the Congo 16 5 -5.7%
Eritrea 9 9 0.2%
Ethiopia 8 9 0.3% 67% 20% 13%
Gabon 163 200 1% 76% 16% 8%
Gambia 19 16 -0.7%
Ghana 20 23 1.6% 86% 7% 6%
Guinea 12 17 1.7%
Guinea- Bissau 26 16 -2.2%
Kenya 49 47 -0.3% 68% 19% 13%
Lesotho 44 103 4.3% 36% 55% 9%
Liberia 34 17 -3.6%
Note: MVA = Manufacturing Value Added
Source: Economic Development in Africa, Report 2011 – Special Issue (UNCTAD/UNIDO), Chapter 2, page 27.
Source: UNCTAD/UNIDO Report: 2011
The direct impact of the emergence of China as the global manufacturing dynamo has been the
decline in manufacturing sector jobs in the non-resource processing industries such as light
manufacturing. Resource processing industries are capital intensive and do not create many jobs
38
even when they grow rapidly. Unfortunately, in virtually every country in Figure 1.6, the share
of labor in the manufacturing sector declined which suggests that employment in light
manufacturing industries (e.g. textiles, apparel and leather products) which are labor intensive
declined. Evidently, a large part of the employment losses is due to a decline in the share of
textiles, from about 7 percent in 2000 to 5 percent in 2009. Nearly all textiles today are imported
from China (UNIDO 2011).
Many developing countries in other regions of the world have managed to experience significant
growth through exporting light manufactures. In comparison, although Africa‘s exports and
imports of light manufactures were balanced in 2000, the region had a trade deficit in light
manufactures in 2008. The fact that Africa is increasingly dependent on other regions for light
manufactures is significant for three reasons. First, the trade deficit indicates that African
economies have a sizeable domestic market for light manufactures products which could form
the basis for the expansion of a light manufacturing sector in at least some African countries.
Second, light manufacturing sectors are a stepping stone towards more sophisticated
technologically sophisticated manufacturing industries (UNIDO, 2011). Third, given the size of
global demand for light manufactures, there is significant potential for African exports of light
manufactures which can stimulate capital deepening and facilitate structural transformation into
more advanced sectors.
Some may argue that in comparison to light manufactures, resource-based processing industries
can contribute equally to growth in Africa. This hypothesis implies that Africa‘s de-
industrialization is not necessarily inimical to growth. We argue that light manufacturing is a
prerequisite for Africa‘s industrialization and catch up with richer countries. Both the low-
employment intensity and high vulnerability of resource processing industries to external price
shocks are constraints to sustained labor-reallocation necessary for the structural transformation
of natural resource-based African economies. Moreover, resource-based sectors exhibit lower
productivity growth and have few linkages with the rest of the economy (Lall, 2004c). In sum,
resource-based manufactures show only very limited product differentiation and thus share
several characteristics of commodities (UNIDO, 2011).
3.2 China as a following goose: learning and industrial upgrading
China‘s success over the past three decades is the result of a two-pillar strategy: first, adopting a
dual-track approach to reforms, giving transitory protection to old comparative advantage-
defying, capital-intensive sectors and liberalizing entry to comparative advantage-following,
labor-intensive sectors, and thereby achieving both stability and dynamic transformation
simultaneously; second, as a latecomer, choosing an economic development strategy that taps
into the potential advantage of backwardness along the lines of the flying-geese pattern.20
20
For further discussions of these two points, see Justin Yifu Lin, ―China Miracle Demystified,‖ Econometrica
(forthcoming), and Demystifying the Chinese Economy, Cambridge University Press.
39
The industrial development in China after the reform in 1979 is basically following China‘s
comparative advantage or is CAF. In the late 1970s and early 1980s, China‘s per capita income
was less than one-third of the average in Sub-Saharan African countries and Chinese exports
were concentrated in resource-intensive raw materials and primary products, such as crude oil,
minerals, and food and vegetables. Until 1984 nearly 50 percent of China‘s exports were crude
oil and agricultural products (Figure 3.3 below). It had some manufactured exports of which
machinery exports accounted for 5 percent or the total. This was a result of many years of a
Soviet-type CAD strategy which was costly and ineffective.
The first industrial upgrade from resources to labor-intensive products happened in 1986,
when exports of textiles and clothing exceeded crude oil. This point in history signified
China‘s transition from exporting resource-intensive products to labor-intensive textile
and clothing products.
The second upgrade happened in 1995, when China‘s exports of machinery and
electronics exceeded textiles and clothing. This indicated that China has started the
transition from exporting traditional labor-intensive exports to non-traditional labor-
intensive products with higher value added, a fact also shown in Figure 3.3.
2001-present, the third upgrade happened after China‘s accession to the WTO, locking-in
liberalization of trade in goods and services, and making Chinese laws and regulations
conform to international standards. Regulatory reforms led to rapidly rising FDI inflows
bringing new technologies and processes, and as a result, the level of product
sophistication increased. Many exporters have become an integral part of the global
supply chains of multinationals in automobiles and computers. 21
21
There is, however, a myth on the level of export sophistication, which was discussed at length in Koopman, Wang
and Wei (2008), and Lin and Wang 2008. In fact, over 50% of the export in value added were foreign value added,
ie. Goods and services produced by Foreign invested enterprises. Among high-technology goods, over 80% were
exported by foreign invested firms.
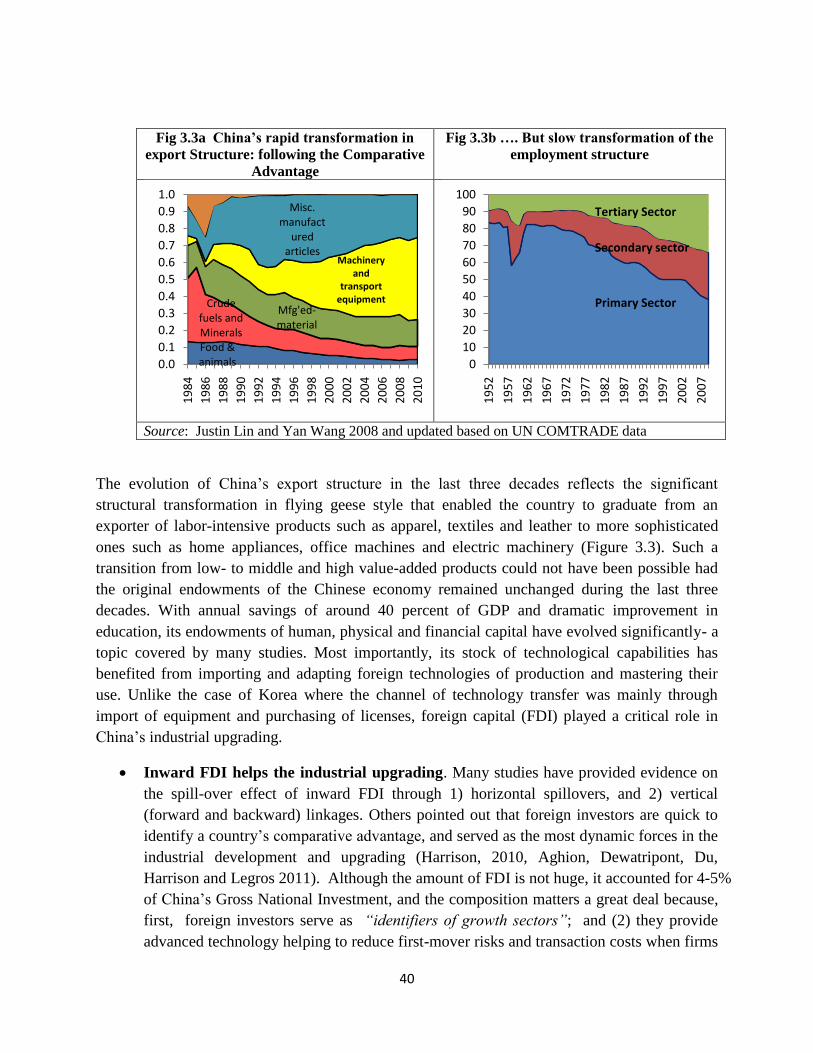
40
Fig 3.3a China’s rapid transformation in
export Structure: following the Comparative
Advantage
Fig 3.3b …. But slow transformation of the
employment structure
Source: Justin Lin and Yan Wang 2008 and updated based on UN COMTRADE data
The evolution of China‘s export structure in the last three decades reflects the significant
structural transformation in flying geese style that enabled the country to graduate from an
exporter of labor-intensive products such as apparel, textiles and leather to more sophisticated
ones such as home appliances, office machines and electric machinery (Figure 3.3). Such a
transition from low- to middle and high value-added products could not have been possible had
the original endowments of the Chinese economy remained unchanged during the last three
decades. With annual savings of around 40 percent of GDP and dramatic improvement in
education, its endowments of human, physical and financial capital have evolved significantly- a
topic covered by many studies. Most importantly, its stock of technological capabilities has
benefited from importing and adapting foreign technologies of production and mastering their
use. Unlike the case of Korea where the channel of technology transfer was mainly through
import of equipment and purchasing of licenses, foreign capital (FDI) played a critical role in
China‘s industrial upgrading.
Inward FDI helps the industrial upgrading. Many studies have provided evidence on
the spill-over effect of inward FDI through 1) horizontal spillovers, and 2) vertical
(forward and backward) linkages. Others pointed out that foreign investors are quick to
identify a country‘s comparative advantage, and served as the most dynamic forces in the
industrial development and upgrading (Harrison, 2010, Aghion, Dewatripont, Du,
Harrison and Legros 2011). Although the amount of FDI is not huge, it accounted for 4-5%
of China‘s Gross National Investment, and the composition matters a great deal because,
first, foreign investors serve as ―identifiers of growth sectors‖; and (2) they provide
advanced technology helping to reduce first-mover risks and transaction costs when firms
Food & animals
Crude fuels and Minerals
Mfg'ed-material
Machinery and
transport equipment
Misc. manufact
ured articles
0.0
0.1
0.2
0.3
0.4
0.5
0.6
0.7
0.8
0.9
1.01
98
4
19
86
19
88
19
90
19
92
19
94
19
96
19
98
20
00
20
02
20
04
20
06
20
08
20
10
0
10
20
30
40
50
60
70
80
90
100
19
52
19
57
19
62
19
67
19
72
19
77
19
82
19
87
19
92
19
97
20
02
20
07
Tertiary Sector
Secondary sector
Primary Sector
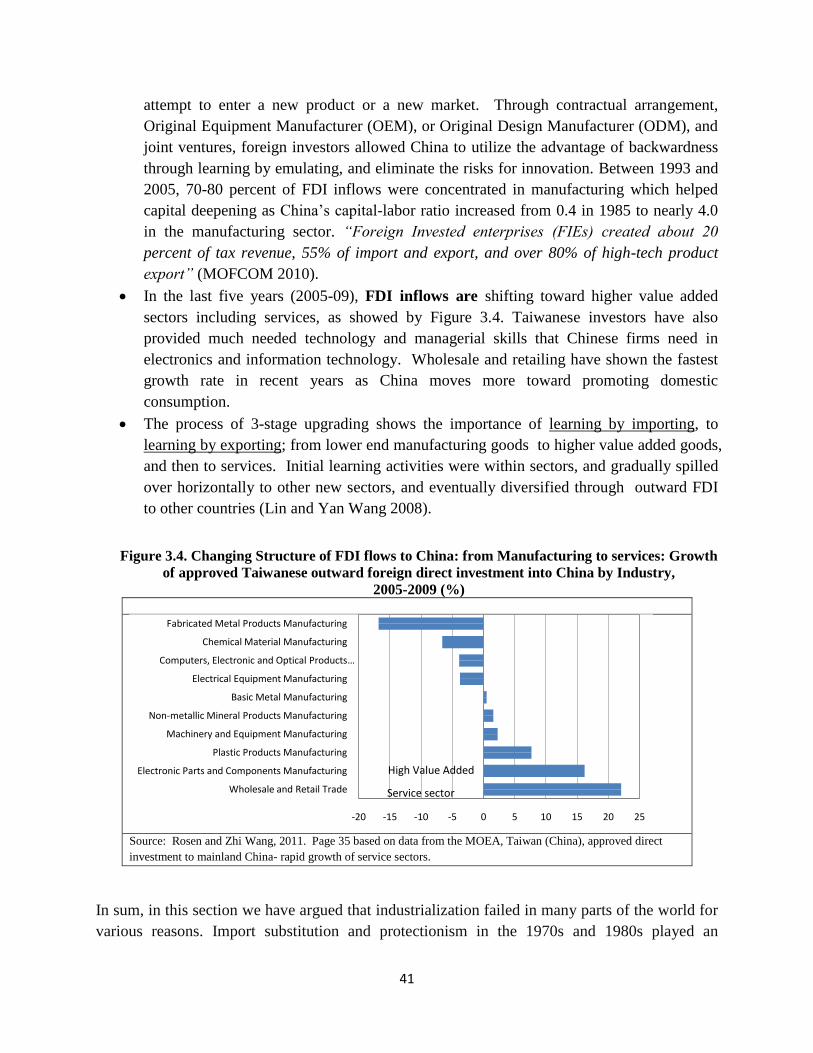
41
attempt to enter a new product or a new market. Through contractual arrangement,
Original Equipment Manufacturer (OEM), or Original Design Manufacturer (ODM), and
joint ventures, foreign investors allowed China to utilize the advantage of backwardness
through learning by emulating, and eliminate the risks for innovation. Between 1993 and
2005, 70-80 percent of FDI inflows were concentrated in manufacturing which helped
capital deepening as China‘s capital-labor ratio increased from 0.4 in 1985 to nearly 4.0
in the manufacturing sector. ―Foreign Invested enterprises (FIEs) created about 20
percent of tax revenue, 55% of import and export, and over 80% of high-tech product
export‖ (MOFCOM 2010).
In the last five years (2005-09), FDI inflows are shifting toward higher value added
sectors including services, as showed by Figure 3.4. Taiwanese investors have also
provided much needed technology and managerial skills that Chinese firms need in
electronics and information technology. Wholesale and retailing have shown the fastest
growth rate in recent years as China moves more toward promoting domestic
consumption.
The process of 3-stage upgrading shows the importance of learning by importing, to
learning by exporting; from lower end manufacturing goods to higher value added goods,
and then to services. Initial learning activities were within sectors, and gradually spilled
over horizontally to other new sectors, and eventually diversified through outward FDI
to other countries (Lin and Yan Wang 2008).
Figure 3.4. Changing Structure of FDI flows to China: from Manufacturing to services: Growth
of approved Taiwanese outward foreign direct investment into China by Industry,
2005-2009 (%)
Source: Rosen and Zhi Wang, 2011. Page 35 based on data from the MOEA, Taiwan (China), approved direct
investment to mainland China- rapid growth of service sectors.
In sum, in this section we have argued that industrialization failed in many parts of the world for
various reasons. Import substitution and protectionism in the 1970s and 1980s played an
-20 -15 -10 -5 0 5 10 15 20 25
Wholesale and Retail Trade
Electronic Parts and Components Manufacturing
Plastic Products Manufacturing
Machinery and Equipment Manufacturing
Non-metallic Mineral Products Manufacturing
Basic Metal Manufacturing
Electrical Equipment Manufacturing
Computers, Electronic and Optical Products …
Chemical Material Manufacturing
Fabricated Metal Products Manufacturing
Service sector
High Value Added
42
important role in delaying it. Trade liberalization occurred eventually but had two unintended
results that further stymied industrialization. One, countries lost competitiveness in old CAD
capital intensive industries and experienced de-industrialization. Second, without adequate
government facilitation in the form of critical public goods, new CAF industries that were
appropriate for the liberalizing countries did not emerge. Through opening and learning by doing,
China has been following its comparative advantage by following the lead geese in East Asia.
But because of the advantage of a large economy, China absorbed almost all the labor-intensive
industries that the lead geese left behind. The local governments played a proactive role in
attracting foreign investments which helped to identify the growth poles and reduce first-mover
risks. Moreover, with government‘s facilitation and as a large economy, China can specialize and
develop industrial agglomerations or zones quickly in many internationally competitive labor-
intensive sectors such as textile, clothing, footwear and toys. Many of the labor-intensive
industries in Japan and in the East Asian Tigers have relocated to China. Moreover, the
industries that are relocating to China have been upgrading, from low-end labor intensive sectors
to higher value added and more sophisticate products and services, as shown in Figure 3.4. In
addition, rapid growth in China and later, India has created a huge demand for resources. These
factors have in the recent years contributed to de-industrialization in some developing countries.
However, all these factors will change as China continues to grow dynamically in the coming
years.
Part 4: The Emergence of Leading Dragons: Potential Relocation of the
Labor Intensive Industries from China and India
4.1 The Leading Dragon Phenomenon
China is at a stage where the Western countries and Japan were in the 1970s, and Korea; Taiwan,
China; Hong Kong SAR, China; and Singapore were in the 1980s. As labor intensive industries
matured, wages increased and firms moved into more technologically sophisticated industries, in
accordance with the upgrading in the underlying endowment structure. In the Western countries
and the Asian Tigers, the shift to service sector as the increase in the capital intensity of
production in manufacturing led to an overall contraction in manufacturing jobs (Figure 4.1).
When labor intensive industries in the high wage countries shut down, their jobs relocated to
other lower wage countries such as the East Asian Tigers. If labor costs in China were to increase
significantly in the next few years, triggering a growing trend for upgrading to higher value-
added, capital-intensive industries, structural transformation would accelerate rather than
slowing down, but with a critical difference. The number of jobs East Asia relocated in China
was a fraction of those China may relocate to other developing countries.
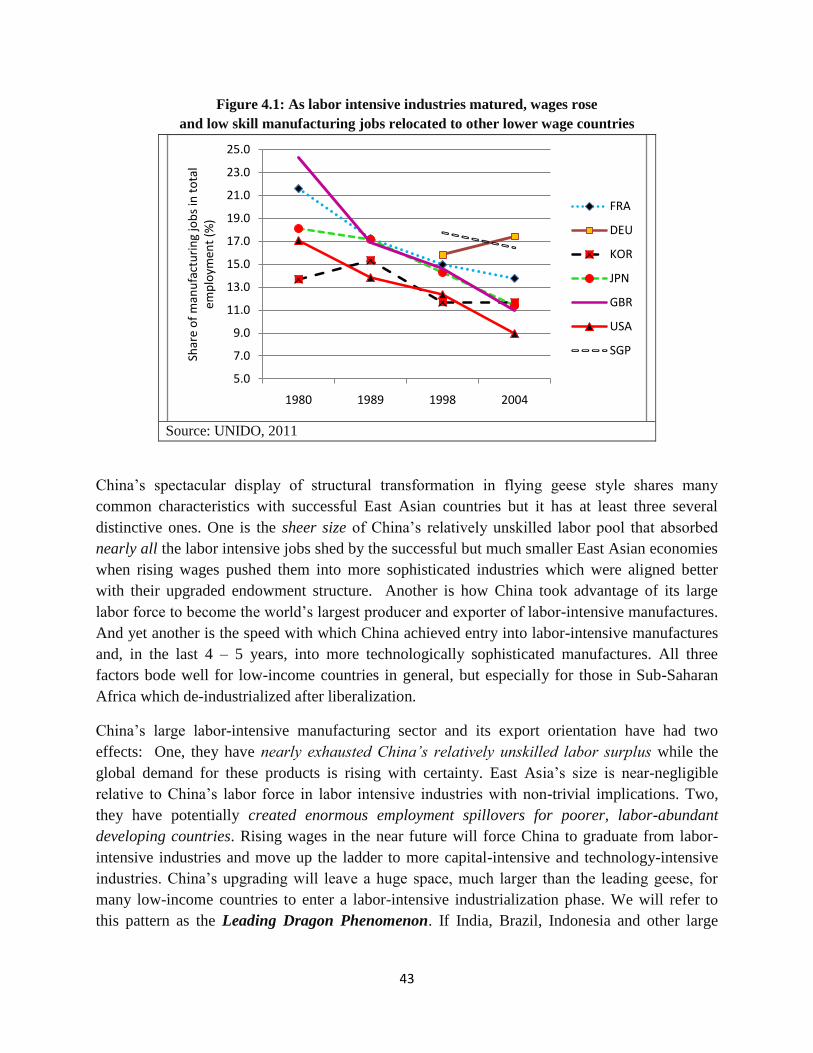
43
Figure 4.1: As labor intensive industries matured, wages rose
and low skill manufacturing jobs relocated to other lower wage countries
Source: UNIDO, 2011
China‘s spectacular display of structural transformation in flying geese style shares many
common characteristics with successful East Asian countries but it has at least three several
distinctive ones. One is the sheer size of China‘s relatively unskilled labor pool that absorbed
nearly all the labor intensive jobs shed by the successful but much smaller East Asian economies
when rising wages pushed them into more sophisticated industries which were aligned better
with their upgraded endowment structure. Another is how China took advantage of its large
labor force to become the world‘s largest producer and exporter of labor-intensive manufactures.
And yet another is the speed with which China achieved entry into labor-intensive manufactures
and, in the last 4 – 5 years, into more technologically sophisticated manufactures. All three
factors bode well for low-income countries in general, but especially for those in Sub-Saharan
Africa which de-industrialized after liberalization.
China‘s large labor-intensive manufacturing sector and its export orientation have had two
effects: One, they have nearly exhausted China’s relatively unskilled labor surplus while the
global demand for these products is rising with certainty. East Asia‘s size is near-negligible
relative to China‘s labor force in labor intensive industries with non-trivial implications. Two,
they have potentially created enormous employment spillovers for poorer, labor-abundant
developing countries. Rising wages in the near future will force China to graduate from labor-
intensive industries and move up the ladder to more capital-intensive and technology-intensive
industries. China‘s upgrading will leave a huge space, much larger than the leading geese, for
many low-income countries to enter a labor-intensive industrialization phase. We will refer to
this pattern as the Leading Dragon Phenomenon. If India, Brazil, Indonesia and other large
5.0
7.0
9.0
11.0
13.0
15.0
17.0
19.0
21.0
23.0
25.0
1980 1989 1998 2004
Shar
e o
f m
anu
fact
uri
ng
job
s in
to
tal
emp
loym
ent
(%)
FRA
DEU
KOR
JPN
GBR
USA
SGP
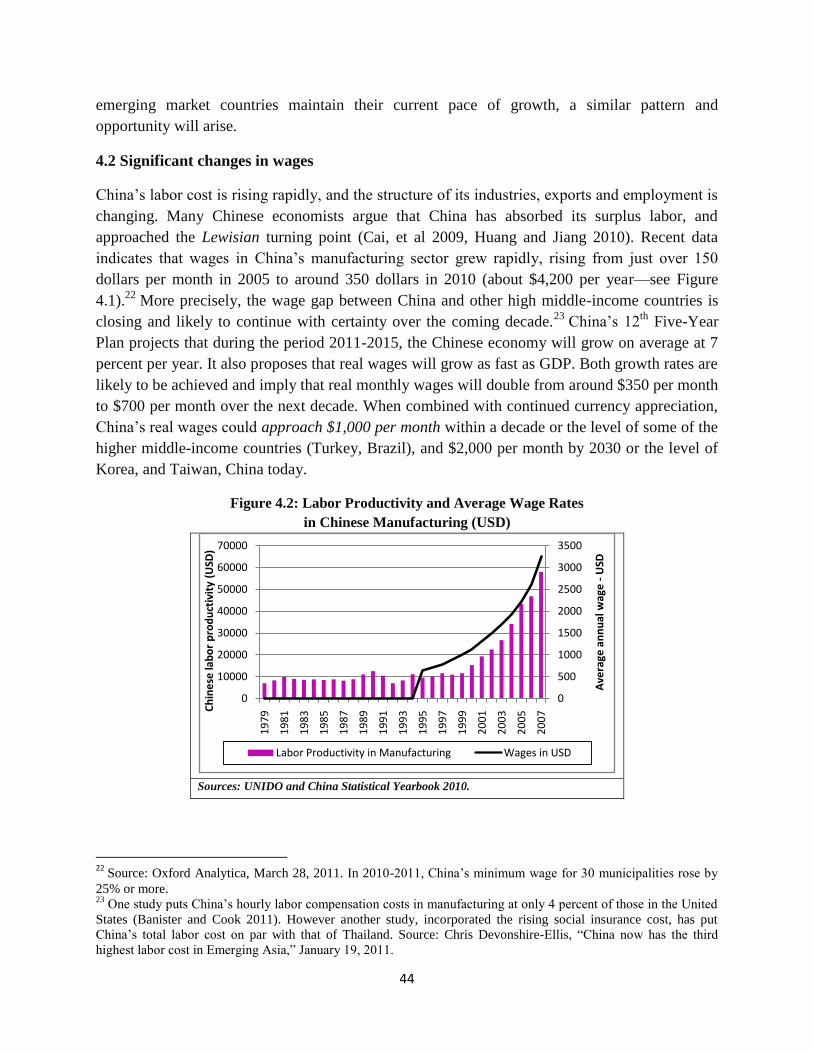
44
emerging market countries maintain their current pace of growth, a similar pattern and
opportunity will arise.
4.2 Significant changes in wages
China‘s labor cost is rising rapidly, and the structure of its industries, exports and employment is
changing. Many Chinese economists argue that China has absorbed its surplus labor, and
approached the Lewisian turning point (Cai, et al 2009, Huang and Jiang 2010). Recent data
indicates that wages in China‘s manufacturing sector grew rapidly, rising from just over 150
dollars per month in 2005 to around 350 dollars in 2010 (about $4,200 per year—see Figure
4.1).22
More precisely, the wage gap between China and other high middle-income countries is
closing and likely to continue with certainty over the coming decade.23
China‘s 12th
Five-Year
Plan projects that during the period 2011-2015, the Chinese economy will grow on average at 7
percent per year. It also proposes that real wages will grow as fast as GDP. Both growth rates are
likely to be achieved and imply that real monthly wages will double from around $350 per month
to $700 per month over the next decade. When combined with continued currency appreciation,
China‘s real wages could approach $1,000 per month within a decade or the level of some of the
higher middle-income countries (Turkey, Brazil), and $2,000 per month by 2030 or the level of
Korea, and Taiwan, China today.
Figure 4.2: Labor Productivity and Average Wage Rates
in Chinese Manufacturing (USD)
Sources: UNIDO and China Statistical Yearbook 2010.
22
Source: Oxford Analytica, March 28, 2011. In 2010-2011, China‘s minimum wage for 30 municipalities rose by
25% or more. 23
One study puts China‘s hourly labor compensation costs in manufacturing at only 4 percent of those in the United
States (Banister and Cook 2011). However another study, incorporated the rising social insurance cost, has put
China‘s total labor cost on par with that of Thailand. Source: Chris Devonshire-Ellis, ―China now has the third
highest labor cost in Emerging Asia,‖ January 19, 2011.
0
500
1000
1500
2000
2500
3000
3500
0
10000
20000
30000
40000
50000
60000
70000
19
79
19
81
19
83
19
85
19
87
19
89
19
91
19
93
19
95
19
97
19
99
20
01
20
03
20
05
20
07
Ave
rage
an
nu
al w
age
-U
SD
Ch
ine
se la
bo
r p
rod
uct
ivit
y (U
SD)
Labor Productivity in Manufacturing Wages in USD
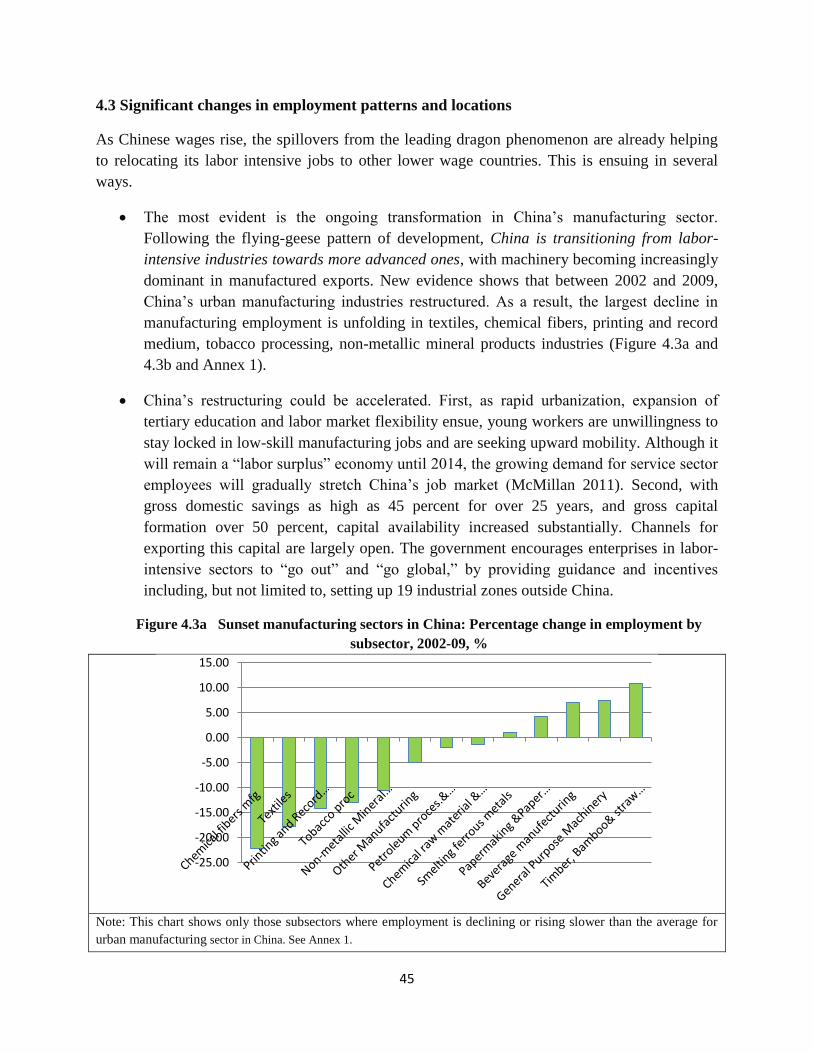
45
4.3 Significant changes in employment patterns and locations
As Chinese wages rise, the spillovers from the leading dragon phenomenon are already helping
to relocating its labor intensive jobs to other lower wage countries. This is ensuing in several
ways.
The most evident is the ongoing transformation in China‘s manufacturing sector.
Following the flying-geese pattern of development, China is transitioning from labor-
intensive industries towards more advanced ones, with machinery becoming increasingly
dominant in manufactured exports. New evidence shows that between 2002 and 2009,
China‘s urban manufacturing industries restructured. As a result, the largest decline in
manufacturing employment is unfolding in textiles, chemical fibers, printing and record
medium, tobacco processing, non-metallic mineral products industries (Figure 4.3a and
4.3b and Annex 1).
China‘s restructuring could be accelerated. First, as rapid urbanization, expansion of
tertiary education and labor market flexibility ensue, young workers are unwillingness to
stay locked in low-skill manufacturing jobs and are seeking upward mobility. Although it
will remain a ―labor surplus‖ economy until 2014, the growing demand for service sector
employees will gradually stretch China‘s job market (McMillan 2011). Second, with
gross domestic savings as high as 45 percent for over 25 years, and gross capital
formation over 50 percent, capital availability increased substantially. Channels for
exporting this capital are largely open. The government encourages enterprises in labor-
intensive sectors to ―go out‖ and ―go global,‖ by providing guidance and incentives
including, but not limited to, setting up 19 industrial zones outside China.
Figure 4.3a Sunset manufacturing sectors in China: Percentage change in employment by
subsector, 2002-09, %
Note: This chart shows only those subsectors where employment is declining or rising slower than the average for
urban manufacturing sector in China. See Annex 1.
-25.00
-20.00
-15.00
-10.00
-5.00
0.00
5.00
10.00
15.00
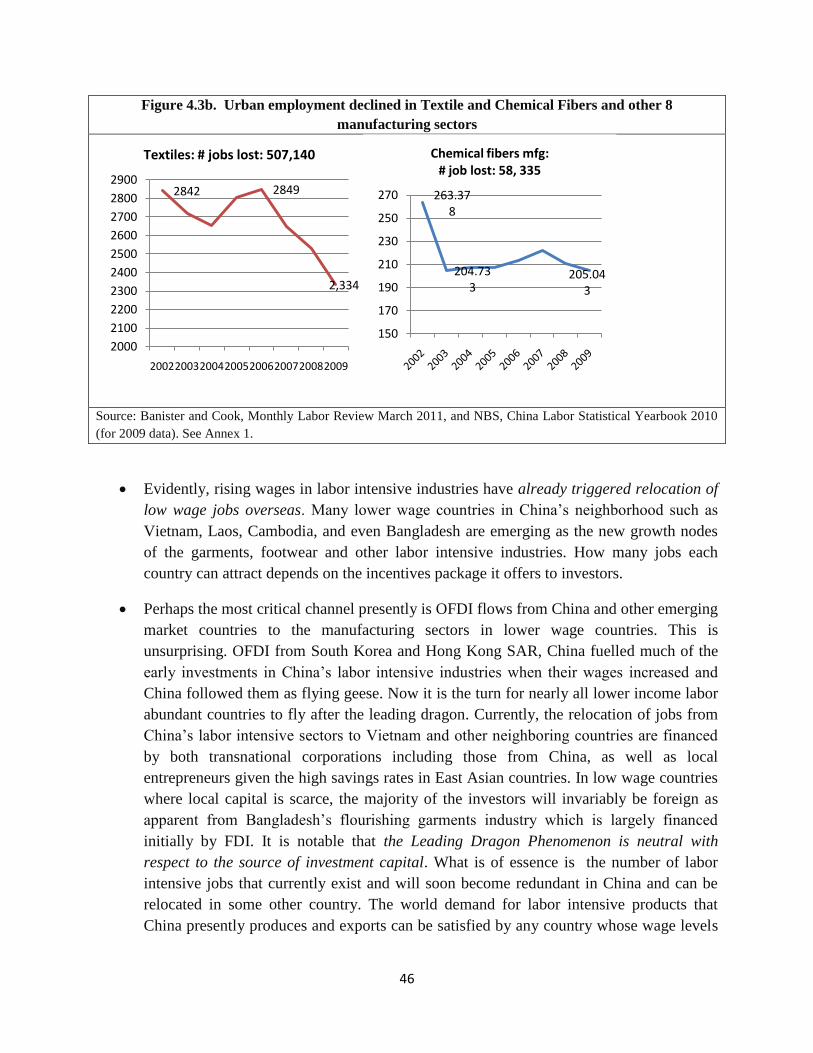
46
Figure 4.3b. Urban employment declined in Textile and Chemical Fibers and other 8
manufacturing sectors
Source: Banister and Cook, Monthly Labor Review March 2011, and NBS, China Labor Statistical Yearbook 2010
(for 2009 data). See Annex 1.
Evidently, rising wages in labor intensive industries have already triggered relocation of
low wage jobs overseas. Many lower wage countries in China‘s neighborhood such as
Vietnam, Laos, Cambodia, and even Bangladesh are emerging as the new growth nodes
of the garments, footwear and other labor intensive industries. How many jobs each
country can attract depends on the incentives package it offers to investors.
Perhaps the most critical channel presently is OFDI flows from China and other emerging
market countries to the manufacturing sectors in lower wage countries. This is
unsurprising. OFDI from South Korea and Hong Kong SAR, China fuelled much of the
early investments in China‘s labor intensive industries when their wages increased and
China followed them as flying geese. Now it is the turn for nearly all lower income labor
abundant countries to fly after the leading dragon. Currently, the relocation of jobs from
China‘s labor intensive sectors to Vietnam and other neighboring countries are financed
by both transnational corporations including those from China, as well as local
entrepreneurs given the high savings rates in East Asian countries. In low wage countries
where local capital is scarce, the majority of the investors will invariably be foreign as
apparent from Bangladesh‘s flourishing garments industry which is largely financed
initially by FDI. It is notable that the Leading Dragon Phenomenon is neutral with
respect to the source of investment capital. What is of essence is the number of labor
intensive jobs that currently exist and will soon become redundant in China and can be
relocated in some other country. The world demand for labor intensive products that
China presently produces and exports can be satisfied by any country whose wage levels
2842 2849
2,334
2000
2100
2200
2300
2400
2500
2600
2700
2800
2900
20022003200420052006200720082009
Textiles: # jobs lost: 507,140
263.378
204.733
205.043
150
170
190
210
230
250
270
Chemical fibers mfg: # job lost: 58, 335
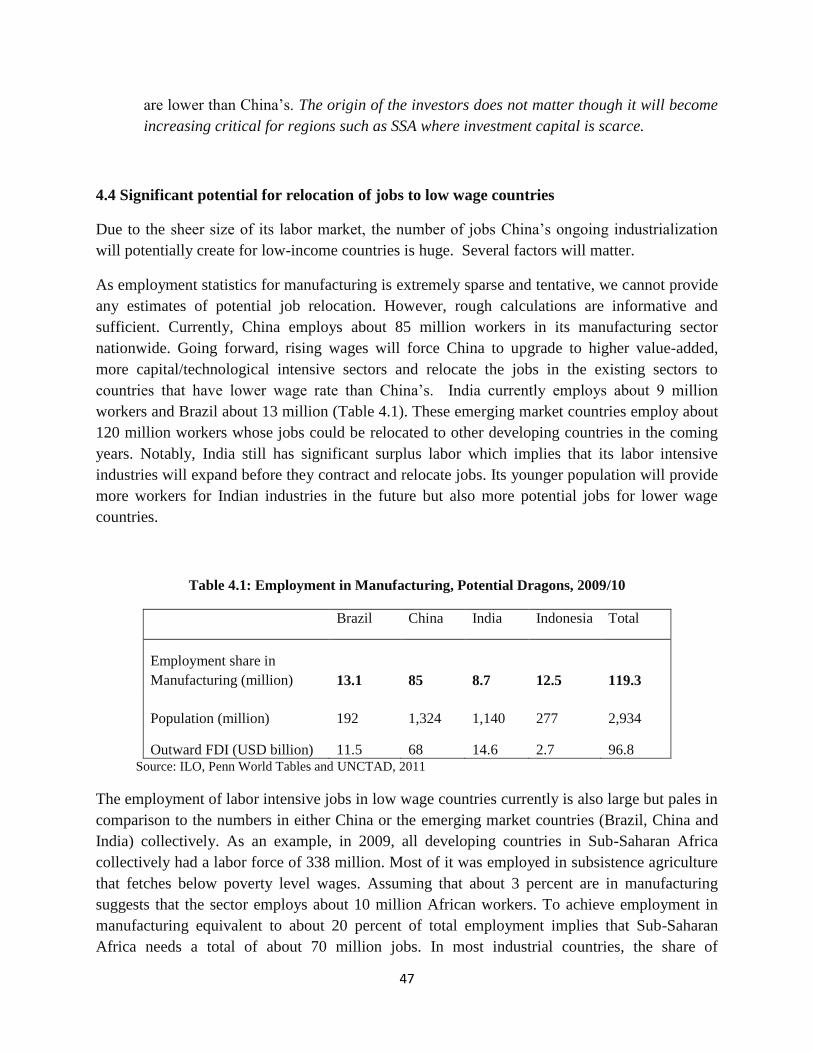
47
are lower than China‘s. The origin of the investors does not matter though it will become
increasing critical for regions such as SSA where investment capital is scarce.
4.4 Significant potential for relocation of jobs to low wage countries
Due to the sheer size of its labor market, the number of jobs China‘s ongoing industrialization
will potentially create for low-income countries is huge. Several factors will matter.
As employment statistics for manufacturing is extremely sparse and tentative, we cannot provide
any estimates of potential job relocation. However, rough calculations are informative and
sufficient. Currently, China employs about 85 million workers in its manufacturing sector
nationwide. Going forward, rising wages will force China to upgrade to higher value-added,
more capital/technological intensive sectors and relocate the jobs in the existing sectors to
countries that have lower wage rate than China‘s. India currently employs about 9 million
workers and Brazil about 13 million (Table 4.1). These emerging market countries employ about
120 million workers whose jobs could be relocated to other developing countries in the coming
years. Notably, India still has significant surplus labor which implies that its labor intensive
industries will expand before they contract and relocate jobs. Its younger population will provide
more workers for Indian industries in the future but also more potential jobs for lower wage
countries.
Table 4.1: Employment in Manufacturing, Potential Dragons, 2009/10
Brazil China India Indonesia Total
Employment share in
Manufacturing (million) 13.1 85 8.7 12.5 119.3
Population (million) 192 1,324 1,140 277 2,934
Outward FDI (USD billion) 11.5 68 14.6 2.7 96.8 Source: ILO, Penn World Tables and UNCTAD, 2011
The employment of labor intensive jobs in low wage countries currently is also large but pales in
comparison to the numbers in either China or the emerging market countries (Brazil, China and
India) collectively. As an example, in 2009, all developing countries in Sub-Saharan Africa
collectively had a labor force of 338 million. Most of it was employed in subsistence agriculture
that fetches below poverty level wages. Assuming that about 3 percent are in manufacturing
suggests that the sector employs about 10 million African workers. To achieve employment in
manufacturing equivalent to about 20 percent of total employment implies that Sub-Saharan
Africa needs a total of about 70 million jobs. In most industrial countries, the share of
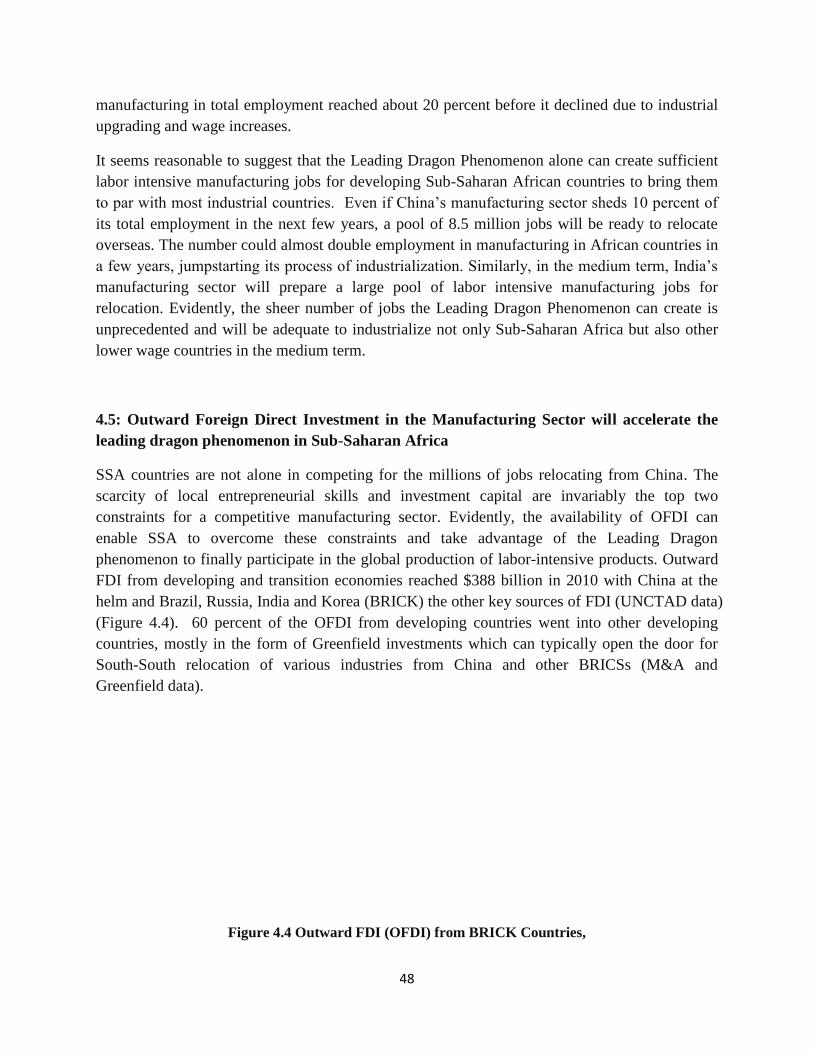
48
manufacturing in total employment reached about 20 percent before it declined due to industrial
upgrading and wage increases.
It seems reasonable to suggest that the Leading Dragon Phenomenon alone can create sufficient
labor intensive manufacturing jobs for developing Sub-Saharan African countries to bring them
to par with most industrial countries. Even if China‘s manufacturing sector sheds 10 percent of
its total employment in the next few years, a pool of 8.5 million jobs will be ready to relocate
overseas. The number could almost double employment in manufacturing in African countries in
a few years, jumpstarting its process of industrialization. Similarly, in the medium term, India‘s
manufacturing sector will prepare a large pool of labor intensive manufacturing jobs for
relocation. Evidently, the sheer number of jobs the Leading Dragon Phenomenon can create is
unprecedented and will be adequate to industrialize not only Sub-Saharan Africa but also other
lower wage countries in the medium term.
4.5: Outward Foreign Direct Investment in the Manufacturing Sector will accelerate the
leading dragon phenomenon in Sub-Saharan Africa
SSA countries are not alone in competing for the millions of jobs relocating from China. The
scarcity of local entrepreneurial skills and investment capital are invariably the top two
constraints for a competitive manufacturing sector. Evidently, the availability of OFDI can
enable SSA to overcome these constraints and take advantage of the Leading Dragon
phenomenon to finally participate in the global production of labor-intensive products. Outward
FDI from developing and transition economies reached $388 billion in 2010 with China at the
helm and Brazil, Russia, India and Korea (BRICK) the other key sources of FDI (UNCTAD data)
(Figure 4.4). 60 percent of the OFDI from developing countries went into other developing
countries, mostly in the form of Greenfield investments which can typically open the door for
South-South relocation of various industries from China and other BRICSs (M&A and
Greenfield data).
Figure 4.4 Outward FDI (OFDI) from BRICK Countries,
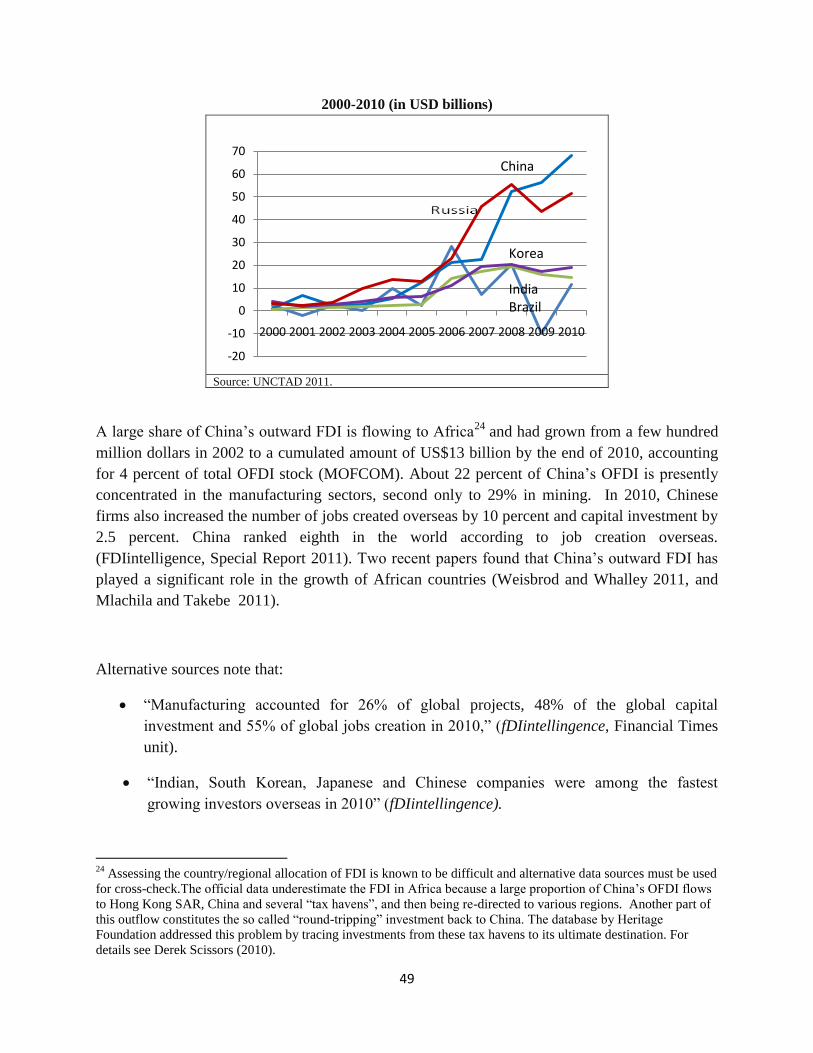
49
2000-2010 (in USD billions)
Source: UNCTAD 2011.
A large share of China‘s outward FDI is flowing to Africa24
and had grown from a few hundred
million dollars in 2002 to a cumulated amount of US$13 billion by the end of 2010, accounting
for 4 percent of total OFDI stock (MOFCOM). About 22 percent of China‘s OFDI is presently
concentrated in the manufacturing sectors, second only to 29% in mining. In 2010, Chinese
firms also increased the number of jobs created overseas by 10 percent and capital investment by
2.5 percent. China ranked eighth in the world according to job creation overseas.
(FDIintelligence, Special Report 2011). Two recent papers found that China‘s outward FDI has
played a significant role in the growth of African countries (Weisbrod and Whalley 2011, and
Mlachila and Takebe 2011).
Alternative sources note that:
―Manufacturing accounted for 26% of global projects, 48% of the global capital
investment and 55% of global jobs creation in 2010,‖ (fDIintellingence, Financial Times
unit).
―Indian, South Korean, Japanese and Chinese companies were among the fastest
growing investors overseas in 2010‖ (fDIintellingence).
24
Assessing the country/regional allocation of FDI is known to be difficult and alternative data sources must be used
for cross-check.The official data underestimate the FDI in Africa because a large proportion of China‘s OFDI flows
to Hong Kong SAR, China and several ―tax havens‖, and then being re-directed to various regions. Another part of
this outflow constitutes the so called ―round-tripping‖ investment back to China. The database by Heritage
Foundation addressed this problem by tracing investments from these tax havens to its ultimate destination. For
details see Derek Scissors (2010).
-20
-10
0
10
20
30
40
50
60
70
2000 2001 2002 2003 2004 2005 2006 2007 2008 2009 2010
Korea
IndiaBrazil
China
50
―Four of the major economies in Asia (China, India, South Korea and Australia)
recorded the largest increases in greenfield FDI overseas in 2010‖ (p.26, Annual Report,
fDIintellingence).
Information on Greenfield investment at the project level shows that India which has a
long tradition of investing overseas since the 1950s, currently invests over 40% of its
OFDI in manufacturing. In the early 1990s, post liberalization reforms, India‘s large and
booming economy and unprecedented access to capital have facilitated the global spread
of Indian firms (Prema-chandra Athukorala, 2009, p146).
In essence, the Leading Dragon phenomenon is already unfolding and given the speed of China‘s
transition to more advanced industries, its acceleration is imminent. How many of the millions of
Chinese labor intensive jobs will relocate to a specific lower income country will be contingent
on which ones offer the most attractive investment climate to investors. The availability of
significant OFDI can accelerate the process of industrial relocation in SSA but other developing
countries with wages lower than China‘s will also be competing fiercely for them.
Part 5. Summary and Implications
The emergence of large middle income countries such as China, and India and Brazil as new
growth poles in the world, and their dynamic growth and ascent up the industrial ladder offer an
unprecedented opportunity to all lower income developing economies especially in Sub-Saharan
Africa to accelerate industrialization and catch-up. This paper tried to explain why.
In addition, this paper argues that:
1. Economic development is a process of continuous industrial and technological
upgrading, and modern economic development is accompanied by the structural
transformation. Empirical evidence indicates that those developing countries that
either failed to catch up or are trapped in a low-income and middle-income status did
not experience structural transformation from an agrarian to an industrial economy.
2. Nearly all countries that industrialized successfully, adopted ‗comparative advantage
following‘ or CAF strategies to tap the late-comer advantage in a flying geese pattern.
Successful industrialization in Japan before 1900, the ―passing of torch‖ from the US
to Japan after the WWII, the rapid catch-up of East Asian NIEs, the ASEAN 4 and
late comers such as China and Vietnam have all followed the flying geese pattern,
albeit to varying degrees.
51
3. The flying geese pattern failed in Latin America and South Asia because their
governments adopted the prevailing structuralist paradigm that advocated an import
substitution-driven industrialization strategy which encouraged them to develop
‗comparative advantage defying‘ or CAD industries similar to those in the high-
income industrialized countries. The East Asian successful countries also leveraged
import substitution-driven industrialization but ensured that the industries they
protected were their latent comparative advantage. This enabled them to leverage an
export-led growth strategy of industrialization that helped them to start closing the
income gap with the developed countries.
4. This paper provide evidence that not only industries are jumping across borders, they
industries that are ―jumping‖ are also upgrading. In the late 1970s and 1980s, for
China, the lead geese were the East Asian Tigers. When wages increased, East Asia‘s
labor intensive industries relocated many jobs to China. However, China‘s pattern of
development has several distinctive features. Its significantly larger economy was
able to absorb nearly all labor-intensive jobs that the lead East Asian geese shed and
become the world‘s largest producer and exporter of labor-intensive products.
Moreover, as Korea and Taiwan are upgrading, the industries that are relocating to
China are also ascending to higher-end products. In a fraction of the time it took
Japan and the East Asian Tigers, China has been able to replace simple labor
intensive products with more sophisticated ones.25
This is enabled by a government
that fosters CAF industries.
5. The dynamic growth, high savings and substantial investments in education have
triggered a rapid upgrading of China‘s factor endowments for more technologically
advanced industries. This is pushing up wages at an amazing rate since 2002 and
causing labor intensive industries to contract. China has an estimated 85-100 million
workers in manufacturing, with most of them in labor intensive industries or labor-
intensive segments of capital-intensive industries. As these industries shed labor, they
will create a huge opportunity for lower wage countries to start labor intensive
manufacturing products. This process, which we call the Leading Dragon
Phenomenon, will offer millions of labor intensive job opportunities to many
developing countries. Prevailing thinking purports that China‘s dominance in global
labor intensive product markets constrains the development of similar industries in
poor countries. We argue that the Leading Dragon Phenomenon provides an
extraordinary opportunity for many lower wage countries to embark on a labor-
25
In those sophisticated industries, China‘s production concentrates mostly in the labor-intensive processing
segments. The possibility for China to enter those sophisticated industries is because of the emergence of global
production network as a result of reduction in information and transportation costs.
52
intensive industrialization phase. If India, Brazil, Indonesia and other large MICs
maintain their current pace of growth, a similar pattern and employment space will
arise. The Leading Dragon Phenomenon alone is almost sufficient to double the total
manufacturing employment of 10 million workers in Sub-Saharan Africa when only
10 percent of Chinese jobs relocate to the Continent. If Brazil and India follow suit,
the total will be sufficient for Africa and other low wage countries.
6. How likely is the Leading Dragon phenomenon? Evidently, Chinese labor intensive
industries are already scaling back and many have had negative employment growth
in recent years. More than half of China‘s export basket is comprised of medium and
high tech technology and skill intensive products. Several lower wage countries in
East and South Asia have already been successful in attracting some of the industries
from China, much as it did from East Asia. These industries have been financed
through a combination of local and foreign investment.
7. The Leading Dragon phenomenon holds the greatest promise of industrialization for
low wage countries of SSA where the industrial sector is largely underdeveloped, and
investment capital and entrepreneurial skills are the leading constraints to
manufacturing. Recent and fairly significant OFDI flows from mostly large
developing countries such as China, India and Brazil are increasingly flowing into the
manufacturing sectors of other developing countries, including some to SSA. We
argue that SSA governments have a unique opportunity to attract larger volumes of
OFDI which has the vantage of resolving speedily both the investment capital and
entrepreneurial skills constraints, and seize some of the jobs created by the Leading
Dragon phenomenon. Of course, other lower wage countries in other regions will be
vying to do the same.
8. Low-income countries must compete to gain access to capital, technology and
capacity development opportunities. If they have the right policy framework, the
industrial upgrading in large emerging market economies, especially China, would
provide them a golden opportunity for a dynamic manufacturing sector-led growth in
the years to come.
In an increasingly globalized world, opportunities for economic transformation abound. The
emergence of a multipolar world is a blessing for even the most backward economies- because it
provides them the opportunities to enter a new age of rapid industrialization and structural
transformation. Clearly, the opportunities ahead for African labor-intensive economies, which

53
are currently exporting mostly minerals, are enormous—provided that they quickly formulate
and implement credible economic development strategies that are consistent with their
comparative advantage. However, the actual benefit for countries and regions depends very
much on the right policy environment, institutions and implementation capacities. Countries
must compete to gain access to capital, technology and capacity development opportunities.
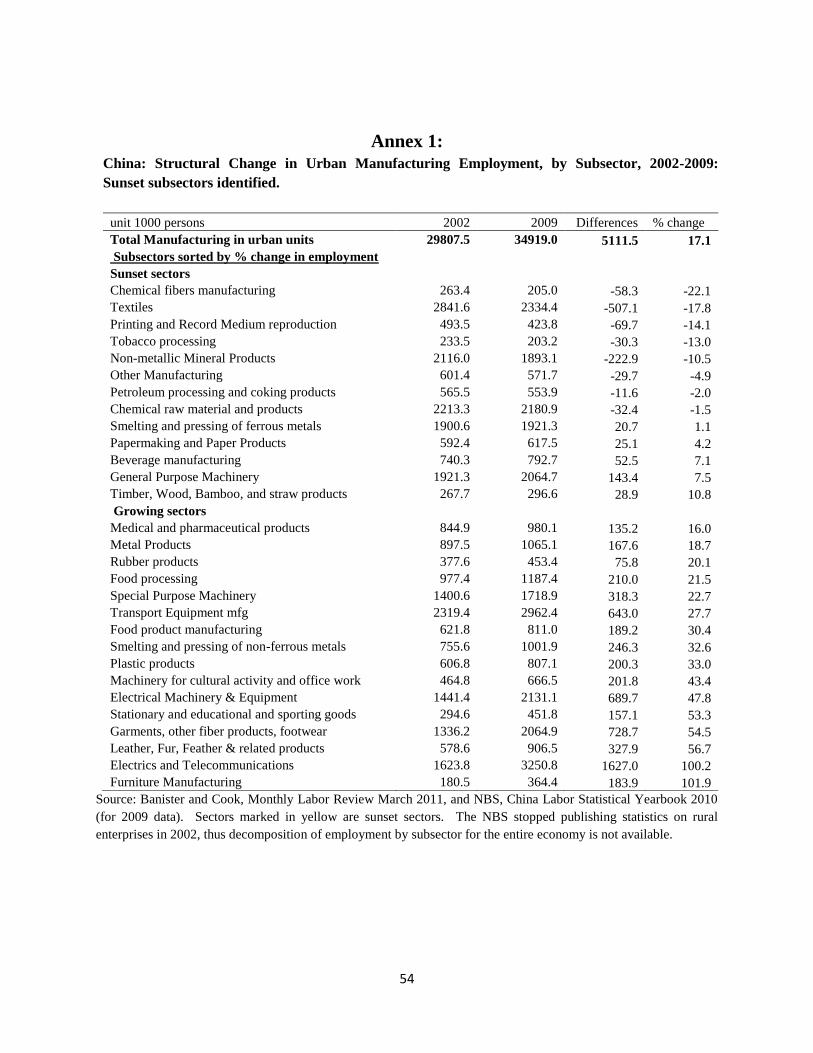
54
Annex 1: China: Structural Change in Urban Manufacturing Employment, by Subsector, 2002-2009:
Sunset subsectors identified.
unit 1000 persons 2002 2009 Differences % change
Total Manufacturing in urban units 29807.5 34919.0 5111.5 17.1
Subsectors sorted by % change in employment
Sunset sectors
Chemical fibers manufacturing 263.4 205.0 -58.3 -22.1
Textiles 2841.6 2334.4 -507.1 -17.8
Printing and Record Medium reproduction 493.5 423.8 -69.7 -14.1
Tobacco processing 233.5 203.2 -30.3 -13.0
Non-metallic Mineral Products 2116.0 1893.1 -222.9 -10.5
Other Manufacturing 601.4 571.7 -29.7 -4.9
Petroleum processing and coking products 565.5 553.9 -11.6 -2.0
Chemical raw material and products 2213.3 2180.9 -32.4 -1.5
Smelting and pressing of ferrous metals 1900.6 1921.3 20.7 1.1
Papermaking and Paper Products 592.4 617.5 25.1 4.2
Beverage manufacturing 740.3 792.7 52.5 7.1
General Purpose Machinery 1921.3 2064.7 143.4 7.5
Timber, Wood, Bamboo, and straw products 267.7 296.6 28.9 10.8
Growing sectors
Medical and pharmaceutical products 844.9 980.1 135.2 16.0
Metal Products 897.5 1065.1 167.6 18.7
Rubber products 377.6 453.4 75.8 20.1
Food processing 977.4 1187.4 210.0 21.5
Special Purpose Machinery 1400.6 1718.9 318.3 22.7
Transport Equipment mfg 2319.4 2962.4 643.0 27.7
Food product manufacturing 621.8 811.0 189.2 30.4
Smelting and pressing of non-ferrous metals 755.6 1001.9 246.3 32.6
Plastic products 606.8 807.1 200.3 33.0
Machinery for cultural activity and office work 464.8 666.5 201.8 43.4
Electrical Machinery & Equipment 1441.4 2131.1 689.7 47.8
Stationary and educational and sporting goods 294.6 451.8 157.1 53.3
Garments, other fiber products, footwear 1336.2 2064.9 728.7 54.5
Leather, Fur, Feather & related products 578.6 906.5 327.9 56.7
Electrics and Telecommunications 1623.8 3250.8 1627.0 100.2
Furniture Manufacturing 180.5 364.4 183.9 101.9
Source: Banister and Cook, Monthly Labor Review March 2011, and NBS, China Labor Statistical Yearbook 2010
(for 2009 data). Sectors marked in yellow are sunset sectors. The NBS stopped publishing statistics on rural
enterprises in 2002, thus decomposition of employment by subsector for the entire economy is not available.
55
References:
Ahearne, Alan G., John G. Fernald, Prakash Loungani, John W. Schindler 2006. ―Flying Geese or Sitting
Ducks: China‘s Impact on the Trading Fortunes of other Asian Economies‖ Board of Governors of the
Federal Reserve System, International Finance Discussion Papers, no. 887. Dec 2006.
Arthukorala, Prema-chandra, 2009 ―Outward Foreign Direct Investment from India‖ Departmental
Working Papers 2009-14, Australian National University, Department of Economics.
Barro, R. J., & Lee, J. W. 2001. International data on educational attainment: updates and implications.
Oxford Economic Papers , 53, 541-563.
Centre for Chinese Studies (CCS), 2011. ―Assessing China‘s FDI in Southern Africa‖.
Cai, Fang, Du Yang, and Wang Meiyan. 2009. ―Employment and Inequality Outcomes in China‖,
Institute of Population and Labour Economics, Chinese Academy of Social Sciences; paper presented to
OECD conference.
Davis, Steven J., R. Jason Faberman and John Haltiwanger 2006. ―The Flow Approach to Labor Markets:
New Data Sources and Micro-Macro Links. Journal of Economic Perspectives, 20(3): 3-26.
Depew, Chauncey (ed.), One Hundred Years of American Commerce 1795-1895 p 111.
Farole, T., 2011. Special Economic Zones in Africa: Comparing Performance and Learning from Global
Experiences, Washington D.C., World Bank.
FIAS, 2008. Special Economic zones: Performance, Lessons Learned, and Implications for zone
Development, Washington D.C., IFC-World Bank.
Gerschenkron, Alexander, 1962. Economic Backwardness in Historical Perspective, a book of essays.
Cambridge, Mass.: Belknap Press of Harvard University Press.
Gelb, Stephen, 2006. ―South-South Investment: The Case of Africa‖ chapter 16, in Africa in the World
Economy - The National, Regional and International Challenges Fondad, The Hague, December 2005,
www.fondad.org
Gill, Indermit, Homi Kharas. 2007. ―An East Asian Renaissance: Ideas for Economic Growth.‖ The
World Bank Publications.
Gorg, Holger and Strobl, Eric. 2003. 'Footloose' Multinationals?. The Manchester School, Vol. 71, pp. 1-
19, 2003. Available at SSRN: http://ssrn.com/abstract=381648
N. Haraguchi and G. Rezonja, 2010, In Search of General Patterns of Manufacturing Development,
UNIDO, Working Paper 02/2010.
Harrison, A. and Rodríguez-Clare, A., 2010, ―Trade, Foreign Investment, and Industrial Policy for
Developing Countries‖, in D. Rodrik ed. Handbook of Economic Growth, Vol. 5. pp. 4039-4213.
Huang, Yiping and Jiang Tingsong. 2010. ―What does the Lewis Turning Point mean for China: a
Computable General Equilibrrium analysis.‖ CCER working paper E2010005, Peking University.
Hughes, H. and A.O. Krueger. 1983. ― Effects of Protection in Developed Countries in Developing
Countries‘ Exports of Manufactures.‖ Essay.
Imbs, J., and R. Wacziarg, 2003., ―Stages of Diversification,‖ American Economic Review, 93(1), 63-86.
Ito, Takatoshi. 1992. The Japanese Economy, The MIT Press, Cambridge, MA, London England.
J. Ju, J.Y. Lin, and Y. Wang, ―Endowment Structure, Industrial Dynamics, and Economic Growth,‖
manuscript.
56
Kim, L. 1997. Imitation to Innovation: The Dynamics of Korea's Technological Learning. Harvard
Business School Press.
Koopman, Robert, Zhi Wang and Shang-jin Wei. 2008. ―How Much of Chinese Export Is Really Made in
China: Assessing Domestic Value-Added when Processing Trade Pervasive,‖ NBER Working Paper
14109, National Bureau of Economic Research, Cambridge, Massachusetts.
Krueger, A. O. (1978). Foreign Trade Regimes and Economic Development: Liberalization Attempts and
Consequences. Volume X. Ballinger Publishing Company. Cambridge, Massachusetts.
Krueger, A. O. (1983). Trade and Development in Developing Countries: Synthesis and Conclusions,
University of Chicago Press, Chicago and London.
Krueger, A. O. (1997). Korean Industry and Trade over Fifty Years. In D.-S. Cha, K. S. Kim, & D. H.
Perkins (Eds.), The Korean Economy 1945-1995: Performance and Vision for the 21st Century (pp. 293-
338). Korea Development Institute .
Kumagai, Satoru 2008. ―A journey through the Secrete History of the Flying Geese Model‖, Institute of
Developing Economies (IDE) Discussion paper 158. June 2008.
Kuznets, Simon. 1930. Secular Movements in Production and Prices.
Kuznets, S., 1966. Modern Economic Growth: Rate, Structure and Spread, New Haven, CT and London:
Yale University Press.
Kwan, C.H. (2002), ―The Rise of China and Asia‘s Flying-Geese Pattern of Economic Development: An
Empirical Analysis Based on US Import Statistics‖ The Research Institute of Economy, Trade and
Industry (RIETI) Discussion Paper Series 02-E-009, July.
Lim, W. (2011). Joint Discovery and Upgrading of Comparative Advantage: Lessons from Korea's
Development Experience. In S. Fardoust, Y. Kim, & C. Sepulveda (Eds.), Postcrisis Growth and
Development (pp. 173-226). Washington DC: World Bank.
Lin, Justin Yifu. 1995, ―The Needham Puzzle: Why the Industrial Revolution Did Not Originate in
China?" Economic Development and Cultural Change 41 (January 1995): 269-92.
-------, 2009, Economic Development and Transition: Thought, Strategy and Viability (Marshall
Lectures), Cambridge University Press.
-------, 2011a, ―A Global Economy with Multiple Growth Poles.‖ In Post-Crisis Growth and
Development: A Development Agenda for the G-20, eds. Shahrokh Fardoust, Yongbeom Kim, and
Claudia Sepulveda, 77-105. Washington, DC: The World Bank.
--------, 2011b, ―From Flying Geese to Leading Dragons: New Opportunities and Strategies for Structural
Transformation in Developing Countries,‖ UNU-WIDER annual lecture, Maputo: Mozambique.
---------, ―New Structural Economics: A Framework for Rethinking Economic Development.‖ World
Bank Research Observer, no. 2, Vol. 26, pp. 193-221.
---------,2011d, Dialogue on Economics Methodology. New York: Cengage.
Lin, Justin Yifu, Cai Fang, and Li Zhou. 2003 China‘s Miracle: Development Strategy and Economic
Reform(revised edition), Hong Kong: Chinese University Press, 2003 Shanghai: Shanghai Sanlian Press,
First Chinese edition, 1994;First English edition, The Chinese University of Hong Kong Press, 1996.
Lin, Justin Yifu. 2010. Demystifying the Chinese Economy. Manuscript.
Lin, J., & Chang, H.-J. (2009). DPR Debate: Should Industrial Policy in Developing Countries Conform
to Comparative Advantage or Defy it? A Debate Between Justin Lin and Ha-Joon Chang. Development
Policy Review , 27 (5), 483-502.
57
Lin, J. Y., and C. Monga. 2011. ―Growth Identification and Facilitation: The Role of the State in the
Dynamics of Structural Change.‖ Development Policy Review 29 (3): 264–90.
Lin, Justin Yifu and Yan Wang, 2008. ――China‘s Integration with the World: Development as a process of
Learning and Industrial Upgrading‖, World Bank Policy Working paper 4799. December 2008.
Lipsey, Robert E., Eric D. Ramstetter and Mangus Blomstrom. "Outward FDI And Apparent Exports And
Employment: Japan, The United States, And Sweden," Global Economy Journal, 2000, v1(4,Oct), Article
1.
Maddison, Angus, 1982, Phases of Capitalist Development, Oxford University Press.
Maddison, Angus, 2007, Dynamics of Development in the New China, and Problems and Prospects: The
Outlook for China and the World Economy, 2003–2030, Chapter 3 and Chapter 4 of Chinese Economic
Performance in the Long Run, OECD Development Center Studies
Maswana, Jean Claude 2011. ―Emerging Patterns in Sino-African Trade and Potentials for Enterprise
Development‖, paper presented at the China-OECD/DAC Study Group, Conference at Addis Ababa,
February 2011.
Mlachila, Montfort, and Misa Takebe. 2011 ―FDI from BRICs to LICs: Emerging Growth Driver?‖ IMF
Working paper 11/178. http://www.imf.org/external/pubs/ft/wp/2011/wp11178.pdf
Monga, C., 2011. ―Shifting Gears: Igniting Structural Transformation in Africa,‖ Journal of African
Economies, forthcoming.
Prebisch, Raul, 1950, The Economic Development of Latin America and its Principle Problems, United
Nations: New York.
Rostow, W.W. 1960. The Stage of Economic Growth: A non-communist manifesto. First published in
1960, second edition 1971, and third edition 1990, Cambridge University Press.
Rodriguez-Clare, A., 2005. Clusters and Comparative Advantage: Implications for Industrial Policy,
Working Paper no. 523, Washington D.C., Inter-American Development Bank.
Schott, Peter. 2003 ―One Size fits all? Heckscher-Ohlin Specialization in Global Production,― American
Economic Review 93(3) 686-708.
Shimposha, Toyo Keizai. 2000. Chapter 5 in ―Globalization of Developing Countries: Is Autonomous
Development Possible?‖ (Tojokoku no Globalization: Jiritsutechi Hatten wa Kanoka).
State Council, China, 2010. White Paper on ―China-Africa Economic Cooperation‖. Oct 2010.
http://news.xinhuanet.com/english2010/china/2010-12/23/c_13661632.htm
Spence, Michael. 2011. The Next Convergence: The Future of Economic Growth in A Multispeed World.
New York: Farrar, Straus and Giroux.
Suh, J. (2007). Overview of Korea's Development Process until 1997. In J. Suh, & D. H. Chen (Eds.),
Korea as a Knowledge Economy (pp. 17-46). Washington DC: World Bank.
The Committee for the Sixty Year History of the Korean Economy. (2010). The Korean Economy: Six
Decades of Growth and Development: II Industry. (in Korean).
The Ministry of Finance & Korea Development Bank. (1993). Three Decades History of the Introduction
of Foreign Capital. (in Korean).
UNCTAD (2011). Economic Development in Africa – Fostering Industrial Development in Africa in the
New Global Environment, Special Report, UNCTAD/UNIDO. New York and Geneva.
Weisbrod, Aaron and John Whalley 2011. ―The Contribution of Chinese FDI to Africa‘s Pre-Crisis
Growth Surge.‖ NBER Working paper 17544. October 2011.
58
World Bank. (1987). Korea Managing the Industrial Transition. Washington, DC: World Bank.
World Bank, 1993, East Asian Miracle, The World Bank: Washington D.C.
World Bank, 2008. The Growth Report: Strategies for Sustained Growth and Inclusive Development,
Washington, DC: the World Bank.
World Bank, 2009. World Development Report: Reshaping Economic Geography, Washington D.C.
World Bank, 2011, Global Development Horizons 2011—Multipolarity: The New Global Economy,
World Bank: Washington D.C.
Zoellick, Robert. 2010. ―Democratizing Development Economics,‖ Speech at Georgetown University,
September 29, 2010.