leading indicators of goodwill impairment
TRANSCRIPT

Leading Indicators of Goodwill Impairment
Carla Hayn and Pat Hughes*
June 2005
____________________ * The authors are at The Anderson School of Management, University of California-Los Angeles. We thank the participants at workshops at University of British Columbia, Emory University, Georgetown University, Pennsylvania State University, University of California-Los Angeles and Vanderbilt University for comments on this paper.

Leading Indicators of Goodwill Impairment
This paper examines whether currently available financial disclosures on acquired entities allow investors to effectively predict goodwill impairment, a task that has become more important following the recent abolishment of goodwill amortization. We track the performance of acquired companies through time from the year of the acquisition, using performance measures of the operating segment to which the acquired company’s assets are allocated as well as characteristics of the acquisition. We find that available disclosures do not provide financial statement users with information to adequately predict future write-offs of goodwill. Further, the characteristics of the original acquisitions are more powerful predictors of eventual goodwill write-offs than those based on segment disclosures of the acquired entities’ performance. On average, goodwill write-offs lag behind the economic impairment of goodwill by an average of three to four years. For a third of the companies examined, the delay can extend up to ten years.
Key Words: Financial Accounting Standard No. 142, Goodwill, Impairment, Acquisitions,
Mergers, Intangible Assets, Write-offs, Write-downs, Announcement Period Returns, Bankruptcy Prediction, Segment Reporting

Leading Indicators of Goodwill Impairment
1. Introduction
SFAS 142, Goodwill and Other Intangible Assets, eliminates goodwill amortization,
requiring instead that goodwill be evaluated annually for possible impairment. The shift from
amortization to periodic reviews puts a new and continuous responsibility on management to
determine the fair value of goodwill and a new burden on auditors, regulatory bodies and investors
to evaluate management’s determination. Auditors’ exposure to legal liability may increase as they
will now have to examine the reasonableness of impairment decisions by management in each
reporting period. This added burden is of great concern to auditors since a defensible audit
involves more than simply verifying the calculations of present value and conformity of the
valuation procedures to those prescribed in the Statement.1 The elimination of goodwill
amortization also makes investors’ need to evaluate goodwill more compelling since there is no
longer a systematic mechanism whereby the balance of goodwill is systematically written down.
The elimination of goodwill amortization by SFAS 142 coincided with the abolishment of
the pooling-of-interests method by SFAS 141, Business Combinations. The combined effects of
these new standards is to increase the weight of goodwill, an already prominent asset on the
balance sheet of corporations, 2 making the need to properly evaluate goodwill by management,
auditors and investors more essential.
The objective of this study is to determine whether investors and auditors are capable of
assessing the value of goodwill based on the available information. Specifically, we examine
whether financial disclosures on the post-acquisition performance of the acquired entity are
sufficient to adequately predict goodwill impairment. Given the recency of the enactment of SFAS
142, it is not possible within this reporting regime to track firms over a sufficient number of years
from the time of the acquisition to determine whether or not the associated goodwill is eventually
written off. Our tests are thus based on a sample of acquisitions made over the period 1988-1998
1 Former chief accountant of the SEC, Lynn Turner commented on auditors’ greater burden under SFAS 142: “The (SEC) will expect that each and every valuation be completed using appropriate assumptions and the conclusions reached (be) both reasonable and supportable. The auditors must ensure that they audit the key assumptions for reasonableness and consistency and challenge the conclusions reached” (U.S. Securities Exchange Commission (2001)). Also, see McGavock (2002). Lewis et al. (2001) discusses some of the concerns raised by auditors and accountants about SFAS 142. 2 In 1988, about one-fifth of the firms on Compustat reported a positive goodwill balance. By 2001, over 40% reported a positive balance. The magnitude of goodwill has similarly increased. In 1988, the mean (median) value of goodwill to total assets was 10.7% (6.6%); by 2001 this had grown to a mean (median) value of 16.8% (10.8%).
where the goodwill disclosures very closely resemble those required by the new statement. To
ensure that the disclosures by the acquiring firms in this sample are representative of the SFAS
142 disclosures, we follow these firms forward in time through 2004, tracking their goodwill
disclosures. In over 90% of the cases, the reporting units to which goodwill was assigned under
SFAS 142 were identical to the line-of-business segment assignments of the earlier years. Further,
goodwill that existed in the earlier years and that was not written off continued to be assigned to
the same segment/reporting unit following the adoption of SFAS 142.
Tracing the goodwill of these acquiring firms forward in time from the acquisition year to
the write-off year (if any) provides a rich testing ground to examine the trigger points for
goodwill write-offs. Developing a write-off prediction model that incorporates both acquisition
characteristics as well as measures of the acquired entity’s post-acquisition performance, we are
able to examine both the predictability and timing of write-offs adding to the body of literature on
management action3
Predicting goodwill impairment highlights situations where goodwill should be written
down. Even though goodwill represents just one individual asset on the balance sheet, its valuation
is an important input into the assessment of the level and uncertainty of future cash flows of the
firm as a whole. The ability to make an independent determination of goodwill’s value, apart from
that provided by management, is important for investors, auditors and regulators. Such a
determination allows investors to make inferences about management’s reporting quality. A
determination of situations where goodwill is likely to be impaired is part of the auditors’
analytical review. Detecting instances where impaired goodwill is kept intact on the books is
important to the SEC in screening the financial reports of registrants for a closer examination.
Finally, because of the importance of an independent assessment of goodwill to parties outside the
firm, the FASB has an ongoing interest in ensuring that financial disclosures provide sufficient
information to enable users to determine if the reported goodwill has become impaired.
Our findings suggest that SFAS 142 was indeed needed; prior to this standard, reliable
identification of the assignment of the acquired business within the acquiring firm’s operations
was possible only in about 50% of the cases. This identification has become only marginally
easier under the new segment reporting disclosures required as of 1997 by SFAS 131. While
SFAS 142 does correct some disclosure deficiencies, the standard may not go far enough. Even for 3 See Aboody, Barth and Kasznik (2004) who estimate the likelihood of voluntary stock-based compensation expense recognition under SFAS 123.
2

acquisitions where the assignment of goodwill to a particular segment or segments could be
traced, consistent with the disclosure requirements of SFAS 142, the predictive power of our
goodwill write-off models, which appear to proxy well for investors’ expectations, is modest and
much weaker than that of corresponding models used to predict failures at the firm level. Even this
modest predictive power is not due to financial data about the performance of the acquired entity
but rather to historical information on the acquisition characteristics.
These results substantiate the concerns expressed by many respondents to the two exposure
drafts that preceded SFAS 142 regarding the difficulties of attributing the goodwill to reporting
units.4 They also suggest that investors need better, more detailed disclosures on the performance
of acquired businesses subsequent to their acquisition, disclosures that are only partially provided
by the current segment reporting requirements and the new goodwill disclosure rules.
In order to assess the fair value of goodwill and its evolvement over time, more specific
information on the performance of the operating unit to which the goodwill belongs is needed.
Identifying reporting units and assigning goodwill to them has proven to be one of the most
difficult implementation issues of SFAS 142, raising concerns by both preparers and users of
financial statements regarding the complexity, cost and inconsistency of this process.5
Another finding of the paper is that there exists, on average, a time lag of three to four
years between the deterioration in the performance of the acquired business that gave rise to the
goodwill and the actual write-down of that goodwill. Given that some businesses could reasonably
be expected to recover from short periods of poor financial performance, this “waiting period”
over which performance deteriorates, yet no write-off is recorded, may not be particularly
excessive. However, for about a third of the firms, the poor performance of the acquired entity
appears to persist for at least six to ten years before a write-off is taken. This substantial delay may
reflect the exercise of managerial discretion in timing goodwill write-offs so as to meet certain
reporting objectives.6
4 The first exposure draft, Business Combinations and Intangibles Assets, was issued in September 1999. The revised exposure draft, Business Combinations and Intangibles Assets: Accounting for Goodwill, was issued in February 2001. 5 Identifying and valuing the reporting unit is just one aspect of the confusion surrounding the implementation of SFAS 142. In a 2002 KPMG survey of finance executives in a range of industries, two-thirds of the respondents felt that the new rules were very difficult to understand and implementation would be “quite complicated”; only 2% of the executives indicated that they had made “significant progress” in implementing the standards (See CFO.com, 2002 and Schneider, 2001.) 6 For example, Francis et al. (1996) examining a sample that includes goodwill write-offs from 1988-1992 before the enactment of SFAS 121, find that management’s reporting incentives play a role in determining such write-offs.
3

To test the robustness of our findings, we also examine a small sample of goodwill write-
offs made in the wake of adopting SFAS 142, recognizing that these write-offs, because of the
leniency of the transition rules on reporting impaired goodwill, may differ from those that will be
reported in subsequent years. Nonetheless, a similar pattern emerges. That is, the ability to predict
these write-offs is low and the write-offs themselves lag behind the economic deterioration of the
acquired assets for a significant number of years. Further, the goodwill write-off disclosures in this
“SFAS 142 sample” are even less detailed than those in our primary sample, with the goodwill
impairment often untraceable to a particular acquisition and with only limited information
provided about its allocation among the firm’s segments.
This paper contributes to the existing research in several ways. First it identifies factors
that affect, or predict, the success of an acquisition and provides an indication as to whether the
seeds of an acquisition’s success or failure are planted at its inception. This understanding is
important in guiding auditors and investors in evaluating the reasonableness of management’s
determination regarding goodwill impairment. It also provides evidence on the adequacy of the
current financial reporting and disclosure system for the ongoing evaluation of the asset goodwill.
Second, it highlights the time lag between the economic deterioration of goodwill and its
subsequent write-off. This evidence is useful in evaluating the potential improvement in the
timeliness of recognizing write-offs as a result of the requirement imposed by SFAS 142 of
periodic impairment tests. Third, the results shed light on the presence of earnings management
regarding goodwill write-offs both prior to, and following, the implementation of SFAS 142.
Finally, while numerous studies examine tangible long-lived assets considering primarily the
market reaction to such write-downs and whether they have information content or are associated
with management incentives,7 little attention has been brought to bear on the confluence of factors
that lead to write-offs or on goodwill write-offs specifically. Yet in examining financial
statements, it is essential to understand those factors that may suggest impairment. This is
particularly true when evaluating goodwill and other intangible assets because of their increased
presence of the balance sheets of Corporate America and the greater subjectivity involved in
evaluating these assets initially and on an ongoing basis since there are fewer observable objective
manifestations of their value or impairment.
7 See Alciatore et al., (1998) for a thorough review of the studies on long-lived asset write-downs.
4

The paper is organized as follows. The next section describes the main accounting
provisions that govern goodwill impairment tests as specified by the new Statement. Indicators of
goodwill impairment included in our tests ant the empirical design used to assess the extent to
which these indicators predict goodwill write-offs are presented in the third section. The fourth
section of the paper contains a description of the sample and data. Results of the empirical tests are
provided in the fifth section. Conclusions and suggestions for further research are contained in the
final section of the paper.
2. Goodwill Impairment: Rules and Indicators
2.1. Accounting for goodwill under SFAS 142
The main provisions of SFAS 142 are that: (1) goodwill will no longer be amortized, (2)
goodwill will be tested annually for impairment, (3) goodwill will be assigned to a “reporting
unit” at the time of acquisition,8 (4) impairment testing will be conducted at the reporting unit
level, (5) impairment losses and the method of their determination will be provided by reportable
unit and disclosures of any changes in the carrying value will likewise be disclosed, and (6) any
goodwill impairment losses will be included as part of income from continuing operations.
The elimination of periodic amortization was regarded by many as a political compromise
introduced to mollify opposition to the proposed abolishment of the “pooling of interests” method
of accounting for acquisitions.9 In place of regular amortization, SFAS 142 requires that goodwill
be tested annually for impairment. Reviewing long-term assets for impairment is not a new
accounting concept. Under GAAP, the very definition of an asset requires that it represent
“probable future benefits” (Statement of Concepts No. 6, par. 25), suggesting recognition of
impairment when this requirement is no longer met. More specifically, APB Opinion No. 17,
Intangible Assets, requires that the reporting entity evaluate continuously the amortization period
of intangible assets, including goodwill, with the possible determination that the “unamortized
cost should be reduced significantly by a deduction in determining net income,” and such a
8 In enacting SFAS 142, the FASB held that goodwill disclosures under APB Opinion No. 17 were inappropriate because they treated the acquired entity as if it remained a separate stand-alone entity rather than being integrated into the operations of the acquiring firm. 9 SFAS 141, Business Combinations, which eliminates the pooling-of-interests method of accounting for acquisitions, applies to acquisitions made after June 30, 2001. Perhaps not coincidentally, SFAS 142 specifies that goodwill acquired after June 30, 2001 is subject to the new nonamortization provisions. (See Sorkin, 2001 and “FASB Compromises on Pooling,” 2001.)
5

reduction should be viewed as part of ordinary income.10 More recently, SFAS 121, Accounting
for the Impairment of Long Lived Assets and for Long-Lived Assets to be Disposed of, which
applies to both tangible and intangible long-term operating assets, provides specific guidelines for
identifying and measuring impairment.
Although the impairment of goodwill, as a long-lived asset, must be recognized in certain
circumstances under the provisions of SFAS 121, there is an important distinction between the
impairment requirement stipulated in this standard and that contained in SFAS 142. SFAS 121
requires a reassessment of the carrying amount of a long-lived asset upon the occurrence of certain
events or a change in circumstances that indicate that “the carrying amount of an asset may not be
recoverable” (SFAS 121, par. 4).11 SFAS 142, in contrast, requires an annual assessment
independent of any triggering events, thus imposing a more stringent revaluation requirement. If,
in the past, belated write-offs could be justified (to the public, and often to the courts in class
action lawsuits) by the absence of early warning indicators, this justification would no longer
appear to be valid under the pro-active approach of SFAS 142. Thus, on the surface, the new
standard would appear to result in more conservative accounting. However, as Watts (2003, p.
217) notes in discussing the underlying tenets of conservative reporting, SFAS 142 appears to be
inconsistent with the usual conservative stance assumed by regulatory bodies, and thus whether it
will be effective in promoting timely write-offs remains an open question:
Assessing impairment requires valuation of future cash flows. Because those future cash flows are unlikely to be verifiable and contractible, they, and valuation based on them, are likely to be manipulated. Conservatism does not allow the use of such measures….SFAS 142 may be an error in judgment by the FASB. Indeed, subjectivity is inherent in the two-step impairment test prescribed by SFAS 142.
In the first step of this test, the fair value of the reporting unit (or units) to which goodwill has
been assigned is estimated and compared with the book value of the unit.12 If the book value
exceeds the estimated fair value, goodwill may be impaired and it is necessary to perform step two
of the test, determination of the amount of the impairment. The impaired amount is the difference
between the carrying amount of goodwill on the balance sheet and its implied fair value. Similar to
10 Accounting Principles Board Opinion No. 17 Intangible Assets, 1970, par. 31. 11 Among the triggers specified in SFAS 121 are a significant decrease in market value, an adverse change in legal factors or the business climate, and negative cash flows from the asset (ibid, par. 5). 12 Fair value is the price at which the reporting unit could be sold to a third party. Substantial latitude is allowed in selecting the method to estimate the fair value of the unit including quoted market prices, prices of similar assets and liabilities, multiples of earnings, revenues or other performance measures, and various “present value” techniques.
6
determining the amount of goodwill arising from an acquisition, the implied fair value of goodwill
is the residual representing the excess of the fair value of the reporting unit and the fair value of
the unit’s identifiable assets (including unrecognized intangible assets) and liabilities.13 Thus, in
addition to the subjectivity that is likely to be present in determining the firm’s reporting units and
allocating newly-created goodwill to these units, the impairment test introduces two additional
layers of subjectivity by requiring the projection of the fair value of the reporting unit(s) as a
whole and of the unit(s)’ assets and liabilities excluding goodwill.
Under SFAS 142, any goodwill impairment is shown on the income statement as a charge
within Income from Continuing Operations. However the transition rules specify that a goodwill
impairment occurring within six months of the Statement’s adoption is to be reported as a
Cumulative Effect of a Change in Accounting Principle. By making this a “below-the-line” item,
firms were given a significant incentive to report to the fullest extent possible any goodwill
impairment in the adoption year rather than deferring such write-offs and later reflecting them as
reductions in operating income.14
2.2. Limitations on the ability to determine goodwill impairment under SFAS 142
Goodwill impairment is a result of the deteriorating performance of the acquired business.
The challenge to parties outside the firm and, to a lesser extent, to management, in determining
whether such deterioration has occurred arises from the limited data on the acquired business
subsequent to its acquisition and the inferior quality of those data. The acquired business is seldom
operated as a distinct subsidiary within the firm, making its performance difficult to track.
Usually, it is integrated into the operations of the acquiring firm or carried as part of an existing
operating segment, a division or a lower-level internal unit, or split among several internal units.
Indeed, many of the respondents to the exposure drafts that preceded SFAS 142 commented on the
difficulty of evaluating goodwill for impairment when the business whose acquisition gave rise to
the goodwill is integrated into the acquirer’s operations.15
13 Note that the excess of the net asset value over the fair value of the reporting unit found in the first step may differ from the impairment amount attributable to goodwill determined in the second step. 14 See Sender, 2002. 15 Most respondents felt that the FASB’s definition of reporting units, which it acknowledged might result in units that were inconsistent with those required by SFAS 131 (SFAS 142, par. B121), would be both difficult and burdensome to implement. The problem is exacerbated if goodwill benefits the acquiring firm’s overall operations rather than a particular unit or subcomponent. In such cases, goodwill is to be assigned to all of the firm’s reporting units in a “reasonable and supportable manner” (ibid, par. B120). Other problems in determining the reporting unit arise if, for instance, the firm is reorganized subsequent to the initial allocation of goodwill and/or the reported operating segments change (ibid, par. B122).
7
To address these concerns, SFAS 142 introduced additional disclosure requirements
designed to help users link the goodwill originating from a specific acquisition with the
performance of the acquired entity subsequent to its acquisition. This entails the assignment of all
assets and liabilities of the acquired entity to such a unit, or units, at the time of the acquisition.
The Statement specifies that a reporting unit can be an operating segment, as defined under SFAS
131, Disclosures about Segments of an Enterprise, or a component of an operating segment if it
constitutes a business with discrete financial information, has dissimilar economic characteristics,
or is regularly reviewed by management.
Although disclosures are required at the level of the reporting unit to which the goodwill
relates, investors are still likely to face difficulties in tracing goodwill to specific segments of the
business and assessing subsequent changes in its value. In some cases, the reporting unit may
represent a component of a larger reporting unit, in which case the disclosures at the reporting unit
level are in general of a lower quality than those provided at the firm level16 and of limited
informativeness with respect to the valuation of goodwill pertaining to a particular acquisition. In
other cases, the acquired entity is absorbed by more than one of the existing reporting units. When
goodwill is allocated across reporting units, the unique subsequent performance of the acquired
entity is no longer clearly defined and can no longer be traced. Finally, the reporting unit may not
belong to any of the “reportable” segments defined by SFAS 131 or there may be more reporting
units than there are segments, in which cases reporting units’ results are aggregated in the segment
disclosures.17 In this situation, information on that unit’s operational performance, and hence on
the valuation of its related goodwill, is unavailable.
While indicators exist to assess whether the firm, as a whole, is in financial distress such as
the level of debt, working capital position, profitability and cash flows, this type of information is
unavailable or inapplicable to internal reporting units. The information disadvantage in assessing
the impairment of goodwill relative to the assessment of the financial position of the firm as a
whole may be somewhat offset by the availability of information on the attributes of the
acquisition that gave rise to the goodwill. These attributes are likely to shed light on the
uncertainty regarding the valuation of the initial goodwill and the likelihood that it was overstated
16 Givoly et al., (1999) find that segment data reported under SFAS 14, Financial Reporting for Segments of a Business Enterprise (1976), are generally of lower quality than firm level data due, in large part, to the need to assign joint costs to the firm’s segments. Further, a firm’s segments may not be consistently reported over time (Botosan and Harris, 2000) rendering year-to-year comparison difficult. 17 For example, the 3M Company had 20 reporting units and only 6 operating segments in 2003.
8

when first recorded. A list of acquisition characteristics that might be indicative of overpayment
was included in the 1999 Exposure Draft but later dropped. However, these may be informative
about goodwill’s eventual impairment as discussed in section 3.1.
3. Hypotheses and Empirical Design
Jennings et al. (1996) and Henning, Lewis and Shaw (2000) find that, on average, goodwill
is considered by the market to be an asset, with its value capitalized in the market value of the
firm. Henning and Shaw (2003) show that the goodwill amortization period selected by the
acquiring firm is informative about the success of the acquisition—the longer the amortization
period, the more likely it is that the acquisition was not profitable.18 They raise the concern that
investors lose a valuable signal about the benefits of the acquisition as a consequence of SFAS
142’s elimination of goodwill amortization. Relatedly, note that investors may also lose a useful
indicator about the value of goodwill itself since its economic benefits are directly linked to the
success of the acquisition.
Francis et al. (1996), examining several types of asset write-offs made prior to the
enactment of SFAS 121, find that the magnitude of goodwill write-offs are among the largest,
outweighing write-offs of tangible assets such as inventory and plant, property and equipment.
Exploring the write-off decision, their results suggest that goodwill write-offs are more likely to be
made when management changes and when the firm’s overall performance is deteriorating.
Findings on the market reaction to goodwill write-offs are mixed. Hirschey and Richardson (2002)
document a pronounced decline in equity, with market values falling an average of 2% to 3%
around the goodwill write-off announcement date. In contrast, Francis et al. (1996), on an earlier
sample, find little reaction to such announcements.
Recognizing that the market regards goodwill as an asset and that information about its
deterioration is used by investors in valuing the firm as a whole, we address whether the
information provided under SFAS 142 is likely to be sufficient to enable investors to accurately
evaluate goodwill. One way to approach this question is to determine if goodwill write-offs are
predictable. If, using information gleaned from the financial statements and the market, goodwill
18 A number of studies examine how investors weight goodwill amortization on the income statement (Jennings et al (1996), Vincent (1997) and Hennings et al. (2001)). Although the findings are somewhat mixed, overall it appears that investors discount such amortization, focusing more on the cash flows of the firm. However, the extent to which managers believe this is questionable since considerable resources have been spent in an attempt to avoid the effects of goodwill amortization on income statement. (See, for example, Lys and Vincent (1995) and Aboody et al. (2000).)
9

write-offs are largely predictable, this suggests that investors and auditors have ample information
to value this increasingly significant asset. On the other hand, assuming that our goodwill
prediction model is valid and that we have adequately captured the impairment indicators, failure
to predict goodwill write-offs suggests that such write-offs are largely a surprise to the market and
that either investors and auditors do not have sufficient information to discern goodwill’s
deterioration over time or that management exercises considerable discretion in selecting when to
take goodwill write-offs. In this case, the elimination of periodic amortization is likely to lead to
an increasing portion of the goodwill reported on the balance sheets being impaired, a serious
cause for concern by users of financial statements.
3.1. Predicting goodwill write-offs
Studies aimed at predicting asset write-offs would be relevant to the question at hand.
However, because no such studies could be identified, we turned to the well-developed research
on bankruptcies for guidance in developing our prediction model.. Predicting goodwill write-offs
is similar in spirit to predicting bankruptcies. Both involve determining when the financial
viability of an entity (a firm or, in the case of goodwill, a reporting unit or units) has deteriorated.
Bankruptcy prediction models such as those developed by Altman (1968, 1982), Ohlson
(1980) and Zmijewski (1984) are typically estimated using a logit model where the dependent
variable reflects whether the firm declared bankruptcy and the independent variables are measured
at the year-end just prior to the firm’s bankruptcy declaration.19 These models are limited since the
characteristics that lead to bankruptcy change from year to year over the period preceding the
bankruptcy. By incorporating only one period of information, these models do not consider data
on healthy firms that eventually go bankrupt, thereby introducing selection bias into their
estimates.20
To account for the firm’s performance in the years leading up to bankruptcy, Shumway
(2001) uses a hazard model that considers the firm’s available information over the years
preceding bankruptcy, thus incorporating its bankruptcy risk at each point in time. In essence, this
model is a multi-period binary logit model that includes each firm-year as a separate observation.21
19 In these analyses, non-bankrupt firms are measured at a random year. 20 The bias arises because the researcher, acting with knowledge of the bankruptcy event, selects which year of data to include in estimating the model. 21 Since a given firm contributes a number of observations to the analysis, the assumption of independent observations is violated. To adjust for this, the test statistics are calculated based on the number of firms in the sample and not the number of firm-year observations.
10

By including the entire period over which the firm is at risk of bankruptcy, this model provides a
more accurate prediction than do related one-period models.
Since it is unlikely that the deterioration in the performance of a reporting unit (or units)
that leads to a goodwill write-off happens in just one period, we follow a similar approach, using a
hazard model that incorporates the pre-write-off performance of the reporting unit(s) to predict
goodwill write-offs. Our main hypotheses are that the acquisition characteristics as well as the
subsequent financial performance of acquired businesses over the years following acquisition are
useful in predicting goodwill write-offs. Our prediction model is thus:
Pr (WRITE-OFFi,t) = f([Acquisition Characteristics]i, A, [Performance Indicators]i,n) [1]
The subscript i refers to the firm, the subscript A refers to the acquisition year, and t is a time
subscript. WRITE-OFF is a dichotomous variable that receives the value of 1 if the goodwill
arising from the acquisition is written-off in year t and 0 otherwise. The performance indicators
are measured over the n years between the acquisition year and the write-off year.22
3.2. Acquisition Characteristics
As noted earlier, the 1999 Exposure Draft identifies a number of acquisition characteristics
that may be associated with goodwill impairment. These indicators are: (1) payment of a
significant premium, (2) presence of multiple bidders or an auction-like situation, (3) a significant
amount of goodwill relative to the acquisition price, and (4) use of the acquiring firm’s stock as
the primary mode of consideration.23 The emphasis on overpayment stems from the concern that
in the event the acquiring firm pays “too much” for the acquired business, the goodwill arising
from the acquisition will be overstated and, as a result, is likely in subsequent periods to be
impaired relative to its carrying value. In order to see if the “goodness” of goodwill is determined
at the time of acquisition, we include these four indicators in our predictive model.
The rationale for the first indicator is that the premium represents, among other factors, the
optimism of the acquiring firm’s management regarding the future performance of the acquired
firm relative to existing market expectations. The resulting goodwill is therefore subject to greater
22 For firms that take a write-off, n ranges from A+1 to t-1 where t is the year of the write-off. Years following the write-off are eliminated from the sample. For firms that do not take a write-off during the sample period, n extends from A+1 up to the year 2000, depending on the availability of the data. 23 The Exposure Draft calls for a revaluation of the carrying amount of the goodwill, in accordance with SFAS 121, when more than one of these indicators is present (par. 26). While reasserting the rationale behind the overstatement indicators (ibid, par. 55-56), The revised Exposure Draft, while lending support to the rationale underlying the overstatement indicators (par. 55-56) replaces their examination with a requirement to conduct a benchmark assessment of all of the assumptions, projections and evaluation models relied upon in making the acquisition decision.
11

uncertainty and more likely to be overstated. The second indicator, presence of more than one
bidder, reflects the degree of competition to acquire the target firm and hence the likelihood that
the winner paid an “unwarranted” premium. The empirical evidence in the M&A literature lends
credence to this indicator. Ruback (1983) and Giliberto and Varaiya (1989), for example, find
evidence that acquiring firms tend to overpay in multiple bidder situations, consistent with there
being a “winner’s curse.” The amount of goodwill relative to the purchase price, the third
indicator, suggests that goodwill is more subjectively assessed than other assets and therefore
overpayment by the acquiring firm is more likely the higher the proportion of the acquisition price
assigned to goodwill. Finally, the use of the mode of consideration as an indication of
overpayment relies on the notion that in negotiating the purchase price, acquiring firms are more
sensitive to the potential loss of cash in cash acquisitions than to the dilutive effects of stock in
stock-for-stock exchanges. As a result, acquiring firms may have a greater tendency to overpay
when using stock to affect the transaction. Loughran and Vijh (1997)’s finding that acquiring firms
in stock exchanges perform significantly worse than acquirers who paid with cash over the five-
years following the acquisition is consistent with this notion.
We measure the first acquisition indicator, payment of a significant premium, or PREM, as
the extent to which the acquisition cost, measured as the acquisition price plus the assumed
liabilities, exceeds the average market value of the acquired firm over the pre-announcement
period. This period is defined as the 100 trading days ending 50 days prior to the acquisition
announcement. The resulting difference is standardized by the average market value of the
acquired firm’s equity over the pre-announcement period to determine the premium as a
percentage. The second acquisition indicator, number of bidders, or BID, is represented by a
dummy variable that receives the value of 1 if more than one bidder is present during the
acquisition period and 0 otherwise. The third indicator, GW%, is measured as the percentage of
the acquisition cost assigned to goodwill. The last overpricing indicator, STOCK, is defined as the
proportion of the purchase price paid for with the acquiring firm’s stock. STOCK ranges from 0 to
1, with 0 representing an all-cash transaction and 1 denoting a pure stock transaction.
Beyond the indicators specified in the exposure draft, we incorporate two additional
measures. The first of these indicators captures other factors that may suggest overpayment that
are not captured by those specified in the exposure draft. Here we rely on the market’s response to
the acquisition announcement since there is evidence that the announcement period returns are
12
predictive of an acquisition’s success.24 We hypothesize that the lower the announcement period
returns to the acquiring firm’s shareholders, the more likely it is that the acquiring firm overpaid
and that the initially recorded goodwill is overstated. Denoting the announcement period returns
by ANNRET, we measure these as the cumulative abnormal returns accruing to the acquiring
firm’s stockholders over the 21-day period beginning 15 days prior to the acquisition
announcement and ending 5 days following the announcement date.25
The second additional indicator measures the intensity of the firm’s recent acquisition
activity. Evidence suggests that firms engaged in an acquisition “spree” tend, on average, to
overpay for the acquired firms (Hayward (2002) and Niederhoffer and Kenner (2002)). This
occurs because firms that make numerous acquisitions in a relatively short period either do not
have sufficient time to properly evaluate the acquired entities prior to their acquisition or they lack
sufficient managerial or financial resources needed to successfully integrate the acquired entities.
Acquisition activity, ACQN, is measured as the number of acquisitions made by the acquiring
firm over the two years preceding, and the year of, the acquisition announcement year.
3.3. Performance Indicators
Neither SFAS 142 and its earlier exposure drafts nor SFAS 121 provides measurable
indicators of goodwill’s impairment. They do provide, however, examples of events or
circumstances that are likely to reduce the fair value of the reporting unit below its carrying
amount. Among these examples is “a significant adverse change in legal factors or in the business
climate,” “unanticipated competition” or “a more-likely-than-not expectation that a reporting unit
or a significant portion of a reporting unit will be sold or otherwise disposed of.”
Suggestions for leading indicators of financial distress are also offered in the authoritative
auditing and accounting pronouncements, primarily in the context of evaluating the going-concern
assumption. For example, Statement of Auditing Standards No. 59, The Auditor’s Consideration
of an Entity’s Ability to Continue as a Going Concern, identifies certain leading indicators (or red
flags) regarding a company’s ability to survive. These include recurring operating losses, negative
working capital and cash flows from operating activities, as well as adverse key financial ratios
(see SAS 59, par. 06).
24 For example, Healy et al. (1992) find that the market partially anticipates the success of the acquisition at the time of its announcement. 25 Expected returns are estimated from the market model over the 250 trading day period, ending 30 days prior to the announcement date. Where there was a subsequent price revision following the initial announcement (usually in cases involving more than one bidder), we extend the window to include the revision date and the succeeding 5-day period.
13

A more promising avenue for constructing a goodwill impairment prediction model is to
borrow financial ratios from the financial distress and bankruptcy models. These ratios pertain to
firms’ profitability, liquidity and leverage in the year immediately preceding bankruptcy. Altman
(1968, 1977) and Begley et al. (1996) which updates Altman’s study, use five ratios to predict
bankruptcy: four measures standardized by total assets, sales, working capital, earnings before
interest and taxes (EBIT) and retained earnings, and a fifth ratio consisting of the firm’s market
value divided by its total debt. Deakin (1972) employs various ratios including current assets-to-
sales, funds-from-operations-to-debt and return-to-assets. Ohlson (1980) uses nine variables that
capture the firm’s leverage, liquidity and performance, as well as an overall index of general
economic conditions. Zmijewski (1984) has a more parsimonious model that includes just three
measures: net income-to-total assets, total debt-to-total assets and the current ratio.
These are general indicators that pertain primarily to the firm as a whole rather than to a
particular segment or reporting unit within the firm. Aside from the internal synergies and cross-
subsidies that make the fate of these units less performance-dependent than stand-alone firms,
predicting goodwill impairment is hampered by the lack of data on the acquired business that gave
rise to the goodwill. As noted earlier, this business may be completely integrated within the other
units of the company making its operational results difficult, if not impossible, to extract from the
aggregate, firm-level, reports. In other cases, where the acquired business is reported as a single,
or part of, an operating segment, there is more information available to evaluate the goodwill.
However, even then, segment data are unavailable for individual assets (such as cash, inventory or
accounts receivable), non-existent for liabilities and undefined for equity accounts. These data
limitations thus preclude the use of many of the financial ratios typically used in predicting the
firm’s deterioration.
Based on the available segment data, we devise the following four indicators to capture the
performance of the segment (or segments) to which the goodwill is assigned: (1) operating
income-to-identifiable assets, ROA, (2) a change in ROA from one year to the next, designated
∆ROA, (3) operating losses, LOSS, a dummy variable coded as 1.0 if operating income is
negative and zero otherwise, and (4) the percentage change in sales from one year to the next,
∆SALES.
As noted above, SFAS 142 cites unexpected competition as a possible indicator of
goodwill impairment. Accordingly, we also include a measure of the change in the competitive
14

environment in which the segment operates, ∆COMP, using the Herfindahl index to estimate
changes in the level of competition of the reporting unit (see Harris (1998) and Rhoades (1993)).26
The performance indicators are measured using segment data available in the annual
reports in each of the years following the acquisition up to the write-off year.27 When the goodwill
is traced to more than one segment, we use the yearly average performance variable across the
host segments, weighted by the segments’ sales.
As final variables in the prediction model, we include two firm-level indicators to capture
information about the firm that may be relevant in the write-off decision. These are the annual
firm-level return on assets, FIRMROA, and the annual cumulative abnormal returns of the firm
over the years preceding the write-off, FIRMRET.28 While the impairment tests prescribed by
SFAS 142 focus on the fair market value of the reporting unit or units to which the goodwill is
assigned and not the value of the firm in its entirety, changes in the firm’s overall profitability may
provide more general information about the acquired entity’s profitability in the hands of the
acquiring firm. Similarly, FIRMRET reflects the market’s assessment of the aggregate changes in
the firm’s value and thus might be indicative of factors that would affect the performance of a
particular reporting unit or units. These firm-level variables would likely be more relevant in cases
where the goodwill is assigned across multiple reporting units or where the validity of the segment
data is low.29
Combining the acquisition and performance indicators results in the following write-off
prediction model where i and t are, respectively, the firm specific and time subscripts, the
subscript A refers to the acquisition year in which the goodwill was created, and n denotes the
individual year in the time period that spans from the acquisition year to the write-off year:
26The industry-based Herfindahl index is measured as Σsi[sij/Sj]2 where sij is firm i’s sales in industry j, as defined by 4-digit SIC code of the reporting segment and Sj is the sum of sales for all segments operating in industry j. 27 While quarterly data would have been preferable, segment data are generally only available on an annual basis. 28 The parameters of the market model are reestimated each year using the prior year’s daily returns in order to capture any shifts in the firm’s systematic risk. Annual cumulative abnormal returns are then calculated for each year following the acquisition through the year preceding the write-off to derive FIRMRET. To capture the firm’s overall performance since the time of acquisition we duplicated the tests using instead of FIRMRET, the cumulative abnormal returns of the firm from the year following the acquisition up to year t. For example, this version of FIRMRET, measured three years following the acquisition (year t), is the sum of the firm’s annual cumulative abnormal returns in years t-2, t-1 and year t. Use of this measure did not alter the reported results. 29 This could happen, for instance, if segments share fixed assets and the cost allocation method does not take into account the segments’ relative profitability.
15

WRITE-OFFit = α + β1PREMiA+ β2BID iA + β3GW%iA + β4STOCKiA + β5ANNRETiA +
β6ACQNiA + β 7ROAin + β8∆ROAin + β9LOSSin + β10 ∆SALESin +
β11∆COMPin + β12FIRMROAin + β13FIRMRETin +εit [2]
4. Sample and Data
In order to be able to predict goodwill write-offs, we require a post-acquisition period that
is long enough to allow a reliable and meaningful estimate of the underlying probability of
goodwill impairment. Ideally, we would also like to have observations that belong to the current
segment reporting regime, represented by SFAS 131, so that our results are more relevant to
today’s disclosure environment. Unfortunately, these two requirements are in conflict since most
firms adopted SFAS 131 in 1997 or 1998, thus allowing for only a short time series in the post-
SFAS 131 period. Further, even though data on goodwill write-offs made in 2002 are available,
some, if not most, of these write-offs appear to be motivated by the adoption of SFAS 142. As
noted earlier, firms have a strong incentive to take goodwill write-offs when adopting SFAS 142
because of the transition provision that allows the adoption-year write-off to be reported in the
income statement as a “below-the-line” item (Cumulative Effect of a Change in Accounting
Principle) rather than a charge within Income from Continuing Operations, the required
presentation in subsequent years. As a result, these cases are not particularly suitable for testing
the predictability of write-offs although we do analyze these write-offs separately (see section
5.4). Our final sample of acquisitions thus represents a balance between the requirement for a long
post-acquisition period and the need to have a sufficient number of observations in the post-SFAS
131 era.
Our initial sample of acquisitions is drawn from all acquisitions made between 1988 and
1998 that are in the Securities Data Corporation (SDC) database. To be included in the initial
sample, acquisitions had to meet the following criteria:30
(1) Acquiring and acquired firms were publicly traded on U.S. stock exchanges. (2) Data were available on the acquisition announcement date, the purchase price, liabilities
assumed, the mode of consideration, and the number of bidders. (3) The transaction became effective within one year of the acquisition announcement.
30 To verify the information collected from the SDC database where there were questions and to fill in missing data, we checked the Wall Street Journal and firms’ financial statements (including prospectuses and 8-K filings) to determine the announcement date, the accounting method used to consolidate the acquired entity, the purchase price, the amount of liabilities assumed, and the mode of consideration. To check for the presence of multiple bidders, we extended our search of the Wall Street Journal back in time two years prior to the acquisition announcement.
16

(4) The transaction was accounted for using the purchase method and gave rise to goodwill.
(5) The amount of the goodwill associated with the acquisition was known. Applying these selection criteria resulted in 3,428 acquisitions over the 11-year period,
with the number of acquisitions increasingly steadily from about 150 in 1988 to almost 600 in
1998. Information on the amount of goodwill arising from the acquisition was lacking in 38% of
the cases. We then eliminated those acquisitions where either the acquired or acquiring firm did
not have sufficient return data on the CRSP database for the period examined. We also required
that the acquiring and acquired firm be on Compustat, and that the acquiring firm have segment
data available. This reduced the sample to 2,852 acquisitions.
In order to mirror the disclosure environment under SFAS 142 as closely as possible, for
each of the remaining acquisitions, we identify the reporting segment or segments to which the
goodwill was assigned. The goodwill disclosures for these cases are thus the same as those
required by SFAS 142 and enable us to observe the placement of the acquired firm within the
acquiring firm and to track its subsequent performance through the segment disclosures. We refer
to the segment (or segments) where goodwill is assigned as the “host segment(s).” In some cases,
this identification was a relatively straightforward task since the host segment was disclosed in
either the acquiring firm’s financial statements or noted in a press release made by the firm. In
other cases, we were able to make a reasonable inference about the host segment by relating the
acquired firm’s primary business to that of one of the acquiring firm’s segments. Such inferences
were verified by examining the change in the assets and revenues of the acquiring firms’ segments
in the year following the acquisition.31 Observations where a host segment could not be identified
were deleted from the sample. There were 1,276 acquisitions that met the above criteria,
representing about 45% of the acquisitions for which Compustat and CRSP data were available.
We refer to this group of firms as the “primary sample.”
To identify goodwill write-offs, we tracked the acquiring firms in the final sample over the
period following the acquisition forward in time through 2001, the year just prior to their adoption
of SFAS 142, examining their annual income statements and the related footnotes. 32 When a
write-off of goodwill was identified, we determined the amount of the write-off, the reason for it 31 When the acquired firm operated in a similar line of business as one of the acquiring firm’s existing segments (based on the four- or three-digit SIC code), we assumed that the goodwill was assigned to that particular segment. To test the validity of this assumption, we ascertained that the presumed host segment’s assets increased in the acquisition period by an amount similar to the amount of the acquired assets and that its revenues increased as well. 32 SFAS 142 had to be implemented for fiscal years beginning after December 15, 2001.
17

(if given), the amortization period, and whether there was an accompanying restructuring charge
or write-off of other assets in that year. For cases where the acquired entity was sold, we attribute
any loss from the disposition to a goodwill write-off. In all, we detected 186 write-offs in the final
sample, which we refer to as the “write-off group.” For the large majority of acquisitions (1,096 or
86%), we detected no write-offs through 2001, the last year of our sample. We refer to these
acquisitions as the “non-write-off-group.”
To estimate the hazard model, we first form an “estimation sample” by randomly drawing
half of the acquisitions that resulted in a write-off and half of the acquisitions that did not result in
a write-off. The hazard model is estimated over the 4,082 firm-years associated with these 638
acquisitions. This estimated model is then applied to predict write-offs for the other half of the
sample, designated the “hold-out sample.”
While our primary sample consists of disclosures that mirror those made under SFAS 142,
the write-offs in our primary analysis occur prior to the adoption of this standard. The implications
of these data limitations, which stem from the lack of sufficient time period following the
enactment of SFAS 142 and SFAS 131, are discussed in section 5 of the paper.
To examine the generalizability of our results to future years within the SFAS 142
reporting regime, we followed our sample firms forward in time through 2004 to determine if the
segments to which goodwill was assigned in the pre-SFAS 142 period were equivalent to the
reporting units in the post-SFAS 142 period. For over 90% of the firms, this proved to be true. In
those cases where it appeared that the assignment had changed, there was usually a subsequent
acquisition (making the earlier goodwill difficult to distinguish from the newly-recorded
goodwill), a divestiture, or the reporting units were more finely defined than the segments.
To further examine the generalizability of the results, we collected a sample of write-offs
occurring with the adoption of SFAS 142. While over 250 such write-offs were identified, a total
of 56 met the above selection criteria. We refer to this sample as the SFAS 142 sample and
analyze it separately as reported in section 5.4.33
33 We also collected write-offs that occurred in 2003 and 2004, after the 2002 transition year. However, there were too few of these (17 cases) to perform the write-off analysis. Descriptive statistics on this small subsample indicate that the goodwill write-offs occurred in segments (reporting units) that resembled those for the primary sample.
18

5. Results
5.1 Sample Descriptive Statistics
The distribution of the acquisition sample and the write-offs by year are provided in Table
1. As the table indicates, there is no clustering of acquisitions in any given year although the
number of acquisitions in later years is larger than in earlier year. Further, there is no clear pattern
over time regarding the frequency of subsequent write-offs arising from the acquisitions, except
for the decline in that frequency for acquisitions originating in the last five years of the sample.
This decline is due to the fact that the sample is right-truncated (i.e., acquisitions are not followed
beyond 2001).
Descriptive statistics on the acquisition and performance indicators for the write-off (WO)
and non-write-off (non-WO) groups are provided in Table 2. As the table shows, the two groups
differ significantly with respect to many of the acquisition and performance variables. The
acquisition indicators are generally consistent with greater overpayment occurring in the WO
group. The acquisition price of the WO group represents a premium of 47.6% over the acquired
firm’s average market value of equity in the pre-announcement period as compared with a
premium of 40.8% for the non-WO group, a statistically significant difference. Further, goodwill
as a percentage of the acquisition price is much larger in the WO group (58.4% on average) than
in the non-WO group (44.8%), a 13.6% difference which is significant at the 0.001 level. In terms
of the mode of consideration, stock was used to finance acquisitions in the WO group to a greater
extent than acquisitions in the non-WO group (41.6% vs. 34.5% of the acquisitions, respectively).
The above results are consistent with the notion that the seeds of the eventual goodwill
write-off are planted at the time of the acquisition. Moreover, the likelihood of a write-off is
related to an initial overpayment as indicated by acquisition characteristics such as payment of a
large premium over the pre-acquisition stock price of the target and the use of stock rather than
cash as a mean of payment. Apparently the implications of these characteristics do not escape
investors: In line with the findings of a myriad of past studies, the average announcement period
returns to the acquirers were negative. More important to our investigation, however, is the finding
that acquirers in the WO group experienced significantly lower average returns than those in the
non-WO group, -3.3% compared to -1.2%. This finding is consistent with the notion that the
market anticipates acquisitions that are destined to do poorly, at least as gauged by their eventual
goodwill write-off.
19

Our hunch that firms with greater M&A activity are more prone to overpayment and thus
to a greater likelihood of goodwill impairment is not borne out by the evidence. In fact, the WO
group made, on average, fewer acquisitions than the non-WO group over the three years ending
with the acquisition year.
Acquired businesses that are eventually associated with a goodwill write-off exhibit
significantly inferior performance following their acquisition as compared with those entities
whose goodwill remains intact. As reported in the third panel of Table 2, the performance
indicators of the host segments measured two years after the effective year of acquisition are all
lower for the write-off group. The ROA and its annual change are both significantly lower for the
host segments of the WO group compared with their non-WO counterparts. The lower
performance of the WO group is reflected in the greater percentage of the group’s host segments
experiencing an operating loss two years after the acquisition as compared to the host segments in
non-WO group.
Using sales relative to the industry to assess the change in competition as measured by the
Herfindahl index, we find that the host segments of both groups of firms experienced increased
competition in the post-acquisition period. This likely reflects the heightened merger activity
during the 1990s and the “roll-up” of many smaller firms in industries where acquiring firms
sought to gain market power by buying entities in related lines of business (see Pryor (2001) and
Mandal and Yang (1997)). No significant difference in the change in the competition level is
found between the two groups.
At the firm level, there is the overall ROA of the two groups is similar. Further, while
acquiring firms in the WO group experienced more negative cumulative abnormal returns in the
second year after the acquisition as compared with acquiring firms in the non-WO group,
-5.2% versus -3.7%, the difference is not statistically significant.
Differences in the WO and the non-WO groups may be influenced by the fact that the data
are “right-truncated” since our sample does not include write-offs occurring more than ten years
after the acquisition. This truncation may result in more recent acquisitions falling into the non-
WO group whereas older acquisitions are more likely to be in the WO group. If this is the case,
the different attributes of the two groups of firms presented in Table 2 may reflect the different
time periods in which the acquisitions took place rather than characteristics directly associated
with a write-off.
20

To control for this possible time period effect, we repeated the analysis in table 2 dividing
the WO and the non-WO groups into two sub-groups--acquisitions occurring in the earlier part of
the sample period from 1988-1994 and acquisitions occurring in the later part of the sample period
from 1995 to 1998. The results (not reported) show that the differential acquisition and
performance characteristics of the WO and the non-WO groups reported above is present within
each subperiod. This finding suggests that the different characteristics of the two groups are not
due to differences in the period in which the acquisition occurred.
Table 3 presents descriptive statistics on the final sample and the goodwill write-offs. As
noted earlier, identifying the amount of goodwill arising from a particular acquisition was not
possible for 1,082, or 38%, of the initial sample of the 2,852 acquisitions that met the sample
selection criteria. However, even when the amount of goodwill arising from a particular
acquisition can be determined, investors may still be unable to assess its viability if it is not
associated with a reported segment within the acquiring firm. As noted on the third line of Table 3,
an additional 17.4% of the observations in the initial sample were eliminated because goodwill
could not be traced to a reportable segment within the consolidated financial statements. This
situation is more likely to arise when the acquiring firm makes a number of acquisitions
throughout the year or when the acquired business appears to be divided up across several of the
acquiring firm’s segments. The reporting requirements mandated by SFAS 142, that the amount of
goodwill arising in an acquisition and its assignment within the firm should be disclosed, is aimed
at correcting these problems.34
Although we are unaware of any bias due to the loss of these observations, such a loss has
an important bearing on the main research question of the paper, namely the ability of investors to
predict goodwill impairment. When the amount of goodwill associated with a particular
acquisition cannot be identified, either because it is not reported or because the goodwill arising
from several acquisitions during the year is combined in the company’s disclosures, it is difficult
or impossible to assess its viability.35
34 Preliminary investigation of acquisitions reported in accordance with SFAS 142 suggest that it is still difficult (if not impossible) to trace the assignment of goodwill arising from a particular acquisition to segments in cases where there is more than one acquisition during a year, past goodwill is reclassified, or the reporting units used differ from the reported segments. 35 The SFAS 142 requirement that goodwill be allocated to a particular reporting unit or units would seem to eliminate the non-reporting behavior of some firms. However, this initial assignment is unlikely to resolve all of the problems associated with tracking the acquired entity and the associated goodwill subsequent to the acquisition. Examples where goodwill arising from a particular acquisition is difficult, if not impossible, to assess include situations where a
21

As noted earlier, of the 1,276 acquisitions in the final sample, 180 or 14.1% resulted in a
write-off. Considering the 7,916 firm-year observations in the sample, the 180 write-offs represent
a write-off frequency of 2.3% per year.
The magnitude of the goodwill write-offs in the sample is not trivial. The average amount
written off is $421.8 million, with a median value of $44.2 million. The amount of the write-off
represents, on average, 11.2% of the firm’s assets and 6.1% of its market value. The amount of
goodwill written off relative to the original goodwill is considerable, about two-thirds on average.
This is consistent with both an unwarranted premium and, possibly, use of an unduly long
amortization period. The remaining original amortization period for the goodwill written off was
about 26 years. This relation between goodwill write-offs and relatively long amortization periods
is consistent with Henning and Shaw’s (2003) finding that longer amortization periods are, in
general, associated with poorer acquisitions.
As the table shows, the majority of the goodwill write-offs (68.4%) were part of a
restructuring charge where the firm wrote off other tangible and intangible assets. 36 For over 16%
of the acquisitions that resulted in a write-off, the acquired entity was sold within the period
examined; a total of 80% of these dispositions (about 12% of the sample) were made at a loss.
On average, the goodwill impairment is recognized between four and five years following
the acquisition. About 15% of the write-offs took place within two years of the acquisition. At the
other end of the spectrum, about one-third of the write-offs occur only six or more years following
the acquisition. In interpreting the statistics on the timing of goodwill write-offs, it should be kept
in mind that our sample period is truncated at 2001, with over one-third of the acquisitions
occurring in the last three years of the period. Indeed, for this group of 463 acquisitions, the
percentage of write-offs captured in the sample period was 7.8%, much lower than the 17.7%
write-off frequency for the 813 acquisitions made earlier in the sample period which could be
followed over a greater number of years.
firm makes more than one acquisition during a year and thus “mixes” goodwill arising from more than one source, assigns goodwill to two or more reported units, assigns goodwill to a reporting unit that differs from the operating units, or the acquired entity becomes part of a much larger operating segment. Subsequent to the acquisition, further acquisitions, restructuring activities, reclassification of assets, combining, adding or eliminating operating segments, and discontinuing operations make it difficult to track a particular acquired entity’s performance even if its initial assignment to a segment (or segments) was apparent. 36 Francis et al., (1996) similarly find that a high percentage of write-offs are associated with restructurings in the 1989-1992 period.
22

While the percentage of goodwill write-offs in any given year is small (2.3%), it is even
less likely in the first two years after the acquisition. For the write-off sample, the probability of a
write-off exactly one year after the acquisition is 0.5%. This probability increases sharply one year
later to 1.6%, and more than doubles to 2.4% in the third year after the acquisition. This is not
surprising since the economic conditions that eventually lead to the write-off are unlikely to be
anticipated at the time of the acquisition (hence the acquiring firm’s willingness to acquire).
Further, an immediate write-off is often interpreted as prima facie evidence that management did
not adequately perform the necessary due diligence investigations prior to the acquisition. With
the passage of time, management is likely to change and new management is more inclined to
admit past erroneous decisions as manifested by the write-off of goodwill. The probability of a
write-off stabilizes after three years at a level of about 2.5% per year.
5.2. Write-off Prediction
Table 4 presents the estimates of the hazard model for predicting goodwill write-offs
(regression (2)), using first both the acquisition and performance indicators and then each of the
indicator groups separately. Among the acquisition indicators, the most significant predictive
variables are the premium paid in the acquisition, the percentage of the purchase price allocated to
goodwill, and the use of stock as the primary mode of consideration. Among the performance
indicators, only the segment-level ROA and change in ROA measures are significant. This result
is comparable to that of Ravenscraft and Scherer (1993) who find that low profitability is the
strongest indicator of segment divestment.37
Employing the parameter estimates generated by the hazard model, we next assess the
predictability of goodwill write-offs in the holdout sample. The results using the full set of
indicators are presented in the second column of Table 5. To construct the table, the firm-year
observations are ranked by their fitted probability values (i.e., their estimated probability of taking
a write-off in the following year obtained from the model), and partitioned into ten probability
deciles. The table reports the percentage of the total number of actual write-offs contained in each
of the five highest probability deciles, and in the combined five lowest probability deciles.
Under the null hypothesis of no predictive power for the model, actual write-offs should be
distributed evenly across the deciles, with an expected percentage of 10% of the write-offs
37 In another version of [2], industry-adjusted performance measures (computed by subtracting the median value of the performance indicator of the industry (based on the SIC code) was examined. The results (not reported) were comparable with those reported.
23

occurring in each decile. The results show that the incidence of write-offs increases monotonically
with the model’s estimated probability, indicating that the model has some predictive power.
Specifically, the group of acquisitions with the highest decile (two deciles) of the estimated
probability for a write-off contains 24.5% (42.4%) of the write-offs, much more than the expected
share of 10% (20%) of this group in the write-offs under the null. Still, the model poorly estimates
the likelihood of a write-off of about one-fourth of the actual write-offs, identifying them as
having a “below-median” probability of a write-off (i.e., assigning them to the bottom five
probability deciles).
Results pertaining to the contribution of the acquisition and performance indicators to the
predictive power of the model are provided in the next two columns of table 5. Consistent with
their greater significance (see table 4), the acquisition variables are more predictive of the eventual
write-off than are the performance indicators. The acquisition-indicators-only model assigns the
highest write-off probability (top decile) to 21.1% of the actual write-offs while assigning 28.9%
of the actual write-off cases to the bottom five deciles of the of the write-off probability
distribution. Comparable numbers for the model using only the performance indicators, 18.9% and
33.5%, respectively, suggest that these indicators are less able to detect eventual write-offs.
In order to gain more insight into the predictive ability of the model in terms of its type I
and II errors, we produce a dichotomous write-off prediction for each observation based on
whether the estimated probability is above a certain cut-off point. We use a cut-off point that
represents the top 20% of the estimated probability of a write-off. This demarcation point is 0.50
and 0.40 for, respectively, the full model and the partial models (acquisition-characteristics only
and performance-only).38 Type I and II errors arising from the predictive model are shown in
Table 6. Using this cutoff point, the model correctly predicts over 42% of the write-of cases,
generating a type II error for the remaining 58% of these cases. At the same time, the model emits
“false write-off alarms” about an imminent (one year away) write-off for about 30% of the cases, a
type I error.
The full model produces results that are better than those obtained when relying for the
estimate on acquisition characteristics or performance measures only. Yet, consistent with the
findings of table 5, both Type I and type II errors are lower when acquisition characteristics rather
than performance measures are used.
38 Other cutoff points lead to essentially the same conclusions.
24
The weaker predictive power of the performance-indicators-only model shown in tables 5
and 6 is surprising for two reasons. First, performance measures were shown by past research to
be powerful predictors of firm-level financial distress. Second, the performance measures are
recent and timely by the virtue of being updated continuously whereas the acquisition
characteristics represent historical data whose age increases with the progression of time. One
plausible explanation for this result is the limited number of performance measures that can be
computed from segment data as well as the low quality of the available segment disclosures.
5.2.1. Benchmarking against bankruptcy prediction models
To better understand the predictive power of this model, which relies primarily on
segment-level data to assess performance, relative to that of bankruptcy models that use firm-level
performance measures, we compare our results to those of three bankruptcy prediction models by
Altman (1968), Begley et al. (1996) and Shumway (2001) as shown in Table 7. The predictive
power of the bankruptcy models is considerably greater than that of the write-off model. The three
bankruptcy models estimate a high probability of bankruptcy (i.e., belonging to the top two deciles
of the bankruptcy probability distribution) for the majority (55% to 87%) of the cases that ended
up in bankruptcy. The comparable percentage for the goodwill write-off model is only 42%. At the
other extreme, the bankruptcy models wrongly identify only between 4% and 16% of the
bankruptcy cases as having low bankruptcy probability (i.e., belonging to deciles 6 to 10 of the
estimated bankruptcy probability distribution). This contrasts with the assignment of 23% of the
eventual goodwill write-off cases to a low write-off probability (i.e., falling into deciles 6 to10 of
the estimated write-off probability distribution).
Recall that the above analysis regarding impairment predictability is based only on the
sample of acquisitions where the amount of goodwill created could be identified and traced to a
host segment. Such an analysis is impossible for the many acquisitions where the amount of
goodwill was not provided and the acquired firm’s performance could not be associated with a
particular segment, reinforcing the conclusion that in many cases, the current rules of financial
reporting and disclosure fail to provide investors and auditors with the relevant information
required to predict goodwill impairment.
5.2.2. Market-based validation of the write-off prediction model
The findings on the limited usefulness of mandated accounting disclosures in predicting
goodwill impairment does not necessarily imply that investors are incapable of predicting
25

goodwill based on information provided by other sources. For example, industry trends and
publications, companies’ press releases, information contained in the Management Discussion and
Analysis or other voluntary disclosures, all might assist in such a prediction. While the presence of
other relevant information does not absolve standard setters and regulators from their duty to
provide useful and relevant information for decision making, the absence of alternative credible
sources of information makes this duty more crucial.
To determine the extent to which such competing information sources exist and, in a way,
validate our prediction model as representing investors’ expectations, we study the association
between the market response to write-off announcements and the a priori probability of a write-off
assigned by our model. If the market’s assessment of the likelihood of a goodwill write-off is
similar to that produced by our model, we expect that the write-off announcement will be partially
anticipated and thus evoke only a limited market reaction.
To examine this relation, we collected the earnings announcements in the Wall Street
Journal made by firms in the WO group in the year they took a write-off. Of the 180 write-off
cases, we found 62 earnings announcements that mention a goodwill write-off, some of which also
provided an indication of the amount of the write-off.39 The estimated write-off probability of 25
of these 62 cases falls in the top two deciles of this probability’s distribution.
We examine the relation between the predictive ability of our model and the market
response using the following equation:
CARit=α + β1UNEXPit + β2GWit + β3RESTRCit + β4(HIGHit*GWit) + β5 (LOWit*GWit) + εit [3]
where the subscripts i and t refer to the firm and the time examined, respectively. The dependent
variable, CAR, is the cumulative abnormal five-day announcement period return centered on the
annual earnings announcement date. UNEXP is the firm’s unexpected earnings excluding the
goodwill impairment loss and any restructuring charges, measured as the difference between the
actual adjusted earnings and the expected earnings for the year.40 GW is the amount of the
goodwill write-off expressed as a positive number on an after-tax, per share basis. To adjust the
before-tax amount to an after-tax basis, we use an estimate of the effective tax rate computed as 39 If a goodwill write-off was mentioned, the amount of the write-off on a before-tax basis was sometimes cited. In other cases, the amount might be alluded to as a percentage of a specified dollar amount of a restructuring charge or as having decreased earnings by some dollar amount or percentage. 40 Unexpected earnings is defined as adjusted actual earnings minus expected earnings. Expected earnings is derived from the Thomson Research I/B/E/S database and defined as the consensus earnings forecast outstanding in the quarter of the earnings announcement. The adjusted actual earnings is calculated as actual earnings excluding the goodwill write-off and any restructuring charges, both of which are estimated on an after-tax basis.
26

the current portion of the tax expense divided by the firm’s pretax income. Similarly, we compute
RESTRC, the amount of any restructuring charges excluding goodwill, on an after-tax, per share
basis and express it as a positive number. All of the above independent variables are standardized
by the market value of equity at the end of the quarter prior to that of the earnings announcement.
HIGH and LOW are dummy variables representing the likelihood that the goodwill arising from
the acquisition will be written off. HIGH (LOW) is set equal to 1.0 if the estimated probability of
a write-off is at the top (bottom) two deciles of the estimated probability distribution and 0
otherwise.
Our focus is on the sign and significance of β4 and β5. If the write-off likelihood model
mirrors the market’s evaluation of goodwill, the coefficient on HIGH*GW should be insignificant
since the market anticipates a goodwill write-off for those cases where the model predicts a high
likelihood of taking a write-off. In contrast, the coefficient on LOW*GW should be significant,
indicating that investors (and the model) did not anticipate the goodwill write-off. Based on the
findings of Hirschey and Richardson (2002), we expect β2, the coefficient on the goodwill written
off, to be negative. Similarly, the bulk of the studies on restructuring (e.g., Lopez (2002) and
Poon et al. (2001)) suggest that the income statement effect of restructurings, as captured by β3, is
likely to be negative.
The results from this analysis are presented in Table 8. Goodwill write-offs are generally
regarded as negative events, with β2 being negative and marginally significant (at the 0.10 level.),
while restructuring charges are associated with positive abnormal returns. The extent to which our
write-off prediction model proxies for the unobservable market expectations is conveyed by the
coefficients β4 and β5. The coefficient on β4 is insignificant, consistent with the notion that the
market anticipates goodwill write-offs that are predicted as most likely to occur by our model. The
coefficient of Low*GW, β5, on the other hand, is negative and significant at the 0.001 level,
suggesting a negative stock price response to “unpredictable” goodwill write-offs. The conflicting
findings mentioned earlier on the market reaction to goodwill write-offs (Francis et al. (1996) and
Hirschey and Richardson (2002)) thus may reflect differences in investors’ ability to predict such
write-offs.
The results of this market test lend credence to the write-off model as a proxy for the
unobservable market expectations of goodwill write-offs. They further suggest that investors use
27
the same financial information upon which the prediction models rely and are thus sensitive to the
availability and quality of such disclosures in making goodwill impairment determinations.
5.3. Opportunistic Timing of Goodwill Write-offs
Our empirical design and the longitudinal data on the performance of acquired firms
enable us to examine the timeliness of goodwill write-offs. It has been argued that the 40-year
maximum amortization period allowed for goodwill under APB Opinion 17 was too long and that
many firms took advantage of this, continuing to report goodwill long after its economic benefits
had expired.41 This argument helped convince the FASB to limit the maximum amortization
period to 20 years in its 1999 Exposure Draft of SFAS 142, in keeping with the maximum period
allowed under International Accounting Standards.42 However, the final statement, rather than
adopting a shorter amortization period, moved to the other extreme, opting instead for no
amortization. The no-amortization provision of the new statement makes the potential for abuse
even greater, despite the presence of the more stringent periodic review requirements also
introduced by the statement.
Assessing the time lag between the deterioration in the economic fundamentals underlying
goodwill’s value and its eventual write-off by management provides insight into how timely
management has been in recording these charges. We conduct this assessment in two ways. First,
we observe the trend in the performance of the host segments over the years preceding the write-
off. Second, using the current and past performance of the host segment, we apply the hazard
model previously used to predict one-year ahead goodwill write-offs to the prediction of goodwill
write-offs occurring two, three, four and five years in the future. Finding a high degree of
predictive power of the model prior to the actual write-off years suggests that write-offs are taken
by management well after the deterioration in performance has occurred.
5.3.1. Operating performance prior to the goodwill write-off
Table 9 shows the mean values of the performance indicators in the years prior to the
write-off for the WO group and a control group of acquisitions. The control group is constructed
by matching each acquisition in the WO group with an acquisition in the no-WO group where the
41 For example, the U.S. Securities Exchange Commission (2000) complained that firms fail to take into account changes in the environment that diminish the value of goodwill, instead opting to use “unrealistically long amortization periods” because this is the “industry practice.” 42 The majority of the FASB members favored an even shorter amortization period of ten-years (see Springsteel, 1999).
28
acquiring firm (1) belongs to the same industry43 and (2) within that industry, is closest in size to
that of the matched firm in the WO group. For each acquisition in the control group, we define the
benchmark year used for comparison purposes as the nth year subsequent to the acquisition where
n is the number of years elapsing between the acquisition and the write-off of the matched
observation in the WO group.
Panel A shows the performance indicators for the observations in the WO group. Note that
the longest prediction horizon for each acquisition in the WO group is limited to the time interval
between that acquisition and the write-off. While one-year-ahead predictions are available for all
of the acquisitions, five-year-ahead predictions are available only for the 93 firms in the WO
group for which the write-off occurs five or more years after the acquisition.
The table reveals a marked and continuous deterioration in the operating performance of
the host segment’s of the WO acquisitions over a period of up to four years preceding the write-
off. No such pattern is observed for the years prior to the benchmark years for acquisitions in the
control group. There is only a slight indication that increased competition contributed to the
deteriorating profitability since the competition levels are not significantly different over the years
leading to the write-off, or between the WO and the non-WO groups.
Even though the results indicate that performance deteriorates well before the goodwill
write-off, they cannot be interpreted necessarily as a long delay between impairment and write-
offs. Note that profitability does not appear to decline significantly until three years prior to the
actual write-off. Given that many businesses recover from stretches of poor financial performance,
a “waiting period” of two to three years over which performance deteriorates before a write-off is
recorded does not seem particularly excessive.
We further test for delayed recognition of goodwill impairment by analyzing write-offs
that occur only six or more years after the acquisitions. This subsample allows an easier
identification of instances of prolonged impairment that goes unrecognized in the financial
statements. We refer to these acquisitions as the “Late WO Group.” Panel B of table 9 shows the
results for the 58 acquisitions in this group. These acquisitions had a long “incubation” period of
at least five years before a write-off was finally recognized. While there may have been a time
lapse following the acquisition before the performance of the acquired entity began to deteriorate,
this does not appear to be the primary reason for the delay. This group exhibits significantly 43 We attempted to match on as many digits of the primary SIC code as possible; if a matching acquisition could not be found based on at least the first two digits of the SIC code, the acquisition was not included in this analysis.
29

poorer performance than the control sample on average, and the deterioration grows dramatically
worse over time. The evidence suggests that the acquiring firms waited not only after some time
had elapsed from the acquisition year, but also until the economic condition of the acquired entity
had worsened considerably in comparison to both the matched no-WO cases shown in Panel B as
well as well to cases where a write-off was taken within the first three years following the
acquisition (the WO group shown in Panel A). Thus while goodwill write-offs for many firms
appear to be made on a timely basis, in about one-third of the cases the findings suggest that the
firm defers the write-off for a number of years.
5.3.2. Long-horizon prediction tests
For the purpose of these tests, we use the performance variables through year t-k (with or
without acquisition indicators) to predict the write-offs of year t (a “k-year-ahead model”), where
k ranges from 2 to 5. The extent of the lag between deteriorating performance and impairment
recognition in the form of goodwill write-off can be inferred from the value of k for which the
model provides the best prediction.
The results are reported in Table 10. The predictive power of both the full model and the
performance-indicators-only model is the highest for one-year-ahead forecasts. This finding
ostensibly indicates that the conditions for the write-off mature only in the year immediately
preceding its recognition. However, the results also show that the predictive power of the models
declines only slightly as the prediction horizon is extended. For example, of acquisitions in the top
two deciles of the write-off probability distribution estimated by the one-year-ahead full model,
42.4% actually have a goodwill write-off. The comparable percentage for the full model for two-,
three-, four- and five-year ahead forecasts are, respectively, 39.3%, 36.0%, 32.3% and 31.2%. The
equivalent numbers for the performance-only model are 35% for the one-year ahead forecast and
somewhat lower values for the longer horizon predictions (33.0%, 29.4%, 28.9% and 25.8%).
The evidence on the long lag between deterioration in performance and goodwill write-off
for the Late WO group (Table 9) coupled with the only minor improvement in the predictability of
goodwill write-offs as the prediction horizon shortens (Table 10) suggest that a considerable
number of acquisitions are associated with an impairment in goodwill that is not, or only belatedly
recognized through a write-off.
30

5.4. SFAS 142 Write-offs
Both the number and amount of goodwill write-offs has increased considerably since firms
began adopting SFAS 142. Some firms cite the overall decline in stock prices as the reason for the
write-off under SFAS 142 (i.e., the carrying value of goodwill now exceeds its fair value).44 Yet,
the timing for many of these write-offs is likely to be motivated by the desire to take advantage of
the one-time opportunity to disclose the write-off as a Cumulative Effect of an Accounting
Change, the disclosure permitted if the write-off is made within six months of SFAS 142’s
adoption. An added advantage of taking a goodwill write-off upon adoption of the new statement
is that such a charge can be presented to investors as the result of a new accounting standard rather
than an indication that management made a poor acquisition. Indeed, as explained earlier, it is
because of these presumed write-off incentives created by SFAS 142 that we exclude these
“concurrent write-offs” from the sample used for our main analyses.
Goodwill write-offs made upon the adoption of SFAS 142 may shed light on the
management’s motivation to initiate them. Our null hypothesis is that these write-offs are as
timely as those in made in prior years. Alternatively, these write-offs may reflect more of a delay.
Managers may simply have been extending the time between the economic deterioration and the
recording of a write-off in general, or they may have been waiting to see what the provisions of
the new standard would entail before recording a charge. Another possibility is that write-offs
taken concurrently with the adoption of SFAS 142 are anticipatory. That is, these write-offs are
taken early, prior to a decrease in the performance of the acquired assets, in order to avoid
reporting impaired goodwill as part of income from continuing operations in future years.
Obviously, a mixture of motivations across firms would result in our inability to reject the null
hypothesis. We test this hypothesis by estimating the goodwill prediction model employing
performance data lagging, alternately, from one year (the one-year-ahead prediction model) to five
years (the five-year-ahead prediction model).
A total of 56 write-offs occurring with the adoption of SFAS 142 that satisfy the selection
criteria of the main sample were identified. These write-offs are fairly large, with an average value
of $665 million. The firms reporting these write-offs are considerably larger than those in the
write-off group (WO) of the final sample and had engaged in three times as many acquisitions.
Further, the goodwill written off was generally associated with 2 to 5 acquisitions and involved 44 See the recent write-offs of unprecedented magnitude taken by AOL-Time Warner, Verizon Communications and Nortel Networks, to name just a few.
31

several segments within the company. In almost three-fourths of the cases, stock was the mode of
consideration.
Table 11, panel A, shows the performance measures for this group of firms over the five
years prior to the adoption-year write-off. The acquired entities in this group performed worse
than those in the previously examined WO group in the year prior to the write-off. Their poor
performance was also evidenced as early as five years prior to the write-off as opposed to three
years of deteriorating performance for the WO group considered in our main analysis. In fact, the
performance of this group of firms resembles the “delayed write-off group” described in Table 9,
panel B.
Using this data in the full model, we generate one-year-ahead to five-year-ahead
predictions for these write-offs. The results, presented in panel B of table 11, suggest that the
model yields considerably more accurate predictions for this sample than it does for write-offs in
the primary sample. The model classifies over 50% of the write-offs in the top two deciles for the
one-year-ahead specification, in contrast to the 42% of the earlier write-offs classified in those
deciles. The greater predictability of these SFAS 142 write-offs is apparently due to their more
pronounced performance deterioration. The model classifies a similarly high percentage of the
SFAS 142 write-offs correctly using performance indicators measured up to three years prior to
the write-off. In fact, there is only a slight decline in the model’s predictive ability when the
performance indicators are measured four or even five years prior to the write-off year. The fact
that their prediction could be made with about the same accuracy as two or three years prior to the
actual write-off suggests that these write-offs lag behind the actual economic deterioration. As
noted above, this lag may be due to the long deliberations (lasting well over three years) that
preceded the passage of the final version of SFAS 142. This period of uncertainty about the
specific provisions of the final statement might have led management to an opportunistic waiting
period.
5.5. Caveats and Sensitivity Analyses
In this section, we discuss potential limitations on the generalizability of the results to the
post-SFAS 142 period as well as some design limitations and their effects on the interpretation of
the results.
First, in forming our primary sample, we eliminated a large number of cases because of an
inability to determine the amount of goodwill arising from the acquisition or to determine the host
32
segment(s) and thereby trace the performance of the acquired entity following its acquisition.
SFAS 142’s requirement that the amount of goodwill associated with an acquisition be reported
alleviates this problem. While the new standard also calls for the disclosure of the allocation of
goodwill among the segment(s) it is expected to benefit, examination of a number of SFAS 142
disclosures reveals that difficulties still remain in associating a particular acquisition’s goodwill
with a segment, especially when the firm engages in multiple acquisitions in a given year.
Second, as explained in section 3, most of the time period examined and most of the
acquisitions in our primary sample lie in the pre-1997 period when the segment disclosures were
made in accordance with SFAS 14 instead of SFAS 131. To determine whether the change in the
segment reporting requirements altered the results, we separately examined acquisitions that
occurred after 1997, in the post-SFAS 131. We find that the frequency of cases where there is
insufficient information on goodwill or where a write-off could not be traced to the host segment
declined only moderately in the post-SFAS 131 period, from 45% (see Table 3) to 42%. Further,
the prediction tests on these later write-off cases reveal that the same patterns observed in the
analysis of earlier data. Specifically, the lack of sufficient disclosures to trace goodwill to a
reportable unit within the firm and the quality of the available data continues to hamper investors’
ability to determine goodwill impairment.
Third, the acquisitions and the goodwill write-offs in our primary analysis occur prior to
the enactment of SFAS 142. While our sample consists of firms that made disclosures comparable
with those required by SFAS 142, these write-offs were made while goodwill amortization was
required. The amounts written off were thus in excess of the amortized amount. Impairment
charges subsequent to the adoption of SFAS 142 may thus be greater than those we identified,
incorporating amounts that would have otherwise been amortized. Or, the average amount of
future write-offs may be lower if managers exercise even greater discretion in determining the
timing and amount of the write-off. 45
Relatedly, in the post-SFAS 142 period, the elimination of amortization and the mandatory
periodic review of goodwill may increase the frequency of write-offs in the future, reducing the
lag between economic deterioration and write-offs. However, note that until the introduction of
APB 17 in 1970, goodwill was not amortized in accordance with ARB 43 of 1953 and the
45 A preliminary analysis on 96 write-offs made subsequent to the adoption of SFAS 142 indicates that the amount of these write-offs is considerably smaller, both as a percentage of the existing goodwill and as a percentage of assets, than those occurring prior to adoption of the new standard.
33
prevailing practice of that period. Although there is no reliable empirical evidence on the
frequency of write-offs in that era, our limited evidence suggests that write-offs were, in fact,
much less frequent in those days than in more recent years when amortization was required.46
A limitation of our design that deserves mention is the identification of the timing of the
goodwill impairment. Unlike the bankruptcy event, whose timing may reflect the effect of external
circumstances rather than management determination, the timing of a goodwill write-off is left, to
a large extent, to management discretion. Consequently, our prediction tests gauge our ability to
predict the timing of the write-off chosen by management rather than the actual (unobserved)
timing of impairment. This affects the interpretation of some of our results. In particular, our
conclusion regarding the relatively low predictive power of accounting performance measures
could be more of a reflection of the arbitrary timing of goodwill write-offs by management than
the poor quality of segment reporting. Two types of evidence, however, suggest that disclosure
deficiencies rather than errors in measuring the timing of goodwill impairment are the main culprit
in the relatively low predictive power of our model. First, as explained in section 5.1, the
unavailability of data prevents the analysis of a significant percentage of the acquisitions. The
difficulties in predicting goodwill impairment for the observations for which such data are
available represent an important obstacle confronting investors interested in evaluating the
goodwill balance beyond the quality of the available disclosures. Second, as noted earlier, the
timing of a portion of the goodwill write-offs is associated with the disposition (often at a loss) of
the host segment. This is a real event whose timing is less prone to management reporting
behavior than recording an accounting accrual such as a goodwill write-off.
6. Concluding Remarks
Given the increased prominence of goodwill on the companies’ balance sheets and the
abolishment of its systematic amortization, an accurate evaluation of this asset becomes an
important issue. The paper addresses the question of whether available mandated disclosures allow
an adequate identification of impaired goodwill. We attempt to answer this question by analyzing
the acquisition characteristics, subsequent performance and goodwill write-offs of 1,276
acquisitions made over the years 1988 to 1998. The disclosures are comparable with those 46 We discussed goodwill write-off activity prior to 1970 with a few senior and retired partners of leading accounting firms. They indicated that goodwill write-offs were very rare. Further, examining Compustat data items prior to 1970, specifically the intangible asset account in conjunction with expenses recorded as special items on the income statement, suggest not only that goodwill write-offs were very infrequent, but write-offs of any sort were unusual.
34
required under SFAS 142 in that the amount of goodwill arising from an acquisition can be
identified and traced to a particular segment or segments within the acquiring firm. The results
suggest that the ability to predict goodwill impairment based on information provided in the
financial statements is limited. This is due to the paucity and low quality of segment disclosures
for those segments that are identified as host segments. Certain acquisition characteristics such as
the premium paid, the percentage of the purchase price assigned to goodwill, and the mode of
consideration appear to contribute more to the prediction of goodwill write-offs than available
disclosures on the acquired entity in the years subsequent to the acquisition.
These results are troubling since they suggest that the amount and quality of current
financial disclosures do not allow investors, auditors and other users of financial statements to
effectively evaluate the appropriateness of management determinations regarding goodwill
impairment. This finding is particularly unsettling in the post-SFAS 142 period because, in the
absence of impairment recognition by management, goodwill balances will remain on the books
indefinitely. Although the new statement requires that the amount of goodwill arising from an
acquisition and its allocation within the acquiring firm be identified, this may only alleviate the
initial problems in evaluating goodwill. To the extent that the performance of the acquired entity
cannot be followed through time because it is assigned to more than one host segment, assigned at
the component level, assigned to a reporting unit that differs from the firm’s reported operating
segments, or because the firm makes subsequent acquisitions, restructures or reallocates goodwill
among its segments, means that goodwill’s ongoing value will be difficult for outsiders to
determine.
Another finding of the study is that a large number of goodwill write-offs appear to be
taken only after a considerable period of time has elapsed after the economic deterioration of the
associated entity. This delay has implications for the carrying value of goodwill and for the
credibility of financial statements where goodwill is a substantial asset.
Finally, most indications, including the results from analyzing a subsample of acquisitions
conducted after the introduction of SFAS 131, lead us to conclude that the new reporting regime
introduced by SFAS 131 and SFAS 142 is not likely to improve the availability and quality of
financial data helpful in predicting goodwill write-offs. Nonetheless, a more comprehensive
analysis to validate this conclusion will be needed after more experience is acquired in the post-
SFAS 142 era.
35

References
Aboody, D., Barth, M. and R. Kasznik, 2004, “Firm’s Voluntary Recognition of Stock-Based Compensation Expense,” Journal of Accounting Research, v. 42, n2, 123-150. Aboody, D., Kasznik, R. and M. Williams, 2000, “Purchase versus Pooling in Stock-for-Stock Acquisitions: Why Do Firms Care?” Journal of Accounting and Economics, v29, n3: 261-286. Altman, E.I., 1968, “Financial Ratios, Discriminant Analysis, and the Prediction of Corporate Bankruptcy,” Journal of Finance, v23: 589-609. __________, 1982, “Accounting Implications of Failure Prediction Models,” Journal of Accounting, Auditing and Finance, v6, n1: 4-20. American Institute of Certified Public Accountants, 1970, Accounting Principles Board Opinion No. 17, Intangible Assets. __________, 1988, Statement of Auditing Standards No. 59, The Auditor’s Consideration of an Entity’s Ability to Continue as a Going Concern. Begley, J., Ming, J. and S. Watts, 1996, “Bankruptcy Classification Errors in the 1980s: An Empirical Analysis of Altman’s and Ohlson’s Models, Review of Accounting Studies, v1:267-284. Botosan, C. A and Harris, M. S., 2000, “Motivations for a Change in Disclosure Frequency and its Consequences: An Examination of Voluntary Quarterly Segment Disclosures,” Journal of Accounting Research, v38, n2: 329-353. Deakin, E.B., 1972, “A Discriminant Analysis of Predictors of Business Failure,” Journal of Accounting Research, v10, n1: 167-179. Financial Accounting Standards Board, 1985, Concepts Statement No. 6, Elements of Financial Statements. __________, 1999, Proposed Statement of Accounting Standards, Exposure Draft: Business Combinations and Intangible Assets. __________, 2001, Proposed Statement of Accounting Standards, Revised Exposure Draft: Business Combinations and Intangible Assets—Accounting for Goodwill. __________, 1995, Statement of Financial Accounting Standards No. 121, Accounting for the Impairment of Long-lived Assets and Long-lived Assets to Be Disposed Of. __________, 1997, Statement of Financial Accounting Standards No. 131, Disclosures about Segments of an Enterprise and Related Information. __________, 2001, Statement of Financial Accounting Standards No. 141, Business Combinations. __________, 2001, Statement of Financial Accounting Standards No. 142, Goodwill and Other Intangibles.
36

Francis, J.J., Hanna, D. and L. Vincent, 1996, “Causes and Effects of Discretionary Asset Write-offs,” Journal of Accounting Research, v34, Supplement: 117-134. Giliberto, S. and N. Varaiya, 1989, “The Winner's Curse and Bidder Competition in Acquisitions: Evidence from Failed Bank Auctions,” Journal of Finance, v44, n1: 59-75. Givoly, D., Hayn, C. and J. D’Souza, 1999, “Measurement Errors and the Information Content of Segment Reporting,” Review of Accounting Studies, v4, n1, 1999: 15-43. Harris, M., 1998, “The Association Between Competition and Managers' Business Segment Reporting Decisions,” Journal of Accounting Research, v36, n1: 111-128. Hayward, M., 2002, “When Do Firms Learn from Their Acquisition Experience? Evidence from 1990-1995,” Strategic Management Journal, v23: 21-39. Healy, P., Palepu, K. and R. Ruback, 1992, “Does Corporate Performance Improve After Mergers?” Journal of Financial Economics, v31, n2: 135-175. Henning, S., Lewis, B. and W. Shaw, 2000, “Valuation Components of Purchased Goodwill Using Market Measures,” Journal of Accounting Research, v38, n2: 375-387. Henning, S. and W. Shaw, 2003, “Is the Selection of the Amortization Period for Goodwill a Strategic Choice?” Review of Quantitative Finance and Accounting, v20: 315-333. Hirschey, M. and V. Richardson, 2002, “Information Content of Accounting Goodwill Numbers,” Journal of Accounting and Public Policy, v. 21, n3: 173-191. International Accounting Standards Board, 1994, Accounting Standard No. 22, Business Combinations. Jennings, R., Robinson, J., Thompson, R. and L. Duvall, 1996, “The Relation between Accounting Goodwill Numbers and Equity Values,” Journal of Business Finance & Accounting, v23, n4: 513-534. Lewis, E., Lippitt, J. and N. Mastracchio, 2001, “Users’ Comments on SFAS 141 and 142 on Business Combinations and Goodwill,” The CPA Journal, v71, n10: 26-30. Lopez, T., 2002, “Evidence on the Incremental Information Contained in the Components of Restructuring Charges,” Journal of Business Finance & Accounting, v49, n5-6: 613-659. Loughran, T. and A. Vijh, 1997, “Do Long-term Shareholders Benefit from Corporate Acquisitions?” Journal of Finance, v. 52, n5: 1765-1790. Lys, T. and L. Vincent, 1995, “An Analysis of Value Destruction in AT&T’s Acquisition of NCR,” Journal of Financial Economics, v39, n2-3: 353-378. Mandel, M. and C. Yang, 1997, “A Pack of 800-Lb. Gorillas,” Business Week, n3512, Feb 3: 34-35.
37McGavock, D., 2002, “Intangible Assets: A Ticking Time Bomb, Chief Executive, n183: 22-24.
Mergers and Acquisitions, 2001, “FASB Compromises on Pooling,” v36, n1: 16. Niederhoffer, V. and L. Kenner, 2002, “5 Ways to Give Acquisitions the Inquisition,” The Speculator, moneycentral.msn.com, July 18. Ohlson, J., 1980, “Financial Ratios and the Probabilistic Prediction of Bankruptcy,” Journal of Accounting Research, v18, n1: 109-131. Poon, P., Newbould, G. and C. Durtschi, 2001, “Market Reactions to Corporate Restructurings,” Review of Quantitative Finance and Accounting, v16, n3: 269-290. Pryor, Frederic L., 2001, “Dimensions of the Worldwide Merger Boom,” Journal of Economic Issues, v35, n4: 825-840. Ravenscraft, D. and F. Scherer, 1991, “Divisional Sell-Off: A Hazard Function Analysis,” Managerial & Decision Economics, v12, n6: 429-438. Rhoades, S., 1993, “The Herfindahl-Herschman Index,” Federal Reserve Bulletin, v79, n3: 188-189. Ruback, R., 1983, “Assessing Competition in the Market for Corporate Acquisitions,” Journal of Financial Economics, v11, n1-4: 141-153. Schneider, C., 2001, “Will the FASB Finish on Time? Why the Goodwill Accounting Proposal Still Needs A Lot of Work,” CFO.com, April 16. Sender, H., 2002, “Deals & Deal Makers: Flood of Firms to Take Goodwill Write-downs,” The Wall Street Journal, April 24. Shumway, T., 2001, “Forecasting Bankruptcy More Accurately, A Simple Hazard Model,” Journal of Business, v74, n1: 101-124. Sorkin, A.R., 2001, “Everybody Out of the Pool? A New Path on Mergers,” The New York Times, January 7. Springsteel, I., 1999, “Draining the Pool,” CFO Magazine. U.S. Securities Exchange Commission, 2000, Division of Corporate Finance: Current Accounting and Disclosure Issues. __________, 2001, Speech given by L. Turner, “The Times They Are A-Changing,” May 18. Watts, R., 2003, “Conservatism in Accounting – Part I: Explanations and Implications,” Accounting Horizons, v17, n3: 207-221. Zmijewski, M., 1984, “Methodological Issues Related to the Estimation of Financial Distress Prediction Models,” v22, n1: 59-87.
38

Table 1
Distribution of Sample Acquisitions by Year
Acquisition Year Number. of Acquisitions
Number (%) of Acquisitions Resulting in a Write-off by the end
of 2001 1988 54 8 (14.8%) 1989 76 15 (19.7%) 1990 80 15 (18.8%) 1991 97 19 (19.6%) 1992 114 22 (19.3%) 1993 122 26 (21.3%) 1994 128 22 (17.2%) 1995 142 19 (13.4%) 1996 148 14 (9.5%) 1997 153 11 ( 7.2%) 1998 162 9 ( 5.6%)
1988-1994 671 127 (18.9%) 1995-1998 605 53 ( 8.8%)
Total 1,276 180 (14.1%)
39

Table 2 Descriptive Statistics on Indicators for the Write-off and Non-Write-off Groups
Write-off Group
(n=180) Non-Write-off Group
(n=1,096) Difference in mean values (t-statistic)a
Mean Median Mean Median Firm size (in millions) $3,784.6 $789.2 $4,295.2 $862.8 ($510.6) (1.38 ) Host segment size (in millions) $1,354.2 $592.6 $1,626.7 $792.7 ($272.5) (1.47 ) Number of segments per firm 3.32 3.00 3.84 4.00 (0.52) (0.63 ) Acquisition Indicators Premium as % of acquired firm’s value 47.6 39.5 40.8 36.2 6.8 (2.88)*** Goodwill as % of acquisition price 58.4 55.6 44.8 39.5 13.6 (4.37)*** % of stock acquisitions 41.6 34.5 7.1 Announcement period returns as a % -3.3 -4.2 -1.2 -1.0 -2.1 (-2.32)*** % of acquisitions with multiple bidders 12.1 13.5 -1.4 Number of prior acquisitions 6.2 5.0 8.9 7.0 -2.7 (-1.44) Performance Indicators (Variables are measured at the end of the second year following the acquisition year) Return on assets as a % -4.5 1.1 2.1 4.2 -6.6 (-3.56)*** Change in return on assets as a % -3.3 -2.9 1.2 1.6 -4.5 (-4.38)*** % with operating losses 66.1 49.5 16.6 Change in sales as a % 2.3 3.6 4.6 4.1 -2.3 (-1.38)
Change in level of competition as a % 11.9 9.6 14.7 13.1 -3.8 (-0.98 ) Firm-level return on assets as a % 2.8 2.4 2.9 2.6 -0.2 (-0.58) Cumulative abnormal returns as a % -5.2 -3.8 -3.7 -2.1 -1.5 (-1.54) a Significantly different at the 0.001 level (***), the 0.01 level (**) or the 0.05 level (*) b Percentages shown are for pure stock acquisitions and acquisitions that involved at least 75% stock c Performance indicators for the WO group are based on those firms that have not yet taken a write-off Legend Firm size: Total assets of acquiring firm at year-end prior to year of the acquisition announcement Host segment size: Identifiable assets at the year-end prior to year of the acquisition announcement No. of segments: Acquiring firm segments reported at year-end prior to year of acquisition announcement Premium: Amount paid in excess of the acquired firm’s average market value over the pre-announcement period Percentage of stock acquisitions: Acquisitions where at least 75% of the consideration consisted of stock Announcement returns: Cumulative abnormal returns to the acquiring firm around the acquisition announcement No. of prior acquisitions: Acquisitions made by acquiring firm over 3-year period ending with announcement year Segment variables: Return on assets: Ratio of host segment’s operating income divided by its assets Operating loss: Variable coded as 1 if operating income is negative and 0 otherwise Change in level of competition: Annual change in the Herfindahl index, Σ [si/S]2 where s is the sales of the host segment and S is the sum of the sales of all of the segments operating in the same (4-digit) industry Firm-level variables: Return on assets: Ratio of firm’s income from continuing operations divided by its assets Cumulative abnormal returns: Annual cumulative abnormal return of the acquiring firm
40

Table 3 Descriptive Statistics on Final Sample and Goodwill Write-offs
Sample Selection Number of acquisitions that met the sample selection criteria 2,852 (100.0%) Less acquisitions: with insufficient information about goodwill - 1,082 ( 37.9%) for which the host segment(s) could not be determined - 494 ( 17.4%)Number of acquisitions in the final sample 1,276 ( 44.7%) Write-off Occurrence Number of acquisitions resulting in a goodwill write-off 180 % of acquisitions that result in a goodwill write-off 14.1% % of firm-years that result in a goodwill write-offa 2.3% Size of Write-off Mean (median) amount of goodwill written off (in millions) $ 421.8 ($ 44.2)Mean (median) amount of goodwill written off as a % of : initial goodwill 66.2% (55.1%) total assets 11.2% ( 5.7%) market value 6.1% ( 3.9%)Mean (median) remaining years in amortization periodb 26.1 ( 23.5) % of write-offs accompanied by restructuring charge or other asset write-off 68.4% % of write-offs where acquired entity is sold at a lossc 12.3% Timing of Write-off Mean (median) length of period from acquisition to goodwill write-off 4.7 (4.0) years
one year following the acquisition 3.9% two years following the acquisition 11.1% three years following the acquisition 17.2% four years following the acquisition 16.7% five years following the acquisition 18.3%
Percentage of goodwill write-offs occurring:
six to eleven years following the acquisition 32.8% 100.0%
one year following the acquisition 0.5% two years following the acquisition 1.6% three years following the acquisition 2.4% four years following the acquisition 2.4% five years following the acquisition 2.6%
Probability that an acquisition will result in a write-off exactly:
six to eleven years following the acquisition 4.6%
first year following the acquisition 13.6% second year following the acquisition 12.2% third year following the acquisition 10.0%
Probability that an acquisition will lead to a write-off in the future conditional upon there being no write-off by the end of the: fourth year following the acquisition 7.7% a Computed as the number of write-offs (180) divided by the total number of firm-years in the sample (7,916). b Where the amortization period for the goodwill arising from the acquisition was not explicitly given, we used the average
amortization period for goodwill employed by the firm. c If the host segment or some portion of it was sold at a loss (reported as either discontinued operations or a loss within income
from continuing operations), this was interpreted as a goodwill write-off to the extent that the amount of the loss was less than or equal to the balance of goodwill.
41

Table 4 Estimates of the Predictive Model
WRITE-OFFit = α +β1PREMiA +β2BIDiA +β3GW%iA +β4STOCKiA +β5ANNRETiA +β6ACQNiA +β 7ROAn +β8∆ROA n +β9LOSS n +β10 ∆SALES n +β11∆COMP n + β12 FIRMROAn + β12 FIRMRETn + ε [2]
(n=638 acquisitions and 4,082 firm-years)
Variable Prediction Full Model Acquisition Indicators
Performance Indicators
Intercept -3.274 (0.000) a
-4.837 (0.000)
-6.429 (0.000)
Acquisition Indicators Premium (PREM) + 3.612
(0.020) 4.878
(0.026)
Multiple bidders (BID) + 0.260 (0.539)
0.561 (0.409)
Goodwill as percentage of acquisition cost (GW%) + 2.962 (0.000)
3.973 (0.008)
Mode of consideration (STOCK) + 3.611 (0.000)
3.927 (0.032)
Announcement period returns (ANNRET) - -3.583 (0.120)
-4.826 (0.093)
Intensity of acquisition activity (ACQN) + 0.182 (0.351)
0.346 (0.298)
Performance Indicators Return on assets (ROA) - -2.340
(0.069) -2.165
(0.045) Change in return on assets (∆ROA) - -4.974
(0.018) -2.088
(0.021) Operating loss (LOSS) + 1.346
(0.144) 1.976
(0.112) Change in sales (∆SALES) - -2.712
(0.297) -1.864
(0.214) Change in competition (∆COMP) + 3.243
(0.426) 7.345
(0.267) Firm-level return on assets (FIRMROA) - -1.844
(0.195) -2.034
(0.174) Cumulative abnormal returns (FIRMRET) - -2.086
(0.168) -2.680
(0.133) Pseudo R2 0.128 0.098 0.059 a p-values given in parentheses Legend Premium: Amount paid in excess of the acquired firm’s average market value over the pre-announcement period Multiple bidders: Variable coded as 1 if more than one bidder is present and 0 otherwise Goodwill as fraction of acquisition price: Fraction of the acquisition cost assigned to goodwill Announcement returns: Cumulative abnormal returns to the acquiring firm’s shareholders around the acquisition announcement Mode of consideration: Variable coded as 1 if stock is the primary mode of consideration and 0 otherwise Intensity of acquisition activity: Number of acquisitions made over the three-year period ending with the announcement year Return on assets: Ratio of host segment’s operating income to its assets Change in return on assets: Difference in current year return on assets and that of prior year Operating loss: Variable coded as 1 if average operating income is negative and zero otherwise Change in sales: Rate of change in sales from previous year Change in level of competition: Change from previous year in the Herfindahl index Firm-level return on assets: Ratio of the firm’s income from continuing operations to its total assets Cumulative abnormal returns: Annual cumulative abnormal returns of the acquiring firm
42

Table 5 Predictive Ability of Acquisition and Performance Indicators
with respect to Goodwill Write-offs
% of Actual Write-offs Occurring in the Following Year (Average predicted probability of a write-off)
Decile of the model’s estimated probability of a
write-off
Full Model Acquisition Indicators Only Model
Performance Indicators Only Model
1: highest probability 24.5a
(67%) 21.1
(60%) 18.8
(56%) 2 17.9
(56%) 15.6
(46%) 14.6
(42%) 3 14.3
(45%) 13.3
(36%) 12.2
(37%) 4 11.1
(33%) 12.2
(29%) 10
(26%) 5 8.8
(25%) 8.9
(23%) 7.8
(20%) 6-10: lowest probability 23.3
(14%) 28.9
(15%) 36.7
(16%) Total 100 100 100
a Percentages shown reflect the number of actual write-offs occurring in the following year for observations ranked in each decile. For example, 24.5% of the firms in the first cell, representing the decile of firms predicted as being most likely to take a write-off, actually took a write-off. The average predicted probability that firms in this decile will take a write-off is 67%.
43

Table 6
Type I and Type II Errors from Predictive Model
Actual Outcome for the Following Year: Number of Cases and %
Predictive Model
Model prediction for the following year: A write-off No write-off
Full Model
a write-offa
38 42.2%
166 30.3%
(Type I Error) no write-off 52
57.8% (Type II Error)
382 69.7%
Acquisition Characteristics Only
a write-offa
33 36.7%
182 33.2%
(Type I Error) no write-off 57
63.3% (Type II Error)
366 66.8%
Performance Indicators Only
a write-offa
29 32.2%
199 36.3%
(Type I Error) no write-off 61
67.8% (Type II Error)
349 63.7%
a The dichotomous prediction is based on whether the estimated probability of the observation is above a certain cut-off point. We use a cut-off point that represents the top 20% of the estimated probability of a write-off. This demarcation point is 0.5 and 0.4 for, respectively, the full model and the partial models (acquisition-characteristics only and performance-only).
44

Table 7 Predictive Ability of the Full Goodwill Write-off Model
as Compared with Bankruptcy Prediction Modelsa
% of Actual Bankruptcies a Decile of the model’s estimated probability of the
predicted event (write-off or bankruptcy)
% of Actual Write-offs Altman
(1968) Begley, Ming and
Watts (1993) Shumway
(2001)
1: highest probability 24.5 42.3 52.3 75.0 2 17.9 12.6 11.7 12.5 3 14.3 12.6 8.1 6.3 4 11.1 9.0 6.3 1.8 5 8.8 8.1 5.4 0.9
6-10: lowest probability 23.3 15.4 16.2 3.5 Total 100.0 100.0 100.0 100.0
a as reported in Shumway (2001)
45

Table 8 Relationship between the Model’s Unexpected Write-offs and
the Market Reaction to Write-off Announcements1 CARit=α + β1UNEXPit + β2GWit + β3RESTit + β4(HIGHit*GWit) + β5(LOWit*GWit) + εit [3]
(n =66)
α β1 β 2 Β 3 β 4 β 5 R2
-0.004 (-1.30)
0.051 (2.24)
-0.029 (-1.84)
0.259 (2.67)
-0.012 (-1.48)
-0.027 (-2.43)
0.028
1 t-statistics provided in parentheses.
Legend CAR: Cumulative abnormal returns to the acquiring firm’s shareholders, calculated over the 5-day period centered on the earnings announcement date All independent variables described below are standardized by the market value of equity at the end of the quarter prior to the quarter of the earnings announcement. UNEXP: Unexpected earnings measured as actual earnings for the year excluding the goodwill write-off and any restructuring charges (on an after-tax basis) minus expected earnings GW: After-tax amount of the goodwill write-off (computed as the product of the write-off and one minus the effective tax rate, where the effective tax rate is estimated as the current portion of the tax expense divided by pretax income) REST: After-tax amount of restructuring charge excluding goodwill write-off (computed as the product of the restructuring charge and one minus the effective tax rate, where the effective tax rate is estimated as the current portion of the tax expense divided by pretax income) HIGH: Set equal to 1.0 if the estimated probability of a write-off is in the top two deciles of the estimated probability distribution and 0 otherwise. LOW: Set equal to 1.0 if the estimated probability of a write-off is in the bottom two deciles of the estimated probability distribution and 0 otherwise
46

Table 9 Mean Values of Performance Measures for the Write-off Group
Over the Period Preceding the Write-off
Number of years prior to year of write-off (or, prior to the benchmark year for the control groupa)
Performance Measure One year Two years
Three years
Four years
Five years
A: Write-off group (n=180)a (n=173) (n=153) (n=121) (n=93) Segment Return on assets -0.082 -0.045 -0.012 0.022 0.030 Change in return on assets -0.037 -0.033 -0.034 -0.008 0.004 Percentage with operating losses 78.3 66.1 63.3 53.9 47.2 Change in sales as a % 1.0 2.3 3.2 4.9 5.1 Change in level of competition as a % 13.6 11.9 12.9 11.5 12.2 Firm-level return on assets 0.026 0.031 0.035 0.028 0.032 Annual cumulative abnormal returns as a % -3.8 -4.2 -4.4 -3.9 -5.3 Control group of non-write-offs casesb (n=180) Return on assets 0.030 0.028 0.023 0.027 0.022 Change in return on assets -0.002 0.005 -0.004 0.005 0.008 Percentage with operating losses 54.4 52.7 47.2 54.4 52.2 Change in sales as a % 3.2 3.7 5.0 4.8 4.5 Change in level of competition as a % 11.3 14.2 12.6 8.9 10.5 Firm-level return on assets 0.030 0.036 0.041 0.040 0.034 Annual cumulative abnormal returns as a % -1.8 -2.7 2.9 1.4 -2.8 B: Late write-off groupc (n=58) Return on assets -0.136 -0.107 -0.085 -0.067 -0.040 Change in return on assets -0.030 -0.023 -0.019 -0.007 -0.031 Percentage with operating losses 82.6 75.2 69.8 59.1 67.3 Change in sales as a % -5.6 -3.7 -2.9 -4.3 2.1 Change in level of competition as a % 14.8 17.6 15.9 13.2 14.7 Firm-level return on assets 0.017 0.021 0.026 0.029 0.031 Annual cumulative abnormal returns as a % -3.3 -4.1 -4.3 -3.6 -2.6 Control group of non-write-off casesb (n=58) Return on assets -0.048 -0.030 -0.036 -0.022 -0.024 Change in return on assets -0.019 0.006 -0.012 0.002 0.004 Percentage with operating losses 64.4 55.3 61.2 48.4 50.9 Change in sales as a % -2.6 -1.4 -1.9 2.1 3.4 Change in level of competition as a % 11.5 13.8 13.3 12.0 12.6 Firm-level return on assets 0.032 0.041 0.034 0.036 0.035 Annual cumulative abnormal returns as a % 2.0 -2.9 -2.2 1.8 -1.5
a For each acquisition in the control group we define a benchmark year as the nth year subsequent to the acquisition where n is the number of years elapsing between the acquisition and the write-off of the matched observation in the WO group.
b Firms in the write-off groups were matched with firms in the non-write-off group based on industry (as ascertained by the first 4, 3 or 2-digits of the SIC code) and asset size.
c Cases where write-off occurs 6 to 11 years following the acquisition year. Return on assets: Ratio of host segment’s operating income divided by its assets Operating loss: Variable coded as 1 if average operating income is negative and 0 otherwise Change in level of competition: Annual change in the Herfindahl index Firm-level return on assets: Ratio of firm’s income from continuing operations to its total assets
47
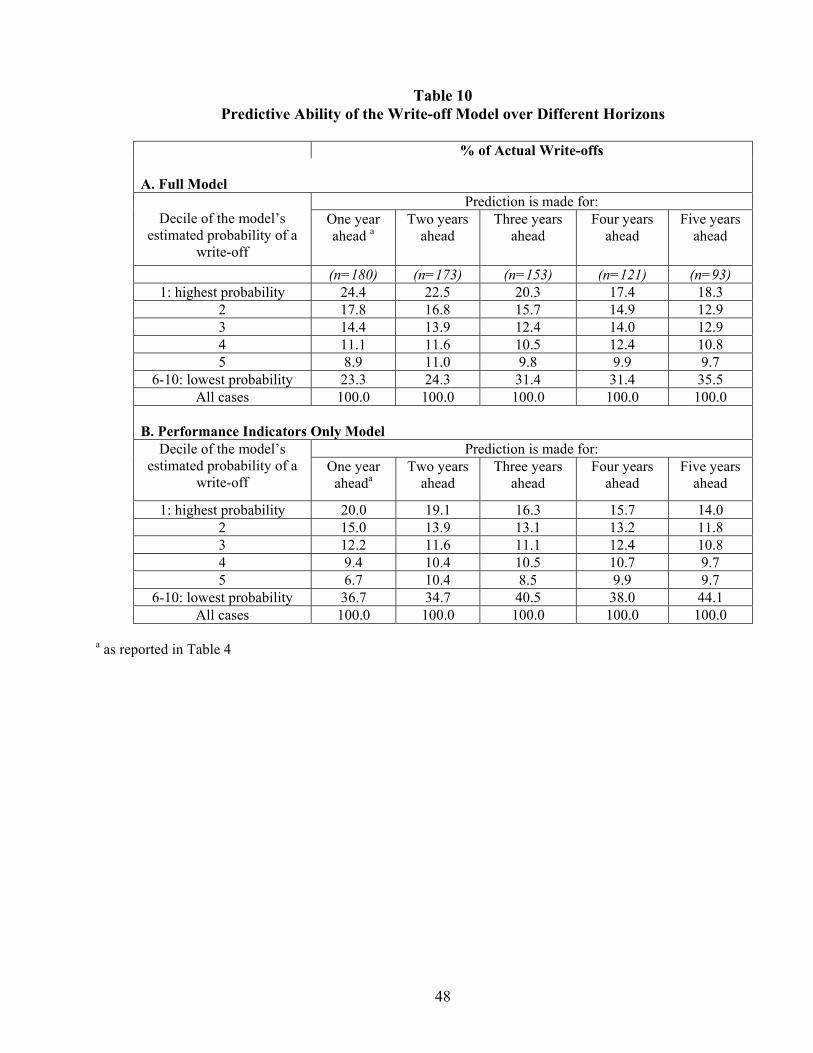
Table 10 Predictive Ability of the Write-off Model over Different Horizons
% of Actual Write-offs A. Full Model
Prediction is made for: Decile of the model’s
estimated probability of a write-off
One year ahead a
Two years ahead
Three years ahead
Four years ahead
Five years ahead
(n=180) (n=173) (n=153) (n=121) (n=93) 1: highest probability 24.4 22.5 20.3 17.4 18.3
2 17.8 16.8 15.7 14.9 12.9 3 14.4 13.9 12.4 14.0 12.9 4 11.1 11.6 10.5 12.4 10.8 5 8.9 11.0 9.8 9.9 9.7
6-10: lowest probability 23.3 24.3 31.4 31.4 35.5 All cases 100.0 100.0 100.0 100.0 100.0
B. Performance Indicators Only Model
Prediction is made for: Decile of the model’s estimated probability of a
write-off One year
aheada Two years
ahead Three years
ahead Four years
ahead Five years
ahead
1: highest probability 20.0 19.1 16.3 15.7 14.0 2 15.0 13.9 13.1 13.2 11.8 3 12.2 11.6 11.1 12.4 10.8 4 9.4 10.4 10.5 10.7 9.7 5 6.7 10.4 8.5 9.9 9.7
6-10: lowest probability 36.7 34.7 40.5 38.0 44.1 All cases 100.0 100.0 100.0 100.0 100.0
a as reported in Table 4
48
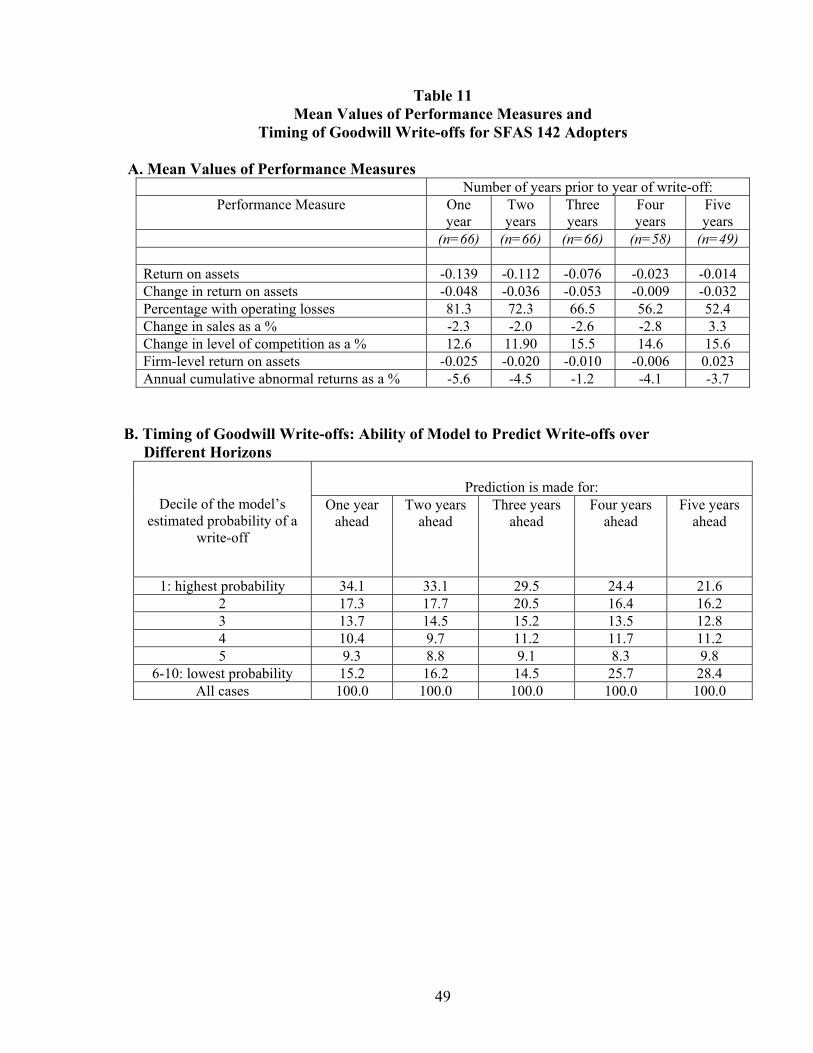
49
Table 11 Mean Values of Performance Measures and
Timing of Goodwill Write-offs for SFAS 142 Adopters A. Mean Values of Performance Measures
Number of years prior to year of write-off: Performance Measure One
year Two years
Three years
Four years
Five years
(n=66) (n=66) (n=66) (n=58) (n=49) Return on assets -0.139 -0.112 -0.076 -0.023 -0.014 Change in return on assets -0.048 -0.036 -0.053 -0.009 -0.032 Percentage with operating losses 81.3 72.3 66.5 56.2 52.4 Change in sales as a % -2.3 -2.0 -2.6 -2.8 3.3 Change in level of competition as a % 12.6 11.90 15.5 14.6 15.6 Firm-level return on assets -0.025 -0.020 -0.010 -0.006 0.023 Annual cumulative abnormal returns as a % -5.6 -4.5 -1.2 -4.1 -3.7
B. Timing of Goodwill Write-offs: Ability of Model to Predict Write-offs over Different Horizons
Prediction is made for:
Decile of the model’s estimated probability of a
write-off
One year ahead
Two years ahead
Three years ahead
Four years ahead
Five years ahead
1: highest probability 34.1 33.1 29.5 24.4 21.6 2 17.3 17.7 20.5 16.4 16.2 3 13.7 14.5 15.2 13.5 12.8 4 10.4 9.7 11.2 11.7 11.2 5 9.3 8.8 9.1 8.3 9.8
6-10: lowest probability 15.2 16.2 14.5 25.7 28.4 All cases 100.0 100.0 100.0 100.0 100.0