leaf classification using local features · leaf classification using local features stefan fiel...
TRANSCRIPT
Leaf classification using local features
Stefan Fiel and Robert Sablatnig
Institute of Computer Aided AutomationVienna University of Technology, Austria
{fiel,sab}@prip.tuwien.ac.at
AbstractThis paper proposes a method for an automatic identification of plant species from low quality pic-tures of their leaves created using mobile devices. Since the images should be taken from all kindof people the condition of the image taking cannot be controlled. Thus to avoid segmentation of theimages local features are used which are scale and rotation invariant. For classification a SupportVector Machine using a “bag-of-keypoint” is applied. Preliminary results are shown on a dataset ofleaves from the five most common broadleaf trees in Austria.
1 Introduction
Correct identification of plant species from leaves, needles or bark is a task which requires ex-pertise which is in possession of botanists, foresters, and biologists. Within a project with the“Osterreichischen Bundesforste AG” (“Austrian Federal Forests”) the main goal is to automaticallyclassify leaves from pictures of mobile devices. With increasing capabilities of mobile devices, likeresolution of the integrated camera, more computing power, and pervasiveness of broadband internetthis task can be taken over by the mobile device. Children, students and interested adults for instancecan identify the plant species during a walk with their mobile devices for pedagogic reasons. Thispaper focuses on identifying plant species from photos of leaves.
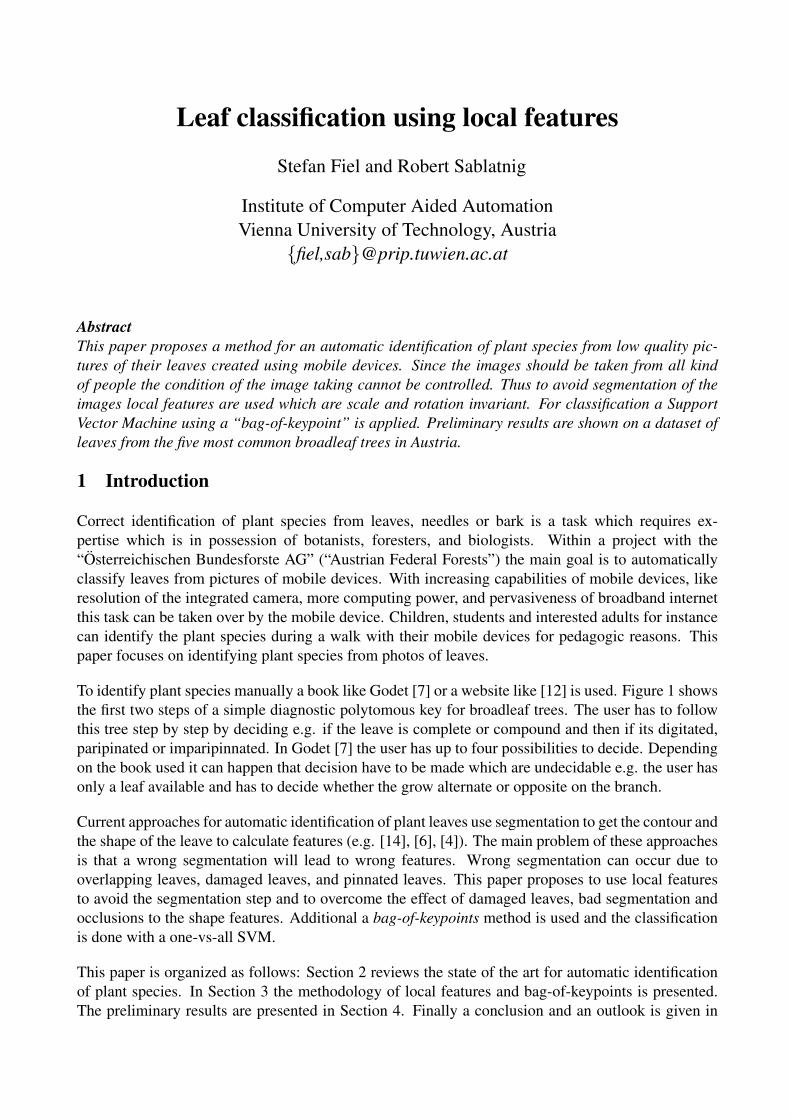
To identify plant species manually a book like Godet [7] or a website like [12] is used. Figure 1 showsthe first two steps of a simple diagnostic polytomous key for broadleaf trees. The user has to followthis tree step by step by deciding e.g. if the leave is complete or compound and then if its digitated,paripinated or imparipinnated. In Godet [7] the user has up to four possibilities to decide. Dependingon the book used it can happen that decision have to be made which are undecidable e.g. the user hasonly a leaf available and has to decide whether the grow alternate or opposite on the branch.
Current approaches for automatic identification of plant leaves use segmentation to get the contour andthe shape of the leave to calculate features (e.g. [14], [6], [4]). The main problem of these approachesis that a wrong segmentation will lead to wrong features. Wrong segmentation can occur due tooverlapping leaves, damaged leaves, and pinnated leaves. This paper proposes to use local featuresto avoid the segmentation step and to overcome the effect of damaged leaves, bad segmentation andocclusions to the shape features. Additional a bag-of-keypoints method is used and the classificationis done with a one-vs-all SVM.
This paper is organized as follows: Section 2 reviews the state of the art for automatic identificationof plant species. In Section 3 the methodology of local features and bag-of-keypoints is presented.The preliminary results are presented in Section 4. Finally a conclusion and an outlook is given in
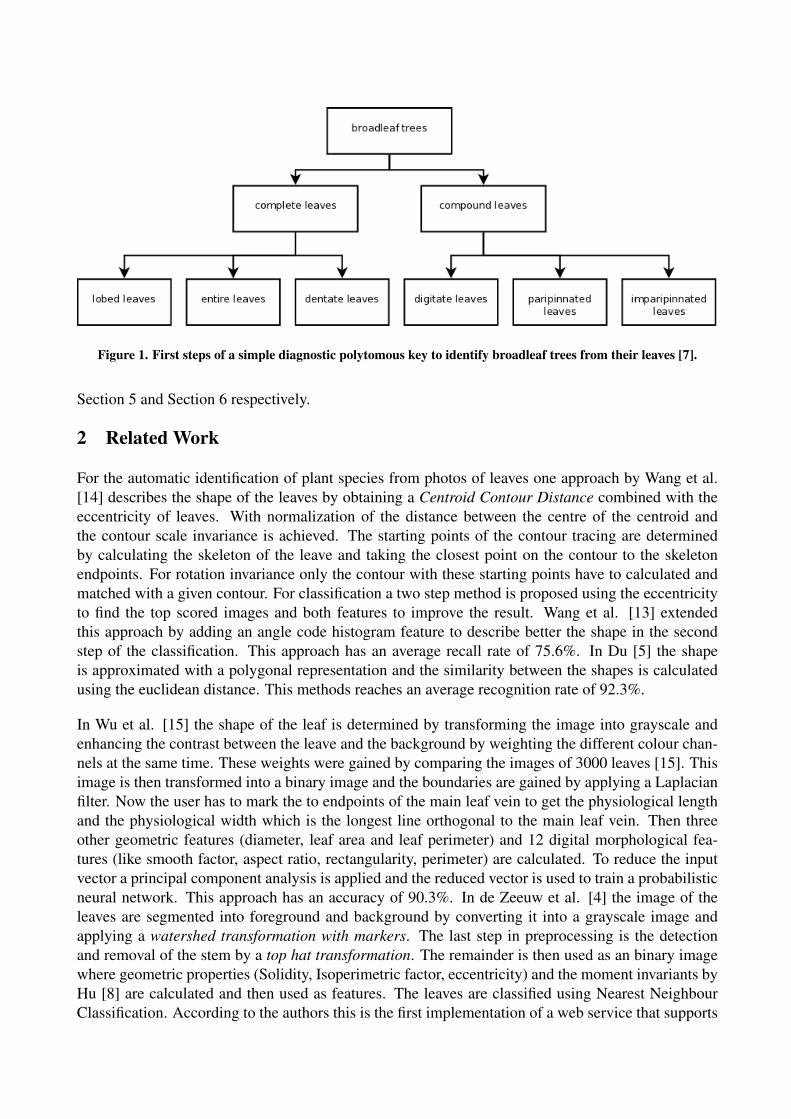
Figure 1. First steps of a simple diagnostic polytomous key to identify broadleaf trees from their leaves [7].
Section 5 and Section 6 respectively.
2 Related Work
For the automatic identification of plant species from photos of leaves one approach by Wang et al.[14] describes the shape of the leaves by obtaining a Centroid Contour Distance combined with theeccentricity of leaves. With normalization of the distance between the centre of the centroid andthe contour scale invariance is achieved. The starting points of the contour tracing are determinedby calculating the skeleton of the leave and taking the closest point on the contour to the skeletonendpoints. For rotation invariance only the contour with these starting points have to calculated andmatched with a given contour. For classification a two step method is proposed using the eccentricityto find the top scored images and both features to improve the result. Wang et al. [13] extendedthis approach by adding an angle code histogram feature to describe better the shape in the secondstep of the classification. This approach has an average recall rate of 75.6%. In Du [5] the shapeis approximated with a polygonal representation and the similarity between the shapes is calculatedusing the euclidean distance. This methods reaches an average recognition rate of 92.3%.
In Wu et al. [15] the shape of the leaf is determined by transforming the image into grayscale andenhancing the contrast between the leave and the background by weighting the different colour chan-nels at the same time. These weights were gained by comparing the images of 3000 leaves [15]. Thisimage is then transformed into a binary image and the boundaries are gained by applying a Laplacianfilter. Now the user has to mark the to endpoints of the main leaf vein to get the physiological lengthand the physiological width which is the longest line orthogonal to the main leaf vein. Then threeother geometric features (diameter, leaf area and leaf perimeter) and 12 digital morphological fea-tures (like smooth factor, aspect ratio, rectangularity, perimeter) are calculated. To reduce the inputvector a principal component analysis is applied and the reduced vector is used to train a probabilisticneural network. This approach has an accuracy of 90.3%. In de Zeeuw et al. [4] the image of theleaves are segmented into foreground and background by converting it into a grayscale image andapplying a watershed transformation with markers. The last step in preprocessing is the detectionand removal of the stem by a top hat transformation. The remainder is then used as an binary imagewhere geometric properties (Solidity, Isoperimetric factor, eccentricity) and the moment invariants byHu [8] are calculated and then used as features. The leaves are classified using Nearest NeighbourClassification. According to the authors this is the first implementation of a web service that supports

image-based queries and has a success rate of 53% if just the nearest neighbour is considered. If theten most similar images are presented and the user has to pick the best match the success rate raisesto 83%. In Zhang et al. [16] the approach to use only geometrical features is extended by applyinga Discrete Wavelet Transform on the images. This is done to take the venation of the leaves intoaccount. With this approach a identification rate of 95.8% is achieved. Lin and Peng [9] also usestwo leaf venation features besides 7 shape features. They extract the leaf veins and label them to 7vein types e.g. palm, straight parallel, and sideways parallel. The other feature is calculated using thefractal dimension. Using a Probabilistic Neural Network as classifier they achieved a recognition rateof 93.7%.
All of these approaches have in common that the image has to be segmented first. A wrong segmen-tation results in wrong features and can occur due to overlapping leaves, pinnated leaves, backgroundis in similar colour to the leave, and if multiple leaves are on the image. Damaged leaves may havean influence on the geometric features. Also the rotation of the leave can have an influence on thegeometric features, e.g. if bounding boxes are used, so the leaf has to be rotated into the right position.
Due to the fact that every approach was tested on a dataset of different tree species from all over theworld the results can not be compared.
3 Methodology
In this section the local features are presented. They are used to form a bag-of-keypoints vocabu-laryfrom Csurka et al. [3] on which a one-vs-all SVM classifier is applied.
As a preprocessing step the images of the leaves are transformed to a normalized grayscale image onwhich the local features are calculated. To generate the codebook for the bag-of-keypoints all featuresare clustered for each class (see Section 3.2). For each local feature of an image the nearest clustercentre is searched and a histogram is formed which is used to train a one-vs-all SVM. Figure 2 showsthe workflow when classifying an image. The x-axis of the histogram represents the cluster centrewhereas the y-axis is the amount of the nearest local features.
Figure 2. Workflow of the proposed methodology: a) Input image of a hornbeam b) Local Features (location andscale from 12 of 200 features are shown) c) Normalized histogram after searching the nearest cluster centre.
The advantage of this approach is that segmentation of leaves and calculation from the segmentedshape geometric features are avoided. When geometric features are used, wrong segmentation willlead to wrong features. Problems with segmentation can also occur, if the background is of similarcolour as the leaf, leaves are overlapping, pinnated leaves or if multiple leaves are on the image. Thisis relevant since this approach handles images which are taken on mobile devices from an enduserand the condition of the image taking can not be controlled.

3.1 Local Features
After the preprocessing step SIFT features, proposed by Lowe [10] and improved in [11], are calcu-lated. This method is searching for stable keypoints in the image and describes the surroundings ofthese points with a description vector. To search for keypoints difference-of-Gaussian functions withdifferent scales are used. Then the image is resampled by taking every second pixel in each row andcolumn and the process is repeated. To detect the local maxima and minima each sample point iscompared to its eight neighbours in the current image and to the nine neighbours in the scale above orbelow. To reject points that have low contrast the interpolated location of the maximum is searchedin the surroundings and if its lower than a certain threshold (see Lowe [11]) they are eliminated. Alsopoints which have high edge response but poorly determined locations have to be rejected.
After the keypoints are specified the magnitude and the orientation in the neighbourhood of eachkeypoint at its scale are calculated. An orientation histogram for each point is formed with the peaksbeing the dominant directions of local gradients. Once the histogram is filled the highest peak areassigned to the keypoint. If there are other peaks within certain percentage of the highest peak a newkeypoint is created at the same location and scale with the direction of this peak. Lowe proposed 80%as threshold value [11].
Now for every keypoint a keypoint descriptor is calculated. These descriptors are 16 orientationhistograms, computed from the 16×16 region near the keypoint at its specific scale, each representinga 4×4 subregion. Because each histogram has 8 bins the feature vector has a length of 128. The laststep is to normalize the vector to reduce the effects of the illumination change and to reduce non-linear illumination a threshold is applied and the vector is normalized again. A sample image withsome SIFT keypoints, their orientation and scale are shown in Figure 3. The diameter of the circlerepresents the scale and the line the direction of the keypoint.
Figure 3. An image of a mountain oak leaf with 6 SIFT keypoints with their orientation and scale.
The most important properties are that the SIFT features are invariant to image rotation and scale androbust across substantial range of affine distortions, addition of noise, and change in illumination.
3.2 Bag-of-keypoints
In this paper the bag-of-keypoints approach from Csurka et al. [3] is used because it is an effectiveclassification method for visual categorization which is computationally efficient. Bag-of-keypoints isbased on the bag-of-words representation for text categorization. The idea is to generate a vocabularyof cluster centres (“keypoints”), which are the analogy to “keywords”. The advantage of clustering isthat one feature vector does not have to be compared with all feature vectors from the training set but

only with these cluster centres. For clustering the k-means is used because of its simplicity.
For the training all feature vectors of one class are clustered to a certain amount of centres. Thenumber of centres is determined empircally (see Section 4). For each image in the training set thenearest centre for each feature vector is determined. The result is a histogram of the appearance ofthe centres in the image which is then passed to the SVM for training.
When testing an image the local feature keypoints are generated. For every local feature keypointsthe nearest cluster centre is searched and a histogram is formed which are then used for the SVM.
3.3 Classification
For the classification of the images a Support-Vector-Machine (SVM) implementation from [2] isused since it rather minimizes the overall risk than the overall error of a training set, which resultsin a good generalization performance even for high-dimensional features. The SVM classifier findsa hyperplane which separates two-classes with maximal margin. For multi-class classification the“one-against-all” approach is used. For each class one SVM is built which decides whether it is thatspecific class or not. This approach is used because the implementation can calculate the probabilityof the classification, and a threshold can be introduced to categorize for not belonging to any class.
As feature vector for the classification the histogram of the centres is taken. For training the SVMthe feature vectors of the training set are used. For classifying an image the histogram of the centresare calculated. If the probability of at least one class is higher than the threshold, the class with thehighest probability is assigned, otherwise no class is assigned to the image.
4 Experiments and preliminary results
In our experiments a database containing 134 images was used, which were scaled to either 800 pixelheight or 600 pixel width. This dataset includes leaf images of the five most common broadleaf treesin Austria. Additionally the background of the images is monochrome. The training set contains 8images per class whereas the test sets are of a size from 14 to 26. Since the database can not beextended during winter only preliminary results are presented. Experiments has shown that 30 clustercentres led to the best results with our dataset.
In the first experiment the methodology as described above was applied to the images. The imageswere put into the class with the highest percentage of the SVM classifier. The results of this experi-ments are presented in Table 1. The tree names in the top row are the estimated classes whereas thethe tree names in the first column are the true classes. The total classification rate is 93.6%. Thealgorithm performs poorest on the ash with a classification rate of 82%. The reason for this is thehigh intraclass difference of the leaves of the ash, see Figure 4. Sycamore maple and mountain oakachieve 100%, beech and hornbeam have a classification rate of 91 resp. 96%.
For the next experiments a new class “no category” is introduced. Also the test set has been extendedby 15 pictures from the “Caltech google-things” [1] dataset. This pictures were chosen because theycontain information that can possible be photographed and tried to classified by an enduser (e.g.bicycle, bookshelf, face, car, landscape).
For these experiments a threshold for the SVM classification is introduced. If the percentages of all

Tree name sycamore maple beech ash hornbeam mountain oaksycamore maple 15 0 0 0 0
beech 0 20 0 0 2ash 1 1 14 0 1
hornbeam 0 0 1 25 0mountain oak 0 0 0 0 14
Table 1. Confusion matrix of the first experiment. The tree names on the top are the estimated classes, the nameson the left side the true classes.
Figure 4. Three images of an ash to show the high intraclass difference.
SVMs are lower than this threshold the image is put in the “no category” class. Experiments showthat the best results can be achieved by using a threshold of 60%, experiments with a threshold of70% and 80% have also been done.
Table 2 is showing the results for this experiment. The classification rate is 85.3% and the rate for theleave classes is 88.3%. All wrong classified leaves of the first experiment have been put in the “nocategory” class but also correct classified images were put in this class. Equal to the first experimentall mountain oak leaves has been identified correctly. The classification rate for the sycamore mapleis the second best with 93% followed by the beech with 86%. The hornbeam leaves were properlyidentified with 85%. The classification rate for the ash equals the one of the first experiment with82% and is also the worst one in this experiment. From the new introduced images from the “Caltechgoogle-things” dataset two-thirds were put correctly to the “no category” class whereas five imageswere categorized as leaves.
When the threshold of the SVM classification is raised to 70% the overall classification rate is still at84.4% and for the leave classes it is 84%. Only two images of the ”Caltech google-things“ datasetwere classified as beech, the others were put correctly in the ”no category“ class. Two ash and twohornbeam images were also put there which lowers the rate of these to classes to 71 resp. 76%. Witha threshold of 80% all images of the ”Caltech google-things“ dataset were correctly identified as ”nocategory“ but the classification rate of the leave classes is 70%.
Tree name sycamore maple beech ash hornbeam mountain oak no categorysycamore maple 14 0 0 0 0 1
beech 0 19 0 0 0 3ash 0 0 14 0 0 3
hornbeam 0 0 0 22 0 4mountain oak 0 0 0 0 14 0
“google-things“ 0 4 0 0 1 10
Table 2. Confusion matrix of the second experiment. The tree names on the top are the estimated classes, thenames on the left side the true classes.
5 Conclusion
In this paper an approach for automatically identifying plant species from photos of the leaves ispresented. First the images are transformed into grayscale and normalized. Local Features are calcu-lated by applying the SIFT method. With difference-of-Gaussians, keypoints in different scales aresearched. Low contrast points are eliminated and the neighbourhood of the remaining points is de-scribed using orientation histograms of gradients. The bag-of-keypoint method is used by generatingthe vocabulary by clustering the SIFT features of the images from the training set. The feature vectorsof the image is a histogram of the nearest cluster centre for each local feature which is then passed toa multiclass “one-against-all” support vector machine.
6 Outlook
The next step in this project will be to extend the image dataset. With more images the training set willbe adjusted as well and the results of the experiments will be more significant. In order to recognizeimages without a leaf better it is possible that a preprocessing step will be introduced. The clusteringalgorithm in the bag-of-keypoints can also be replaced to achieve better cluster centres for building upthe vocabulary. Also an algorithm for classifying coniferous trees will be developed.
7 Acknowledgements
We would like to thank the “Osterreichische Bundesforste AG” (“Austrian Federal Forests”) for theirsupport and for providing the images.
References
[1] Caltech. ”google-things database”. 2004. http://www.robots.ox.ac.uk/ vgg/data/data-cats.html,accessed February 2010.
[2] Chih-Chung Chang and Chih-Jen Lin. LIBSVM: a library for support vector machines. 2001.Software available at http://www.csie.ntu.edu.tw/ cjlin/libsvm, accessed February 2010.
[3] Gabriella Csurka, Christopher R. Dance, Lixin Fan, Jutta Willamowski, and Cedric Bray. Visualcategorization with bags of keypoints. In Workshop on Statistical Learning in Computer Vision,ECCV, pages 1–22, 2004.

[4] Paul M. de Zeeuw, Elena Ranguelova, and Eric J. Pauwels. Towards an online image-basedtree taxonomy. In Petra Perner, editor, Industrial Conference on Data Mining, volume 4597 ofLecture Notes in Computer Science, pages 296–306. Springer, 2007.
[5] Ji-Xiang Du. Computer-aided plant species identification (capsi) based on leaf shape matchingtechnique. Transactions of the Institute of Measurement and Control, 28 No. 3:275–285, 2006.
[6] Ji-Xiang Du, Xiaofeng Wang, and Xiao Gu. Shape matching and recognition base on genetic al-gorithm and application to plant species identification. In De-Shuang Huang, Xiao-Ping Zhang,and Guang-Bin Huang, editors, ICIC (1), volume 3644 of Lecture Notes in Computer Science,pages 282–290. Springer, 2005.
[7] Jean-Denis Godet. Baume und Straucher bestimmen und nachschlagen. Eugen Ulmer KG,2007.
[8] Ming-Kuei Hu. Visual pattern recognition by moment invariants. IRE Transactions on Informa-tion Theory, 8(2):179–187, February 1962.
[9] Huang Lin and He Peng. Machine recognition for broad-leaved trees based on synthetic featuresof leaves using probabilistic neural network. Computer Science and Software Engineering,International Conference on, 4:871–877, 2008.
[10] D. G. Lowe. Object recognition from local scale-invariant features. In Proc. Seventh IEEEInternational Conference on Computer Vision The, volume 2, pages 1150–1157, September 20–27, 1999.
[11] David G. Lowe. Distinctive image features from scale-invariant keypoints. International Journalof Computer Vision, 60(2):91–110, 2004.
[12] Steve Nix. Tree identification using a tree leaf key. 2010.http://forestry.about.com/od/treeidentification/tp/tree key id start.htm, accessed February2010.
[13] Z. Wang, Z. Chi, and D. Feng. Shape based leaf image retrieval. IEE Proceedings -Vision, Imageand Signal Processing, 150(1):34–43, 2003.
[14] Zhiyong Wang, Zheru Chi, Dagan Feng, and Qing Wang. Leaf image retrieval with shapefeatures. VISUAL ’00: Proceedings of the 4th International Conference on Advances in VisualInformation Systems, pages 477–487, 2000.
[15] S.G. Wu, F.S. Bao, E.Y. Xu, Yu-Xuan Wang, Yi-Fan Chang, and Qiao-Liang Xiang. A leafrecognition algorithm for plant classification using probabilistic neural network. In Proc. IEEEInternational Symposium on Signal Processing and Information Technology, pages 11–16, 2007.
[16] Lei Zhang, Jun Kong, Xiaoyun Zeng, and Jiayue Ren. Plant species identification based onneural network. In Proc. Fourth International Conference on Natural Computation ICNC ’08,volume 5, pages 90–94, 2008.