lean food-and-beverage manufacturing · 2020-07-22 · lean manufacturing is regarded as more of an...
TRANSCRIPT
Lean Food-and-Beverage Manufacturing
Lower Costs, Better Products, Improved Sustainability
Focus

The Boston Consulting Group (BCG) is a global manage-ment consulting firm and the world’s leading advisor on business strategy. We partner with clients in all sectors and regions to identify their highest-value opportunities, address their most critical challenges, and transform their businesses. Our customized approach combines deep in-sight into the dynamics of companies and markets with close collaboration at all levels of the client organization. This ensures that our clients achieve sustainable compet-itive advantage, build more capable organizations, and secure lasting results. Founded in 1963, BCG is a private company with 69 offices in 40 countries. For more infor-mation, please visit www.bcg.com.

Lean Food-and-Beverage Manufacturing 1
Lean Food-and-Beverage Manufacturing
Lower Costs, Better Products, Improved Sustainability
Food and beverage manu-facturers have been accel-erating their cost-cutting efforts to improve their profit-and-loss statements
(P&Ls). The hunt for savings, spurred by structural changes in the industry such as the rise of private labels and discounters, became more urgent af-ter the recession hit in 2008.
The economy is now recovering, and growth has become the new impera-tive. This requires new investments in R&D, product quality, advertising, sales, and pricing. Manufacturers are looking for ways beyond traditional cost cutting to create space in their P&Ls for investment. Although most manufacturers have continuous-im-provement lean-advantage programs, lean manufacturing remains an un-derused approach. With limited capi-tal expenditure, lean manufacturing used to its fullest can liberate large amounts of cash, fueling growth and improving quality with better, fresh-er, greener, and more delicious food-and-beverage products. It can also be a source of employee engagement and capability-building opportu- nities.
Some industry executives, however, have been skeptical. Recently, the chief operating officer of a major
supplier that had already done plen-ty of cost cutting greeted a team of lean-manufacturing consultants from The Boston Consulting Group with a shrug, asking, “What can we learn from these guys? We have been doing this for ten years.”
Many lean programs tend to be lim-ited exercises that produce one-off savings, leave most opportunities un-tapped, require larger capital invest-ment, and do little to build employ-ees’ engagement and capabilities. Lean manufacturing is regarded as more of an administrative function and lacks a real leadership or strate-gic role in the organization.
With the right approach, however, over a few intense months, workers at all levels can learn new ways to frame questions, find solutions, and improve continuously. These employ-ees become ambassadors and cham-pions for lean approaches, spreading knowledge and best practices from one plant to another. They also learn to focus their efforts, linking initia-tives directly to monetary savings. Workers who have had this training do not see themselves as cogs in a machine that “delivers productivity increases.” They are members of a team that creates competitive ad- vantage.
This approach is producing signifi-cant savings even in plants where managers thought there wasn’t much waste left. “I have to admit,” the skeptical COO said later, “that my at-titude changed dramatically over time to ‘we really can learn some-thing.’’’
The opportunity is large. Manufac-turers that use lean methodologies effectively can cut their cost of goods sold by as much as 3 percent. That corresponds to 20 percent of their addressable manufacturing cost base. Over the next two years, the top 100 food-manufacturing compa-nies worldwide could save a total of $9.4 billion, and the top 70 beverage suppliers could save $4.2 billion—more than $13 billion of capacity waiting to be turned loose.
Discounters are gaining market share, and commodity prices are like-ly to rise. Suppliers, therefore, are feeling pressure to search for and cut non-value-adding costs. These are ex-penses that don’t make the product more valuable or attractive to cus-tomers. In a word, waste.
The recession is changing consumer ◊ behavior. Shoppers have cut back on nonessential purchases. They shop for the best prices and wait

2 The Boston Consulting Group
for promotions. Discounters and private labels are grabbing market share and forcing suppliers to cut prices. In the United States, from 2007 through 2009, the market share of discount grocery stores grew from 33.2 percent to 35.2 percent. In Germany, during the same period, discounters in-creased share from 42.5 percent to 44.0 percent. (See Exhibit 1.)
Suppliers face rising prices for mate-◊ rials. According to the Organisa-tion for Economic Co-operation and Development, commodity prices could continue to increase at a rate of 5 percent per year.
Pricing for inflation is becoming ◊ difficult. There is a growing risk that intense competition and tougher retailer negotiations will not allow suppliers to pass com-
modity price increases on to con-sumers.
The need for stronger growth is ◊ again becoming critical. Many com-panies have refocused their incen-tives on stronger growth targets and are searching for new ways to finance the higher cost of prod-ucts, advertising, sales, and pricing actions.
Green production strategies are be-◊ coming sources of competitive ad-vantage. Governments, customers, and employees are increasingly pushing companies to reduce ma-terial, water, and energy waste.
The Maturity Stages of Lean Manufacturing
Manufacturers, of course, have not been asleep while all this has been
going on. They have optimized proc- esses, reduced head count, played with cheaper recipes, and hired con-sultants. What few did, however, was attempt to identify all non-value-add-ing manufacturing costs in a holis- tic way.
Many lean programs generate effi-ciencies but miss the largest poten-tial savings levers. Some focus only on the shop floor. Others lack the ability to maintain momentum (and keep the attention of top manage-ment) by tracking improvements pre-cisely and linking them to financial results and corporate strategy. Some require large capital expenditures. Others focus only on big-ticket items that represent only 30 to 40 percent of savings. Many do not strive to make continuous improvement a real mindset among all employees in manufacturing.
United States
Germany
2009
35.2
44.0
2008
34.0
43.0
2007
33.2
42.5
50
100
150
200
Year ’00 ’01 ’02 ’03 ’04 ’05 ’06 ’07 ’08 ’09 ’10
Discounters’ market share (%)
Food-and-beverage commodity price index1 (2005 = U.S.$100)
Discounters are gaining market share, and commodity prices are likely to rise
Exhibit 1. Manufacturers Are Under Pressure
Sources: GfK ConsumerScan, May 2009; Planet Retail; company financial statements; IMF Food Commodity Price Index; OECD-FAO Agricultural Outlook 2009–2018; BCG analysis.1Weighted-price index for wheat, maize, rice, vegetable oils, butter, cheese, whole-milk powder, and raw sugar.

Lean Food-and-Beverage Manufacturing 3
We have identified four main stages of lean manufacturing at food and beverage companies. (See Exhibit 2.) They span a continuum from compa-nies that have added a few lean tech-niques to their operations to those that have completely integrated “lean” into their culture and use it as a real source of competitive advan-tage. Most manufacturers reap the
benefits that come with reaching Stage 1, Stage 2, or Stage 3. Only a few, however, keep going and reach Stage 4.
Stage 1: Force for Modest Change. The majority of food and beverage manufacturers are in this stage. Man-ufacturing delivers the requested products and productivity. There is
an established lean function, but its effectiveness is narrowly limited. Companies in this stage do not have a clear picture of their non-value-adding manufacturing costs. Al-though they may have a strong re-cent track record of productivity gains, they lack straightforward measures for reducing non-value-adding manufacturing costs and tend
Force formodest change
One-off business driver
Sustained-improvement
contributor
Source ofcompetitiveadvantage
Danger of missing the goal
Danger of resting on past success
Danger of falling back
❶ ❷ ❸ ❹
Value added by a rigorous lean transformation Point of transformation
Exhibit 2. There Are Four Stages of Maturity in Lean Manufacturing
Sources: Press searches; company Web sites; BCG’s lean advantage topic area; BCG analysis.1OEE = overall equipment effectiveness.2SMED = single-minute exchange of die.
Regular ◊ productivity savingsOEE 10 to 20 ◊ percentage points below world-class1 No transparency of ◊ non-value-adding costsFew central ◊ continuous-improvement managersBest practices ◊ documented but not broadly implemented
Quantum leap ◊ in productivity, mostly funded by capital expenditures; OEE below world-class Limited ◊ transparency of non-value-adding costsStrong cross-◊ functional teams but limited leadershipSome flow of new ◊ best practices
Manufacturing as a ◊ major source of free cash; non-value-adding costs reduced by more than 50 percent; limited use of capital expendituresOEE at or above world-◊ class level; bottlenecks cleared to avoid capital expenditures for new linesStrong, cross-functional ◊ teams with clear leadership; most line managers trained Continuous flow of ◊ best practices; broad implementation
Repeted quantum leaps; ◊ fresher, tastier products; younger stock on retail shelvesNon-value-adding costs almost ◊ completely eliminated; OEE above world-class levelMost lines on SMED; highest ◊ production flexibility; 5S sustained in all plants and lines2
Continuous flow and ◊ widespread implementation of best practices; obsession with solving root cause problems, asking, how can we become better?

4 The Boston Consulting Group
to rely on capital expenditures to hit productivity targets. While many have designated continuous-improve-ment managers, those managers have to fight to put their ideas into practice. They are seen more as ad-ministrators than as forceful continu-ous-improvement leaders.
The 5S workplace-organization ap-proach is implemented only in isolat-ed areas. Bottleneck analyses are done occasionally. Manpower levels on some lines have been analyzed closely, but many lines have not been scrutinized. Overall equipment effectiveness (OEE) averages are 10 to 20 percentage points below world-class levels.
Stage 2: One-off Business Driver. We found few companies at this lev-el. These companies already have a long-established lean practice that has been able to show strong one-off business improvement. They have a database of best lean practices, but, somehow, results do not really stick. The results lack sustainability. Man-agement continues to request strong productivity improvement in manu-facturing, but the role of lean has be-come more limited over time. Most productivity increases originate out-side the lean organization. Many re-quire large capital-expenditure initia-tives.
These companies have a good track record of lean workshops with im-provement team members of differ-ent backgrounds. They have dis-played key performance indicators (KPIs) and best practices on the shop floor. In a few pilot plants, they have achieved great benefits, but the ener-gy behind the lean initiative is gone. There is no ongoing flow of best practices. After a short period, these
companies risk falling back to Stage 1: they are not able to sustain ener-gizing momentum. They have meth-ods in place for identifying non-val-ue-adding manufacturing costs but not in each plant or across all lines. They do not set clear targets by plant
and by line for non-value-adding costs. They may lack the tools or the culture. In some situations, they sim-ply lack manpower and the neces-sary engagement of senior manage-ment. Some lines still have OEE well below optimal levels.
Stage 3: Sustained-Improvement Contributor. Few companies are in Stage 3. These companies work con-sciously to transform their entire cul-ture into one of continuous, sus-tained improvement. They have big specific targets for each plant and line to reduce non-value-adding costs with limited capital expenditures. Manufacturing is a major source of free cash, improving net working capital with flexible production lines that support frequent changeovers and reduce inventory. Products made by these manufacturers are younger on the retail shelf than those of com-petitors. Enabled local lean champi-ons are key to spreading lean culture throughout the organization.
Decentralized continuous-improve-ment managers can focus on long-term continuous improvement. Many plants consistently apply 5S, OEE is at world-class levels, and lines
are nearly fully utilized. There is a continuous flow of new best practic-es and internal competition to elimi-nate non-value-adding costs. These companies are clearly above average standards, but they need to be care-ful not to become complacent.
Stage 4: Source of Competitive Ad-vantage. Stage 4 requires embracing Stage 3 characteristics and going one step further to set up supply-chain and lean initiatives as true sources of competitive advantage. Companies at this stage build a culture of contin-uous improvement. They have a complete view of non-value-adding costs, having reduced them by 50 to 80 percent. They have gained organi-zational agility. They continuously and systematically ask, how can we become better? They focus on deliv-ering the freshest products at the lowest cost and with the highest flex-ibility. Most plants and OEE lines meet global best-in-class standards.
Manufacturing is a key contributor to funding growth. Because change-overs are short (less than ten min-utes), lines produce small batches of fresh products and generate limited inventory. With short changeovers, complexity becomes less of an issue. Cross-functional teams work closely together on a daily basis and regular-ly deliver improvements in perfor-mance. They show their results di-rectly to the CEO. Only a few companies reach this level, and even those companies need to be careful always to walk the extra mile.
The answers to a few focused ques-tions can reveal which level a com-pany has achieved—and how much more it could do. (See the side- bar “Lean-Manufacturing Self- Assessment.”)
Companies at
Stage 4 build
a culture
of continuous
improvement.

Lean Food-and-Beverage Manufacturing 5
How would you describe the role and perception of 1. manufacturing in your organization?
It delivers the products requested by central plan-a. ning, and regular productivity savings are defined from the top down.
We have seen a quantum leap in productivity. b. However, the change was driven mainly by capital expenditures.
We are actively using alternative production meth-c. ods: manufacturing is continuously a strong source of increased profits and frees up cash.
It is one of our core sources of competitive advan-d. tage: we are able to produce fresher, tastier prod-ucts than our competitors, and our conversion costs are much lower.
How do you control your non-value-adding costs?2.
We don’t see all of our non-value-adding manufac-a. turing costs.
We see only some of our non-value-adding manu-b. facturing costs.
We frequently analyze our non-value-adding man-c. ufacturing costs. We know the potential of each of our factories.
We have a sophisticated system in place to identi-d. fy and control non-value-adding manufacturing costs. We know the costs of each SKU and line.
On what part of production are your continuous-im-3. provement initiatives focused?
We try to solve a problem when we find it.a.
We try to focus on our major non-value-adding b. costs.
On the basis of our analyses of non-value-adding c. manufacturing costs, we know where to focus our efforts.
We have a systematic process in place for identify-d. ing non-value-adding manufacturing costs, analyz-
ing their root causes, and implementing solutions. On the basis of the size of a non-value-adding manufacturing cost and the cost of fixing the root cause, we focus first on the non-value-adding man-ufacturing cost with the highest payback.
To what extent are productivity initiatives linked to 4. financial savings?
If we need to make a major capital expenditure, a. we prepare a business case.
The financial benefit of each initiative is always b. calculated before implementation.
Before we get too deep into fixing a root cause, we c. work to understand its financial-savings potential. Only if the savings potential is big enough, do we continue to focus on fixing a root cause.
We select initiatives for implementation from our d. pipeline of initiatives whose productivity and costs we’ve calculated; we can track the P&L impact.
What are your ambitions for batch sizes and change-5. over duration?
We try to maximize batches in order to avoid a. changeovers. Over the past three years, we’ve im-proved changeover duration by 30 percent.
Depending on the line, we maximize batches in b. order to avoid changeovers. In pilot programs, we have deployed leveled production to make it easi-er to plan changeovers. In the past year, we have improved changeover duration by 50 percent.
Using leveled production, we have reduced c. changeover duration by more than 80 percent. Many changeovers take less than ten minutes. Changeover is no longer a key factor when we de-cide on batch size.
Most of our changeovers take less than ten min-d. utes, so we can act with the highest flexibility.
To what extent is 5S implemented in manufacturing?6.
5S is implemented only in isolated areas; initia-a. tives are driven by the central organization.
Lean-Manufacturing Self-Assessment
6 The Boston Consulting Group
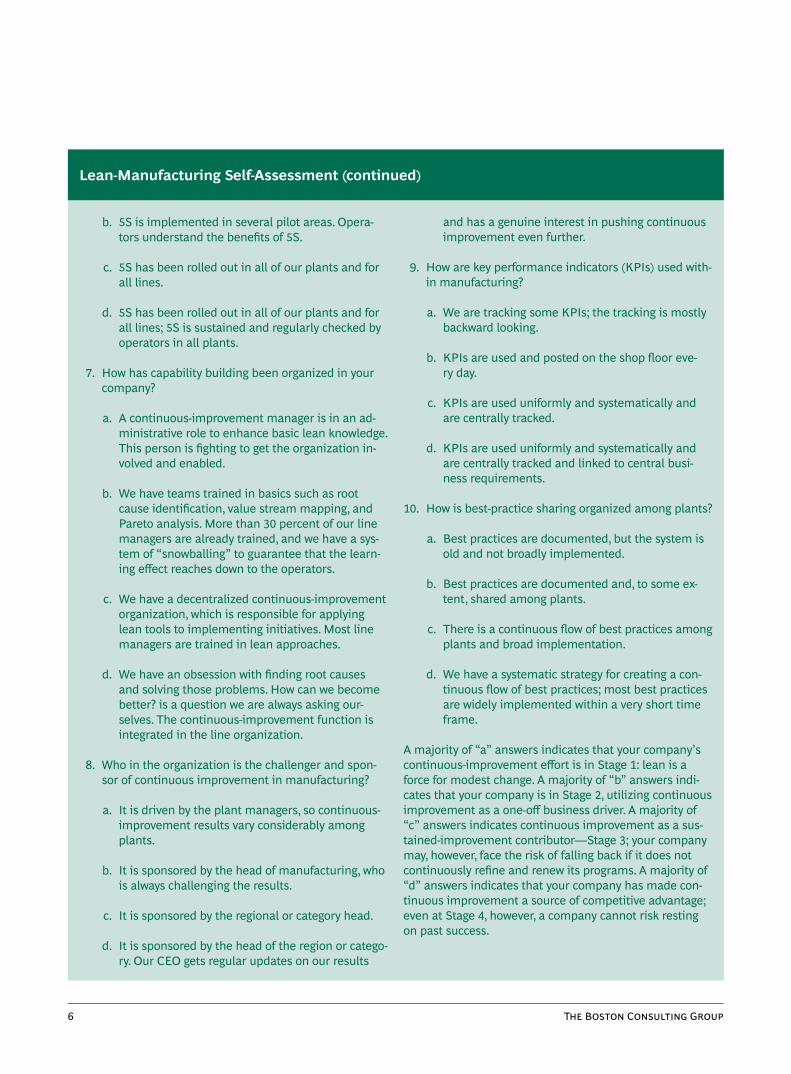
5S is implemented in several pilot areas. Opera-b. tors understand the benefits of 5S.
5S has been rolled out in all of our plants and for c. all lines.
5S has been rolled out in all of our plants and for d. all lines; 5S is sustained and regularly checked by operators in all plants.
How has capability building been organized in your 7. company?
A continuous-improvement manager is in an ad-a. ministrative role to enhance basic lean knowledge. This person is fighting to get the organization in-volved and enabled.
We have teams trained in basics such as root b. cause identification, value stream mapping, and Pareto analysis. More than 30 percent of our line managers are already trained, and we have a sys-tem of “snowballing” to guarantee that the learn-ing effect reaches down to the operators.
We have a decentralized continuous-improvement c. organization, which is responsible for applying lean tools to implementing initiatives. Most line managers are trained in lean approaches.
We have an obsession with finding root causes d. and solving those problems. How can we become better? is a question we are always asking our-selves. The continuous-improvement function is integrated in the line organization.
Who in the organization is the challenger and spon-8. sor of continuous improvement in manufacturing?
It is driven by the plant managers, so continuous-a. improvement results vary considerably among plants.
It is sponsored by the head of manufacturing, who b. is always challenging the results.
It is sponsored by the regional or category head.c.
It is sponsored by the head of the region or catego-d. ry. Our CEO gets regular updates on our results
and has a genuine interest in pushing continuous improvement even further.
How are key performance indicators (KPIs) used with-9. in manufacturing?
We are tracking some KPIs; the tracking is mostly a. backward looking.
KPIs are used and posted on the shop floor eve- b. ry day.
KPIs are used uniformly and systematically and c. are centrally tracked.
KPIs are used uniformly and systematically and d. are centrally tracked and linked to central busi-ness requirements.
How is best-practice sharing organized among plants?10.
Best practices are documented, but the system is a. old and not broadly implemented.
Best practices are documented and, to some ex-b. tent, shared among plants.
There is a continuous flow of best practices among c. plants and broad implementation.
We have a systematic strategy for creating a con-d. tinuous flow of best practices; most best practices are widely implemented within a very short time frame.
A majority of “a” answers indicates that your company’s continuous-improvement effort is in Stage 1: lean is a force for modest change. A majority of “b” answers indi-cates that your company is in Stage 2, utilizing continuous improvement as a one-off business driver. A majority of “c” answers indicates continuous improvement as a sus-tained-improvement contributor—Stage 3; your company may, however, face the risk of falling back if it does not continuously refine and renew its programs. A majority of “d” answers indicates that your company has made con-tinuous improvement a source of competitive advantage; even at Stage 4, however, a company cannot risk resting on past success.
Lean-Manufacturing Self-Assessment (continued)

Lean Food-and-Beverage Manufacturing 7
BCG believes that about 80 percent of companies have achieved Stage 1 or Stage 2. Some leading-edge com-panies—mostly market leaders in their categories or small specialized players—have reached Stage 3. It is important to note that the stages do not represent an assessment of the manufacturing people involved but rather an articulation of the com- pany’s ambition to achieve lean-manufacturing results. Within each stage, some companies perform bet-ter or worse relative to this expec- tation.
Big Ambitions and Specific Goals
There is no one-size-fits-all approach to rolling out an effective lean pro-gram. Every company has its own culture. There are, however, three things that transformative lean ef-forts have in common.
They generate significant ◊ measur-able impact (on, for example, costs, inventory, and customer satisfac-tion) with limited capital expendi-tures
They create real momentum for ◊ change within the organization, with improvement efforts linked directly to corporate strategy
They enable the organization to ◊ improve continuously
The structure of the food and bever-age industry presents special chal-lenges to achieving those goals. Most manufacturers have a large number of plants, so a culture-changing lean program must be rolled out simulta-neously in many places. The high complexity of many food-and-bever-age plants—multiple lines, multiple
SKUs—requires thorough prepara-tion and a clear focus on key savings targets.
The goals of lean manufacturing are cultural and financial. Its immediate targets are seven sources of waste.
Overprocessing.◊ Manufacturing products whose quality is higher than customers want or will pay for.
Overproduction.◊ Making products that end up in inventories or as scrap. In food and beverage man-ufacturing this often takes the form of overfilling or “overweight-ing.” Generally, food and beverage products are sold by weight or vol-ume. Some products, however, ex-ceed their required minimums by as much as 20 percent.
Transportation.◊ Creating unneces-sary movement of materials, tools, and spare parts within a plant.
Motion.◊ Requiring unnecessary movement of the product and people during production.
Inventory.◊ Ending up with excess inventories that increase ware-house and other costs. For perish-able food and beverages, lower in-ventories not only save money and reduce workload, they also lead to fresher products. Fresher products can improve customers’ perception of quality.
Defects.◊ Scrapping or reworking products, which generates addi-tional labor, material, and packag-ing costs. In the food industry, many failures and defects can be reworked. This is good because re-working reduces the loss of raw materials, but it’s also bad be-cause it can make eliminating root causes seem less than urgent.
Waiting.◊ Allowing time-wasting technical failures, improperly bal-anced lines, and poorly managed operators.
Enabling: Training the Trainers
Enabling is at the core of an effective lean approach. External experts don’t change companies. Workers do. Employees are trained in lean as they begin finding waste. As they learn, they become ambas- sadors for the concept throughout the company. Over the course of three or four lean workshops, em-ployees develop lean skills and learn to lead the program and train other employees.
Most food-and-beverage manufactur-ers are large operations, spread out over wide areas, with—compared with other industries—small plants in terms of value creation and num-ber of employees. Such companies change much faster when initiative comes from empowered local em-ployees instead of a centralized bu-reaucracy.
A BCG lean initiative starts with a series of three- to five-week kick-start workshops for about 20 participants each. At first, the BCG team works closely with management to help push change, helping the client con-
Enabling is
at the core
of an
effective
lean approach.

8 The Boston Consulting Group
duct training and shop-floor observa-tion sessions, as well as moderating analysis discussions. If a line change-over has already been cut from 120 minutes to 40 minutes, for instance, the team might ask, what could get the time down to 8 minutes?
Over the course of six to eight kick-start workshops, BCG’s role shifts to one of support. Employees who are designated “lean-program experts” take over leadership, supported by six to eight “shared lean champions,” employees who have previously par-ticipated in at least two transforma-tion kick-start workshops, the first at a location other than their home plant. (See Exhibit 3.)
Each participant takes on more re-sponsibility with each additional workshop. Employees who were team members in their first work-shops should take a leading role in some topics in their second. By their
third or fourth, they should be able to train others in lean methodology and drive the transformation.
The kick-start workshops themselves have several core elements. They in-clude basic training, learning by do-ing and owning responsibility, coach-ing and feedback, and support materials.
Basic Training.◊ Each future lean-program expert needs a thorough understanding of lean methodolo-gies and tools. During the transfor-mation kick-start workshops (and special lean-program expert-train-ing sessions in consolidation weeks between kick-start work-shops), future lean experts are trained in lean theory. All partici-pants have training sessions fo-cused on the main lean levers. These are interactive sessions, comparable to the case study re-views conducted by graduate stu-
dents of business administration. The daily sessions are followed each day by practical observation sessions on the shop floor.
Learning by Doing and Owning Re-◊ sponsibility. To speed the spread of lean methods throughout the or-ganization, employees “learn by doing.” They hunt for waste. A kick-start workshop is not just training. Each has a clear savings target, and it is the responsibility of each kick-start team to reach its target. Throughout, the team is doing real work, making hundreds of measurements, gathering data, and analyzing processes to get to the real root causes of waste.
Coaching and Feedback.◊ Over time, BCG’s role shifts from leader to coach. In daily sessions, progress is evaluated and plans for coming days are discussed. Each kick-start week ends with a feedback ses-
Project ownership
Time
Drive change
Preparation anddata collection
Joint design
Implementer
Coach or trainer
Coach or trainer
Support
Owner
Change agent
Client team
Client team
Client team
Client team
Client team
Exhibit 3. A Handoff Approach Builds Internal Capabilities and Shifts Responsibility to the Client Team
Source: BCG analysis.

Lean Food-and-Beverage Manufacturing 9
sion in which all participants fo-cus on two questions: What went well? What could have been bet-ter? One-on-one sessions are held as needed to identify areas for im-provement.
Support Materials.◊ With team members, BCG develops custom-ized comprehensive handbooks for all participants. These explain the overall process and give de-tailed guides for each lean lever.
Lean champions train to become trainers themselves as they imple-ment lean tools. By the end of three or four kick-start workshops, a critical mass of employees has been trained.
Lean Levers: Key Savings Areas
Lean-program experts and champi-ons master the details of several in-terrelated levers critical to savings in
the food and beverage industry. These levers include optimizing manpower levels on lines, reducing bottlenecks, and optimizing fixed costs. They are also immersed in finding savings by, for example, rais-ing OEE, improving material yield, and reducing inventory. (See Exhibit 4.) Furthermore, these levers focus on reducing the company’s carbon footprint.
Raising Overall Equipment Effec-tiveness. A systematic lean ap-proach can generate OEE improve-ment of 5 to 15 percentage points. OEE is a measure of the total output of a manufacturing unit (a machine or line) based on its theoretical speed. Improving OEE results in higher output per unit of time. This helps reduce labor and energy costs, decreases inventories, and increases capacity. (See the sidebar “A Lean Win: Big Efficiencies, Small Capital Expenditures.”)
In food manufacturing, there is an important difference between proc- essing and packaging units. The OEE of processing units is generally su- perior to that of packaging units. BCG’s OEE benchmarks for process-ing units puts the world-class level at 95 percent; for packaging units, the comparable level starts at 85 percent.
For beverage lines, which are often highly integrated, a score over 80 percent is world-class. BCG estimates that less than 10 percent of all food-and-beverage units reach optimal levels. (See Exhibit 5.)
The industry has distinct obstacles to maximizing OEE. Given the high seasonality of demand, many pro-duction lines face capacity con-straints only a couple of weeks or months per year. The rest of the time, OEE-related losses can be made up simply by extending pro-
0% 50% 100%
Typical improvement
Improving material yield
Optimizing manpower levels on lines
Reducing bottlenecks
Raising OEE1
Optimizing fixed costs
Reducing inventory
Lever
from 15 percent to 40 percent
from 10 percent to 30 percent
from 10 percent to 30 percent
from 20 percent to 40 percent
from 15 percent to 25 percent
from 20 percent to 30 percent
Percentage of addressed costs per lever
Exhibit 4. Six Important Levers Within the BCG Framework Address the Cost Base and Increase Savings
Source: BCG analysis.1OEE = overall equipment effectiveness.

10 The Boston Consulting Group
In 2009, a major international food-and-beverage manufacturer retained BCG to introduce lean manufactur-ing into some of its European plants. The company’s management doubt-ed that there was much waste left in its lines but had hypothesized that improving overall equipment effec-tiveness (OEE) might be one power-ful lever.
A production line on which jars of a powdered breakfast drink were filled and then packaged had been run-ning for two years, during which time the operators had made large capac-ity improvements. After gathering performance data, observing the line, and talking with operators and
maintenance-and-repair technicians, a lean-manufacturing kick-start team determined that the filler unit ran at a significantly lower capacity than the rest of the units on the line, cre-ating a bottleneck.
A special team, comprising one lean expert and two local champions, conducted a deep root-cause analy-sis of the filler. The team noticed that the screw conveyor used to feed the product into a hopper had only two modes—on and off. The prob-lem was that when the screw convey-or was on, it fed the product too fast. That led to overfilling that stopped the line about once every 25 sec-onds. A bottleneck was the result of
low overall asset utilization that had not been challenged before.
Adding an inexpensive frequency converter to the screw conveyor made its speed adjustable. At lower speeds, the screw conveyor no long- er overfilled the hopper, and the fre-quent stoppages were eliminated. An investment of less than $1,000 increased the speed of the line by 17 percent, generating payback in less than a week. In the end, the original OEE loss analysis turned into a clas-sic bottleneck analysis.
A Lean Win: Big Efficiencies, Small Capital Expenditures
74%
58%44%
83%
67%59%
90%79% 74%
95%85% 80%
90th percentile
Beverages2
Food packaging
25th percentile
Food processing
50th percentile 75th percentile
Benchmarktarget
≥95% ≥85% ≥80%
OEE1
Exhibit 5. The Beverage Sector Has the Lowest Overall Equipment Effectiveness
Source: BCG analysis. 1OEE = overall equipment effectiveness.2Includes the returnable-bottle business.

Lean Food-and-Beverage Manufacturing 11
duction hours. Similarly, the ability of food and beverage suppliers to re-work some defective goods without material loss can also help disguise low OEE levels.
The industry also faces strict quality and legal requirements related to sanitation and cleaning. Certain in-ternal quality requirements are linked to frequency and length of cleaning rather than to the required level of sanitation. Many such re-quirements can be challenged with-out compromising safety or quality.
For example, cleaning in place (CIP)—a standard method of clean-ing pipes, tanks, and filling equip-ment—involves rinsing detergents through parts of the line. This proc- ess has several cycles and is highly automated. CIP can be accelerated by using sensors to measure, for ex-ample, the amount of dirt or the con-centration of detergent in the clean-ing liquid. This can eliminate unnecessary cycles, shortening sani-tation time and saving on chemicals and water.
Another obstacle to achieving maxi-mum OEE levels is complexity. It is not unusual for a single line to pro-duce more than 30 different SKUs with a changeover—and often clean-ing—required before each switch. A high number of changeovers tend to reduce OEE, particularly because so little food-and-beverage machinery is designed for easy changeover.
Finding out what drives losses is key to addressing low OEE levels. Pareto analysis is based on the idea that a great many failures are generated by a proportionately small number of causes. Some of these causes can be identified by devices that measure
microstoppages too brief for opera-tors to notice. Root causes can often be identified in workshops and brainstorming sessions in which line operators, team leaders, and mainte-nance and repair technicians visual-ize losses per manufacturing unit.
Another well-known tool to improve OEE is the single-minute exchange of die (SMED) approach, which Toyota originated to reduce changeover times. While SMED is well known in the industry, it is rarely applied sys-tematically and comprehensively.
Many machines in the food and bev-erage industry are not designed for easy changeover; SMED techniques can simplify complex changeover processes. BCG’s experience shows that even on lines with previous sig-nificant changeover-time reductions, a systematic SMED approach can cut changeover times by as much as 50 percent.
Improving Material Yield. A sys-tematic lean approach can cut mate-rial losses by 20 to 40 percent. In food and beverage manufacturing, raw and packaging materials repre-sent a large part of the cost of goods sold, from about 50 percent in plants producing “simple” products such as mineral water to 80 to 90 percent in plants that require costly raw materi-als, such as coffee and chocolate.
There are three main drivers of raw- and packaging-material costs: stan-
dard consumption, scrap, and over-filling or overweighting. Scrap and overfilling or overweighting are often responsible for 2 to 5 percent of total material costs. Food and beverage products are sold by weight or by volume units, with strict legal-mini-mum requirements.
The challenge producers face is to meet those requirements without ex-ceeding them. While scrap can usual-ly be detected visually, overweight-ing and overfilling are often trickier to detect. Some products weigh as much as 20 percent more than the required minimum.
Overweighting and overfilling are the result of variability in filling and packaging processes. A powerful lean tool to reduce variability is statistical process control, which monitors vari-ation in order to distinguish between common and special causes. Com-mon causes are sources of “natural” or random variation. Special causes are irregular and unstable sources and can lead to processes running out of control.
Scrap can be reduced at two points: where it is first generated and where rework is scrapped. For the first, it is important to understand which SKUs generate scrap. A Pareto analysis of each SKU’s annual value of scrap shows that most of the scrap is pro-duced by only a few SKUs. Once those are identified, a focused root-cause analysis can be done. A useful tool here is an hourly scrap-tracking system. This can help operators visu-alize technical defects.
Although it is often possible to re-work finished or semifinished goods that don’t meet quality require-ments, the limited shelf life of food
A systematic
lean approach
can cut
material losses
by 20 to 40 percent.

12 The Boston Consulting Group
products, as well as recipe restric-tions on the maximum permissible volume of rework, can force manu-facturers to turn rework into scrap. For some products, as much as 50 percent of rework is scrapped.
For rework that ends up as scrap, the pattern is often the same: a few SKUs generate the majority of the rework. In food and beverage manu-facturing, there are two main reasons why rework is turned into scrap: reci-pe limitations on rework and limited shelf life. The recipe limitation is usually based on quality concerns or allergen-content declaration require-ments. Allergen content require-ments are untouchable.
However, most quality limitations on rework are established during R&D. Limits on most cross-work—the re-work of one SKU into the recipe of another—are also set during R&D. A close look at maximum levels of re-work and cross-work, however, often reveals different standards applied to similar SKUs in different plants. Adopting consistent standards and working with R&D to increase the maximum level of recipe rework or cross-work can significantly decrease scrap levels.
Most limitations on cross-work are set to reduce the number of items on the contents list. Case-by-case discus-sions with marketing, quality control, and R&D about increasing the num-ber of items contained in specific SKUs without affecting quality or al-lergen content requirements can pro-vide opportunities for cross-working.
Reducing Inventory. A systematic lean approach can cut inventories by 20 to 30 percent. The logic behind reducing inventories of finished
goods in all industries is identical: it is to free up working capital. In the food and beverage industry, in which most products have a limited shelf life, there is an additional incentive: inventory reduction means fresher products. Fresher products promote
the perception of higher quality, and that can be a competitive advantage.
Inventory reduction can be achieved in three ways: decreasing cycle times, minimizing variability, and reducing safety stock.
Cutting changeover times to produce a company’s main SKUs more fre-quently can reduce cycle times with-out a negative impact on OEE. By us-ing lean tools to reduce changeover times, average cycle times can be re-duced by 40 to 50 percent.
Heijunka, a Japanese term for produc-tion leveling or smoothing, is a lean-manufacturing tool for reducing the number of changeovers and making them more predictable. Its objective is to reduce all kinds of production fluctuation. Products with stable de-mand are identified and assigned to a fixed repetitive-production cycle. Once this cycle is stabilized, it may be possible to shorten it. For all food-and-beverage SKUs, minimum and maximum boundaries of stocks are set in accordance with lead-time, variability of demand, and targeted service level. By increasing produc-tion frequency and thereby reducing
lead-time, safety stock levels can be decreased.
The reduction of both the minimum and maximum boundaries of stocks decreases the average time that each product is held in stock, resulting in smaller inventories and fresher prod-ucts going to customers. In addition, analyzing the accuracy of safety stock calculations and sales forecast-ing can further decrease required safety stock and lower inventories.
Responsibility for minimum and maximum boundaries of stocks is not generally in the hands of plant managers, so it’s important to in-volve the responsible departments. This is a good example of how a lean approach can eliminate silolike be-havior and create shifts in culture.
The Green Side of Lean. Lean ef-forts in food and beverages can yield significant environmental benefits. OEE enhancements reduce energy consumption, which means lower carbon emissions, especially in coun-tries where fossil-fuel-burning power generation dominates. Lower inven-tories can produce savings in refriger-ation. Material loss optimization can mean reduced use of raw materials. Carbon footprint reductions of sever-al percentage points can be obtained through a lean approach—at no in-cremental cost.
The Four Phases of Lean
The lean approach is divided into four basic phases: diagnosis, rollout, implementation, and sustained con-tinuous improvement. Through all those phases, successful programs follow a number of key rules. (See the sidebar “Ensuring the Success of Every ‘Lean’ Project.”)
Lean efforts in
food and beverages
can yield significant
environmental
benefits.

Lean Food-and-Beverage Manufacturing 13
Diagnosis. The diagnosis phase lasts from 6 to 12 weeks and is designed to assess existing lean culture and abilities, set program objectives linked to company strategy, identify potential targets, and win top man-agement’s support.
Rollout. This approach is based on enabling a company to take over full responsibility for the program quick-ly. A pilot lean effort follows the di-agnosis phase, which begins with six to eight transformation kick-start workshops that last from three to five weeks.
Because it is important to generate momentum, a plant that has a great-er-than-proportionate share of the addressable cost base is chosen for the first kick-start workshop. It is also helpful to choose a plant in which some employees have already re-ceived lean training and have lean tools. The first round of kick-start workshops should always include plants that manufacture the compa-
ny’s main product. Fast and large fi-nancial wins help sell the concept to the rest of the organization.
For each kick-start workshop, a lean-program expert leads a team of six to eight shared lean experts from exter-
nal plants and six to eight local champions. A workshop has six main phases: kickoff and hypothesis gener-ation, training, observation of the current state, definition of the future state, calculation of savings, and im-plementation.
On the first day of a kick-start work-shop, a plant tour of all processes is conducted and the main focus of the effort is identified. During the first
week, the training focuses on lean methodologies, including how to per-form analyses. After each training session, participants discuss their shop-floor observations.
The second week ends with an anal-ysis of the current state of each cho-sen topic. Kaizen workshops, ground-ed in observation and visualization, are used to identify optimization po-tential and reach agreement on tar-get future states. These discussions are rooted in the belief that anything is possible. The question asked is not, can it be done? Rather, partici-pants ask, what would it take?
At the same time, the local champi-ons direct the calculation of poten-tial savings from all proposals. Throughout the program, partici-pants learn to connect all contem-plated process improvements direct-ly to specific savings. Not only does this reinforce the key idea—saving money—behind the whole effort, it also helps structure implementation.
Fast and large
financial wins
help sell the concept
to the rest of the
organization.
BCG designs each lean-manufactur-ing initiative to conform to the fol-lowing ten imperatives.
Move Quickly. For each plant, iden-tify savings, achieve the first quick wins, and train a critical mass of in-ternal lean experts within three to four weeks.
Tailor Each Project. Build on exist-ing efforts, adapting to the compa-ny’s specific needs.
Focus on Every Aspect. Working with about 20 employees in each plant, conduct due diligence. Leave no stone unturned.
Adhere to a Structured Approach. An hour-by-hour, round-the-clock agenda is a critical aspect of every effort.
Limit Capital Expenditures. Solu-tions should involve existing equip-ment and personnel.
Achieve Maximum Financial Impact. An essential goal is to cut the cost of goods sold by 2 to 3 per-cent and to free up net working capi-tal by reducing inventories.
Improve Products. A successful ef-fort means fresher, tastier products, using less inventory.
Create Sustainable Results. A well-executed project is one that meets, exceeds, and can sustain its objec-tives.
Enable the Organization. A typical program trains hundreds of employ-ees to focus on continuous improve-ment.
Ensure a High Return on Invest-ment. The company should recoup the consulting costs within a few months of the rollout of the project.
Ensuring the Success of Every “Lean” Project

14 The Boston Consulting Group
The implementation plan describes the initiatives, shows potential sav-ings, lists identified prerequisites, and maps major milestones.
Each lean-transformation kick-start workshop ends with a final readout, in which all proposals are presented to local plant management and invit-ed top management. Reinforcing a sense of local ownership of the pro-posals, the local plant team, support-ed by the external team, presents the final readout.
The goal is for the program rollout to be self-sustaining after six to eight workshops. A one-week handoff workshop helps prepare the internal team to take over full responsibility for the lean program. In this work-shop, the assigned lean-program ex-perts, manufacturing top manage-ment, and the trainers agree on a schedule for continued rollout. Final training is offered on how to manage the program independently and maintain momentum.
Implementation. After the work-shop, the local plant management takes over full responsibility for im-plementation under the supervision of the lean-program experts. The im-plementation process is driven by lo-cal champions who use workshops and Kaizen events to spread the
knowledge—as well as the lean way of thinking—throughout the plant. The responsible lean-program expert revisits the plant for one full week every six to eight weeks after com-pletion of the transformation kick-start workshop. Additionally, identi-fied opportunities are tracked and reported centrally to help keep the attention and support of senior man-agement. In recent case experience, BCG has found that many initiatives are implemented very quickly and the lean effort is actually self-funded within the first three months.
Sustained Continuous Improve-ment. Generating continuous im-provement and, thus, competitive ad-vantage requires four key elements. First, top management must do more than pay lip service to lean; the man-agement team must be fully commit-ted to lean transformation as a stra-tegic objective for the company. Second, lean must be embedded in the company’s organization structure through designated lean-manufactur-ing officers and groups with real au-thority. Third, manufacturing perfor-mance must be carefully and systematically monitored using ap-propriate metrics. Finally, the compa-ny’s people at all levels must be con-tinuously and actively engaged in the process. That means not only teaching lean techniques but also
showing the value of lean to team members and other individuals. It also means providing them with strong incentives to contribute to the process of transformation.
Freeing Capacity by Freeing Intelligence
For all of its industry-specific details, an effective lean approach to food and beverage manufacturing is based on a simple idea: in most cas-es, the information needed to elimi-nate waste is already present in the plant. It is in the heads and the expe-rience of the people who work there. The lean process is ultimately about eliminating waste by accelerating the flow of good ideas and decisions within a plant and an organization. It is about freeing capacity by freeing intelligence.
After his company embarked on a BCG-led lean-transformation effort, the COO of the supplier mentioned at the beginning of this report said, “The technical knowledge and awareness of the issues are typically with us anyway. This approach helped us really take up inefficien-cies in a professional and systematic manner and solve them faster.”
Lean Food-and-Beverage Manufacturing 15
About the AuthorsIvan Bascle is a partner and manag-ing director in the Munich office of The Boston Consulting Group. You may contact him by e-mail at [email protected].
Pierre Derieux is a partner and managing director in the firm’s Paris office. You may contact him by e-mail at [email protected].
Patrick Ducasse is a senior partner and managing director in BCG’s Paris office. You may contact him by e-mail at [email protected].
Joe Manget is a senior partner and managing director in the firm’s Toronto office. You may contact him by e-mail at [email protected].
Stefan Babel is a project leader in BCG’s Berlin office. You may contact him by e-mail at [email protected].
Love Edquist is a consultant in the firm’s Berlin office. You may contact him by e-mail at [email protected].
AcknowledgmentsThe authors would like to thank the executives and lean managers who shared their time and insight and gave feedback for this report. Fur-thermore, we thank the following people for their excellent insight and discussions: Ian Colotla, François Dalens, Adam Farber, Thomas Frost, Kai Oberschmidt, and Daniel Spindelndreier, as well as all the as-sociated members of BCG’s lean ad-vantage topic area, for providing us with helpful data, information, and feedback.
The authors would also like to thank Katherine Andrews, Gary Callahan, Peter Carbonara, Martha Craumer, Elyse Friedman, Kim Friedman, and Simon Targett for their editorial and production assistance.
For Further ContactBCG’s Consumer and Operations practices cosponsored this report. For inquiries, please contact the prac-tices’ respective global leaders: Patrick DucasseSenior Partner and Managing DirectorBCG [email protected]
Joe MangetSenior Partner and Managing DirectorBCG [email protected]

For a complete list of BCG publications and information about how to obtain copies, please visit our Web site at www.bcg.com/publications.
To receive future publications in electronic form about this topic or others, please visit our subscription Web site at www.bcg.com/subscribe.
© The Boston Consulting Group, Inc. 2010. All rights reserved.5/10 Rev.

Abu DhabiAmsterdamAthensAtlantaAucklandBangkokBarcelonaBeijingBerlinBostonBrusselsBudapestBuenos AiresCanberraCasablanca
ChicagoCologneCopenhagenDallasDetroitDubaiDüsseldorfFrankfurtHamburgHelsinkiHong KongHoustonIstanbulJakartaKiev
Kuala LumpurLisbonLondonLos AngelesMadridMelbourneMexico CityMiamiMilanMinneapolisMonterreyMoscowMumbaiMunichNagoya
New DelhiNew JerseyNew YorkOsloParisPhiladelphiaPragueRomeSan FranciscoSantiagoSão PauloSeoulShanghaiSingaporeStockholm
StuttgartSydneyTaipeiTokyoTorontoViennaWarsawWashingtonZurich
bcg.com