lean manufacturing and its application in the...
TRANSCRIPT

UNIVERSIDAD DE VALLADOLID
ESCUELA DE INGENIERIAS INDUSTRIALES
Grado en Ingeniería en Electrónica Industrial y Automática
Lean Manufacturing and its application in the
laboratory of Häme University of Applied
Sciences (HAMK)
Autor:
Mínguez Olivares, Laura
María Isabel Sánchez Bascones
HAMK University of Applied Sciences
Valladolid, Septiembre 2017.

TFG REALIZADO EN PROGRAMA DE INTERCAMBIO
TÍTULO: Lean Manufacturing and its application in the laboratory of Häme
University of Applied Sciences (HAMK)
ALUMNO: Laura Mínguez Olivares
FECHA: 23/05/2017
CENTRO: HAMK University of Applied Sciences
TUTOR: Susan Heikkilä

RESUMEN:
En el siguiente Trabajo de Fin de Grado se explica el modelo Lean Manufacturing, analizando sus orígenes y las distintas técnicas en las que está basado, explicando los objetivos a cumplir por este modelo.
De modo práctico, se aplica esta metodología en el laboratorio de la Universidad HAMK of Applied Sciences con el objetivo de mejorar la organización y gestión de los recursos del laboratorio para optimizar el tiempo y la calidad empleados en la realización de los proyectos y tareas de sus estudiantes y profesores.
PALABRAS CLAVE:
Lean Manufacturing, Just In Time, mejora continua, Sistema de Producción Toyota y 5
ceros.

LEAN MANUFACTURING AND ITS APPLICATION IN THE LABORATORY OF HÄME UNIVERSITY OF APPLIED SCIENCES
(HAMK)
Bachelor’s thesis
Degree Programme Industrial Management Engineering and Electrical and Automation Engineering
Valkeakoski, Spring 2017
Laura Mínguez Olivares & Paula Ramos Martín

ABSTRACT Degree Programme in Industrial Management Engineering and Electrical and Automation Engineering
Valkeakoski Authors Laura Mínguez Olivares & Paula Ramos Martín Year 2017 Subject of Bachelor’s thesis Lean Manufacturing and its application in the
laboratory of Häme University of Applied Sciences (HAMK)
Supervisor(s) Susan Heikkilä ABSTRACT
The purpose of this analysis was to evaluate Lean Manufacturing model and apply it on HAMK’s laboratory. Nowadays, the laboratory does not have development plans in use. Some of the problems found on the laboratory were disorganized tool panels, lack of instructions on the robots and machines and lack of visualization of tools and different pieces. These problems led to untidy tools and loss of tools and materials. The key objective is to offer solutions for each existing problem, such as placing instruction guides for machines and robots, using U-shaped layout, utilizing accessible and organized tool panels, make students aware of changes, and teach them how to use properly tools and machines. In order to obtain clean workplaces, the following steps must be taken into account: delete useless workplace, organize workplace in an efficient way, improve the cleaning level, prevent the apparition of dirt and disorder establishing rules and procedures and foment efforts to keep improving. All of these measures have been proposed in order to make a path for future implementation in HAMK’s laboratory, so that the laboratory would be a safety, tidy and comfortable place to work.
Keywords Lean Manufacturing, Just In Time, continuous improvement. Pages 56 pages

CONTENTS
LEAN MANUFACTURING AND ITS APPLICATION IN THE LABORATORY OF HÄME UNIVERSITY OF APPLIED SCIENCES (HAMK) ..................................................................... 4
1 INTRODUCTION ........................................................................................................... 1
1.1 Concepts of waste and instabilities in Lean Manufacturing ............................... 1
1.2 Techniques Lean Manufacturing is based on ...................................................... 2
2 LEAN MANUFACTURING .............................................................................................. 3
2.1 Origins of Lean Manufacturing ............................................................................ 3
2.1.1 Japan in the 1950s ................................................................................... 3
2.1.2 Japan in the 1970s ................................................................................... 4
2.2 Objectives of Lean Manufacturing ...................................................................... 6
3 PLANNING, PROGRAMMING AND CONTROLLING JIT ................................................. 8
3.1 Heijunka production levelling ............................................................................. 8
3.1.1 Heijunka box ............................................................................................ 9
3.1.2 Resources Levelling ............................................................................... 12
3.1.3 Constraint Satisfaction Problem ............................................................ 19
3.2 KANBAN system of execution and control ........................................................ 20
3.2.1 Kanban origins ....................................................................................... 21
3.2.2 Elements of Kanban ............................................................................... 21
3.2.3 Requirements of production plant ........................................................ 24
3.2.4 Functioning of system ........................................................................... 24
3.2.5 Two-bin inventory management system .............................................. 26
3.2.6 Rules of Kanban ..................................................................................... 26
3.2.7 Example of application of Kanban ......................................................... 27
4 ADJUSTMENT AND IMPROVEMENT OF THE PRODUCTION SYSTEM......................... 29
4.1 Reduction of setup time (SMED) ....................................................................... 29
4.1.1 Set-up time ............................................................................................ 29
4.1.2 Procedure .............................................................................................. 29
4.2 Adaptation to demand through flexibility of workers (Shojinka) ..................... 31
4.2.1 U-shaped work cells .............................................................................. 32
4.2.2 Multi-skilled workers ............................................................................. 32
4.3 Standardization of operations ........................................................................... 33
4.3.1 Production cycle .................................................................................... 33
4.3.2 Standard route of operations ................................................................ 34
4.3.3 Standard quantity of work in process ................................................... 34
4.3.4 Standard work combination table ......................................................... 34
4.4 Intelligent automation of faults (Jidoka) ........................................................... 35
4.4.1 Concept of Jidoka .................................................................................. 36
4.4.2 Elements of Jidoka ................................................................................. 36
4.4.3 Auto Quality Matrix (AQM) ................................................................... 37
4.5 Fountain of ideas (Soikufu) ............................................................................... 38
4.5.1 Elements of Soikufu ............................................................................... 38
4.6 Total Productive Maintenance (TPM) ............................................................... 39

4.7 Relationship with suppliers ............................................................................... 40
5 IMPLEMENTATION OF LEAN MANUFACTURING ....................................................... 40
6 PRACTICAL EXAMPLES OF LEAN MANUFACTURING IN DIFFERENT COMPANIES ..... 41
7 APPLICATION OF LEAN MANUFACTURING AT HÄME UNIVERSITY OF APPLIED SCIENCES (HAMK) ........................................................................................................... 42
7.1 Concepts of waste and instabilities ................................................................... 42
7.1.1 Waste, Mura .......................................................................................... 43
7.1.2 Waste, Muri ........................................................................................... 43
7.1.3 Waste, Muda: Over-Production ............................................................ 44
7.1.4 Waste, Muda: Inventory ........................................................................ 44
7.1.5 Waste, Muda: Waiting ........................................................................... 44
7.1.6 Waste, Muda: Transportation ............................................................... 45
7.1.7 Waste, Muda: Excessive motions .......................................................... 45
7.1.8 Waste, Muda: Over- Processing ............................................................ 46
7.1.9 Waste, Muda: Rejects and repairs ........................................................ 46
7.1.10 Waste, Muda: Competences and human talent ................................... 46
7.2 Total Productive Maintenance (TPM) ............................................................... 47
7.2.1 Sort (Seiri) .............................................................................................. 48
7.2.2 Stabilize (Seiton) .................................................................................... 49
7.2.3 Shine (Seiso) .......................................................................................... 50
7.2.4 Standardize (Seiketsu) ........................................................................... 51
7.2.5 Sustain (Shitsuke) .................................................................................. 51
7.3 Other measures to be taken ............................................................................. 52
7.3.1 Reduction of setup time (SMED) ........................................................... 52
7.3.2 Adaptation to demand through flexibility of workers (Shojinka) ......... 53
7.3.3 Standardization of operations ............................................................... 53
7.3.4 Intelligent automation of faults (Jidoka) ............................................... 54
7.3.5 Fountain of ideas (Soikufu) .................................................................... 54
7.3.6 Relationship with suppliers ................................................................... 55
8 CONCLUSION ............................................................................................................. 55
BIBLIOGRAPHY ................................................................................................................ 57

LIST OF TABLES Table 1 Notation ............................................................................................................. 12
Table 2 Daily Production ................................................................................................. 13
Table 3 Data Consumption ............................................................................................. 13
Table 4 Medium quantity necessary of each resource .................................................. 14
Table 5 Profile of consumption of resources (Unlevelled sequence) ............................ 14
Table 6 Deviation First Sequence ................................................................................... 16
Table 7 First Sequence .................................................................................................... 16
Table 8 Deviation Second Sequence .............................................................................. 17
Table 9 Second Sequence ............................................................................................... 17
Table 10 Final Sequence ................................................................................................. 17
Table 11 Profile of consumption of resources (Method of persecution of objectives) . 18
Table 12 Traditional techniques to detect errors ........................................................... 35
Table 13. Practical examples of Lean manufacturing ..................................................... 41
Table 14 Type of waste and its probability of appearance ............................................ 42
Table 15 General Rules in the laboratory ....................................................................... 47
Table 16 Application of the 5S method .......................................................................... 48
Table 17 5S and its probability of appearance ............................................................... 48
Table 18 Implementation of Lean Manufacturing ......................................................... 52
TERMINOLOGY
AQM Auto Quality Matrix
BKP Box Kanban Production
BKT Box Kanban Transport
BRKP Box Reception Kanban Production
CC Capacity of Container
CIM Computer Integrated Manufacturing
CP Constraint Programming
CSP Constraint Satisfaction Problem
d Deadline
Ddt Demand in the delivery time
Dm Daily medium demand
EOQ Economic Order Quantity
FMS Flexible Manufacturing Systems
JIT Just In Time
KP Kanban Production
KT Kanban Transport
QC-Circles Quality Control Circles
SC Security Coefficient
SS Security Stock
TPM Total Productive Maintenance
TPS Toyota Production System
WC Work Centre

1
1 INTRODUCTION
Lean Manufacturing is a management model focused on the reduction of every kind of waste and instability regarding the production system (Business Dictionary, 2016).
1.1 Concepts of waste and instabilities in Lean Manufacturing
There are three concepts as for these types of waste and instabilities: Mura, Muri and Muda. These concepts that come from the Japanese language belong to “Kaizen” or the philosophy of continuous improvement. (Recorrer juntos el Gemba..., 2014) (Kailean Consultores, 2015).
Mura: This concerns to any irregularity, weakness, default or unexpected variation. Whenever a Mura appears, the complete system gets out of balance. By using the Just in Time values, it is possible to avoid a Mura.
Muri: This indicates excess, overburden, high level of stress or any unreasonable effort. In brief, a Muri appears every time an unnecessary activity is done. Muri originates bottlenecks, dead time and breakdowns. It can be avoided by standardizing and improving the processes with a correct design of lay-out, SMED techniques to reduce preparing times, Total Productive Maintenance (TPM) and ‘5S’ among others.
Muda: This means waste. Everything that consumes resources and does not provide the customer with any value. Overall, every activity that is considered unnecessary or useless. There have been identified eight types of Muda: -Over-production -Inventory -Waiting -Transportation -Excessive motions -Over-processing -Rejects and repairs -Competences and human talent (waste of the existing talent)

2
Figure 1 Mura-Muri-Muda (Pinterest-The world´s catalog of ideas, n.d.)
Figure 1 shows three concepts, which represent the different types of waste and instabilities. Mura means unevenness, shown in the picture where two people carrying something and one of them has to do more effort because of the irregularity. Muri means overburden and in the picture above is symbolized by a person who is holding a lot of weight and he cannot afford it. Besides, a person who is wasting material is representing Muda in the picture above, but as it has been explained before, there are more kinds of waste apart from material waste such as human talent among others.
1.2 Techniques Lean Manufacturing is based on
The main objective is to search for a flexible, with quick answer and low stock system (‘Just in Time’ system). In order to achieve the philosophy of the Just In Time, two different methods of work should be applied, such as Heijunka production levelling and system of execution and control KANBAN, which will be explained in Chapter 3 “Planning, programming and controlling”. To be able to implement the system of planning, programming and controlling low stock the following techniques, which will be explained in detail in Chapter 4 “Adjustment and improvement of Lean Manufacturing”, must be implemented:
1. Reduction of the setup time (SMED) 2. Adaptation to demand with the flexibility of the workers
(Shojinka) 3. Standardization of operations 4. Intelligent automation of faults (Jidoka) 5. Fountain of ideas (Soikufu) 6. Total Productive Maintenance (TPM) 7. Relationship with suppliers
3
2 LEAN MANUFACTURING
The adjusted manufacturing is a simple and effective work method which has its origin in Japan, focused on an increase of the productive efficiency in every process by implementing the Kaizen philosophy based on continuous developments in time, waste, space, stock and defect, making workers part of this change. (Wikipedia, Lean manufacturing, 2005).
2.1 Origins of Lean Manufacturing
The history starts from the 1950s with the concept of Kaizen (改善), word that can be split into two parts (Wikipedia, Lean manufacturing, 2005):
改 (kai in Japanese, gǎi in Chinese) means ‘change’.
善 (zen in Japanese, shàn in Chinese) means ‘beneficial’. On the basis of this concept, Lean Manufacturing began to be applied by Toyota. In the 1970s, Lean Manufacturing was widely spread all around the world.
2.1.1 Japan in the 1950s
In the Japanese post-war period, the automation market had some similarities with the modern globalized market, such as the competence of the occidental products, specially the American ones, which began to have access into the Japanese markets, the high price of factors due to the shortage caused by the war, and a small market that carried to the diversity of demand. (Progressa Lean, 2017). The first thought of Lean Manufacturing appeared in the end of the 19th century in Japan by Sakichi Toyoda. Sakichi created a device that could detect problems in the line production and alarm the workers. With this machine, the philosophy of Jidoka was applied since there was a machine with a human touch. By using this new system, the production stopped when an element had defaults, so they avoided the production of errors. This measure increased the productivity because an only worker could control different machines. (Lean Enterprise Institute, A Brief History of Lean, 2017). Eiji Toyoda established the Toyota Production System (TPS), based on producing only the quantity that the customer demanded when he demanded it. This new system, added with the reduction in the changing times (SMED) improved the Toyota´s system. Taiichi Ohno, illustrated in Figure 2, and Eiji Toyoda, a Japanese engineer, established the Toyota Production System.

4
Figure 2 Taiichi Ohno: Lean Production (Clyton, 2015)
Nowadays, the Lean Manufacturing System of Toyota is being applied in various kind of companies.
Figure 3 Toyota Production System (What is SixSigma, n.d.)
Figure 3 represents the obtaining of TPS by adding JIT with Jidoka. The main objective of JIT is added with the philosophy of Jidoka (humanized automation).
2.1.2 Japan in the 1970s
The global environment suffers from important changes: Globalization, an increase of price of factors and a high rate of technological development. The goods and services markets are characterized for the high competence, the high rate of obsolescence of products, the short product life cycle and the importance of the customers (‘customer is the king’). (Liker, 2013) (Universidad Autónoma del Estado de Hidalgo, 2008). Due to these features, new competitive priorities have appeared such as cost, deadlines, quality, service, flexibility and innovation. In order to make the most of all of these priorities it is necessary to learn how to manage the Trade Offs, that is why new productive paradigms have appeared such as JIT (Just In Time), Lean Manufacturing, Synchronize Production, FMS (Flexible Manufacturing Systems) and CIM (Computer Integrated Manufacturing).
5
In the 1970s, Japanese products, mainly cars and electronic devices, invaded the global market because they were capable of achieving the priorities mentioned above. They could compete in quality and low price. A short list of the reasons of their success included:
Selective personal hiring
Evaluation and promotion politics
Rotation system in the workstations
Shared decision making
No overburden machines
Cleaned and organised working centres
Lack of stocks in the production plants
Staff motivation
Maximum level of quality
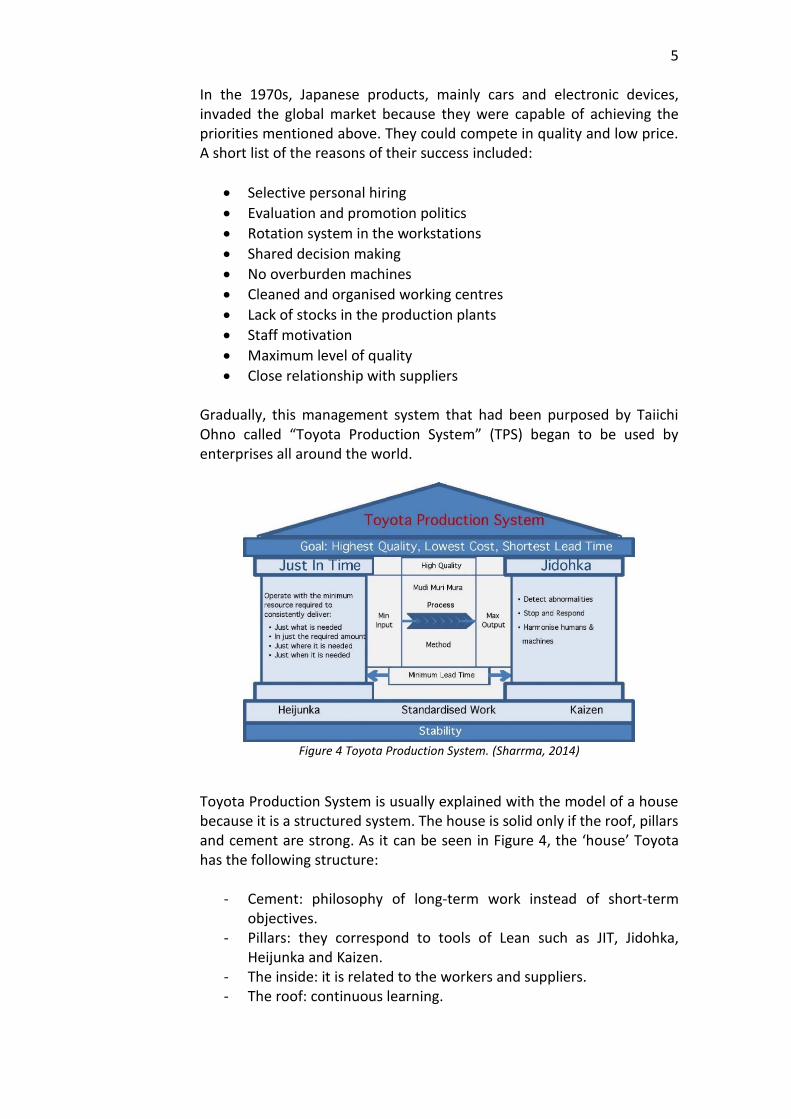
Close relationship with suppliers Gradually, this management system that had been purposed by Taiichi Ohno called “Toyota Production System” (TPS) began to be used by enterprises all around the world.
Figure 4 Toyota Production System. (Sharrma, 2014)
Toyota Production System is usually explained with the model of a house because it is a structured system. The house is solid only if the roof, pillars and cement are strong. As it can be seen in Figure 4, the ‘house’ Toyota has the following structure:
- Cement: philosophy of long-term work instead of short-term objectives.
- Pillars: they correspond to tools of Lean such as JIT, Jidohka, Heijunka and Kaizen.
- The inside: it is related to the workers and suppliers. - The roof: continuous learning.
6
2.2 Objectives of Lean Manufacturing
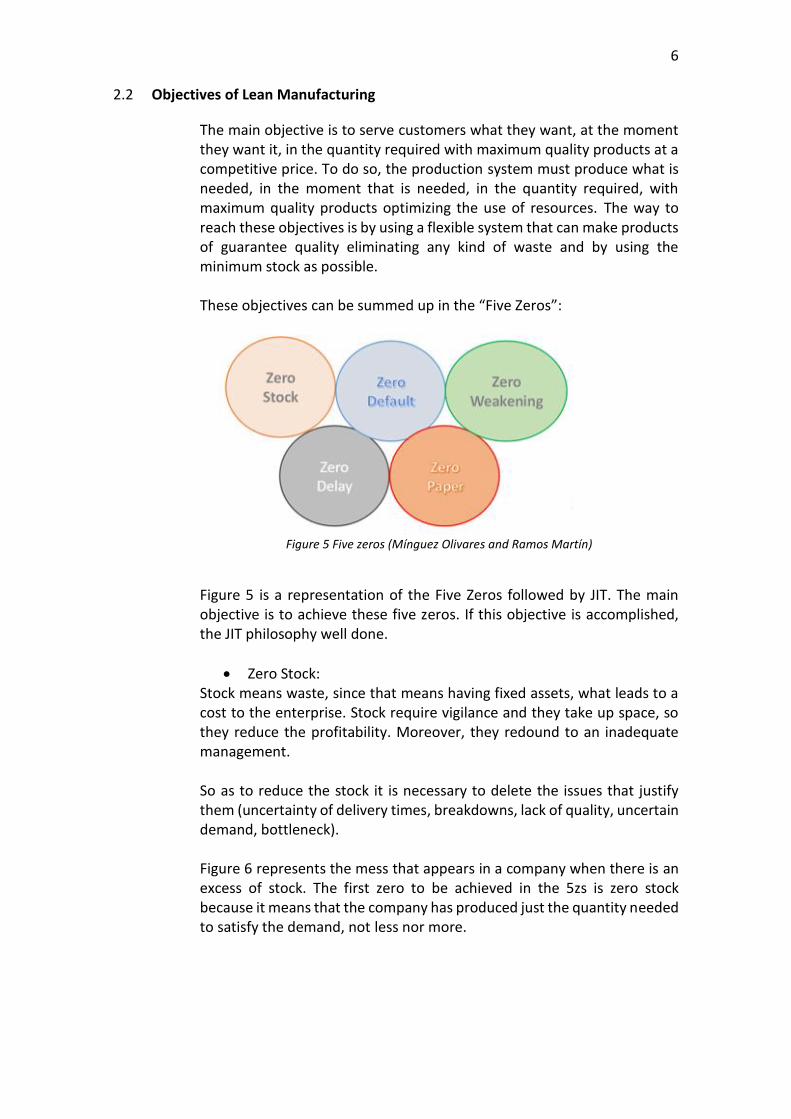
The main objective is to serve customers what they want, at the moment they want it, in the quantity required with maximum quality products at a competitive price. To do so, the production system must produce what is needed, in the moment that is needed, in the quantity required, with maximum quality products optimizing the use of resources. The way to reach these objectives is by using a flexible system that can make products of guarantee quality eliminating any kind of waste and by using the minimum stock as possible. These objectives can be summed up in the “Five Zeros”:
Figure 5 Five zeros (Mínguez Olivares and Ramos Martín)
Figure 5 is a representation of the Five Zeros followed by JIT. The main objective is to achieve these five zeros. If this objective is accomplished, the JIT philosophy well done.
Zero Stock: Stock means waste, since that means having fixed assets, what leads to a cost to the enterprise. Stock require vigilance and they take up space, so they reduce the profitability. Moreover, they redound to an inadequate management. So as to reduce the stock it is necessary to delete the issues that justify them (uncertainty of delivery times, breakdowns, lack of quality, uncertain demand, bottleneck). Figure 6 represents the mess that appears in a company when there is an excess of stock. The first zero to be achieved in the 5zs is zero stock because it means that the company has produced just the quantity needed to satisfy the demand, not less nor more.

7
Figure 6 Zero Stock (Nidia Elena, 2013)
Zero Default: Default causes costs and irregularities that lead to stock. These costs are related to reprocessing and rectification, clerical errors, after-sales service, refund to suppliers, loss of efficiency and image deteriorate among other things. In order to decrease the cost of faults, it is compulsory to do things right in the first attempt. Consequently, you have to work with 100% quality machines, to specify the quality with suppliers, to have participative programs of improvement, to do preventive maintenance and so on.
Zero Weakening: Breakdowns cause delays and stops in the production system and they are one of the causes that make stock remain. In order to decrease breakdowns, it is necessary to have an adequate layout, involvement of the workers in their operating assignment, Total Productive Maintenance programs and tidied and cleaned working centres.
Zero Delay: Deadlines are, between price and quality, one of the most competitive variables of the products of an enterprise. The reduction of the deadlines allows giving an adequate service to the customer, avoiding stock being accumulated and also increasing the flexibility to the adaptation to the demand. So as to reduce deadlines it is compulsory to reduce indispensable times such as waiting, preparation, transit and inspection times. The first ‘zeros’ explained are as important as the zero delay. It is mandatory to reduce the time as much as possible so that the deliveries are handed on time.
8
Zero Paper: JIT insists on the searching of simplicity. It tries to delete as far as possible any bureaucracy. Seeing that this reduction permits to decrease the time taken to make a decision, to reduce administrative costs and to count on faster and more accurate information. So, the way to reduce bureaucracy is by avoiding duplication of dates and the use of computer resources. The last objective to be achieved is zero paper, which means that companies have to try to reduce administrative costs in order to save money and to have work places clean and organized.
3 PLANNING, PROGRAMMING AND CONTROLLING JIT
If final processes are very irregular and intermittent, the previous processes that supply material will need to maintain security stock or extra capacity that compensates irregularities. If it desired to delete any kind of waste and imbalanced, it will be required a lot of stability in the production flow. However, the demand is no uniform because there are variations in short and medium term. In medium term, it is necessary to adjust the mix of production of each model (Shojinka or flexibility of the workers). In short term, the impact of the variations of the demand of each model in the system must be reduced (Heijunka or Production levelling).
3.1 Heijunka production levelling
Heijunka is a Japanese word that names the smoothing of the production program by controlling the volume and the mix of the fabricated products during a given time. This allows to soften the variations on the commercial demand by producing in small production batches different models in the same production line. When different models are made in the same production line, the variations on the demand are compensated with each other (the total demand is more uniform than the demand on each model separately).

9
Figure 7 Heijunka (What is SixSigma, n.d.)
Heijunka depends on the above three ways, shown in Figure 7, to achieve its objective. (What is Six Sigma.net, 2016). Flexibility is the ability to adapt the work environment to changes on the demand breaking the minimum number of constraints. Stability consists on determinate the number of products of each type to be produced in each lot. Heijunka box is created to show the time in which each product has to be sequenced. Predictability means to organize the schedules, the size of lots and the orders in changeover. Heijunka tries to level the volume and types of products in order to satisfy the customer demand without keeping too much stock. Traditionally, managers used to think that the best way to produce was making large batches of each type of product. However, Toyota years ago found that making small batches enable not to have that much stock than before. The way Toyota found the ideal product mix was by levelling the existing resources. To sum up, the main objectives of Heijunka are balancing the use of the different working stations and the work in the processes, which supply materials. (Shmula, 2007).
3.1.1 Heijunka box
Heijunka is a Japanese word that means levelling. Heijunka box is a tool used to keep the production balanced. With the traditional way of production in lots, there were so many inconvenients related such as lack

10
of space and quality and unbalanced in the use of resources. By using Heijunka box, there are many advantages compared with the traditional way of product materials. Some of the main advantages of using Heijunka box are that the size of lots is small, so the space needed is limited, the use of resources is balanced and other positive fact about Heijunka box is the high capacity of reaction, which means that is possible to adapt to the sudden variations on the demand. (Leanroots, 2016). The main concepts referred in the Heijunka box are (González Cruz, 2015):
Takt-time: This German word means “step” or “cycle time”. This word in ‘Lean Manufacturing’ means how much time it takes to produce one item. It is measured in seconds according to the demand and the available time of work. (mtm ingenieros, 2016).
𝑇𝑎𝑘𝑡 − 𝑡𝑖𝑚𝑒 = 𝑎𝑣𝑎𝑖𝑙𝑎𝑏𝑙𝑒 𝑡𝑖𝑚𝑒 𝑜𝑓 𝑝𝑟𝑜𝑑𝑢𝑐𝑡𝑖𝑜𝑛
𝑡𝑜𝑡𝑎𝑙 𝑟𝑒𝑞𝑢𝑖𝑟𝑒𝑑 𝑞𝑢𝑎𝑛𝑡𝑖𝑡𝑦
If there is line or a workshop that produces in a rhythm lower than the rhythm of the demand of the customer, it would take more time than the takt-time, so it would be necessary to do extra hours in order to satisfy the demand of the customer. On the contrary, if the production is on a higher rhythm than the demand, there will be waiting time and an overproduction. The main objective is to obtain, as far as possible, similar times between production time and takt-time. This can be achieved if flexible ways of work are defined so that they keep their efficacy despite changes in demand. Example (M, 2012): Shift: 8 hours: 28.800 seconds. Break: one of 10 minutes and one of 15 minutes: 1.500 seconds. Meetings: one at the beginning of each shift of 5 minutes: 300 seconds. Cleaning: one at the beginning of each shift of 5 minutes: 300 seconds. Available time to produce on each shift: 26.700 seconds. Demand required on each shift by customers: 500 units.
𝑇𝑎𝑘𝑡 − 𝑡𝑖𝑚𝑒 =26,700 𝑠𝑒𝑐𝑜𝑛𝑑𝑠
500 𝑢𝑛𝑖𝑡𝑠= 53,4 𝑠𝑒𝑐𝑜𝑛𝑑𝑠/𝑢𝑛𝑖𝑡
11
Production rate: It is managed through the distribution of the Kanban placed in the Heijunka box.
Pitch: This word refers to the time needed to produce one sequence of items. (Lean Enterprise Institute, Lean Lexicon, 2003)
𝑃𝑖𝑡𝑐ℎ = 𝑡𝑎𝑘𝑡 𝑡𝑖𝑚𝑒 ∙ 𝑞𝑢𝑎𝑛𝑡𝑖𝑡𝑦 𝑜𝑓 𝑢𝑛𝑖𝑡𝑠 Following the previous example: Takt-time: 53,4 seconds/unit Each container has 20 units.
𝑃𝑖𝑡𝑐ℎ = 53,4𝑠𝑒𝑐𝑜𝑛𝑑𝑠
𝑢𝑛𝑖𝑡∙ 20
𝑢𝑛𝑖𝑡𝑠
𝑐𝑜𝑛𝑡𝑎𝑖𝑛𝑒𝑟= 1,068 𝑠𝑒𝑐𝑜𝑛𝑑𝑠/𝑐𝑜𝑛𝑡𝑎𝑖𝑛𝑒𝑟
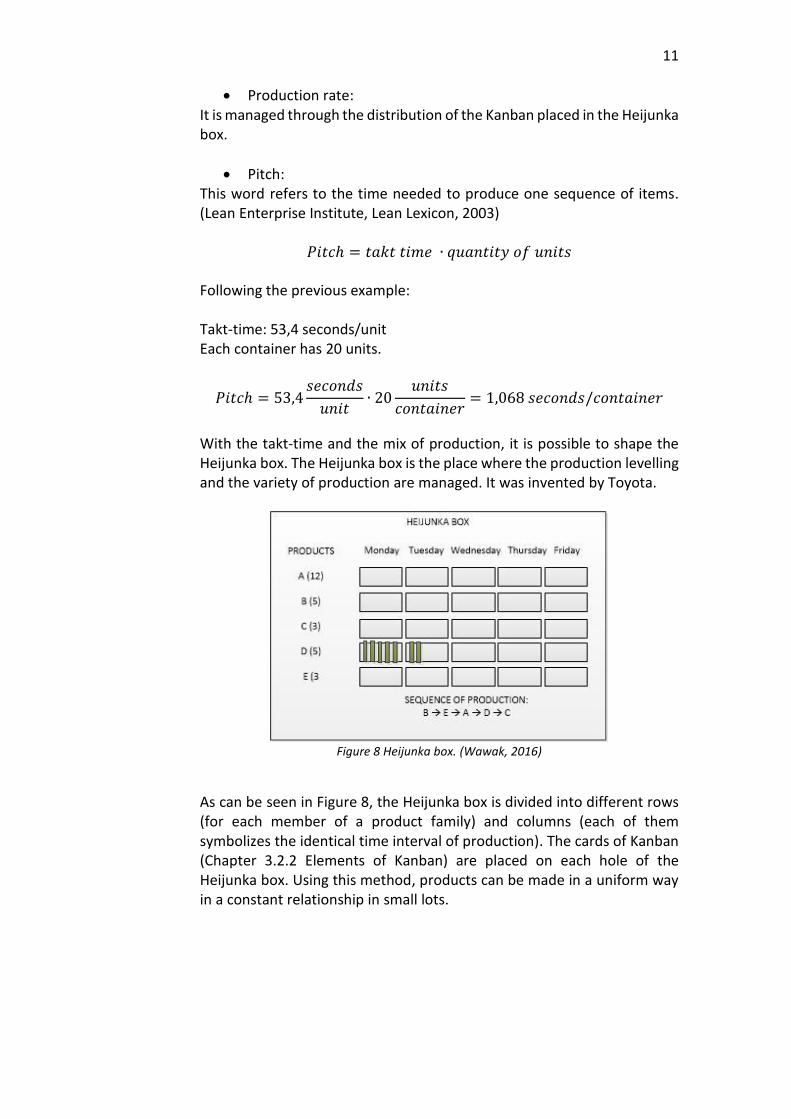
With the takt-time and the mix of production, it is possible to shape the Heijunka box. The Heijunka box is the place where the production levelling and the variety of production are managed. It was invented by Toyota.
Figure 8 Heijunka box. (Wawak, 2016)
As can be seen in Figure 8, the Heijunka box is divided into different rows (for each member of a product family) and columns (each of them symbolizes the identical time interval of production). The cards of Kanban (Chapter 3.2.2 Elements of Kanban) are placed on each hole of the Heijunka box. Using this method, products can be made in a uniform way in a constant relationship in small lots.
12
3.1.2 Resources Levelling
Table 1 Notation
Method of persecution of objectives (Rayón Jerez, 2011): This constructive method is used to minimize the deviation Dik by adding a model ‘i’ in each step ‘k’ sequenced.
Dik: deviation of the consumption of the resources related to the ideal medium consumption (𝑘 ∙ 𝑟𝑗)
Cjk: accumulated consumption of the resource ‘j’ in the position ‘k’
The objectives of the method are to achieve high productivity, to balance the processes, to reduce to minimum the work in process and to standardize the procedures to guarantee the security of the workers and the quality of the products. Example (Lean Enterprise Institute, Lean Lexicon, 2003): Determined the assembly sequence of these four models that are made in the flexible line for the first day of production.

13
Table 2 Daily Production
It is pretended to level the use of two resources (M1 and M2).
Table 3 Data Consumption
Before that, it is compulsory to determine the medium cycle time of the line if the work is made on two shifts of 8 hours with 20 minutes of stop between shifts. Resolution: First, it is necessary to calculate the takt-time:
Takt − time =𝑎𝑣𝑎𝑖𝑙𝑎𝑏𝑙𝑒 𝑡𝑖𝑚𝑒
𝑝𝑟𝑜𝑑𝑢𝑐𝑡𝑖𝑜𝑛=
8 ∙ 2 ∙ 60 − 20
200 + 150 + 100 + 50=
940
500= 1,88 𝑚𝑖𝑛/𝑢𝑛𝑖𝑡
After that, calculate the percentage of units of each model:
%𝐴 =200
500∙ 100 = 40% %𝐵 =
150
500∙ 100 = 30%
%𝐶 =100
500∙ 100 = 20% %𝐷 =
50
500∙ 100 = 10%
To make it easier, the example will be solved over 10 units (4 units of A, 3 units of B, 2 units of C and 1 unit of D).
Model A 200
Model B 150
Model C 100
Model D 50
Daily production
Model A 3 2
Model B 6 1
Model C 4 4
Model D 2 1
Consumption
of M1
Consumption
of M2

14
Table 4 Medium quantity necessary of each resource
UNLEVELLED SEQUENCE EXAMPLE: A relative common approach in mass production is to optimize the usage of resources, seek economies of scale with huge production batches in order to minimize the time spent for changeovers. Besides, it is necessary to start the month with the longest series, so that the bigger series are made properly. Following that way of production, supposing the sequence (AAAABBBCCD), the profile of the consumption of the resources is:
Table 5 Profile of consumption of resources (Unlevelled sequence)
Figures 9 and 10 show the representation for the table shown above.
A 4 3 12 2 8
B 3 6 18 1 3
C 2 4 8 4 8
D 1 2 2 1 1
Total (N) 10 Total M1 (R1) 40 Total M2 (R2) 20
n * ri1 n * ri2
2
Model QuantityConsumption of
M1
Consumption of
M2
Medium M1 (r1) 4 Medium M2 (r2)
Position in the
sequence (k)1 2 3 4 5 6 7 8 9 10
Proposed
sequenceA A A A B B B C C D
Accumulated
consumption of
M1 (C1k)
3 6 9 12 18 24 30 34 38 40
Ideal accumulated
consumption of
M1 (k * r1)
Accumulated
consumption of
M2 (Cik)
2 4 6 8 9 10 11 15 19 20
Ideal accumulated
consumption of
M2 (k * r2)12 14 16 18 20
24 28 32 36 40
2 4 6 8 10
4 8 12 16 20
15
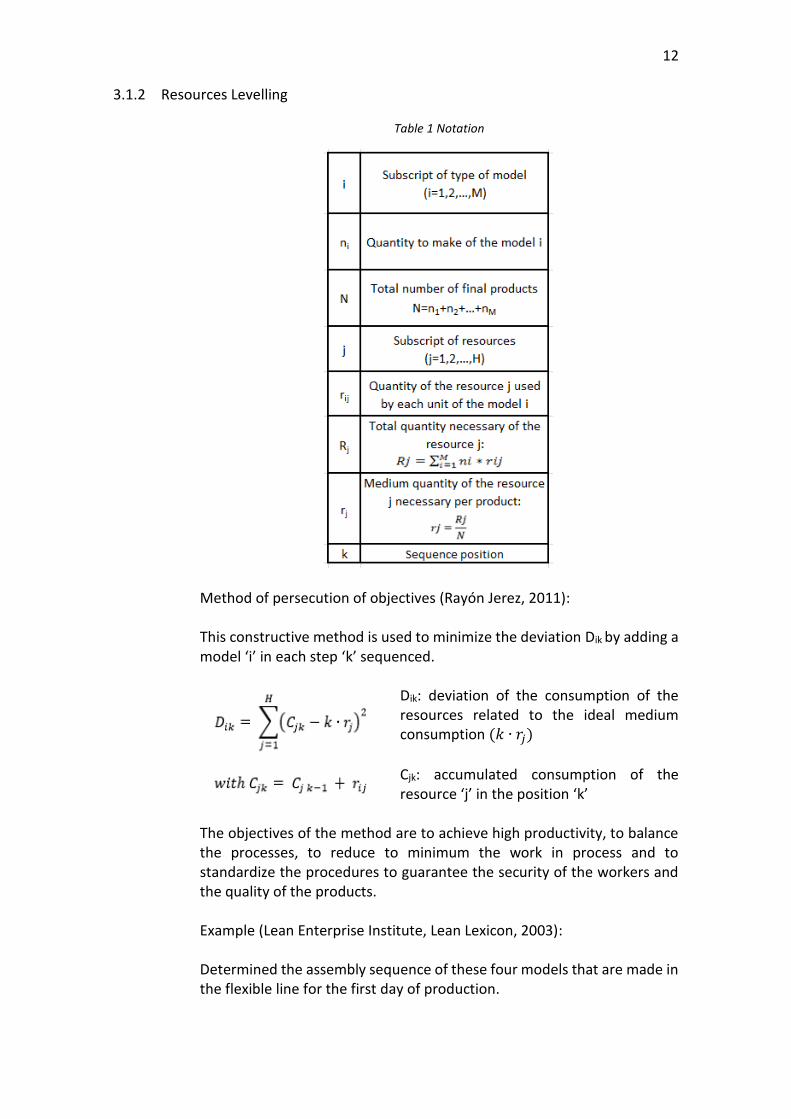
Figure 9 Consumption of M1 (Mínguez Olivares and Ramos Martín)
This is the graphic comparing the accumulated and the ideal consumption of the first of the materials needed in which it can be seen that the accumulated is far from the ideal one.
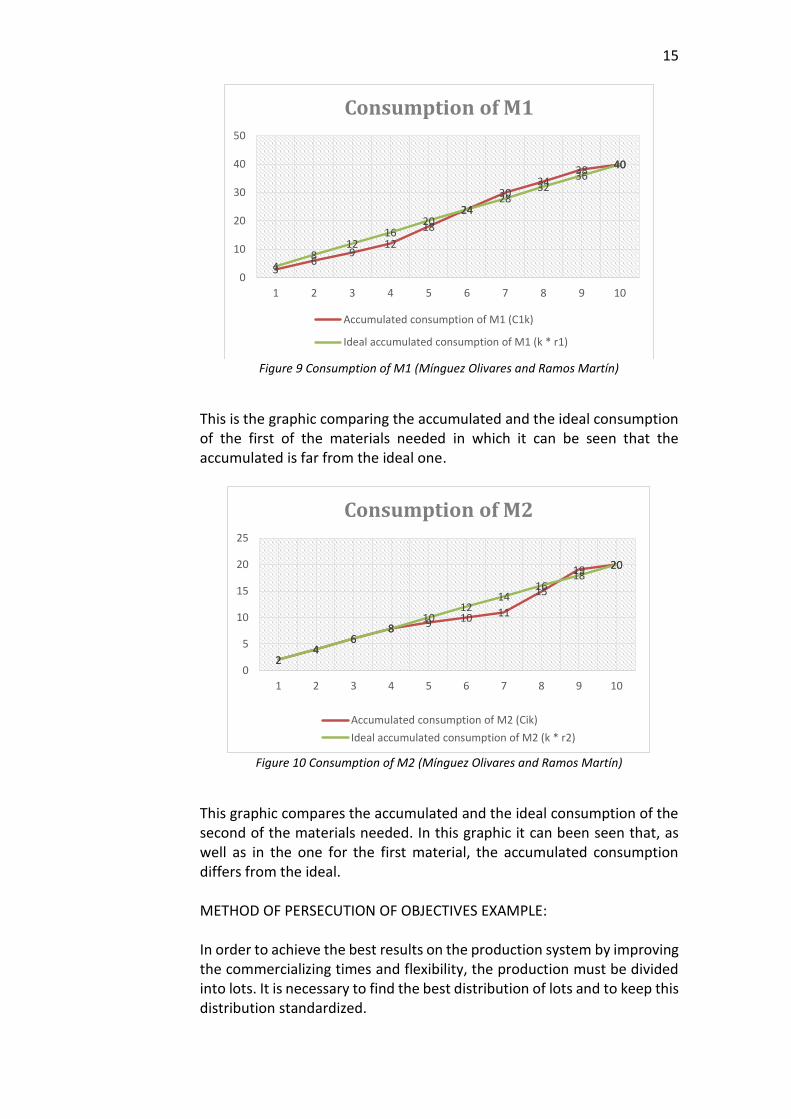
Figure 10 Consumption of M2 (Mínguez Olivares and Ramos Martín)
This graphic compares the accumulated and the ideal consumption of the second of the materials needed. In this graphic it can been seen that, as well as in the one for the first material, the accumulated consumption differs from the ideal. METHOD OF PERSECUTION OF OBJECTIVES EXAMPLE: In order to achieve the best results on the production system by improving the commercializing times and flexibility, the production must be divided into lots. It is necessary to find the best distribution of lots and to keep this distribution standardized.
36
912
18
24
3034
38 40
48
1216
2024
2832
3640
0
10
20
30
40
50
1 2 3 4 5 6 7 8 9 10
Consumption of M1
Accumulated consumption of M1 (C1k)
Ideal accumulated consumption of M1 (k * r1)
24
68 9 10 11
15
19 20
24
68
1012
1416
1820
0
5
10
15
20
25
1 2 3 4 5 6 7 8 9 10
Consumption of M2
Accumulated consumption of M2 (Cik)
Ideal accumulated consumption of M2 (k * r2)
16
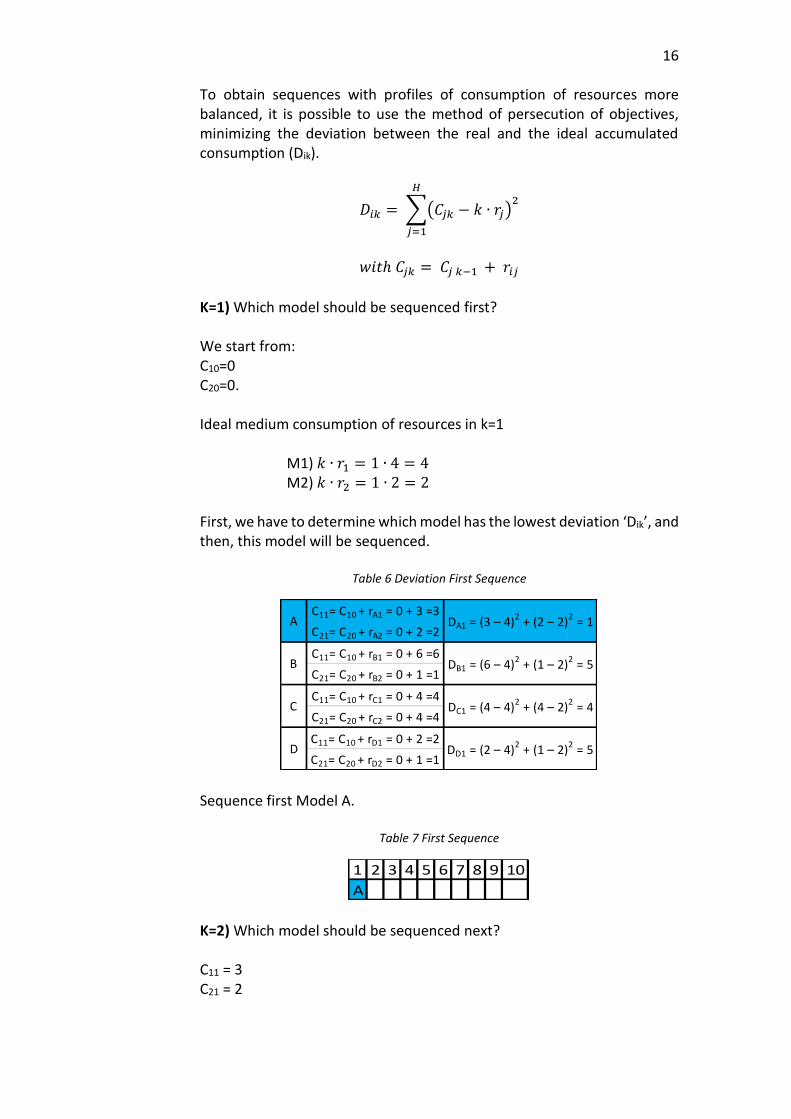
To obtain sequences with profiles of consumption of resources more balanced, it is possible to use the method of persecution of objectives, minimizing the deviation between the real and the ideal accumulated consumption (Dik).
𝐷𝑖𝑘 = ∑(𝐶𝑗𝑘 − 𝑘 ∙ 𝑟𝑗)2
𝐻
𝑗=1
𝑤𝑖𝑡ℎ 𝐶𝑗𝑘 = 𝐶𝑗 𝑘−1 + 𝑟𝑖𝑗
K=1) Which model should be sequenced first? We start from: C10=0 C20=0. Ideal medium consumption of resources in k=1 M1) 𝑘 ∙ 𝑟1 = 1 ∙ 4 = 4 M2) 𝑘 ∙ 𝑟2 = 1 ∙ 2 = 2 First, we have to determine which model has the lowest deviation ‘Dik’, and then, this model will be sequenced.
Table 6 Deviation First Sequence
Sequence first Model A.
Table 7 First Sequence
K=2) Which model should be sequenced next? C11 = 3 C21 = 2
C11= C10 + rA1 = 0 + 3 =3
C21= C20 + rA2 = 0 + 2 =2
C11= C10 + rB1 = 0 + 6 =6
C21= C20 + rB2 = 0 + 1 =1
C11= C10 + rC1 = 0 + 4 =4
C21= C20 + rC2 = 0 + 4 =4
C11= C10 + rD1 = 0 + 2 =2
C21= C20 + rD2 = 0 + 1 =1D DD1 = (2 – 4)2 + (1 – 2)2 = 5
A DA1 = (3 – 4)2 + (2 – 2)
2 = 1
B DB1 = (6 – 4)2 + (1 – 2)
2 = 5
C DC1 = (4 – 4)2 + (4 – 2)
2 = 4
1 2 3 4 5 6 7 8 9 10
A

17
Ideal medium consumption of resources in k=2 M1) 𝑘 ∙ 𝑟1 = 2 ∙ 4 = 8 M2) 𝑘 ∙ 𝑟2 = 2 ∙ 2 = 4
Table 8 Deviation Second Sequence
Table 9 Second Sequence
The method of persecution of objectives continues in the same way until every activity has been sequenced. The final result of the application of the method can be seen in Table 10:
Table 10 Final Sequence
C12= C11 + rA1 = 3 + 3 =6
C22= C21 + rA2 = 2 + 2 =4
C12= C11 + rB1 = 3 + 6 =9
C22= C21 + rB2 = 2 + 1 =3
C12= C11 + rC1 = 3 + 4 =7
C22= C21 + rC2 = 2 + 4 =6
C12= C11 + rD1 = 3 + 2 =5
C22= C21 + rD2 = 2 + 1 =3
C DC1 = (7 – 8)2 + (6 – 4)2 = 5
DDD1 = (5 – 8)2 + (3 – 4)2 =
10
A DA1 = (6 – 8)2 + (4 – 4)
2 = 4
B DB1 = (9 – 8)2 + (3 – 4)
2 = 2
1 2 3 4 5 6 7 8 9 10
A B
1 2 3 4 5 6 7 8 9 10
A B A C A B A C D B

18
The profile of the consumption of the resources is:
Table 11 Profile of consumption of resources (Method of persecution of objectives)
Figures 11 and 12 show the representation for the table shown above.
Figure 11 Consumption of M1 (Mínguez Olivares and Ramos Martín)
As we can see in this graphic, now the accumulated consumption for the first material and the ideal one are much more alike than the graphic shown in Figure 9.
Position in the
sequence (k)1 2 3 4 5 6 7 8 9 10
Proposed
sequenceA B A C A B A C D B
Accumulated
consumption of
M1 (C1k)
3 9 12 16 19 25 28 32 34 40
Ideal accumulated
consumption of
M1 (k * r1)
Accumulated
consumption of
M2 (Cik)
2 3 5 9 11 12 14 18 19 20
Ideal accumulated
consumption of
M2 (k * r2)
18 20
36 40
2 4 6 8 10 12 14 16
12 16 20 24 28 324 8
39
1216
1925
2832 34
40
48
1216
2024
2832
3640
0
10
20
30
40
50
1 2 3 4 5 6 7 8 9 10
Consumption of M1
Accumulated consumption of M1 (C1k)
Ideal accumulated consumption of M1 (k * r1)

19
Figure 12 Consumption of M2 (Mínguez Olivares and Ramos Martín)
Same for the graphic shown in Figure 12, in which the accumulated consumption and the ideal look more alike than the one shown in Figure 10. It can be said that the accumulated consumption obtained using the method of persecution of objectives in Table 11 is much more levelled than the one obtained in Table 5.
3.1.3 Constraint Satisfaction Problem
One example is this is the Car Sequencing Problem in which a car factory receives orders that must be sequenced in its assembly line. This Constraint Satisfaction Problem (CSP) can be solved by using a tool called Constraint Programming (CP). Each order and assembly line has its own requirements. It is compulsory to select an assembly line that minimizes the number of restrictions broken. (Solnon;Cung;Nguyen;& Artigues, 2005). To formulate a CSP problem in a CP language there are two kinds of variables and three kinds of constraints that must be taken into account: Variables:
o Xi: This variable is the class of the car ‘i’. o Oi
j: It is a binary variable, it is assigned a 1 if the option j has to be installed in the car i. Otherwise, it will be assigned a 0. It´s domain is {1,0}.
With: i= car to be sequenced (1, …, n) j= option to be installed (1, …, m)
2 35
911 12
14
18 19 20
24
68
1012
1416
1820
0
5
10
15
20
25
1 2 3 4 5 6 7 8 9 10
Consumption of M2
Accumulated consumption of M2 (Cik)
Ideal accumulated consumption of M2 (k * r2)

20
Constraints:
o Link constraints: This constraint shows the link between the variable Xi and Oi
j only if option j has to be installed on Xi. o Capacity constraints: This constraint expresses that a specific
station must not exceed one certain capacity. o Demand constraints: For each class of cars, there is a number of
cars that must be sequenced. Example:
Figure 13 PROC CLP: Car Sequencing Problem. (Dincbas;Simonis;& Hentenryck, 1988)
Figure 13 shows an example of this Car Sequencing Problem. We can see that the variables are: i={1, …, 60} j={air conditioning, automated car , …, leather seats ,GPS} Xi= {X1, …, X60} Oi
j= {O1 air conditioning, O1 automated car, …, O60 leather seats, O60GPS}
3.2 KANBAN system of execution and control
Kanban is an information system, based on cards, that controls the fabrication of the products needed in the appropriate quantity and time, in each of the process that takes place in the factory, as well as among different enterprises. This model has its origins in a company (Toyota) in the year 1956. The Kanban model was inspired in the supermarkets because in these places the products are offered to the customers when they need them in the quantity they need. If we apply this to a production line, it concerns to offer the components needed in the production to the workers in order to

21
they can do their work in the moment they need and in the quantity they need, ensuring the efficiency.
Figure 14 Kanban. (Yepes Piqueras, Universitat Politècnica de València, 2016)
As it can be appreciated in Figure 14, it is represented how Kanban model works. This model has be designed to avoid the overproduction and to make sure that all the components pass from one process to the next one in the correct order. It is a system that controls the quantity produced and the components are only replaced when it is necessary and in the adequate quantity.
3.2.1 Kanban origins
This system appears in the middle of the 20th century. The engineers working in Toyota became with the idea of implementing it when they saw the process that the supermarkets use to replace the products. They noticed that only the amount of products expected to be sold that day were the ones that were placed on the shelves. The engineers working in Toyota were able to realize the difference between a “push” system, used until that time in every factory, and a “pull” system, in which just the things that are going to be sold are to ones that are produced. (Duggan, 2015) (Yepes Piqueras, Kanban en ingeniería de la construcción, 2016).
3.2.2 Elements of Kanban
The different elements are (Cabrera Calva, 2011):
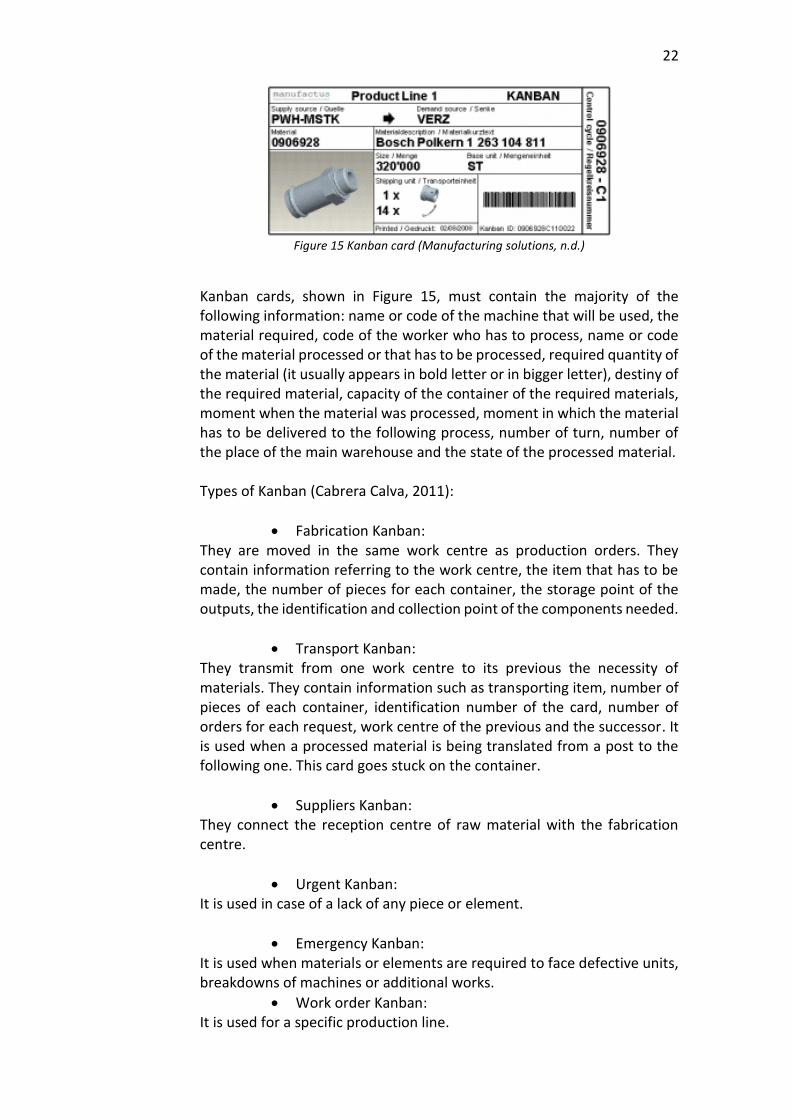
Cards (Kanban) These cards act as a witness in the production process. They are stuck in the containers of materials and they are removed when these containers are used, so that the replacement of materials is ensured. There are some factories that instead of using cards, they use balls.
22
Figure 15 Kanban card (Manufacturing solutions, n.d.)
Kanban cards, shown in Figure 15, must contain the majority of the following information: name or code of the machine that will be used, the material required, code of the worker who has to process, name or code of the material processed or that has to be processed, required quantity of the material (it usually appears in bold letter or in bigger letter), destiny of the required material, capacity of the container of the required materials, moment when the material was processed, moment in which the material has to be delivered to the following process, number of turn, number of the place of the main warehouse and the state of the processed material. Types of Kanban (Cabrera Calva, 2011):
Fabrication Kanban: They are moved in the same work centre as production orders. They contain information referring to the work centre, the item that has to be made, the number of pieces for each container, the storage point of the outputs, the identification and collection point of the components needed.
Transport Kanban: They transmit from one work centre to its previous the necessity of materials. They contain information such as transporting item, number of pieces of each container, identification number of the card, number of orders for each request, work centre of the previous and the successor. It is used when a processed material is being translated from a post to the following one. This card goes stuck on the container.
Suppliers Kanban: They connect the reception centre of raw material with the fabrication centre.
Urgent Kanban: It is used in case of a lack of any piece or element.
Emergency Kanban: It is used when materials or elements are required to face defective units, breakdowns of machines or additional works.
Work order Kanban: It is used for a specific production line.

23
Signal Kanban: It is used to gather lots. These cards can also have different colours depending on the necessities of production, which is being able to change the quantities in the buffers whenever the necessities change.
o Green= Fabrication Kanban:
𝑠𝑖𝑧𝑒 𝑜𝑓 𝑡ℎ𝑒 𝑙𝑜𝑡
𝑞𝑢𝑎𝑛𝑡𝑖𝑡𝑦 𝑜𝑓 𝑢𝑛𝑖𝑡𝑠 𝑖𝑛 𝑒𝑎𝑐ℎ 𝑐𝑜𝑛𝑡𝑎𝑖𝑛𝑒𝑟 𝑜𝑟 𝑐𝑎𝑟𝑑
o Yellow = Urgent Kanban: To calculate the number of yellow cards, the safety stock, the average of the demand, the variations of the lead times of the suppliers and their level of reliability must be taken into account. All of these must be divided by the quantity of units in each container or card.
o Red = Emergency Kanban: To avoid using a red or emergency Kanban it is suggested to calculate the critic level that would obligate its use. That is:
𝐶𝑢𝑠𝑡𝑜𝑚𝑒𝑟 𝑐𝑦𝑐𝑙𝑒 𝑡𝑖𝑚𝑒
𝑆𝑢𝑝𝑝𝑙𝑖𝑒𝑟 𝑟𝑒𝑠𝑒𝑡 𝑡𝑖𝑚𝑒
Containers Containers are recipients to collect and transport fabricated items.
Figure 16 Kanban containers (Manufacturing solutions, n.d.)
As it can be appreciated in Figure 16, after the container is full, it will be returned back to its original place. (Leanmanufacture.net, Kanban Containers, 2016).
Transports Trolleys, wheelbarrows or any other way to move the containers from one work centre to another.
24
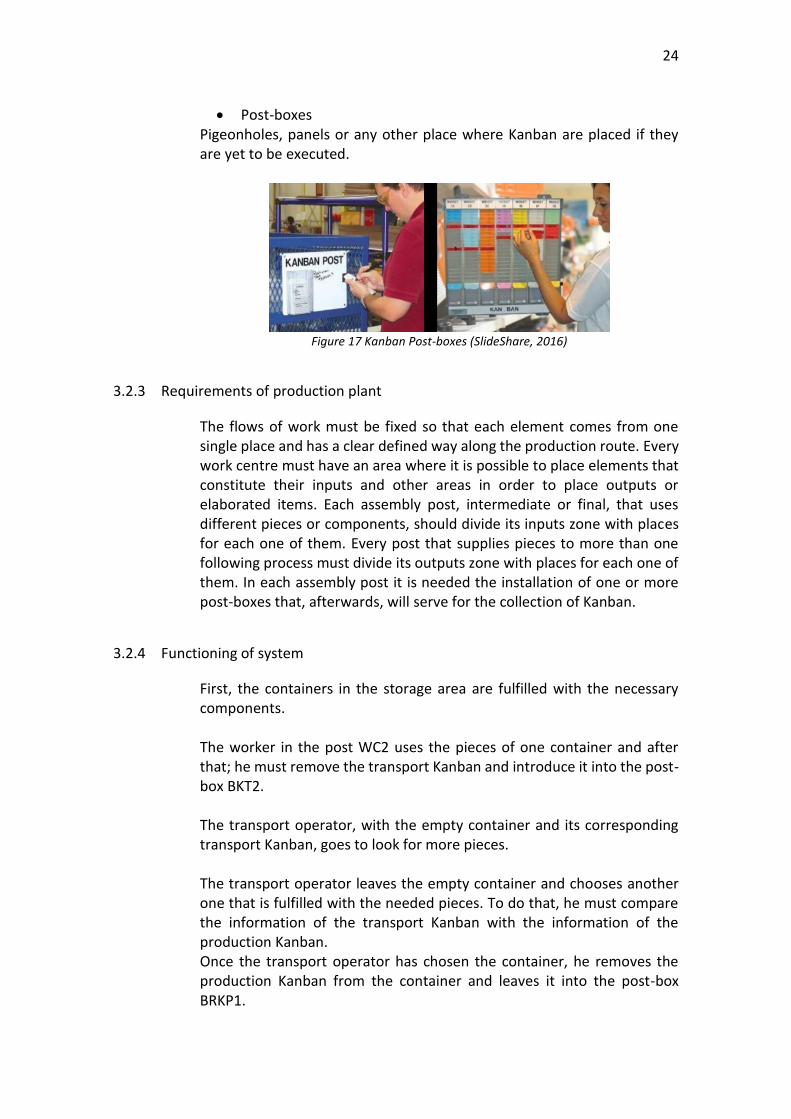
Post-boxes Pigeonholes, panels or any other place where Kanban are placed if they are yet to be executed.
Figure 17 Kanban Post-boxes (SlideShare, 2016)
3.2.3 Requirements of production plant
The flows of work must be fixed so that each element comes from one single place and has a clear defined way along the production route. Every work centre must have an area where it is possible to place elements that constitute their inputs and other areas in order to place outputs or elaborated items. Each assembly post, intermediate or final, that uses different pieces or components, should divide its inputs zone with places for each one of them. Every post that supplies pieces to more than one following process must divide its outputs zone with places for each one of them. In each assembly post it is needed the installation of one or more post-boxes that, afterwards, will serve for the collection of Kanban.
3.2.4 Functioning of system
First, the containers in the storage area are fulfilled with the necessary components. The worker in the post WC2 uses the pieces of one container and after that; he must remove the transport Kanban and introduce it into the post-box BKT2. The transport operator, with the empty container and its corresponding transport Kanban, goes to look for more pieces. The transport operator leaves the empty container and chooses another one that is fulfilled with the needed pieces. To do that, he must compare the information of the transport Kanban with the information of the production Kanban. Once the transport operator has chosen the container, he removes the production Kanban from the container and leaves it into the post-box BRKP1.

25
The worker sticks the transport Kanban to the chosen container and he carries this container to the post WC2, so that the worker in the post WC2 has again the pieces in their place. When the worker in the post WC1 is making the pieces, he must put the production Kanban in the post-box BKP1. Finally, when the pieces are already made, the worker in post WC1 puts the pieces into the corresponding container, having again the initial situation. (Cabrera Calva, 2011)
Figure 18 Kanban system (Mínguez Olivares and Ramos Martín)

26
3.2.5 Two-bin inventory management system
There is a variation to the system described in the previous chapter. This variation includes a second container in the second work centre as a buffer or safety stock. When the worker in post WC2 uses the first container, it is replaced with the second one, and the worker in the WC1 starts to manufacture the pieces removed. As we can see in Figure 19, in this way there are always pieces made, so in case something happens the production system does not have to be stopped (Leanmanufacture.net, Two bin inventory management system, 2016).
Figure 19 Kanban Inventory control. (Chaturvedi, 2011)
3.2.6 Rules of Kanban
The following are the rules of Kanban according to (Wikipedia, Kanban, 2016) (Cabrera Calva, 2011) (Romero, 2015). Rule 1: defective pieces must not pass to the next process. The reason is that the defective products cause a cost of materials, machines and labour so it is necessary to identify the error and avoid repeating it again.
Figure 20 Kanban Rule 1 (Díaz, 2014)
Rule 2: the following process will collect from the previous one the necessary products, in the correct quantity, place and moment. It is not about supply, it is about request. The decisions to order are taken by the following processes and Kanban cards will be used to request the material. Rule 3: the process must only produce the quantity required. Only the products that have been retired must be resupplied. With this rule, stock is minimized.
27
Rule 4: It is necessary to balance the production. The objective is to produce just the needed quantity for the following processes, so machines and material must be ready when it is necessary and in the correct quantity. Pieces without Kanban must be neither produced nor transported.
Rule 5: Kanban signal must be placed either in the pieces or in the container.
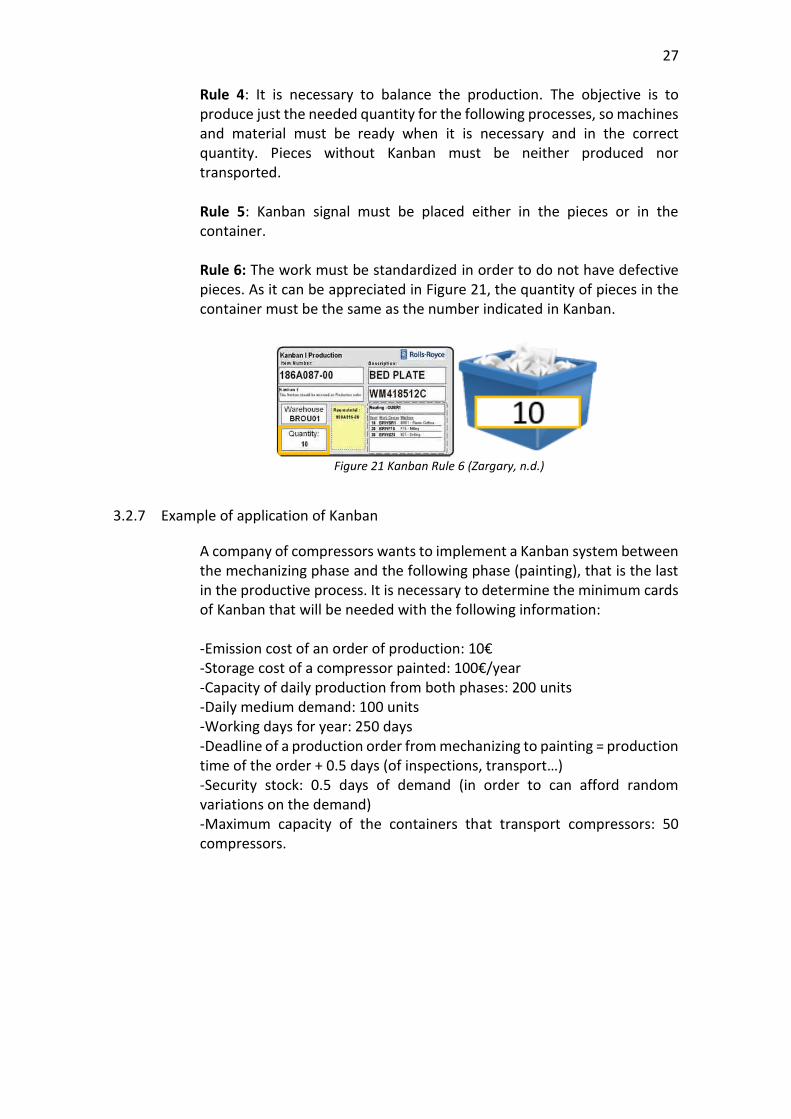
Rule 6: The work must be standardized in order to do not have defective pieces. As it can be appreciated in Figure 21, the quantity of pieces in the container must be the same as the number indicated in Kanban.
Figure 21 Kanban Rule 6 (Zargary, n.d.)
3.2.7 Example of application of Kanban
A company of compressors wants to implement a Kanban system between the mechanizing phase and the following phase (painting), that is the last in the productive process. It is necessary to determine the minimum cards of Kanban that will be needed with the following information: -Emission cost of an order of production: 10€ -Storage cost of a compressor painted: 100€/year -Capacity of daily production from both phases: 200 units -Daily medium demand: 100 units -Working days for year: 250 days -Deadline of a production order from mechanizing to painting = production time of the order + 0.5 days (of inspections, transport…) -Security stock: 0.5 days of demand (in order to can afford random variations on the demand) -Maximum capacity of the containers that transport compressors: 50 compressors.

28
SOLUTION: To resolve the problem, the first step to do is calculate the optimum size of the order of production:
𝐸𝑂𝑄 = √2 ∙ 𝐷 ∙ 𝐶𝑒
𝑟 ∙ 𝑐 ∙ (1 −𝐷𝑃)
= √2 ∙ 100 ∙ 250 ∙ 10
100 ∙ (1 −100200)
= 100 𝑢𝑛𝑖𝑡𝑠
The phase of painting will emit orders of production to mechanizing for 100 compressors. This means that 0.5 days of the production in mechanizing and a deadline of painting of 0.5 days + 0.5 days = 1 day. Therefore, in order to calculate the minimum number of Kanbans, we need to define different concepts: -Demand in the delivery time (Ddt) -Daily medium demand (Dm) -Deadline (d) -Security Stock (SS) -Capacity of container (CC)
𝐷𝑑𝑡 = 𝐷𝑚 ∙ 𝑑 = 100 𝑢𝑛𝑖𝑡𝑠
𝑑𝑎𝑦∙ 1𝑑𝑎𝑦 = 100 𝑢𝑛𝑖𝑡𝑠
𝑆𝑆 = 0,5 𝑑𝑎𝑦𝑠 𝑜𝑓 𝑑𝑒𝑚𝑎𝑛𝑑 ∙ 100𝑢𝑛𝑖𝑡𝑠
𝑑𝑎𝑦= 50 𝑢𝑛𝑖𝑡𝑠
𝐶𝐶 = 50 𝑢𝑛𝑖𝑡𝑠
Now we calculate the minimum number of Kanban:
𝑀𝑖𝑛𝑖𝑚𝑢𝑛 𝑛𝑢𝑚𝑏𝑒𝑟 𝑜𝑓 𝐾𝑎𝑛𝑏𝑎𝑛𝑠 = 𝐷𝑑𝑡 + 𝑆𝑆
𝐶𝐶
𝐾𝑎𝑛𝑏𝑎𝑛𝑠 = 100 + 50
50= 3 𝑘𝑎𝑛𝑏𝑎𝑛𝑠
Other ways to calculate the minimum number of Kanbans is:
𝑀𝑖𝑛𝑖𝑚𝑢𝑛 𝑛𝑢𝑚𝑏𝑒𝑟 𝑜𝑓 𝐾𝑎𝑛𝑏𝑎𝑛𝑠 = 𝐷𝑚 ∙ 𝑑 ∙ (1 + 𝑆𝐶)
𝐶𝐶
𝑘𝑎𝑛𝑏𝑎𝑛s = 100 ∙ 1 ∙ (1 + 50)
50= 3 𝑘𝑎𝑛𝑏𝑎𝑛𝑠
SC= security coefficient = 50% (0.5 days of demand over 1 day of deadline)

29
4 ADJUSTMENT AND IMPROVEMENT OF THE PRODUCTION SYSTEM
To be able to implement the methods of work Heijunka production levelling and system of execution and control KANBAN, mentioned in Chapter 3, the following techniques, which will be explained in this Chapter 4, should be implemented.
4.1 Reduction of setup time (SMED)
SMED (Single Minute Exchange of Dies) is a tool used to reduce the time of changing equipment (setup of the equipment), but it can also be used to improve any operation. It can be considered as a continuous improvement method. This leads to having less equipment down time, lower stock levels and smoother start-ups that enable the implementation of Heijunka. In addition, it is possible to make more frequent product change due to having fast changeovers, lower stock levels and smoother start-ups that enable the implementation of Heijunka. (Lean Production, 2017).
4.1.1 Set-up time
The set-up time is the time needed to go from the fabrication of one piece to another. It is, the period since the last piece of one-lot exits until the first correct piece of the next lot is made. To minimize the time it takes to complete equipment changeovers, it is compulsory to delete or decrease the costs and time of preparation. Besides, the set-up activities are a waste. (Galindo, 2014).
4.1.2 Procedure
The main sources used are: (Manufactura Inteligente, 2016) (Lean Solutions, 2016) (Wikipedia, Single- Minute Exchange of Die, 2016).
Evaluation of the current situation and defining objectives. The first step in every project of improvement is to define the objective to be achieved. Every step that is made is focused on their achievement. The objective can be minimize the change time, increase the availability of the machines, reduce the waste of material in the adjustments and improve the security. Then, the objective must be quantified.
Selection and job training of the workers. Once the objectives are defined and the initial situation is known, a selection and formation of the team that is going to take part in the project has to be made. Usually, the work team includes people who know very well the process of fabrication. Nevertheless, it is necessary to give
30
formation about SMED methodology, maintenance and working of the machines, teamwork, basic quality tools…
Documentation of the current procedure. In order to make easier the fact of analysing the change, the current situation must be documented. Traditionally, a specialist identifies and times each work, taking notes about the necessary details. An alternative is to record the preparation on a video, what has advantages such as being able to visualize each operation repetitively, collect different opinions, objectify the facts and this alternative can also be used to train the personnel and it is also useful to analyse the deviations of the time of change.
Analysis and improvement. First, the operations must be classified into internal and external. -Internal operations: they have to be done with the machine stopped (cleaning the machine…) -External operations: They can be done while the machine is working (cleaning tools…) Then, the internal operations have to be converted into external, in order to perform the complete operation or a part of it while the machine is working (standardizing heights, connections, fastening elements…). Finally, all of the operations must be improved by minimizing the set up time, standardizing set up operations, adopting systems of preparation in parallel and mechanizing some of the process of preparation.
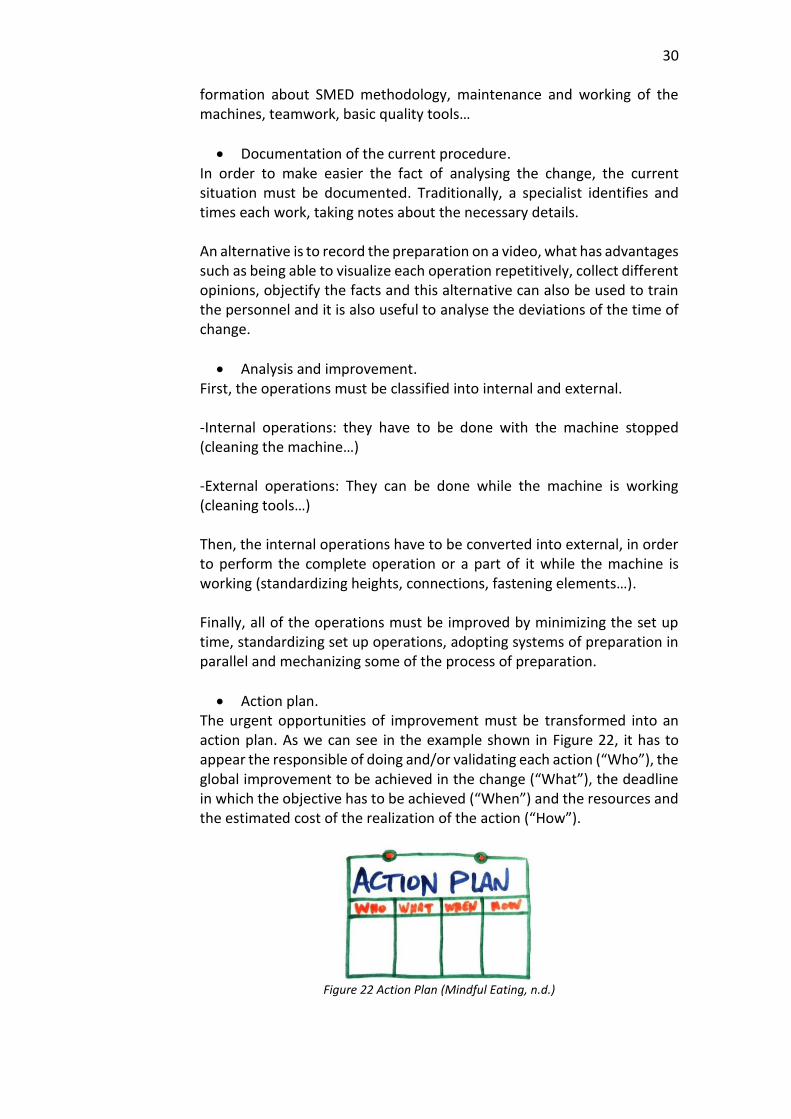
Action plan. The urgent opportunities of improvement must be transformed into an action plan. As we can see in the example shown in Figure 22, it has to appear the responsible of doing and/or validating each action (“Who”), the global improvement to be achieved in the change (“What”), the deadline in which the objective has to be achieved (“When”) and the resources and the estimated cost of the realization of the action (“How”).
Figure 22 Action Plan (Mindful Eating, n.d.)

31
Monitoring the change. Once the action plan has been approved, it has to be implemented and the result has to be checked. The change has to be achieved little by little actualizing it every time a new action is made so that the results will not be lost and it is possible to follow every activity up (Figure 23). The most frequent cause of failure in these projects is that the direction and the chain of command do not pay to it the necessary attention.
Figure 23 Monitoring the Change (AllAboutLean, 2014)
Maintenance of the change. In order to avoid the fact of the change being deteriorated with the pass of the time, workers have to respect the new instruction of preparation. The command must take care of the times of change so that they do not grow up without any justified cost, if this happens, the causes of that increase must be determined and it is necessary to take corrective actions in order to fix the mistakes. The auditor must check the evidence of the deviation in the system of the change of the tools and the direction must evaluate the efficiency of the new change. If it is necessary, it has to make new action plans. In addition, the direction must recognize the people implicated in the improvement.
4.2 Adaptation to demand through flexibility of workers (Shojinka)
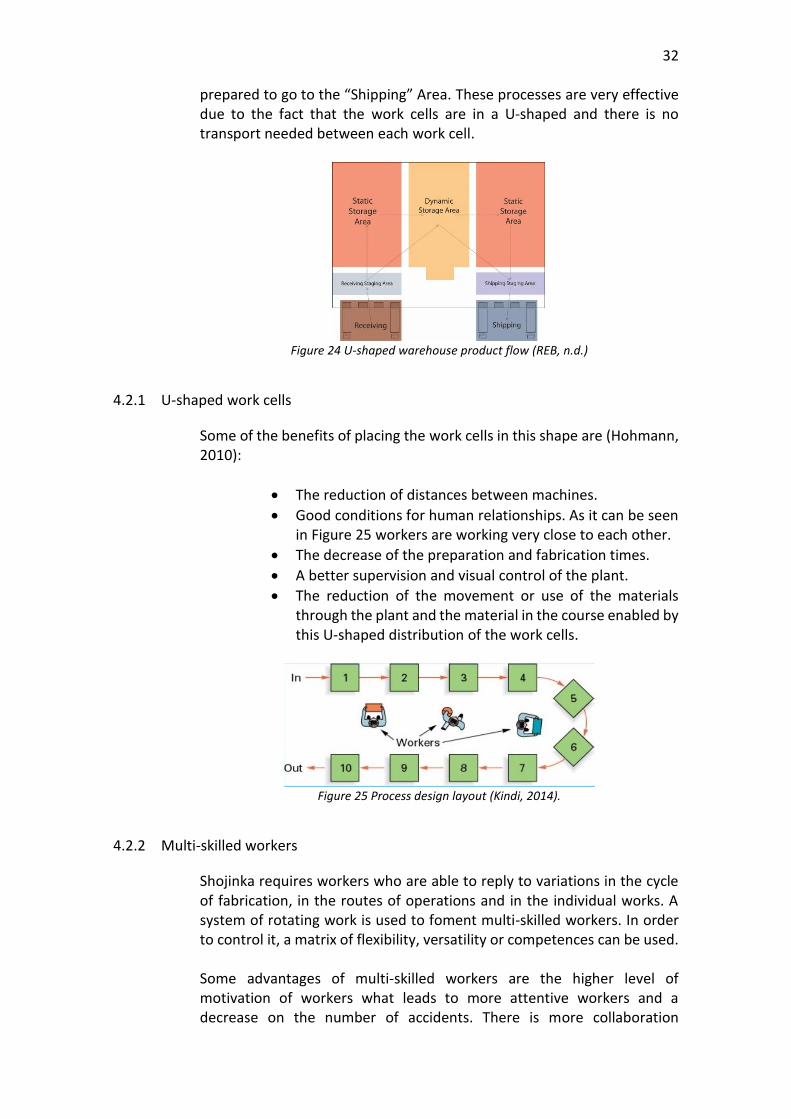
Shojinka means an alteration (increase or decrease) on the number of workers in a section when there is a change in the demand. To implement Shojinka there must be achieved an appropriate design of the layout, the best way of layout is placing U-shaped work cells because it is easier to increase or decrease the number of work to be made by each worker. Another condition to implement Shojinka is that the workers must be multi-skilled. (Simpler e- SENSEI, n.d.). An example of how the work cells can be distributed is shown in Figure 24, in which the pieces are received in the “Receiving” area. Afterwards they go to the “Receiving Staging Area” where the pieces get prepared. From there they can go directly to the “Dynamic Storage Area” or wait in the “Static Storage Area”. Finally, after all of that process, the pieces are
32
prepared to go to the “Shipping” Area. These processes are very effective due to the fact that the work cells are in a U-shaped and there is no transport needed between each work cell.
Figure 24 U-shaped warehouse product flow (REB, n.d.)
4.2.1 U-shaped work cells
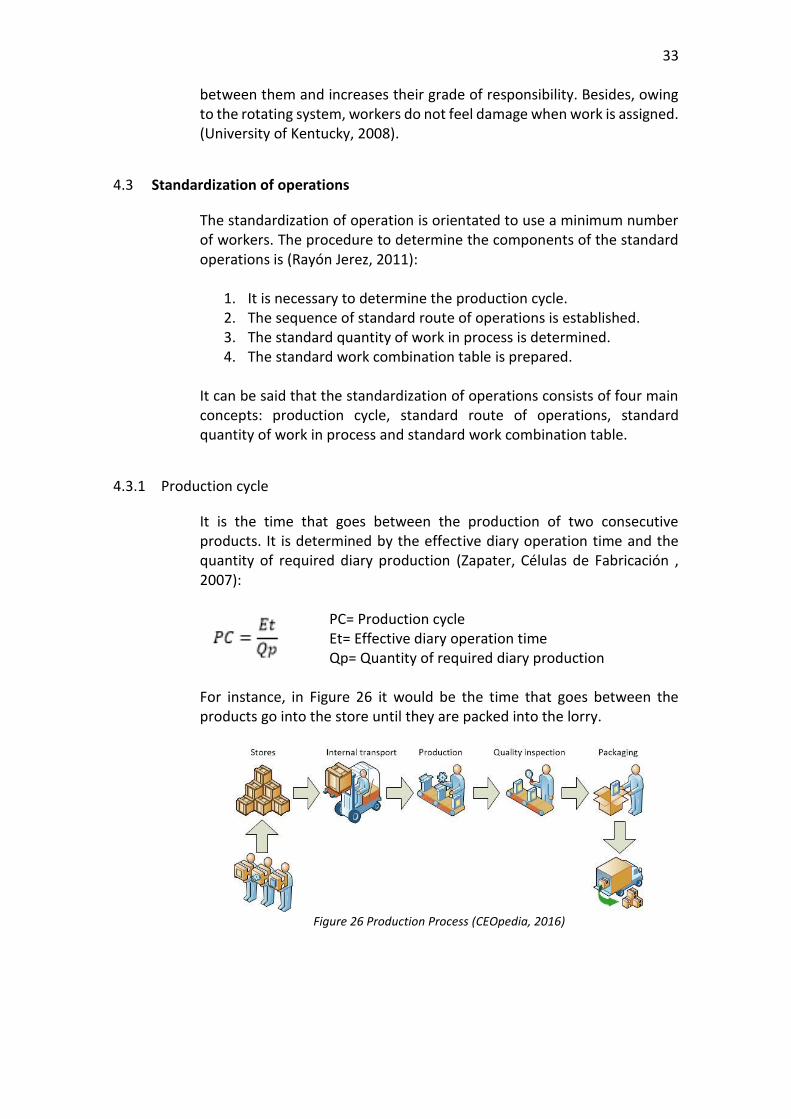
Some of the benefits of placing the work cells in this shape are (Hohmann, 2010):
The reduction of distances between machines.
Good conditions for human relationships. As it can be seen in Figure 25 workers are working very close to each other.
The decrease of the preparation and fabrication times.
A better supervision and visual control of the plant.
The reduction of the movement or use of the materials through the plant and the material in the course enabled by this U-shaped distribution of the work cells.
Figure 25 Process design layout (Kindi, 2014).
4.2.2 Multi-skilled workers
Shojinka requires workers who are able to reply to variations in the cycle of fabrication, in the routes of operations and in the individual works. A system of rotating work is used to foment multi-skilled workers. In order to control it, a matrix of flexibility, versatility or competences can be used. Some advantages of multi-skilled workers are the higher level of motivation of workers what leads to more attentive workers and a decrease on the number of accidents. There is more collaboration
33
between them and increases their grade of responsibility. Besides, owing to the rotating system, workers do not feel damage when work is assigned. (University of Kentucky, 2008).
4.3 Standardization of operations
The standardization of operation is orientated to use a minimum number of workers. The procedure to determine the components of the standard operations is (Rayón Jerez, 2011):
1. It is necessary to determine the production cycle. 2. The sequence of standard route of operations is established. 3. The standard quantity of work in process is determined. 4. The standard work combination table is prepared.
It can be said that the standardization of operations consists of four main concepts: production cycle, standard route of operations, standard quantity of work in process and standard work combination table.
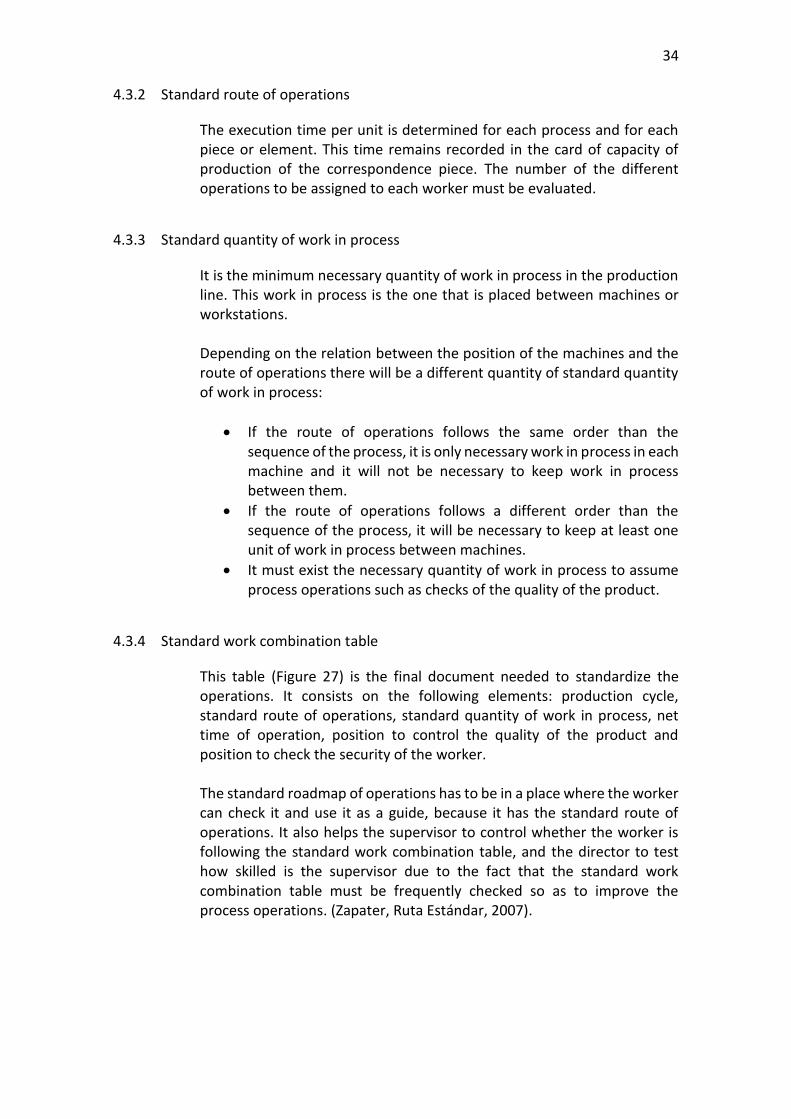
4.3.1 Production cycle
It is the time that goes between the production of two consecutive products. It is determined by the effective diary operation time and the quantity of required diary production (Zapater, Células de Fabricación , 2007):
PC= Production cycle Et= Effective diary operation time Qp= Quantity of required diary production
For instance, in Figure 26 it would be the time that goes between the products go into the store until they are packed into the lorry.
Figure 26 Production Process (CEOpedia, 2016)
34
4.3.2 Standard route of operations
The execution time per unit is determined for each process and for each piece or element. This time remains recorded in the card of capacity of production of the correspondence piece. The number of the different operations to be assigned to each worker must be evaluated.
4.3.3 Standard quantity of work in process
It is the minimum necessary quantity of work in process in the production line. This work in process is the one that is placed between machines or workstations. Depending on the relation between the position of the machines and the route of operations there will be a different quantity of standard quantity of work in process:
If the route of operations follows the same order than the sequence of the process, it is only necessary work in process in each machine and it will not be necessary to keep work in process between them.
If the route of operations follows a different order than the sequence of the process, it will be necessary to keep at least one unit of work in process between machines.
It must exist the necessary quantity of work in process to assume process operations such as checks of the quality of the product.
4.3.4 Standard work combination table
This table (Figure 27) is the final document needed to standardize the operations. It consists on the following elements: production cycle, standard route of operations, standard quantity of work in process, net time of operation, position to control the quality of the product and position to check the security of the worker. The standard roadmap of operations has to be in a place where the worker can check it and use it as a guide, because it has the standard route of operations. It also helps the supervisor to control whether the worker is following the standard work combination table, and the director to test how skilled is the supervisor due to the fact that the standard work combination table must be frequently checked so as to improve the process operations. (Zapater, Ruta Estándar, 2007).

35
Figure 27 Standard work combination table (Zapater, Ruta Estándar, 2007)
4.4 Intelligent automation of faults (Jidoka)
Some of the traditional techniques used to detect errors were:
- Spot Check: Estimate the quality of a lot which has already been made by studying a sample of it.
- Statistical Process Control: In situ periodical inspection of a small sample to detect deviations in the process.
- 100% Control: Inspection of all of the units produced to delete the once defective ones.
Table 12 Traditional techniques to detect errors
In order to reduce the time lag between the production of the error and its detection another traditional technique is auto control (control done by the workers in the machines). However, this does not guarantee zero default and these activities do not provide the product with any value. To solve all of these deficiencies Jidoka is the new technique used. (Science Direct, 2016).
Technique Deficiencies
It does not guarantee zero default
Spot Check The default is not detected at the time
It does not provide the product with any value
Statistical It does not guarantee zero default
Process The default may not be detected at the time and it depends on the frequency of the control
Control It does not provide the product with any value
It cannot be applied to every characteristic. of the product
100% Control The default is not detected at the time
It is very expensive and does not provide the product with any value

36
4.4.1 Concept of Jidoka
It is better to produce quality than having to control it. Jidoka is a Japanese word that in JIT philosophy means “automation with a human touch”. It consists on incorporating quality control to the process, in a way that the quality is produced and not controlled. If any anomaly exists, the process will be stopped avoiding the failure parts to continue. (Olofsson, 2016).
4.4.2 Elements of Jidoka
Line stop: Sensor, devices are installed to detect problems and to stop lines. Workers (Figure 28) have the right and the requirement to stop the production line or to activate the alarm systems when an abnormality appears, so that they can ask for help to solve the problem. (Lean Manufacturing Tools, n.d.).
Figure 28 Line stop (ROI, 2012)
ANDON systems: The word ANDON means rope in Japanese language and it refers to a rope that allows the worker to activate the alarm system. This system has visual and audible signals that enable to identify the source of the problem and its kind, using these signals make the operators being aware of the problem. One example of these signals are colour codes. (Malaysia Automotive Institute, 2015).
Figure 29 ANDON systems (BeyondLean, n.d.)
If a worker appreciates any abnormality in the line production, he has to activate the alarm system by pulling the rope down, so that a person responsible can fix the error (Figure 29).

37
POKA-YOKE system: This word is an expression that means error proofing. It is a quality technique applied in order to avoid errors in the production operations. The engineer Shigeo Shingo (Toyota) introduced this idea in the decade of 60’s. He proposed two alternatives: the first one is prevention, this means that error is prevented. One example of this alternative are the USB. The second alternative is detection; the error must be highlight when being produced. (Malaysia Automotive Institute, 2015). As we can see in Figure 30, because POKA-YOKE system has been used, the worker cannot make a mistake by introducing the cable in a wrong plug.
Figure 30 Poka-Yoke (Pinterest-The world´s catalog of ideas, n.d.)
Problem solving: The origin of the problem must be identified and solved so that it will never occur again. The most used method is 5W (What, Why, Where, When, Who?). A permanent solution might be POKA-YOKE systems. (Lean Manufacturing Tools, n.d.).
4.4.3 Auto Quality Matrix (AQM)
It is an analytic tool used to measure the frequency and the place where defaults are generated and detected. It allows checking the degree of autonomic control of defaults. The rows and columns represent each one of the productive process periods. The rows show the period in which the default has been detected and the columns show the period in which the default has been originated. This matrix, shown in Figure 31, also includes two columns destined to suppliers (one for internal suppliers and other for external) and two rows for the final customers (one for internal and other for external). (Effic, 2017).

38
Figure 31 Auto Quality Matrix (Villafuerte, 2012)
4.5 Fountain of ideas (Soikufu)
It is necessary to improve the production process in order to achieve the ‘five zeros’. This improvement can be achieved in two different ways. The first one is to improve the automation by introducing it in the manual operations and the second way is by improving the manual operations. The best way to do the improvements is to begin with the manual operations because they do not stop the process functioning, they are less expensive and their changes are easily reversible. Workers motivation is important because they know better the manual operations and it is convenient to encourage them. In short, Soikufu is a program to achieve and collect ideas.
4.5.1 Elements of Soikufu
Suggestion system: It is a method to promote the participation of the workers in the continuous improvement of their work. Post-boxes must be placed in the workstations where the workers can place their ideas and suggestions related to the improvement of work. Then a group of experts will periodically evaluate the suggestions and it will promote the valid ones. Those people who came up with the idea will be rewarded monetary and honorific. Some of the advantages of the suggestions plan are that workers and staff will have a closer relationship and that will also improve their motivation. Suggestion boxes are used in the companies in order to make workers more interested on the improvements. Suggestion boxes improve the working efficiency and they can help to receive valuable insights from the workers. Sometimes this ideas help to the continuous improvement of the
39
enterprise. These suggestion boxes are also used to receive complaints, critiques and contributions from the workers and they help to know if there are problems to solve o measures to take in the company.
Quality control circles (QC-Circles): They are composed by 5 to 12 workers that treat aspects about quality, layout, maintenance, cost, security… with the objective of promoting improvements. Sometimes they are called productivity circles. The participation of workers is voluntary, the own group chooses the discussion topics and it forms the workers that are going to participate. The advantages of quality circles are fomenting groups of study, revitalizing individual capacities, better environment at work and improvement in the integration of workers. (Dumontis, 2016).
4.6 Total Productive Maintenance (TPM)
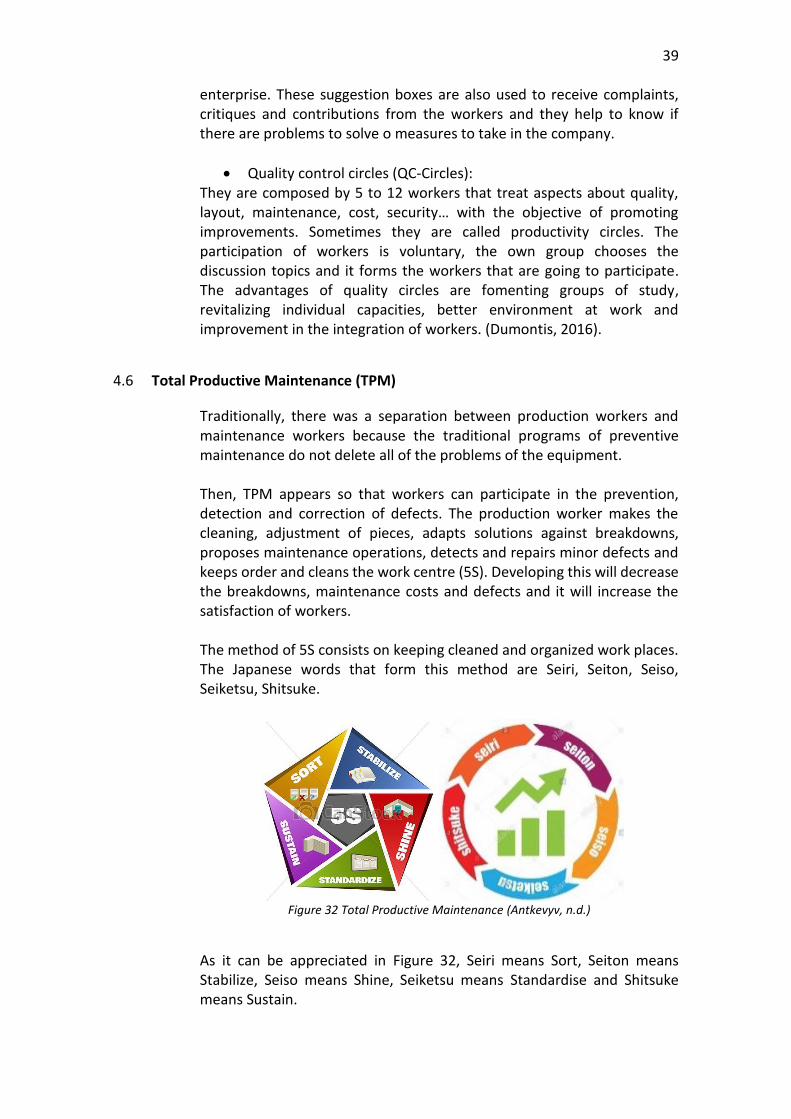
Traditionally, there was a separation between production workers and maintenance workers because the traditional programs of preventive maintenance do not delete all of the problems of the equipment. Then, TPM appears so that workers can participate in the prevention, detection and correction of defects. The production worker makes the cleaning, adjustment of pieces, adapts solutions against breakdowns, proposes maintenance operations, detects and repairs minor defects and keeps order and cleans the work centre (5S). Developing this will decrease the breakdowns, maintenance costs and defects and it will increase the satisfaction of workers. The method of 5S consists on keeping cleaned and organized work places. The Japanese words that form this method are Seiri, Seiton, Seiso, Seiketsu, Shitsuke.
Figure 32 Total Productive Maintenance (Antkevyv, n.d.)
As it can be appreciated in Figure 32, Seiri means Sort, Seiton means Stabilize, Seiso means Shine, Seiketsu means Standardise and Shitsuke means Sustain.

40
Some of the benefits of 5S are that products have more quality, shorter times of answer, an increase in the service life of machines, more organized workplaces, more security level, motivated workers and less defects. (Villa, 2013).
4.7 Relationship with suppliers
JIT needs important changes concerning the suppliers. Suppliers are considered as the initial part of the productive process. Deliveries must be frequent, in small quantities and with insured quality. Some of the characteristics concerning the suppliers are that there will be a low number of suppliers in order that each of them can achieve higher volume of production and take advantage of economy of scale. Because there are not many suppliers, they must be chosen carefully in order to avoid risks. Other important characteristic is the influence of the proximity of the suppliers, since the closer they are, the faster, frequent and small deliveries they do. It is also important to improve the relationship with suppliers by making long-term contracts with them, so that the suppliers can make inversion with more safety. Finally, it has to be an agreement between both parts to make deliveries frequent and secure, because it is necessary to work just in time.
5 IMPLEMENTATION OF LEAN MANUFACTURING
In general terms, it will follow different periods (Tony, 2014):
Previous period One part of the direction has to acquire a deep comprehension about Lean. It is necessary to do an exhaustive analysis of the relation between cost and benefit. In this period, the measures are proved in a pilot plant. An analysis of benefits and costs must be done in a pilot plant. If the benefits weight more than the costs, then the measures have to be applied. In the opposite case, the company has to think on different ways of improving.
Period 1: The education in JIT must be spread through all of the organizations and then start to apply concepts of Lean in the daily work. In this period, quality circles, 5S and suggestion plans are now implemented.
Period 2: First, SMED is applied and then the layout must be changed, followed by the implementation of TPM and Jidoka.
41
Period 3: In this period, we can start planning, programming and controlling the JIT by introducing the production levelling and systems of execution and control KANBAN so that stock gradually decrease.
Period 4: Finally, relationship with suppliers get stablished and long-term contracts can be signed.
6 PRACTICAL EXAMPLES OF LEAN MANUFACTURING IN DIFFERENT COMPANIES
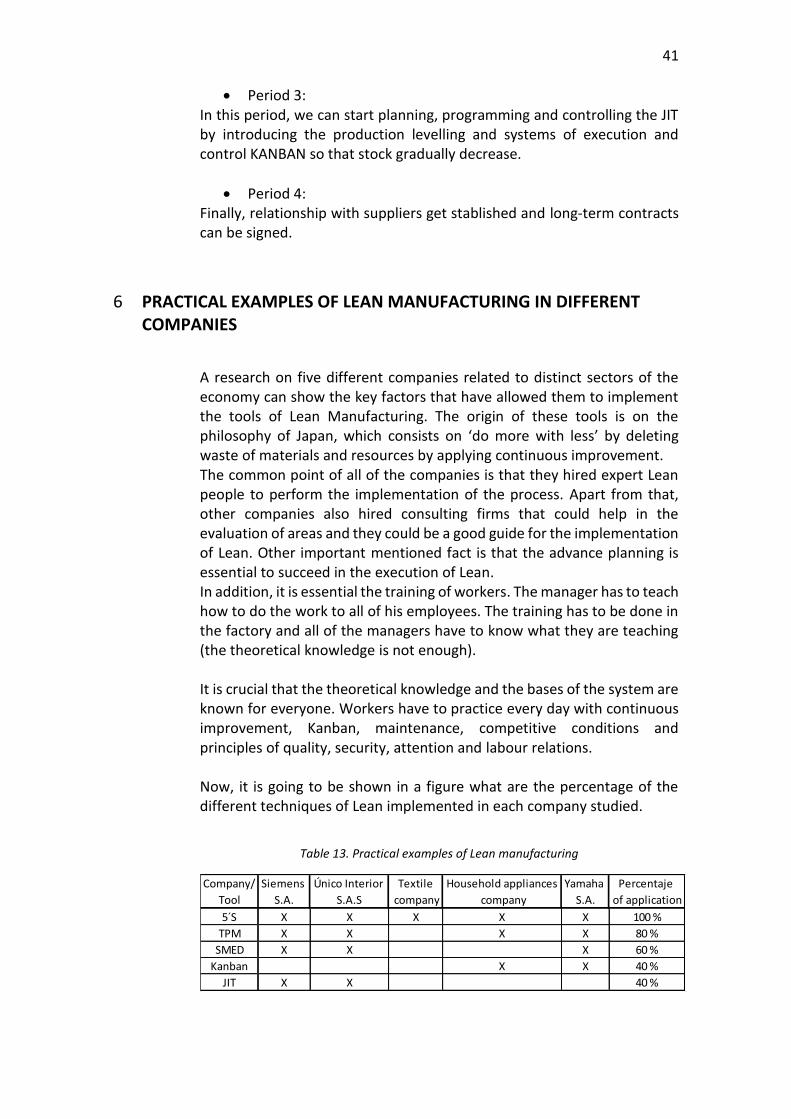
A research on five different companies related to distinct sectors of the economy can show the key factors that have allowed them to implement the tools of Lean Manufacturing. The origin of these tools is on the philosophy of Japan, which consists on ‘do more with less’ by deleting waste of materials and resources by applying continuous improvement. The common point of all of the companies is that they hired expert Lean people to perform the implementation of the process. Apart from that, other companies also hired consulting firms that could help in the evaluation of areas and they could be a good guide for the implementation of Lean. Other important mentioned fact is that the advance planning is essential to succeed in the execution of Lean. In addition, it is essential the training of workers. The manager has to teach how to do the work to all of his employees. The training has to be done in the factory and all of the managers have to know what they are teaching (the theoretical knowledge is not enough). It is crucial that the theoretical knowledge and the bases of the system are known for everyone. Workers have to practice every day with continuous improvement, Kanban, maintenance, competitive conditions and principles of quality, security, attention and labour relations. Now, it is going to be shown in a figure what are the percentage of the different techniques of Lean implemented in each company studied.
Table 13. Practical examples of Lean manufacturing
Company/ Siemens Único Interior Textile Household appliances Yamaha Percentaje
Tool S.A. S.A.S company company S.A. of application
5´S X X X X X 100 %
TPM X X X X 80 %
SMED X X X 60 %
Kanban X X 40 %
JIT X X 40 %

42
Companies also use other tools such as Poka-Yoke or Jidoka. (León Rincón, Marulanda, & González, n.d.).
7 APPLICATION OF LEAN MANUFACTURING AT HÄME UNIVERSITY OF APPLIED SCIENCES (HAMK)
Now that it has been introduced the concept of Lean Manufacturing, we are going to implement it in the laboratory of the Häme University of Applied Sciences (HAMK). First, we are going to start with the workshop that is at the left entrance to the laboratory. Then we will move to other different spaces in order to obtain the laboratory as tidy as possible. In our case, when talking about the laboratory, we will not refer to workers but students, which are the ones that are working in HAMK´s laboratory.
7.1 Concepts of waste and instabilities
Lean Manufacturing can be implemented in almost every environment, which involves a production line, a laboratory or even a small garage. It is just necessary to know where to implement each concept of Lean due to the fact, for instance, that in a laboratory there is no production line, so the wastes related to over-production are the greatest a problem.
Table 14 Type of waste and its probability of appearance
In the table above: - “X” means that this kind of waste can appear in the production line or in the laboratory and needs to be taken care about. - “XX” means that it really needs to be taken into account because is very important that it does not appear.

43
7.1.1 Waste, Mura
As it was explained before, a Mura appears every time the process is unbalanced because of an irregularity that appears in one part of it. In a laboratory is difficult to recognize one Mura. However, it is such an important problem that must be solved owing to the fact that it can delay the whole process. The Mura in a laboratory is related to the instruments and equipment use in tests and development. If one of the students working in one project is using one specific tool, and another student needs it at the same time, he will not have access to it. Solution: Although solving this problem can be challenging, some solutions can be implemented to at least reduce it. It is important to make clear the way this machines and tools must be used as is shown in Figure 33. Training students on how to use them will be necessary, in this way the time using the corresponding tool or machine will be decreased and the waste time waiting to be able to use it will be minimized for other people.
Figure 33 Robots (Mínguez Olivares and Ramos Martín)
7.1.2 Waste, Muri
A Muri appears when some kind of unnecessary activity is done. To recognize a Muri in a laboratory, this and the students must be analysed. However, in HAMK´s laboratory it cannot be said that there are any unreasonable efforts or noises that can affect student´s health.
Instructions
Instructions
Instructions

44
7.1.3 Waste, Muda: Over-Production
The Muda related to Over-Production has a huge impact in a production line. However, in a laboratory the necessities are not focused on producing scales of products, so Over-Production does not appear there.
7.1.4 Waste, Muda: Inventory
It is essential to maintain the order in the laboratory, in that way there will not be tools that are not being used and that can be deteriorated, what would mean a loss of money. Solution: There must be an inventory of the existences in the laboratory; one example of an inventory list can be the one in Figure 34.
Figure 34 Inventory List (Free List Templates, n.d.)
7.1.5 Waste, Muda: Waiting
As it was said before, when students are not taught on how to use the tools and machines in the laboratory, they have to take their time discovering the way to use them properly. If more than one student needs one same tool or machine, then they will have to wait, and that will delay their delivery date. Solution: To avoid this waits that lead on delays it is necessary to teach students how to use properly the equipment in the laboratory. In that way they will not waste time figuring out the use of them and will give them to the other student that is waiting to use it sooner. It is also important to make clear where the tools must be placed. One way to make this clear is either using a box where just the right tool fits in the right place (Figure 35 left side) or drawing the shape of the corresponding tool (Figure 35 right side), that way the tools will always be in the correct place and the students will not have to waste time looking for them.

45
Figure 35 Tools (Pinzon, 2012)
7.1.6 Waste, Muda: Transportation
If the laboratory is not well organized, when the students have to transport their projects from one machine to another, it will take them longer than if the machines were placed in a logical order or close one to each other. Solution: Placing the laboratory in a U-Shaped so that every machine is in a visible place and the students can clearly see where they are placed. Besides, the machines are close to each other and unnecessary movements of transportation there will not be necessary.
7.1.7 Waste, Muda: Excessive motions
It is necessary to try not to make unnecessary and uncomfortable movements, in that way the student will not be injured or tired because of making excessive motions that could be avoid. That is, the tools and the mechanisms of the machines have to be in an accessible place where they are easily reachable for the student. Solution: The most useful tools must be placed at eye-level so that the students can distinguish which one they need being able to reach it easily. To do so, the tools can be hanged up at the eye-level on a panel like the one in Figure 36. Same with the machines, which must be easily operable, with accessible mechanisms to grab.

46
Figure 36 Tools Panel (Belén, 2012)
7.1.8 Waste, Muda: Over- Processing
In a production line, a Muda related to over-processing plays an important role owing to the fact that processing unnecessary works means a waste of money and time. However, in the laboratory this does not appear seeing that there are not large-scale jobs and students process jobs themselves.
7.1.9 Waste, Muda: Rejects and repairs
If a student does not know how to use properly a machine or a tool, he will may break some mechanism that the machine has or the tool itself. Every time a machine or a tool is damage, it will be needed to be repaired, which can lead to delays in the delivery date. Solution: One way to avoid these incidents is by teaching students how to use adequately each machine or tool.
7.1.10 Waste, Muda: Competences and human talent
In a laboratory, and in every enterprise, factory or production line, it is very important to know how to manage the competences and human talent. That is the most difficult part of the whole process because it is necessary to choose the right work team and motivate it to make the most of it and the project itself. Solution: When creating the work team the qualities of students must be tested to see the competences of each employer and take advantage of them. There can also be organized weekly meetings for students to share their opinions about what can be improve in the laboratory.

47
7.2 Total Productive Maintenance (TPM)
The workshop is a room of 37.5 m2 with many tools untidy, so our first goal is to design a way to organize all of the tools and have them tidy and easily viewable always. Another goal of this project is to apply the Total Productive Maintenance so that workers (in our case students) have to participate in the prevention and correction of defects. Workspace has to be cleaned and tidied by the students that use it. It has to be applied the method of 5S so that everyone can take advantage of it. By using the 5S, times of answer will be reduced, so the students will work with more efficiency, in organized workplaces and with more security level, so they will be more motivated. The first and the most important measure that has to be taken is to elaborate rules to be followed by students so that everyone can work in a safe and clean workplace. Before let students work in the laboratory, it is compulsory to make them read the rules so that they take consciousness about them in order to achieve a safe workplace.
Table 15 General Rules in the laboratory
Once everyone has read and understood the safety rules, they can enter to the laboratory.
Häme University of Applied Sciences (HAMK) is not following the method of 5S, so we have to make people take consciousness about the current problem in order to solve it. This problem is alarming not only about the mess at the laboratory but also about security. In Table 16, we are showing the five steps of 5S method that must be applied in order to obtain a workplace as good as we can.
General Rules in the laboratory
1 Eating, drinking and smoking are forbidden
2 Lab coats should be worn in the lab to protect you from contamination
3 Lab footwear should consist of normal closed shoes to protect all areas of the foot from possible puncture from sharp objects
4 If you have long hair or loose clothes, make sure it is lied back or confined
5 Keep the work area clear of all material except those needed for your work
6 Students are responsible for the proper disposal of used material if any in appropiate containers
7 Equipment Failure- If a piece of equipment fails while being used, report it inmediately a technician
8 Clean up your work area before leaving
9 Wash hands before leaving the lab and before eating

48
Table 16 Application of the 5S method
In the table below it can be seen a comparison between the importance of the five different steps of the 5S method in a production line and in the laboratory. In many of them, the importance of applying them is the same in a company than in the laboratory, but in other cases, it is more important in the company, because the production is much huger, so the changes are more appreciated.
Table 17 5S and its probability of appearance
7.2.1 Sort (Seiri)
The first step to apply is Sort, what means that it is necessary to separate unnecessary things, in order to avoid useless workplace. For example, at the laboratory of the university, there are a lot of pieces and parts of different machines that are not being used as we can see in Figure 37. Therefore, the first thing to apply in the 5S method has to be throwing away useless materials, pieces, empty bottles and other kind of things. By doing this first step, we will obtain a laboratory less messy so that the second step of the 5S method will be easier to apply.
We can also apply this first step of the 5S method to the pieces of soldering iron, because each soldering iron only needs one piece of it and the rest can be removed or we can keep them in another place in case that one breaks of gets lost.
Other example of the application of the first step of 5S is shown also in Figure 37, where it can be seen different empty plastic bags and other useless things that have to be thrown away.
English Japanese
Sort Seiri Separate unnecessary Delete useless workplace
Stabilize Seiton Place necessary Organize workplace in an efficient way
Shine Seiso Delete dirt Improve the cleaning level
Prevent the aparition of dirt and disorder
Establish rules and procedures
Sustain Shitsuke Keep improving Foment efforts in order to keep improving
DenominationConcept Objective
Standardize Seiketsu Mark defects
Sort
Stabilize
Shine
Standardize
Sustain X X
XX XX
X X
XX X
Implementation in Implementation
a production line in laboratory
XX XX
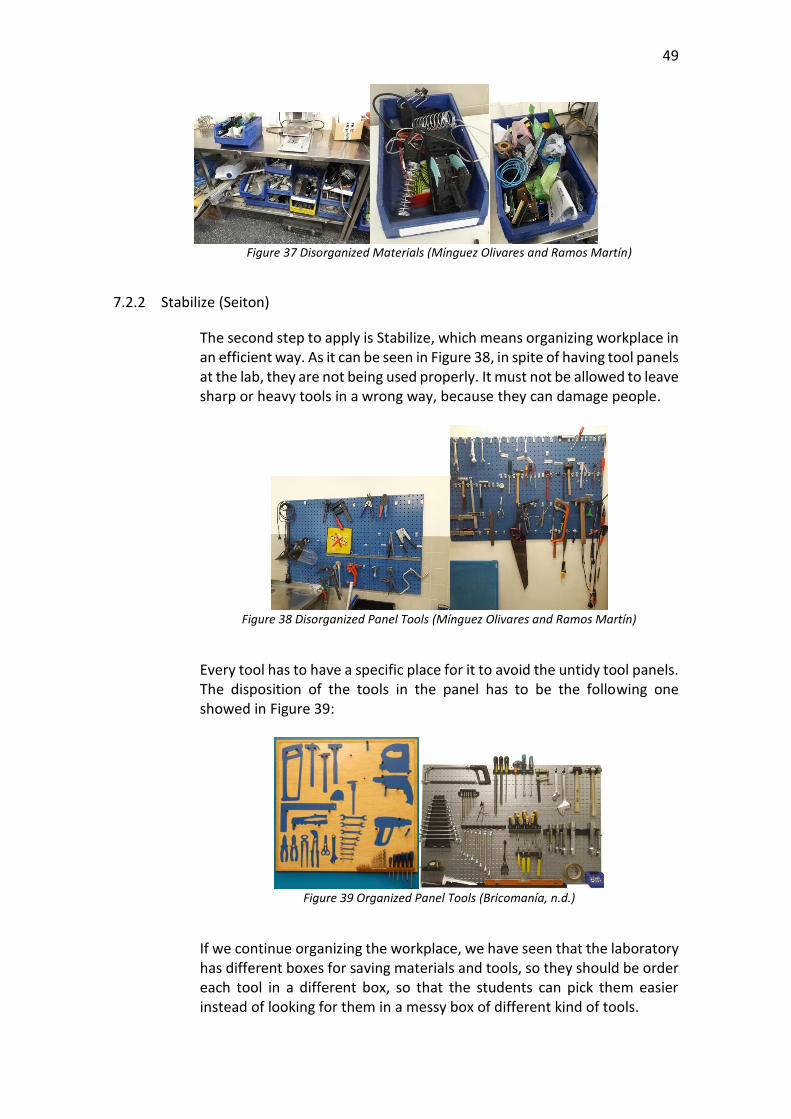
49
Figure 37 Disorganized Materials (Mínguez Olivares and Ramos Martín)
7.2.2 Stabilize (Seiton)
The second step to apply is Stabilize, which means organizing workplace in an efficient way. As it can be seen in Figure 38, in spite of having tool panels at the lab, they are not being used properly. It must not be allowed to leave sharp or heavy tools in a wrong way, because they can damage people.
Figure 38 Disorganized Panel Tools (Mínguez Olivares and Ramos Martín)
Every tool has to have a specific place for it to avoid the untidy tool panels. The disposition of the tools in the panel has to be the following one showed in Figure 39:
Figure 39 Organized Panel Tools (Bricomanía, n.d.)
If we continue organizing the workplace, we have seen that the laboratory has different boxes for saving materials and tools, so they should be order each tool in a different box, so that the students can pick them easier instead of looking for them in a messy box of different kind of tools.

50
Figure 40 Boxes (Mínguez Olivares and Ramos Martín)
7.2.3 Shine (Seiso)
The third step to apply is Shine, which means delete dirt. Once we have the laboratory with only the useful things and all of them are in the correct order, it is necessary to clean the lab so that people can feel more comfortable and they will work in better conditions. We can also improve the cleaning level at the laboratory by organizing better different pieces. For example, in left side of Figure 43 they are pieces of different sizes so the best way to organize them would be to separate each size on one different box, so that it would be easier to pick the correct piece. Other example of Shine is the one shown in the right side of Figure 43, where we can see that the laboratory has appropriate boxes to keep the tools, but the students are not using them properly, because some pieces are not in their correspondent hole.
Figure 41 Tool Box (Mínguez Olivares and Ramos Martín)

51
7.2.4 Standardize (Seiketsu)
This step of the 5S method consists on the prevention of the apparition of disorder and dirt. In order to achieve this step, rules must be established. For example, as it can be appreciated in the left side of Figure 43, one possible way of prevention of dirt and mess can be put stickers on each drawer with the names and a picture of each piece, so that they would be recognize better, avoiding the disorder. The result of using stickers could be the following one, shown in the right side of Figure 41
Figure 42 Drawers (Mínguez Olivares and Ramos Martín)
7.2.5 Sustain (Shitsuke)
The last step of the 5S method consists on improving the level of cleaning in the lab, by making students consciousness. As it can be seen in Figure 42, the laboratory has already shelving but they are untidy, so the last step could consist on cleaning them and reorganizing every tool that is on the shelving.
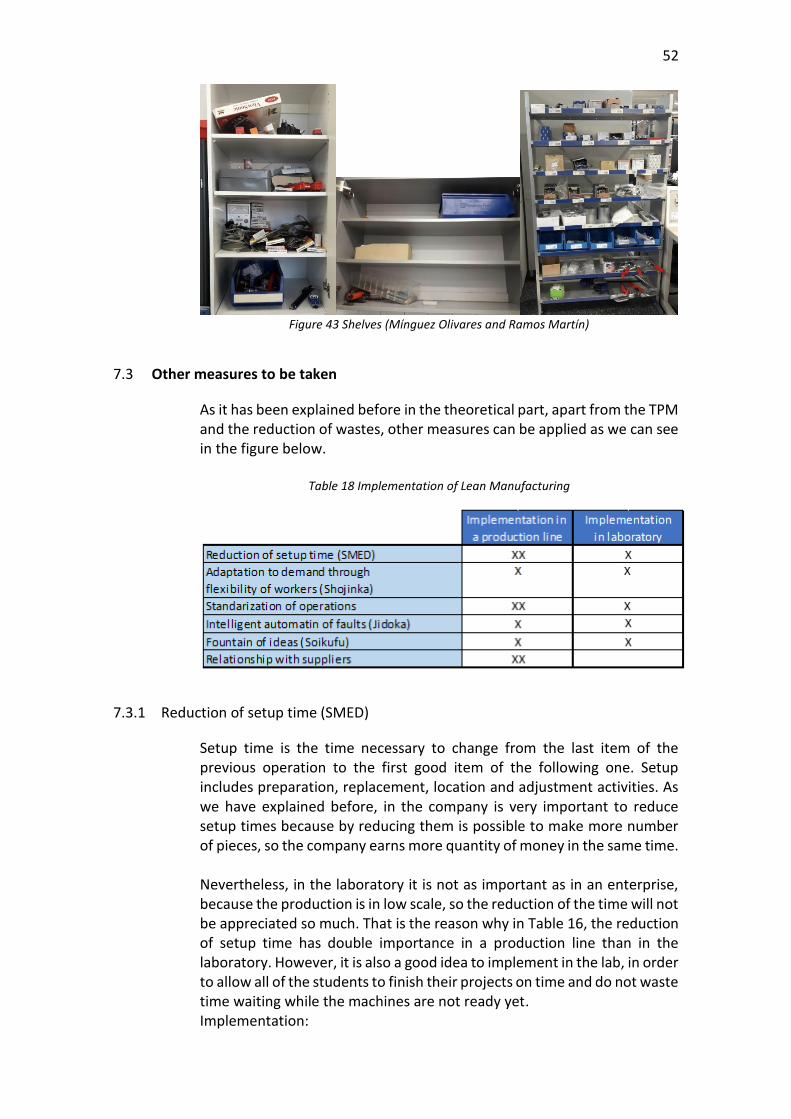
52
Figure 43 Shelves (Mínguez Olivares and Ramos Martín)
7.3 Other measures to be taken
As it has been explained before in the theoretical part, apart from the TPM and the reduction of wastes, other measures can be applied as we can see in the figure below.
Table 18 Implementation of Lean Manufacturing
7.3.1 Reduction of setup time (SMED)
Setup time is the time necessary to change from the last item of the previous operation to the first good item of the following one. Setup includes preparation, replacement, location and adjustment activities. As we have explained before, in the company is very important to reduce setup times because by reducing them is possible to make more number of pieces, so the company earns more quantity of money in the same time. Nevertheless, in the laboratory it is not as important as in an enterprise, because the production is in low scale, so the reduction of the time will not be appreciated so much. That is the reason why in Table 16, the reduction of setup time has double importance in a production line than in the laboratory. However, it is also a good idea to implement in the lab, in order to allow all of the students to finish their projects on time and do not waste time waiting while the machines are not ready yet. Implementation:
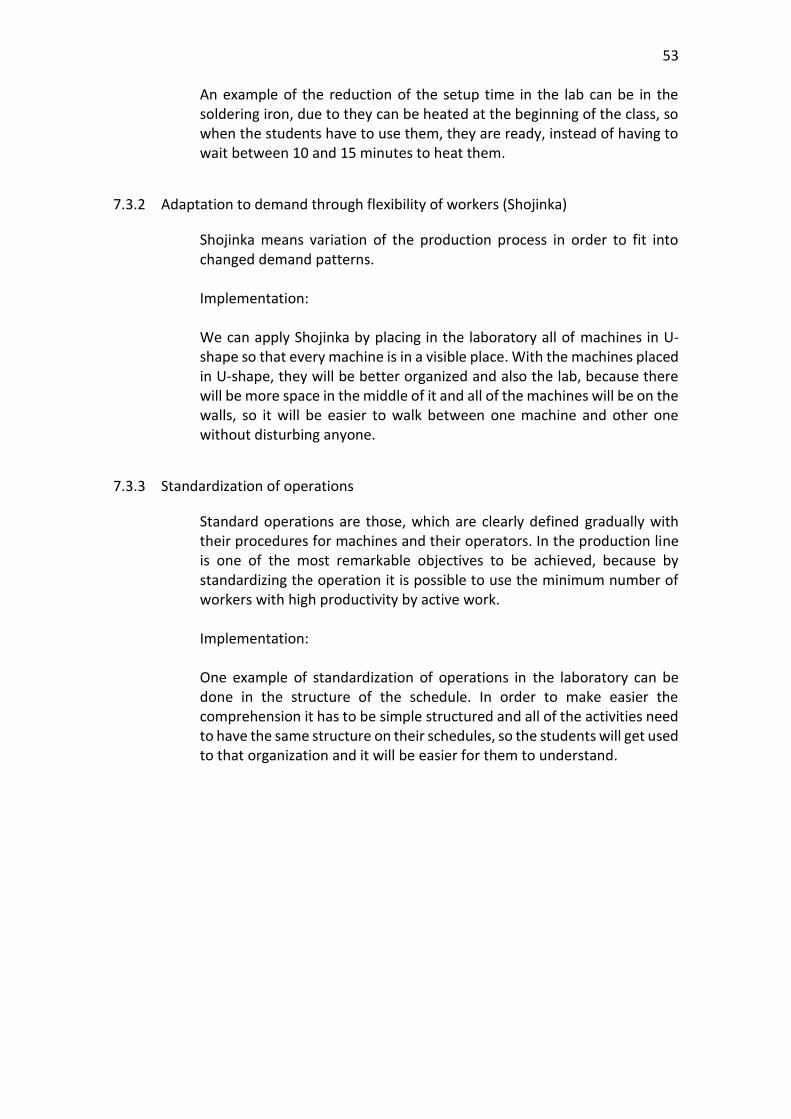
53
An example of the reduction of the setup time in the lab can be in the soldering iron, due to they can be heated at the beginning of the class, so when the students have to use them, they are ready, instead of having to wait between 10 and 15 minutes to heat them.
7.3.2 Adaptation to demand through flexibility of workers (Shojinka)
Shojinka means variation of the production process in order to fit into changed demand patterns. Implementation: We can apply Shojinka by placing in the laboratory all of machines in U-shape so that every machine is in a visible place. With the machines placed in U-shape, they will be better organized and also the lab, because there will be more space in the middle of it and all of the machines will be on the walls, so it will be easier to walk between one machine and other one without disturbing anyone.
7.3.3 Standardization of operations
Standard operations are those, which are clearly defined gradually with their procedures for machines and their operators. In the production line is one of the most remarkable objectives to be achieved, because by standardizing the operation it is possible to use the minimum number of workers with high productivity by active work. Implementation: One example of standardization of operations in the laboratory can be done in the structure of the schedule. In order to make easier the comprehension it has to be simple structured and all of the activities need to have the same structure on their schedules, so the students will get used to that organization and it will be easier for them to understand.
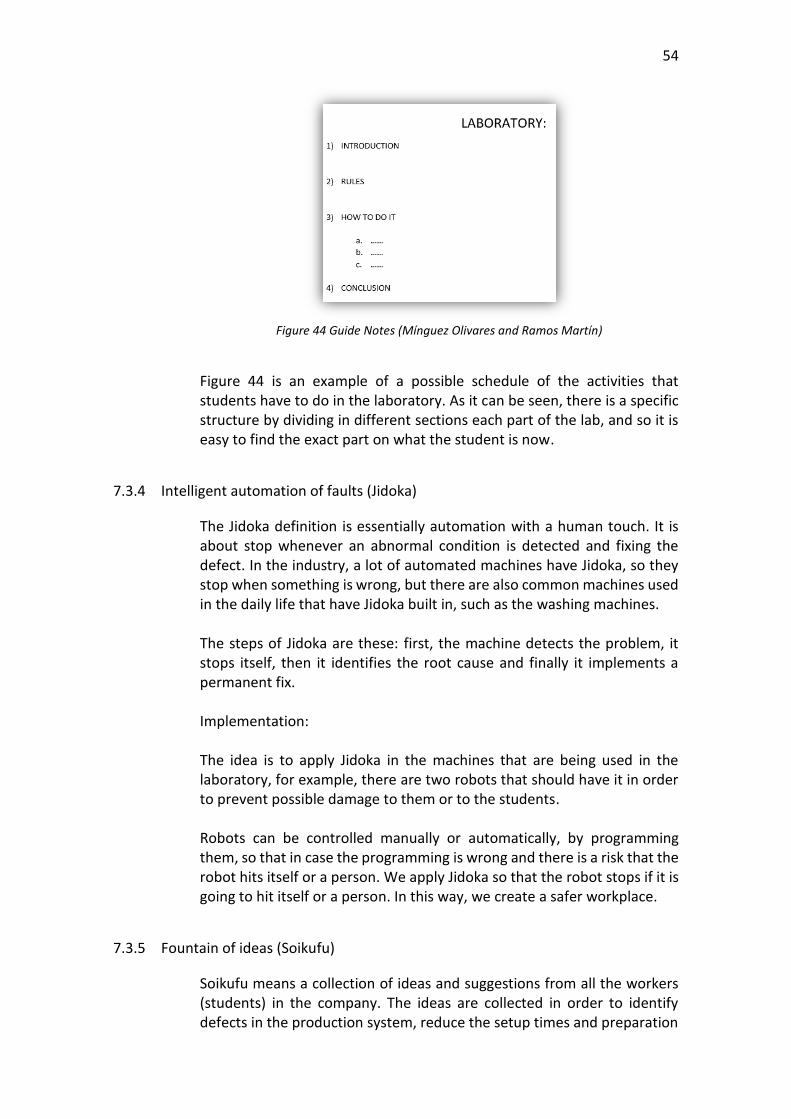
54
Figure 44 Guide Notes (Mínguez Olivares and Ramos Martín)
Figure 44 is an example of a possible schedule of the activities that students have to do in the laboratory. As it can be seen, there is a specific structure by dividing in different sections each part of the lab, and so it is easy to find the exact part on what the student is now.
7.3.4 Intelligent automation of faults (Jidoka)
The Jidoka definition is essentially automation with a human touch. It is about stop whenever an abnormal condition is detected and fixing the defect. In the industry, a lot of automated machines have Jidoka, so they stop when something is wrong, but there are also common machines used in the daily life that have Jidoka built in, such as the washing machines. The steps of Jidoka are these: first, the machine detects the problem, it stops itself, then it identifies the root cause and finally it implements a permanent fix. Implementation: The idea is to apply Jidoka in the machines that are being used in the laboratory, for example, there are two robots that should have it in order to prevent possible damage to them or to the students. Robots can be controlled manually or automatically, by programming them, so that in case the programming is wrong and there is a risk that the robot hits itself or a person. We apply Jidoka so that the robot stops if it is going to hit itself or a person. In this way, we create a safer workplace.
7.3.5 Fountain of ideas (Soikufu)
Soikufu means a collection of ideas and suggestions from all the workers (students) in the company. The ideas are collected in order to identify defects in the production system, reduce the setup times and preparation
55
times in the machines, development in the machines, improvement of the layout and the productivity and quality. Soikufu is helpful in companies and in the laboratory of the university, since it makes the students more motivated to suggest their ideas, so they become more participative in the activities that have to be done in the laboratory. In order to apply Soikufu in the laboratory, it is necessary to place a suggestion box in it, so that students can leave their ideas in it. Implementation: The way to use suggestion boxes is simple; students can leave either anonymous letters or with their names and it can be stablished that once a week the teacher has to collect all of the letters and read them during the weekend, so the following Monday he can tell the students about what they have written. In case of the letters of complaint, if students are right on what they are saying, the teacher has to change either something related with his way of teaching or other thing related with the reason of the complaint of the students. If the letters were of suggestion instead of complaint, the teacher has to evaluate if the suggestion is good enough to implement it and in that case, the student who came up with the idea has to be awarded with an increase on his mark because his idea is going to improve the way of doing properly the laboratory activity.
7.3.6 Relationship with suppliers
This last measure is only worth it in a company, because it has suppliers, but in the laboratory of the university, students do their projects for themselves, so it does not make sense to try any measure, because there are no suppliers in this case.
8 CONCLUSION
The main question this thesis answers is the advantages of applying the management model of Lean Manufacturing either in a company or in a different place, such as it has been proposed in the laboratory of Häme University of Applied Sciences (HAMK) in the practical part of our final thesis. In order to apply Lean Manufacturing, first, we focused on its origins and we explained factors that have an influence on it, so that readers of our final thesis can understand that it should be applied in every company or work environment to reduce every kind of waste and instability, such as Mura, Muri and Muda.

56
Lean Manufacturing has its origin in the 1950s in Japan, where the American products were a huge competence for the Japanese ones. This led Sakichi Toyoda to create a new system where defaults on the production line could be detected, so Japanese products became more economical than Occidental ones because they were made without defaults, seeing that they were corrected during the production line, saving money to the Japanese companies. Draw from the premise of Jidoka, Taiichi Ohno and Eiji Toyoda established the Toyota Production System (TPS). In the 1970s, Japanese products invaded the global market because they could compete in quality and low price with the Occidental products. The main objective of Lean Manufacturing is to achieve the theory of ‘Five Zeros’, to be able to serve customers what they want, at the moment they want it, in the quantity required with maximum quality products at a competitive price. To do that, it is necessary to work with a Just In Time (JIT) philosophy, which is based on two methods called Heijunka production levelling and system of execution and control KANBAN. In order to achieve the JIT philosophy, companies cannot change its way of working abruptly due to it would suppose chaos in the company because workers would not be prepared for that big change. This is the reason why companies need to apply measures gradually to adjust and improve the production system satisfactorily. These measures to be applied are reduction of the setup time (SMED), adaptation to demand with the flexibility of the workers (Shojinka), standardization of operations, intelligent automation of faults (Jidoka), fountain of ideas (Soikufu), Total Productive Maintenance (TPM) and relationship with suppliers. Lean Manufacturing management model can be applied in every work environment. In this case, it has been done an evaluation in HAMK’s laboratory and it has been concluded that the laboratory needs improvements on its operating mode. This is the reason why a deep analysis has been done to realize the existing defects in the laboratory and find solutions to solve each one of them. From now on, Häme University of Applied Sciences (HAMK) should start developing its working system by implementing these suggestions that have been proposed following this study as a guidebook for the implementation of Lean Manufacturing model in laboratories.

57
Bibliography AllAboutLean. (2014, February 23). Retrieved March 7, 2017, from
http://www.allaboutlean.com/smed-theory/ Antkevyv. (n.d.). Shutterstock. Retrieved March 7, 2017, from
https://www.shutterstock.com/image-vector/5s-manufacturing-improvement-tool-japanese-words-442539856
Belén. (2012, February 18). Guía de Bricolaje. Retrieved April 4, 2017, from http://guiadebricolaje.com/como-ordenar-nuestras-herramientas/
BeyondLean. (n.d.). Retrieved March 7, 2017, from http://www.beyondlean.com/andon.html
Bricomanía. (n.d.). Hogarmania. Retrieved March 29, 2017, from https://www.hogarmania.com/bricolaje/tareas/carpinteria/201008/panel-herramientas-4400.html
Business Dictionary. (2016, August 27). Retrieved March 7, 2017, from http://www.businessdictionary.com/definition/lean-manufacturing.html
Cabrera Calva, R. (2011, September 30). Kanban paso a paso. Retrieved February 16, 2017, from http://www.gestiopolis.com/kanban-paso-a-paso/
CEOpedia. (2016, February 2). Retrieved March 7, 2017, from https://ceopedia.org/index.php/File:Production_process.jpg
Chaturvedi, K. (2011, May 10). SlideShare. Retrieved March 7, 2017, from https://www.slideshare.net/kinshookc/inventory-control-8025119
Clyton, M. (2015, June 2). Management PocketBooks. Retrieved March 7, 2017, from https://managementpocketbooks.wordpress.com/2015/06/02/taiichi-ohno-lean-production/
Díaz, D. (2014, May 6). Educadictos. Retrieved March 7, 2017, from http://www.educadictos.com/gestion-de-la-calidad-iv-jidoka/
Dincbas, Simonis, & Hentenryck, V. (1988). SAS. Retrieved March 7, 2017, from http://support.sas.com/documentation/cdl/en/orcpug/63973/HTML/default/orcpug_clp_sect044.htm
Duggan, C. (2015, December 1). Kanban 101. Retrieved February 15, 2017, from http://www.flexoconcepts.com/corrugated/kanban-101-2/
Dumontis. (2016, February 22). Built in Quality. Retrieved February 22, 2017, from http://dumontis.com/expertise/built-in-quality/
Effic. (2017, January 11). Lean´s Auto Quality Matrix: why and how to use it. Retrieved February 22, 2017, from http://www.effic.be/en/auto-quality-matrix/
Free List Templates. (n.d.). Retrieved April 4, 2017, from www.listtemplatespro.com Galindo, A. (2014, December 3). SMED (Single- Minute Exchange of Dies). Retrieved
February 17, 2017, from https://es.slideshare.net/Antonio_Galindo/smed-42302754
González Cruz, H. (2015, October 23). Prezi. Retrieved May 5, 2017, from https://prezi.com/afeqocwupde4/caja-heijunka/
Hohmann. (2010, March 3). Benefits of U shaped workcells. Retrieved February 20, 2017, from from: http://chohmann.free.fr/lean/cell_u.htm
Kailean Consultores. (2015, December 3). El modelo 3M de Toyota. Retrieved February 13, 2017, from http://kailean.es/muda-mura-muri-toyota/
Kindi, A. (2014, December 23). SlideShare. Retrieved March 7, 2017, from https://www.slideshare.net/kindiiii/process-design-layout
58
Lean Enterprise Institute. (2003). Lean Lexicon (5th Edition ed.). Retrieved May 8, 2017, from https://www.lean.org/lexicon/heijunka
Lean Enterprise Institute. (2003). Lean Lexicon (5th Edition ed.). Retrieved May 8, 2017, from https://www.lean.org/lexicon/pitch
Lean Enterprise Institute. (2017, January 11). A Brief History of Lean. Retrieved February 14, 2017, from https://www.lean.org/WhatsLean/History.cfm
Lean Manufacturing Tools. (n.d.). Jidoka. Retrieved February 21, 2017, from http://leanmanufacturingtools.org/489/jidoka/
Lean Production. (2017, January 6). SMED( Single- Minute of Dies). Retrieved February 17, 2017, from http://www.leanproduction.com/smed.html
Lean Solutions. (2016, July 16). SMED (Single- Minute Exchange of Die). Retrieved February 20, 2017, from http://www.leansolutions.co/conceptos/smed/
Leanmanufacture.net. (2016, April 16). Kanban Containers. Retrieved February 16, 2017, from http://www.leanmanufacture.net/operations/kanbancontainers.aspx
Leanmanufacture.net. (2016, July 16). Two bin inventory management system. Retrieved February 16, 2017, from http://www.leanmanufacture.net/operations/twobininventory.aspx
Leanroots. (2016, August 13). Nivelado multiproducto (Heijunka Box). Retrieved February 14, 2017, from http://leanroots.com/heijunka.html
León Rincón, G. E., Marulanda, N., & González, H. (n.d.). Factores claves del éxito en la implementación de Lean Manufacturing en algunas emperesas con sede en Colombia. Retrieved February 23, 2017, from https://www.researchgate.net/publication/313814997_Factores_claves_de_exito_en_la_implementacion_de_Lean_Manufacturing_en_algunas_empresas_con_sede_en_Colombia
Liker, J. K. (2013). Las Claves del Éxito de TOYOTA. Retrieved February 14, 2017, from https://www.leadersummaries.com/resumen/las-claves-del-exito-de-toyota
M, S. (2012, August 24). Manufactura Esbelta / Lean Manufacturing Colombia. Retrieved May 9, 2017, from http://gioleanblog.blogspot.fi/2012/08/manufacturaesbelta.html
Malaysia Automotive Institute. (2015). Jidoka and why- why analysis. Retrieved February 21, 2017, from http://mai.org.my/v3/media/kunena/attachments/18723/JIDOKAMAISEMINARmaterial.pdf
Manufactura Inteligente. (2016, August 20). Implementar SMED Lean- Single Minute Exchange of Dies. Retrieved February 17, 2017, from http://www.manufacturainteligente.com/implementar-smed-lean-single-minute-exchange-of-dies/
Manufacturing solutions. (n.d.). Retrieved March 7, 2017, from http://www.manufactus.com/portfolio/examples-for-kanban-cards/?lang=en
Manufacturing solutions. (n.d.). Retrieved March 7, 2017, from http://www.kanban-system.com/es/sistema-kanban-y-control-de-inventario-pull/
Mindful Eating. (n.d.). Retrieved March 7, 2017, from http://www.mindfuleatingtips.com/action-plan-3/
mtm ingenieros. (2016, October 25). ¿Qué es el Tack Time? Retrieved February 14, 2017, from http://mtmingenieros.com/knowledge/que-es-takt-time/
59
Nidia Elena, M. (2013, April 6). Retrieved March 7, 2017, from http://www.eoi.es/blogs/madeon/2013/04/06/cero-inventario-pero-a-cualquier-precio/
Olofsson, O. (2016, December 15). SlideShare. Retrieved March 7, 2017, from https://www.slideshare.net/OskarOlofsson/smed-quick-change-over
Pinterest-The world´s catalog of ideas. (n.d.). Retrieved March 7, 2017, from https://www.pinterest.com/pin/295971006730986038/
Pinzon, F. (2012, May 27). Retrieved April 4, 2017, from https://www.youtube.com/watch?v=n_cdWtCybk8
Progressa Lean. (2017). Origen y Evolución del Lean Manufacturing. Retrieved February 13, 2017, from http://www.progressalean.com/origen-y-evolucion-del-lean-manufacturing/
Rayón Jerez, Á. (2011, December 15). Tema 12, JIT. Retrieved February 15, 2017, from https://es.slideshare.net/alrayon/ud-op-t12-jit
REB. (n.d.). Retrieved March 7, 2017, from http://rebstorage.com/blog/warehouse-product-flow-options/
Recorrer juntos el Gemba... (2014, February 13). Mura, Muri, Muda. La base del pensamiento esbelto. Retrieved February 13, 2017, from https://lahuja.wordpress.com/2014/02/16/mura-muri-muda-la-base-del-pensamiento-esbelto/
ROI. (2012). Retrieved March 7, 2017, from http://www.lean-fabrika.cz/ca/terminology/autonomation-jidoka-444745#.WLVZ_kdtzUk
Romero, Á. A. (2015, May 5). La herramienta kanban. Implementación y reglas. Retrieved February 17, 2017, from http://www.angelantonioromero.com/la-herramienta-kanban-implementacion-y-reglas/
Science Direct. (2016, April 6). A comparison of ´traditonal´methods of quality control assesemet with a method based on assessing acceptability of individual results. Retrieved February 21, 2017, from http://www.sciencedirect.com/science/article/pii/S0031302516398415
Sharrma, D. (2014, August 22). Linkedin. Retrieved March 7, 2017, from https://www.linkedin.com/pulse/20140822051531-14147448-toyota-production-system
Shmula. (2007, July 16). Heijunka – Leveling by Volume & Mix. Retrieved May 8, 2017, from http://www.shmula.com/heijunka-leveling-by-volume-mix/410/
Simpler e- SENSEI. (n.d.). Shojinka Definition. Retrieved February 20, 2017, from http://www.simplertraining.co.uk/shojinka-definition.html
SlideShare. (2016, November 13). Retrieved March 7, 2017, from https://www.slideshare.net/MarekPiatkowski/principles-of-kanban-november-2016
Solnon, C., Cung, V. D., Nguyen, A., & Artigues, C. (2005). The car sequencing problem: overview of state-of-the-art methods and industrial case-study of the ROADEF´2105 challenge problem. Retrieved February 15, 2017, from http://liris.cnrs.fr/csolnon/publications/ejor07a.pdf
Tony. (2014, November 12). Lean Challenge. Retrieved February 28, 2017, from http://www.iecieeechallenge.org/lean-manufacturing-implementation-the-first-5-steps/
Universidad Autónoma del Estado de Hidalgo. (2008, March). Herramientas y Técnicas Lean Manufacturing en Sistemas de Producción y Calidad. Retrieved February 14,
60
2017, from http://repository.uaeh.edu.mx/bitstream/bitstream/handle/123456789/10591/Herramientas%20y%20tecnicas.pdf?sequence=1
University of Kentucky. (2008). Toyota Production System (TPS) Terminology. Retrieved February 20, 2017, from https://www.lean.uky.edu/reference/terminology/
Wawak, S. (2016, April 26). Wikipedia. Retrieved March 7, 2017, from https://ceopedia.org/index.php/Heijunka
What is Six Sigma.net. (2016, April 30). Heijunka. Retrieved February 14, 2017, from http://www.whatissixsigma.net/heijunka/
What is SixSigma. (n.d.). Retrieved March 7, 2017, from http://www.whatissixsigma.net/toyota-production-system/
What is SixSigma. (n.d.). Retrieved March 7, 2017, from http://www.whatissixsigma.net/heijunka/
Wikipedia. (2005, November 27). Lean manufacturing. Retrieved May 9, 2017, from https://es.wikipedia.org/wiki/Lean_manufacturing#Origen
Wikipedia. (2016, December 14). Kanban. Retrieved February 16, 2017, from https://en.wikipedia.org/wiki/Kanban
Wikipedia. (2016, May 20). Single- Minute Exchange of Die. Retrieved February 20, 2017, from https://es.wikipedia.org/wiki/Single-Minute_Exchange_of_Die
Villa, D. (2013, November 20). Herramientas del Lean Manufacturing. Retrieved February 22, 2017, from http://leanmanufacturingunal.blogspot.fi/p/herramientas-del-lean-manufacturing.html
Villafuerte, J. (2012). Retrieved March 7, 2017, from http://jaimevillafuerte.blogspot.fi/2013/12/what-is-auto-quality-matrix.html
Yepes Piqueras, V. (2016, August 16). Kanban en ingeniería de la construcción. Retrieved February 15, 2017, from http://victoryepes.blogs.upv.es/2016/06/07/kanban-en-ingenieria-de-la-construccion/
Yepes Piqueras, V. (2016, June 7). Universitat Politècnica de València. Retrieved March 7, 2017, from http://victoryepes.blogs.upv.es/2016/06/07/kanban-en-ingenieria-de-la-construccion/
Zapater, E. (2007, May 19). Células de Fabricación . Retrieved May 11, 2017, from http://curso-jit.blogspot.fi/2007/06/ciclo-de-fabricacin.html
Zapater, E. (2007, May 18). Ruta Estándar. Retrieved February 21, 2017, from http://curso-jit.blogspot.fi/2007/06/ruta-estndar.html
Zargary, J. (n.d.). Slide Theme. Retrieved March 7, 2017, from http://zargary.ir/post/87