lean manufacturing for management consultants and business analysts
TRANSCRIPT
1
Essential Lean Manufacturing for Management Consultants
Practical guide with cases and exercises
2
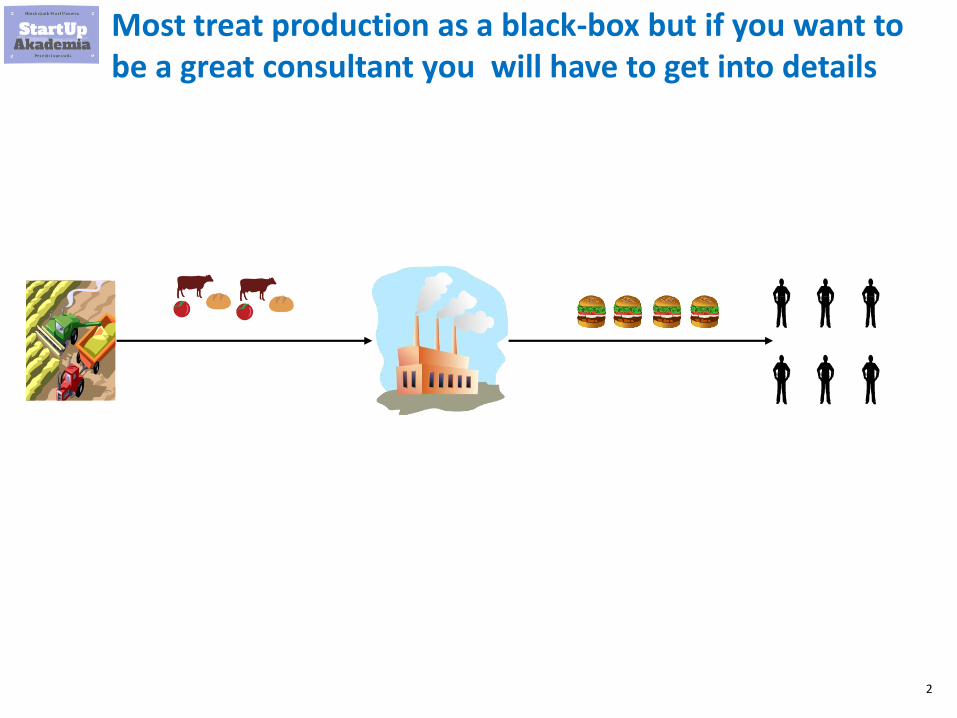
Most treat production as a black-box but if you want to be a great consultant you will have to get into details
3
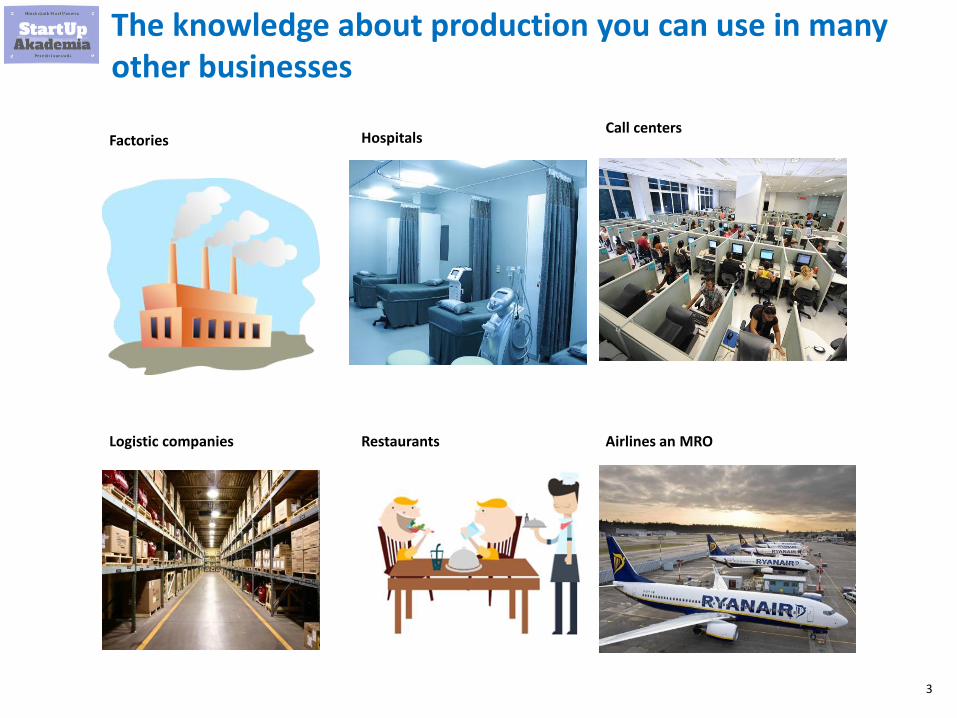
The knowledge about production you can use in many other businesses
Factories HospitalsCall centers
Airlines an MRORestaurantsLogistic companies
4
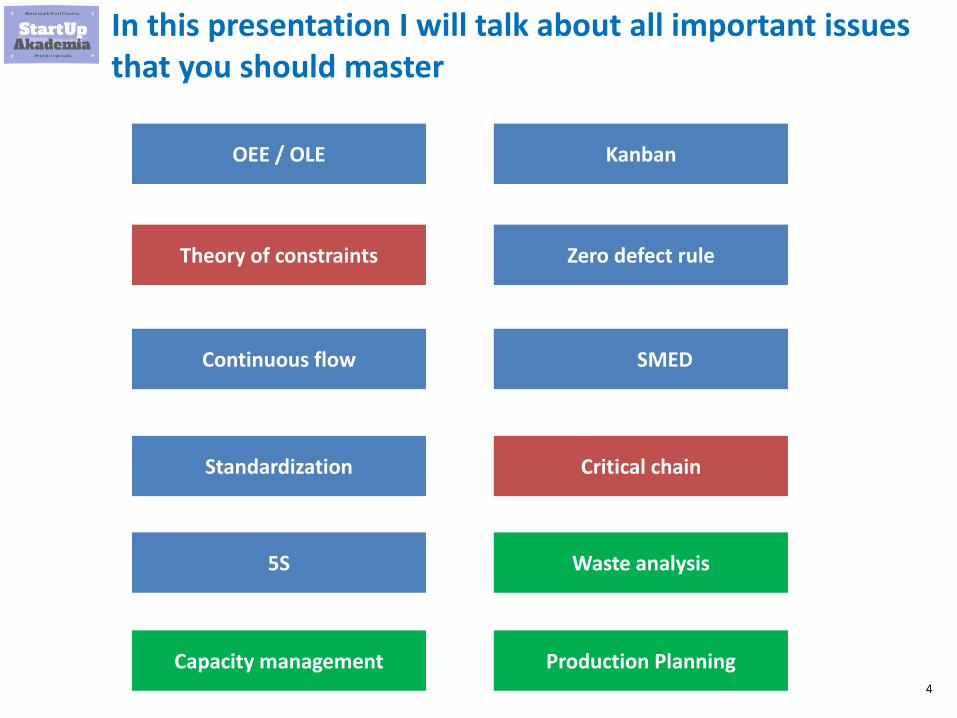
In this presentation I will talk about all important issues that you should master
OEE / OLE
Theory of constraints
Continuous flow
Standardization
5S
Kanban
Zero defect rule
SMED
Critical chain
Waste analysis
Capacity management Production Planning
5
Thanks to this presentation you will be able to optimize production and estimate the potential impact of
improvements

6
This is part of my on-line course where I show step by step how find and analyze in Excel potential improvements in Production
Click to check my course
Essential Lean Manufacturing for Management Consultants
$90$10
7
Basic methods of improving production

8
Introduction to improving production
9
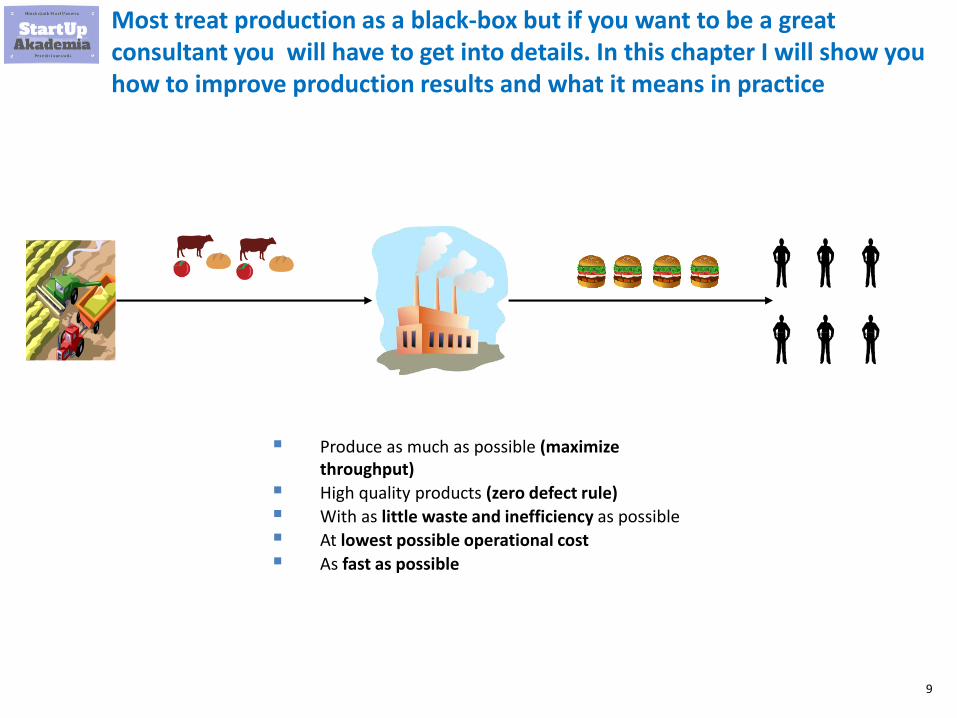
Most treat production as a black-box but if you want to be a great consultant you will have to get into details. In this chapter I will show you how to improve production results and what it means in practice
▪ Produce as much as possible (maximize throughput)
▪ High quality products (zero defect rule)
▪ With as little waste and inefficiency as possible
▪ At lowest possible operational cost
▪ As fast as possible
10
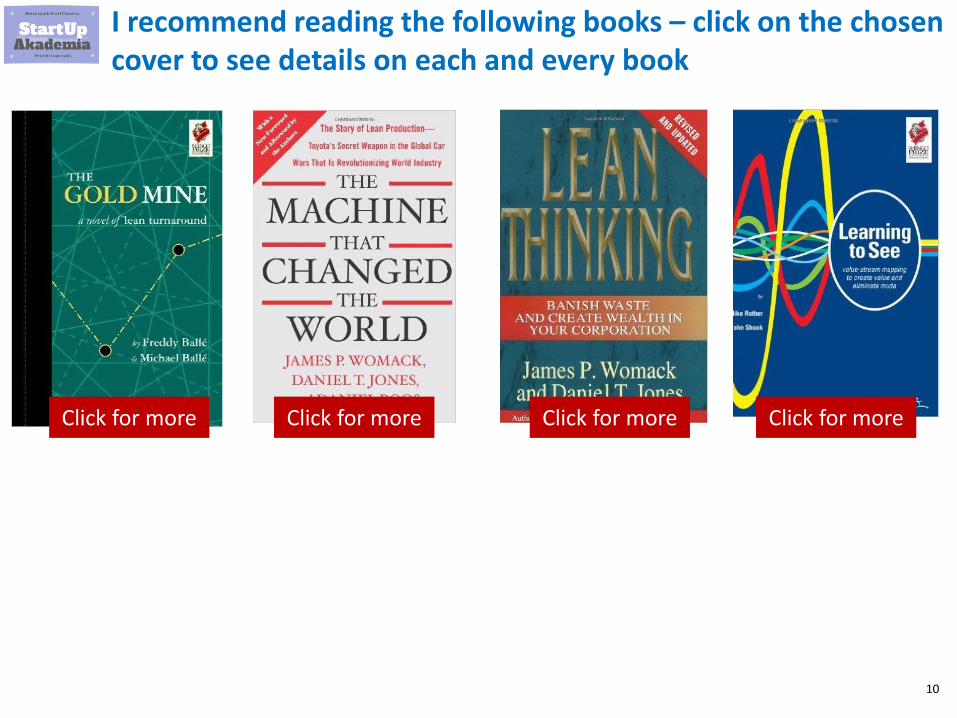
I recommend reading the following books – click on the chosen cover to see details on each and every book
Click for moreClick for moreClick for more Click for more

11
Different types of waste
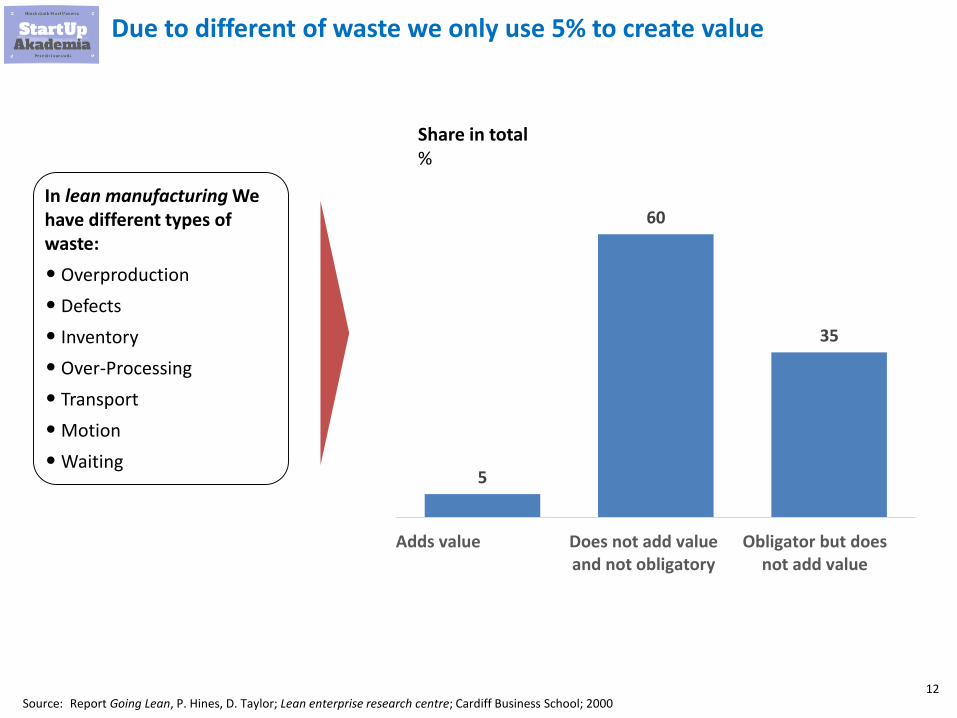
12
5
60
35
Adds value Does not add valueand not obligatory
Obligator but doesnot add value
Due to different of waste we only use 5% to create value
Source: Report Going Lean, P. Hines, D. Taylor; Lean enterprise research centre; Cardiff Business School; 2000
In lean manufacturing We have different types of waste:
• Overproduction
• Defects
• Inventory
• Over-Processing
• Transport
• Motion
• Waiting
Share in total%
13
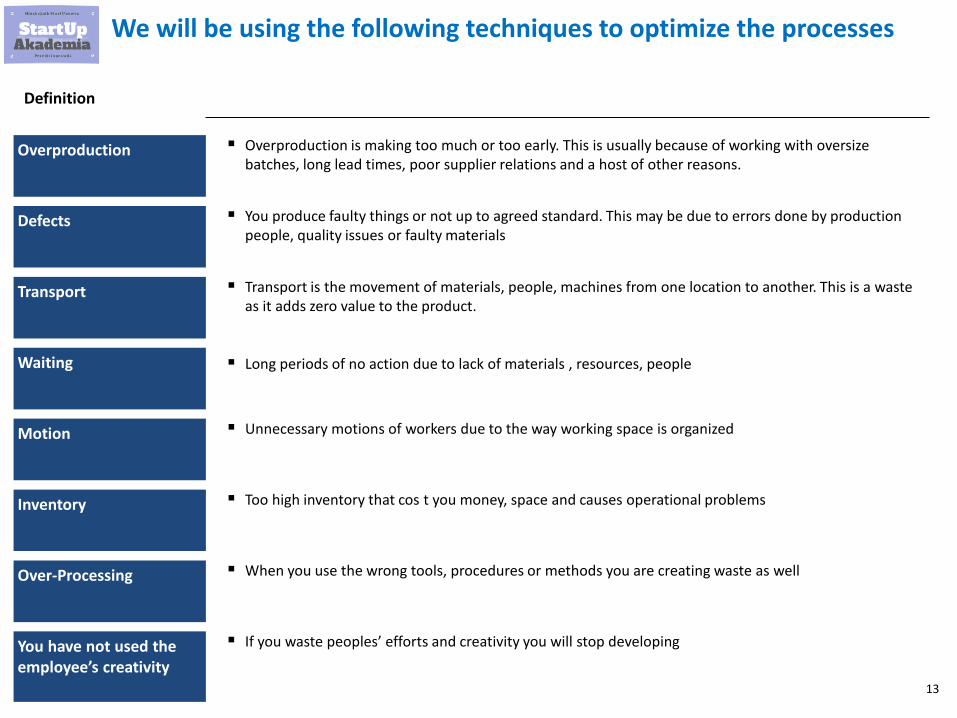
We will be using the following techniques to optimize the processes
Overproduction ▪ Overproduction is making too much or too early. This is usually because of working with oversize batches, long lead times, poor supplier relations and a host of other reasons.
Defects ▪ You produce faulty things or not up to agreed standard. This may be due to errors done by production people, quality issues or faulty materials
Transport ▪ Transport is the movement of materials, people, machines from one location to another. This is a waste as it adds zero value to the product.
Waiting ▪ Long periods of no action due to lack of materials , resources, people
Motion ▪ Unnecessary motions of workers due to the way working space is organized
Inventory ▪ Too high inventory that cos t you money, space and causes operational problems
Over-Processing ▪ When you use the wrong tools, procedures or methods you are creating waste as well
You have not used the employee’s creativity
▪ If you waste peoples’ efforts and creativity you will stop developing
Definition
14
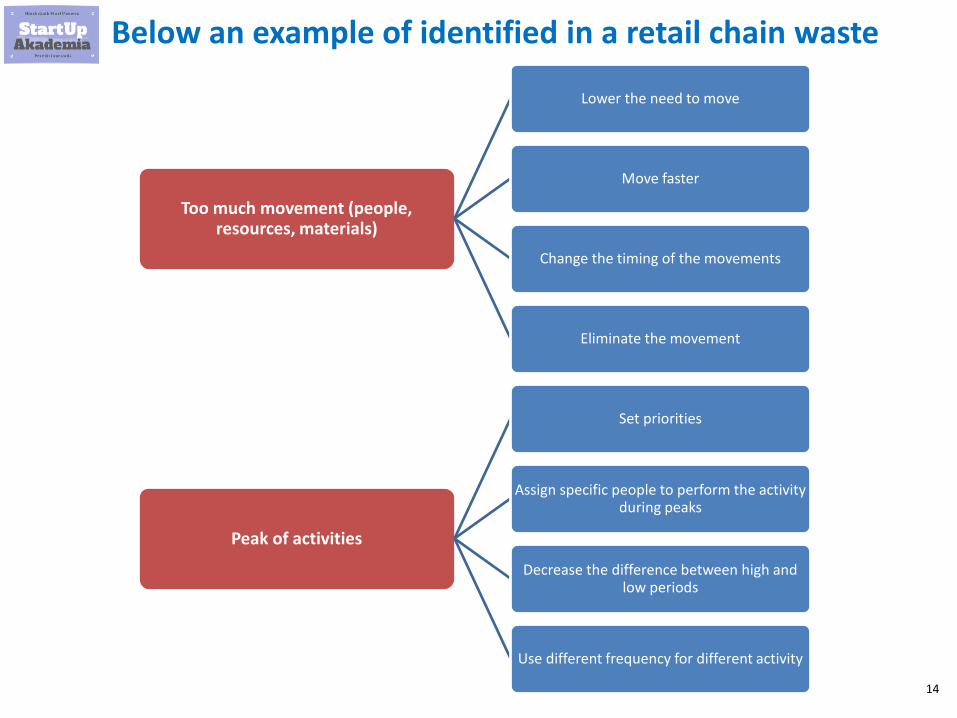
Below an example of identified in a retail chain waste
Too much movement (people, resources, materials)
Lower the need to move
Move faster
Change the timing of the movements
Eliminate the movement
Peak of activities
Set priorities
Assign specific people to perform the activity during peaks
Decrease the difference between high and low periods
Use different frequency for different activity

15
5 Whys
16
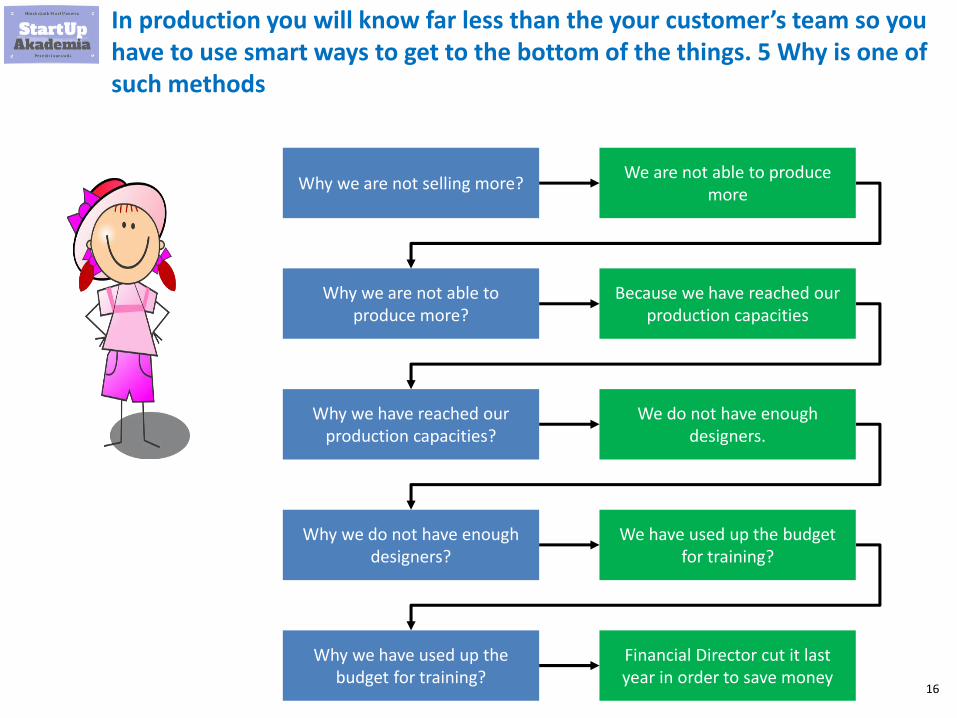
In production you will know far less than the your customer’s team so you have to use smart ways to get to the bottom of the things. 5 Why is one of such methods
Why we are not selling more?We are not able to produce
more
Why we are not able to produce more?
Because we have reached our production capacities
Why we have reached our production capacities?
We do not have enough designers.
Why we do not have enough designers?
We have used up the budget for training?
Why we have used up the budget for training?
Financial Director cut it last year in order to save money

17
OEE
18
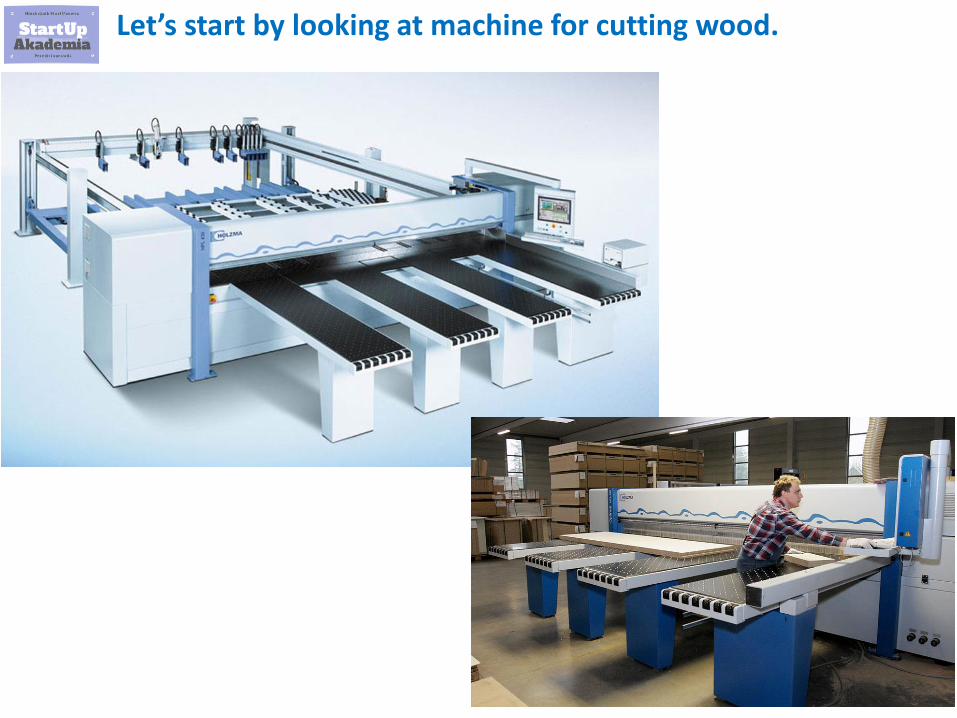
Let’s start by looking at machine for cutting wood.
19
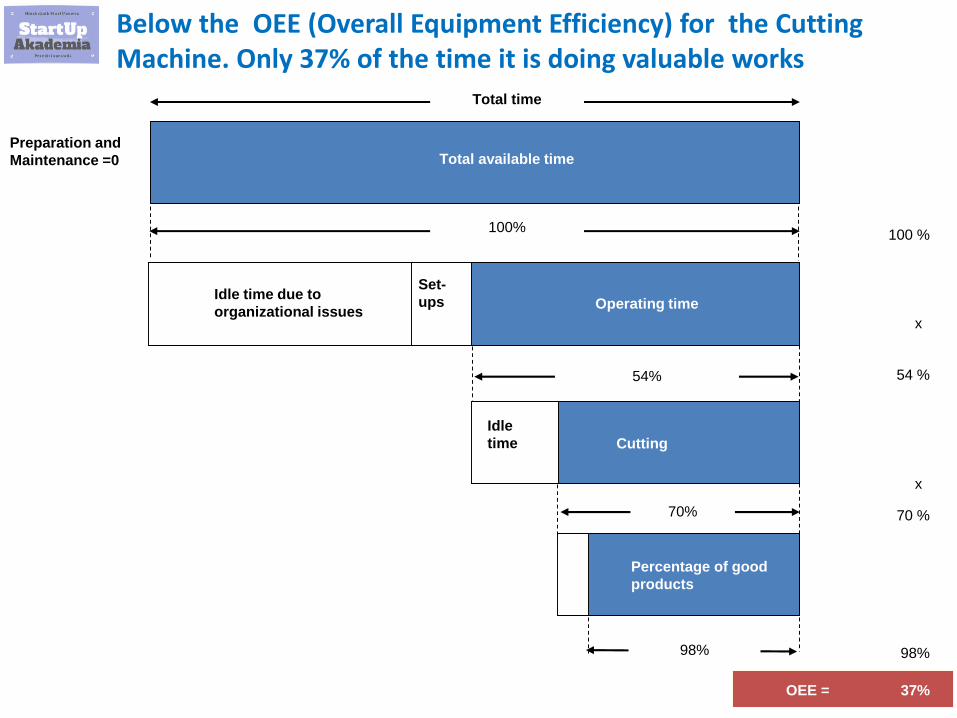
Total time
Preparation and
Maintenance =0 Total available time
Operating timeIdle time due to
organizational issues
100%
54%
OEE =
100 %
54 %
x
x
98%
Cutting
98%
37%
Set-
ups
Idle
time
70%
Percentage of good
products
70 %
Below the OEE (Overall Equipment Efficiency) for the Cutting Machine. Only 37% of the time it is doing valuable works
20
Removing bottlenecks - content marketing example
21
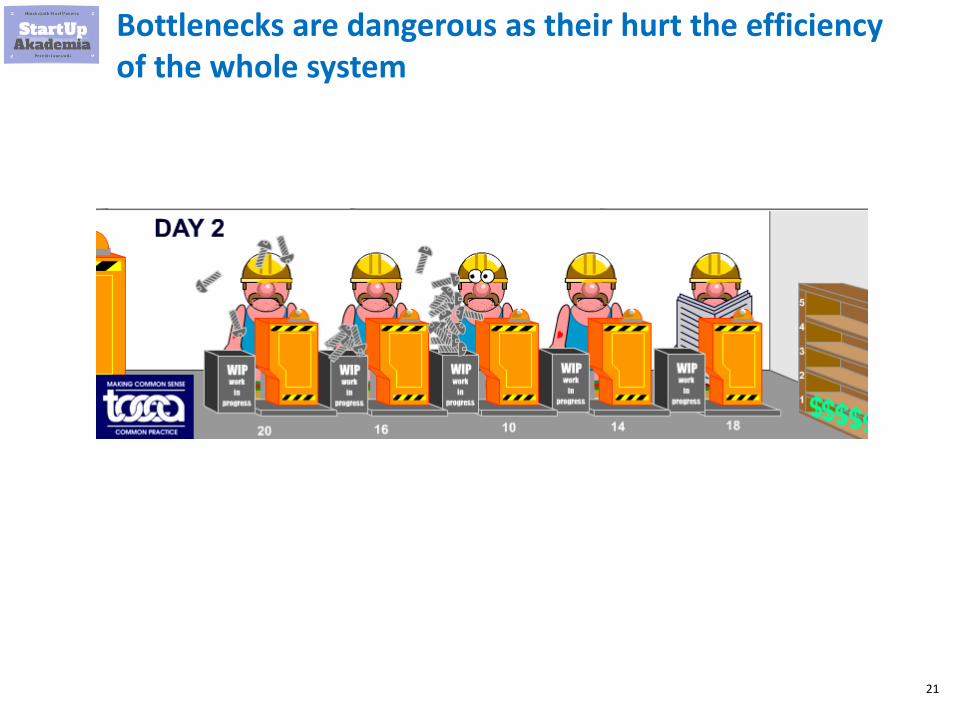
Bottlenecks are dangerous as their hurt the efficiency of the whole system
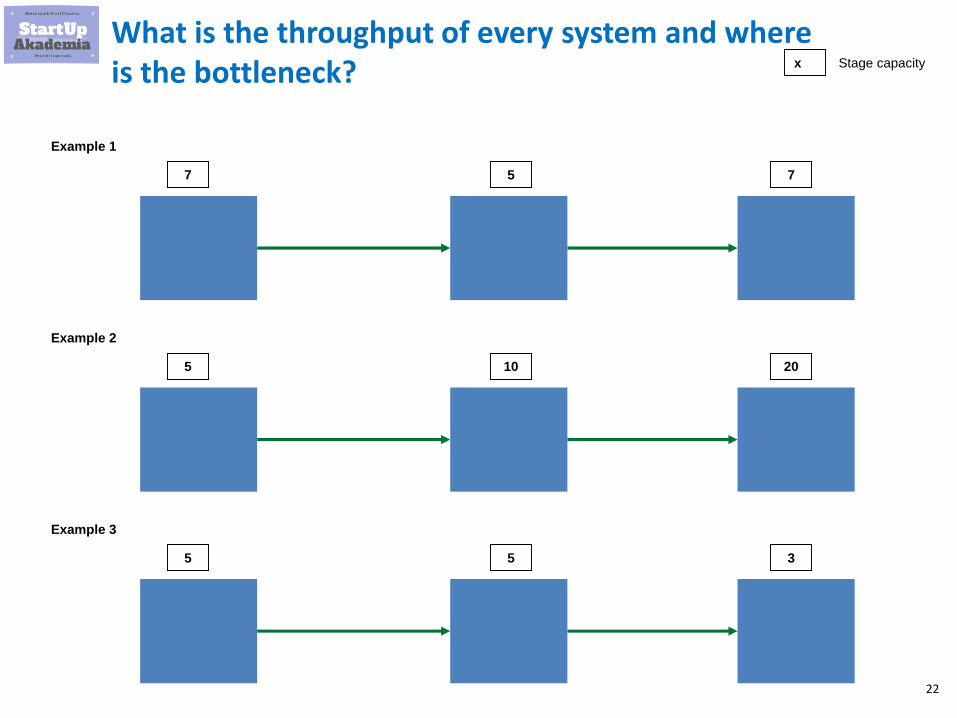
22
What is the throughput of every system and where is the bottleneck?
Example 1
7 5 7
Example 2
5 10 20
Example 3
5 5 3
x Stage capacity
23
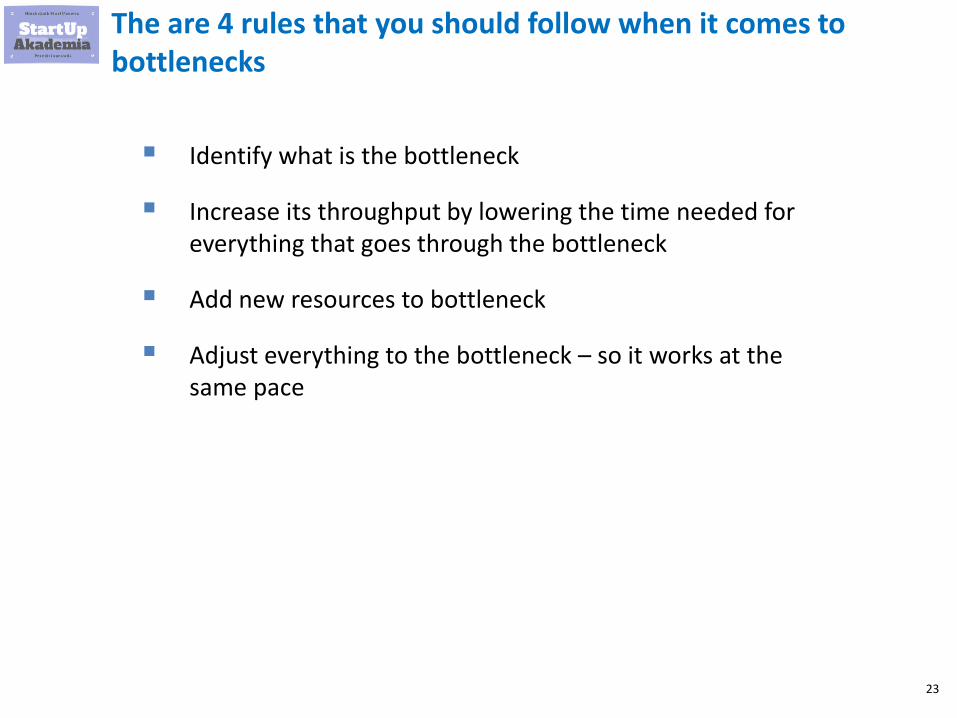
The are 4 rules that you should follow when it comes to bottlenecks
▪ Identify what is the bottleneck
▪ Increase its throughput by lowering the time needed for everything that goes through the bottleneck
▪ Add new resources to bottleneck
▪ Adjust everything to the bottleneck – so it works at the same pace
24
Continuous flow introduction
25
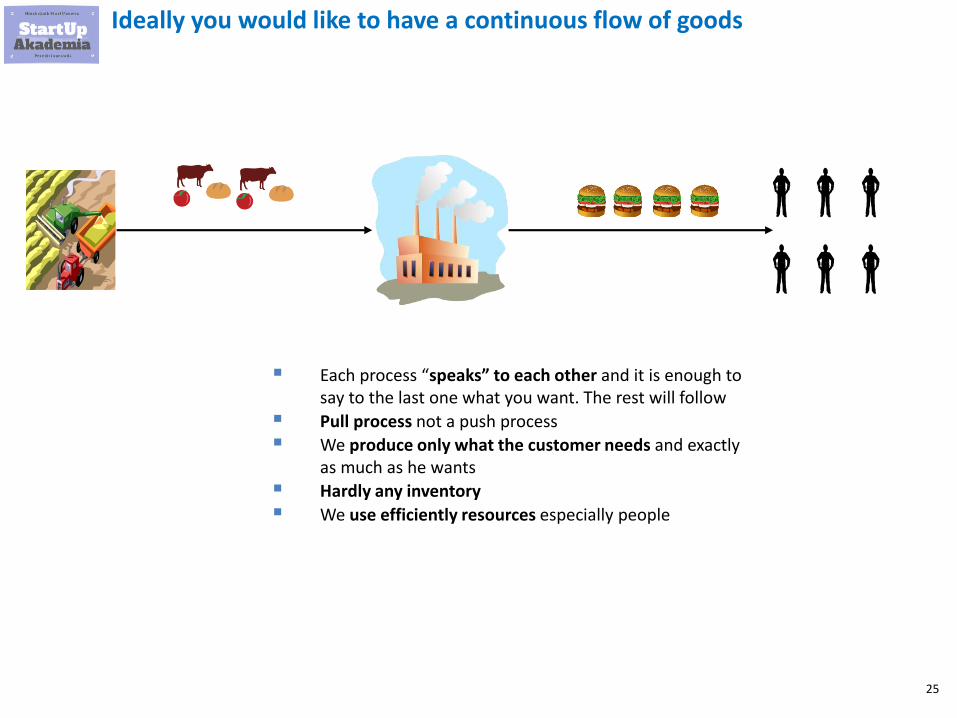
Ideally you would like to have a continuous flow of goods
▪ Each process “speaks” to each other and it is enough to say to the last one what you want. The rest will follow
▪ Pull process not a push process
▪ We produce only what the customer needs and exactly as much as he wants
▪ Hardly any inventory
▪ We use efficiently resources especially people
26
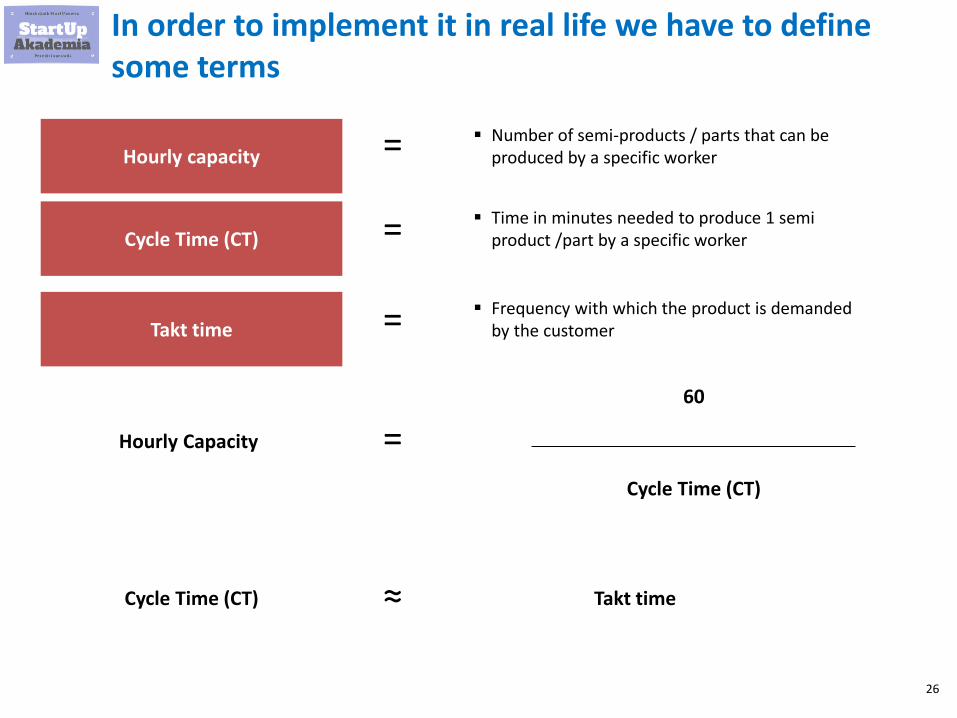
In order to implement it in real life we have to define some terms
Hourly capacity▪ Number of semi-products / parts that can be
produced by a specific worker
Cycle Time (CT)▪ Time in minutes needed to produce 1 semi
product /part by a specific worker
=
=
Hourly Capacity =60
Cycle Time (CT)
Takt time▪ Frequency with which the product is demanded
by the customer=
Cycle Time (CT) ≈ Takt time
27
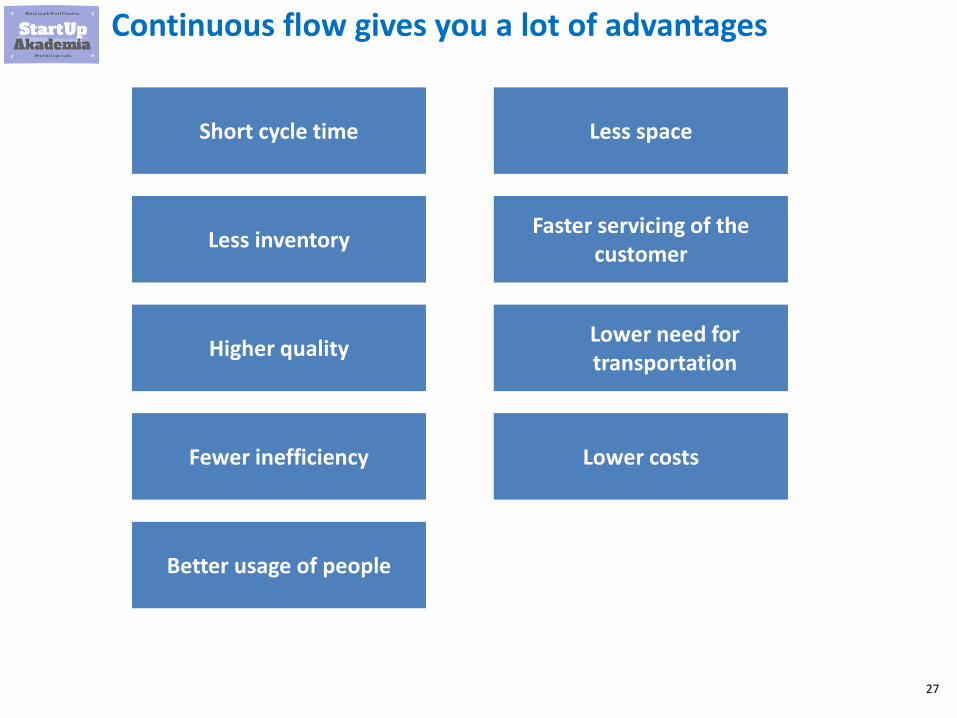
Continuous flow gives you a lot of advantages
Short cycle time
Less inventory
Higher quality
Fewer inefficiency
Better usage of people
Less space
Faster servicing of the customer
Lower need for transportation
Lower costs
28
How not to make continuous flow – sandwich factory
29
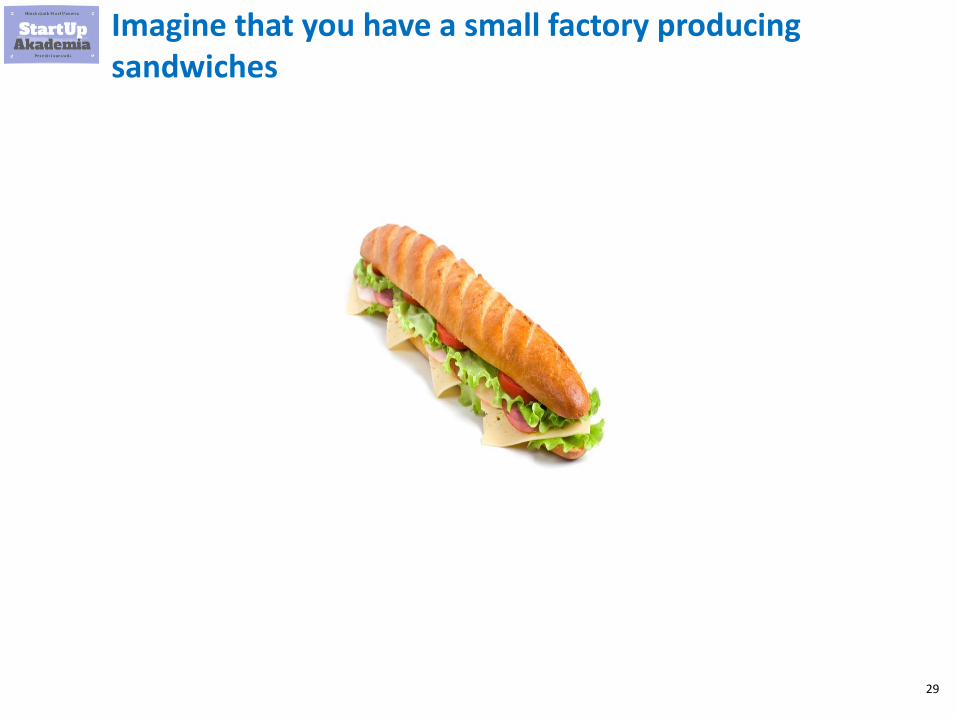
Imagine that you have a small factory producing sandwiches
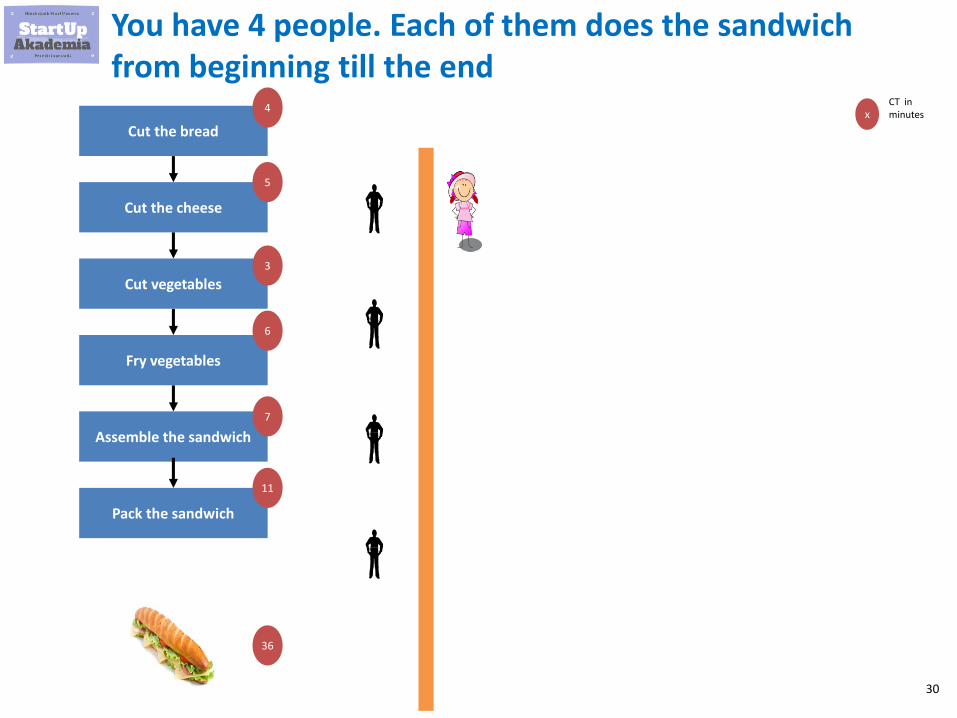
30
You have 4 people. Each of them does the sandwich from beginning till the end
Cut the bread
Cut vegetables
Fry vegetables
Cut the cheese
Assemble the sandwich
Pack the sandwich
4
5
3
6
7
11
36
xCT in minutes
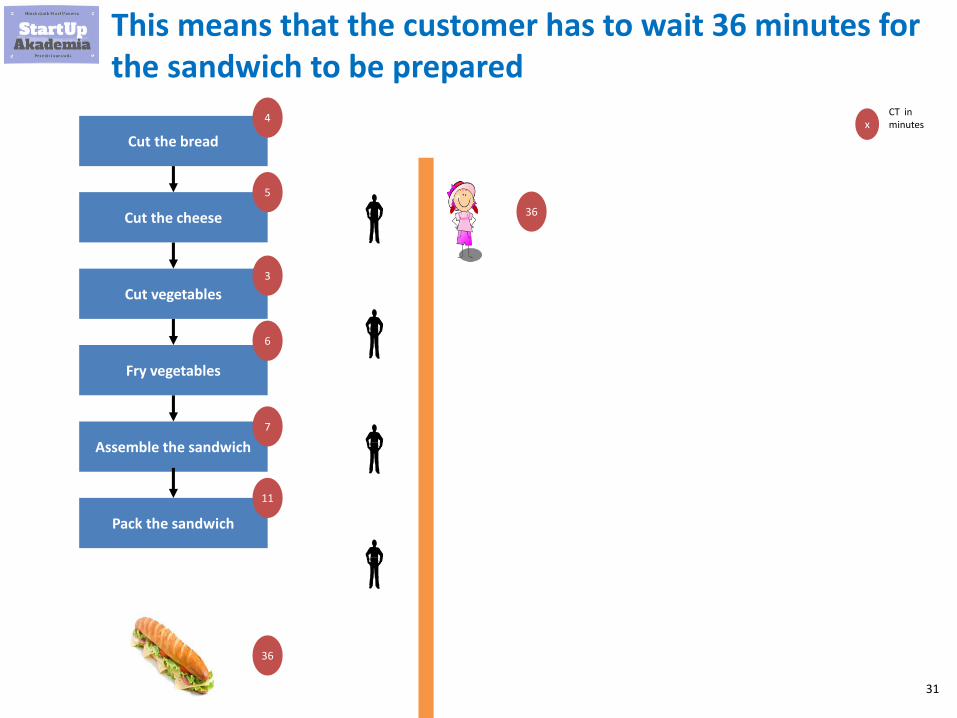
31
This means that the customer has to wait 36 minutes for the sandwich to be prepared
Cut the bread
Cut vegetables
Fry vegetables
Cut the cheese
Assemble the sandwich
Pack the sandwich
4
5
3
6
7
11
36
36
xCT in minutes
32
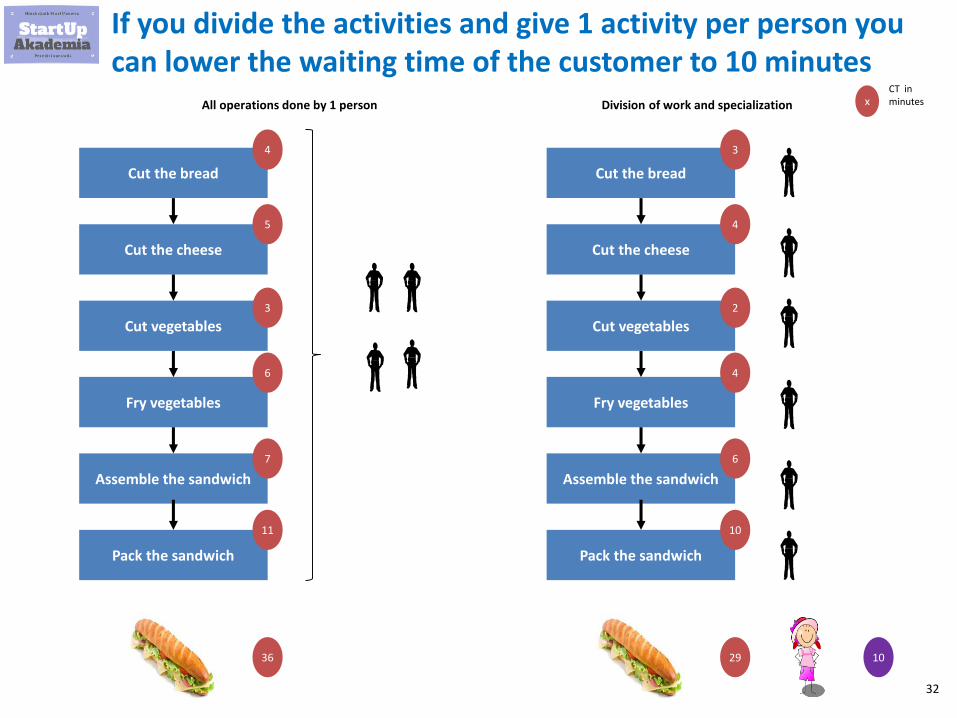
If you divide the activities and give 1 activity per person you can lower the waiting time of the customer to 10 minutes
Cut the bread
Cut vegetables
Fry vegetables
Cut the cheese
Assemble the sandwich
Pack the sandwich
4
5
3
6
7
11
36
Cut the bread
Cut vegetables
Fry vegetables
Cut the cheese
Assemble the sandwich
Pack the sandwich
3
4
2
4
6
10
29
All operations done by 1 person Division of work and specialization
10
xCT in minutes
33
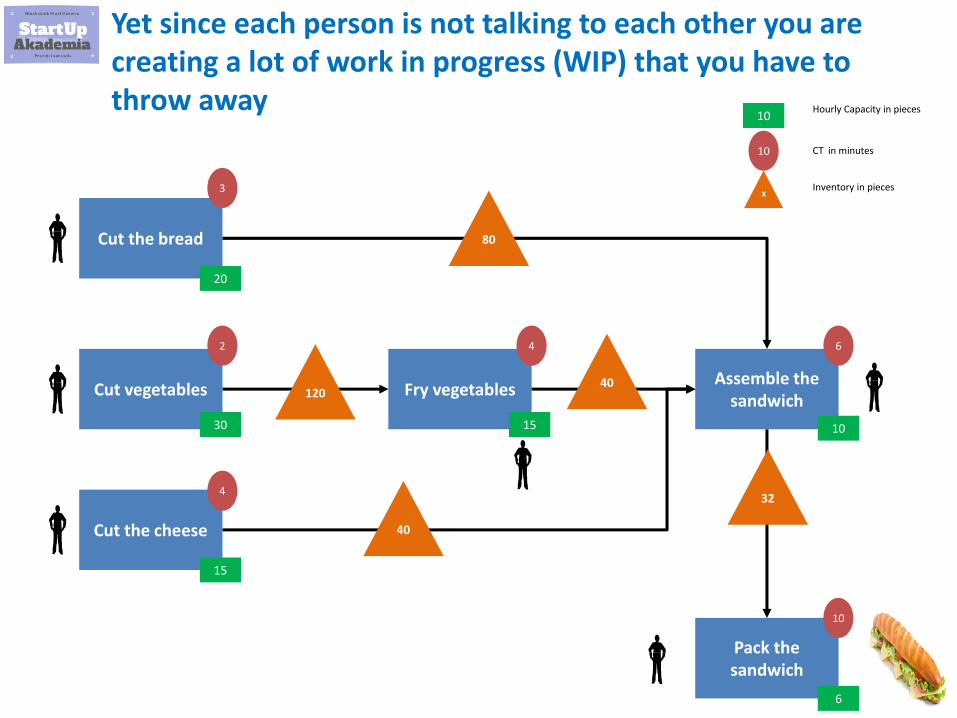
Yet since each person is not talking to each other you are creating a lot of work in progress (WIP) that you have to throw away
Cut the bread
Cut vegetables Fry vegetables
Cut the cheese
Assemble the sandwich
Pack the sandwich
15
30
20
15 10
6
10
3
2
4
4 6
10
10
80
X
Hourly Capacity in pieces
CT in minutes
Inventory in pieces
120
40
32
40
34
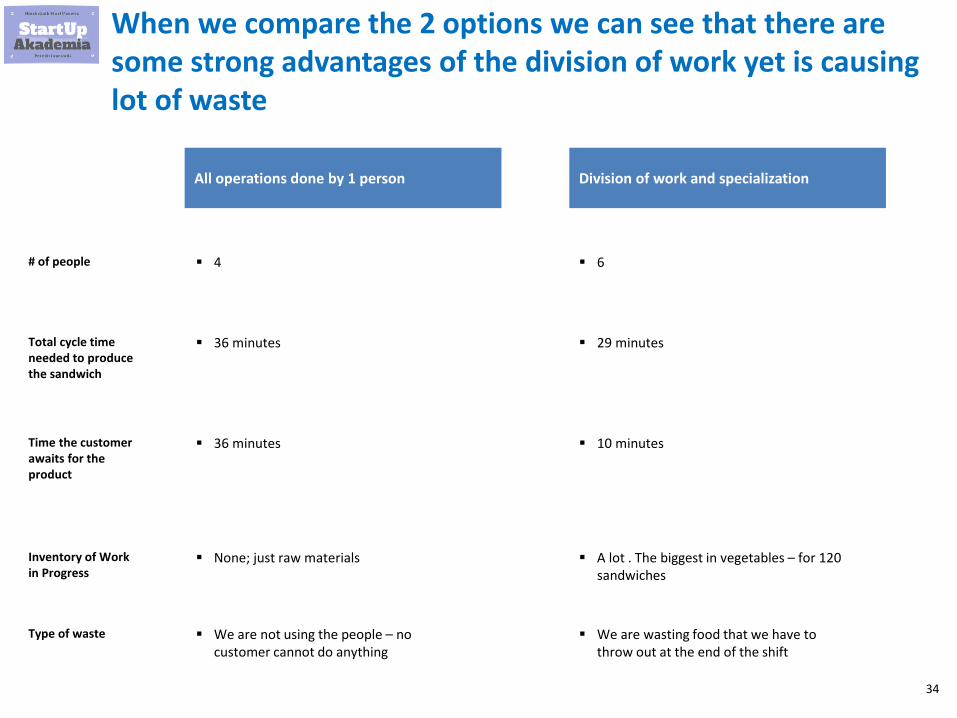
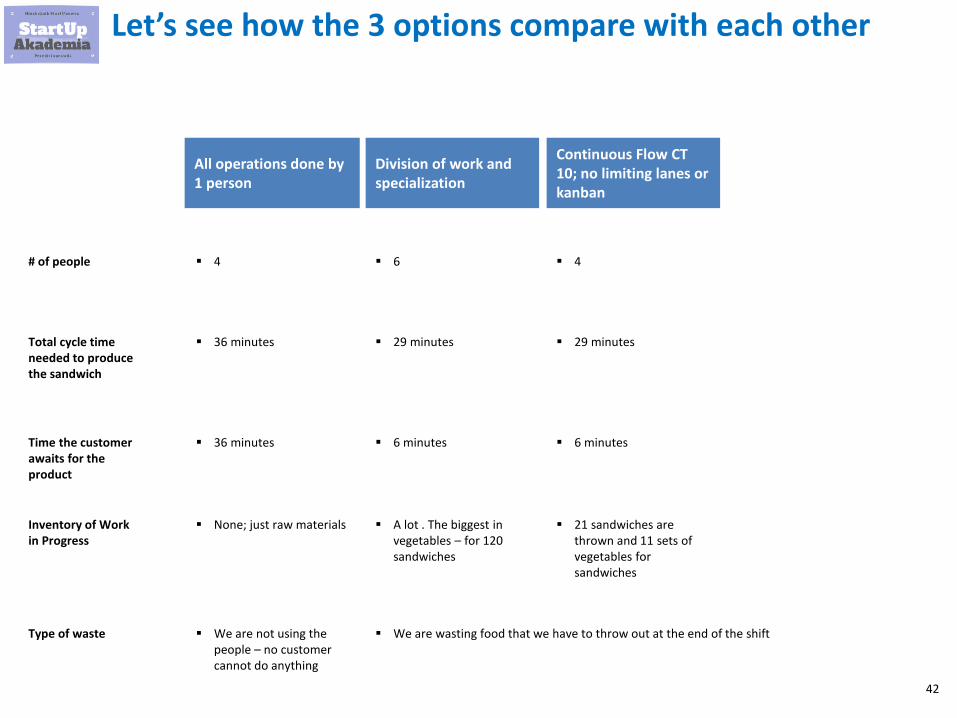
When we compare the 2 options we can see that there are some strong advantages of the division of work yet is causing lot of waste
All operations done by 1 person Division of work and specialization
▪ 4# of people ▪ 6
▪ 36 minutesTotal cycle time needed to produce the sandwich
▪ 29 minutes
▪ We are not using the people – no customer cannot do anything
Type of waste ▪ We are wasting food that we have to throw out at the end of the shift
▪ 36 minutesTime the customer awaits for the product
▪ 10 minutes
▪ None; just raw materialsInventory of Work in Progress
▪ A lot . The biggest in vegetables – for 120 sandwiches
35
How to make continuous flow – sandwich factory
36
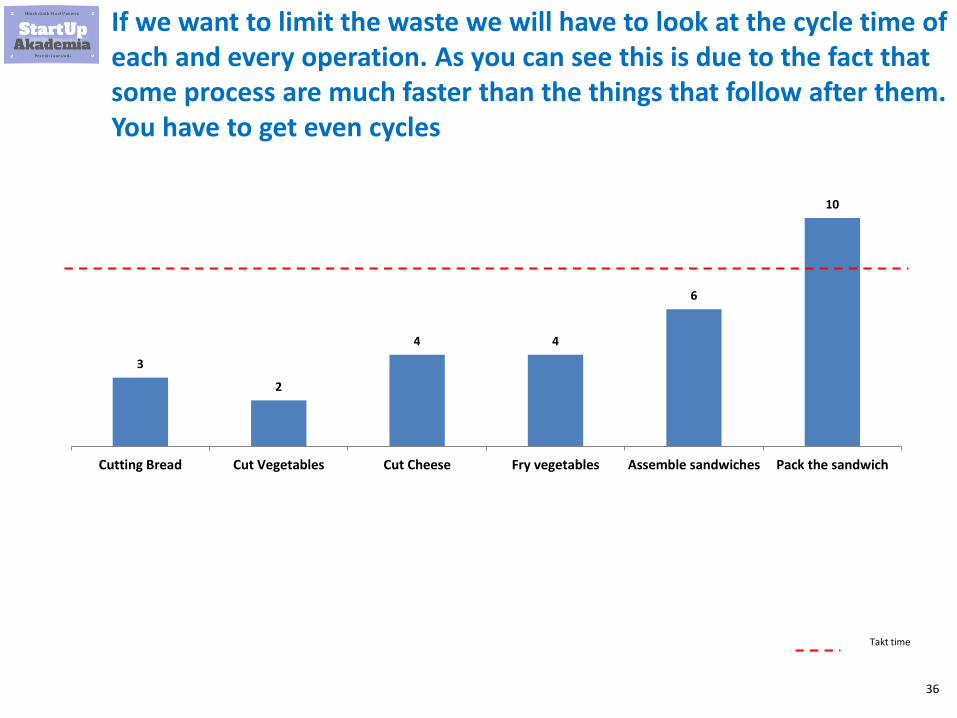
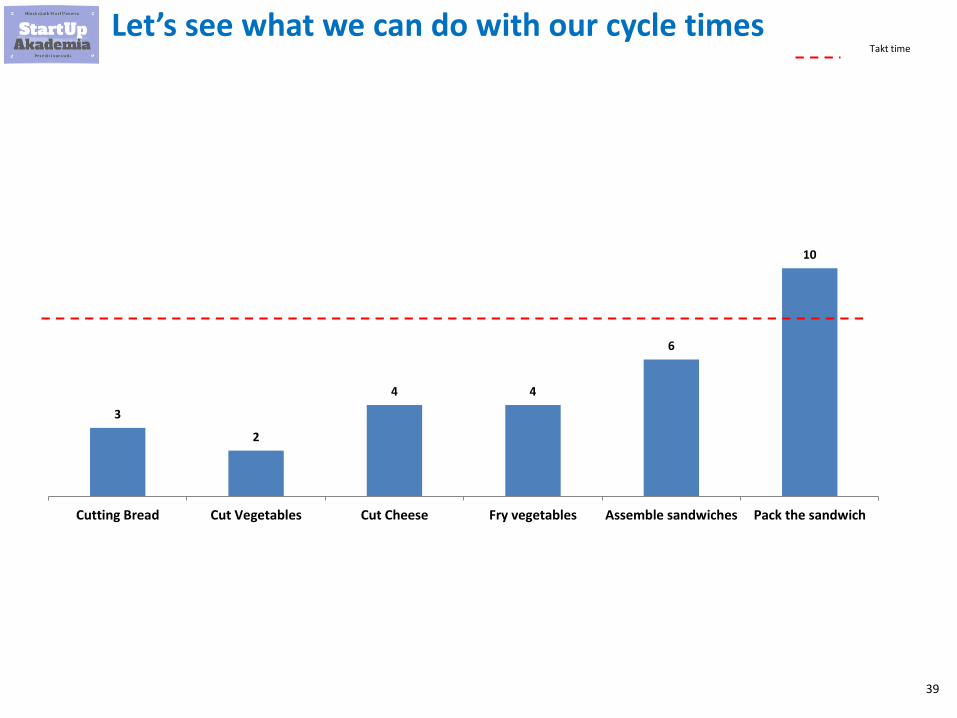
If we want to limit the waste we will have to look at the cycle time of each and every operation. As you can see this is due to the fact that some process are much faster than the things that follow after them. You have to get even cycles
3
2
4 4
6
10
Cutting Bread Cut Vegetables Cut Cheese Fry vegetables Assemble sandwiches Pack the sandwich
Takt time
37
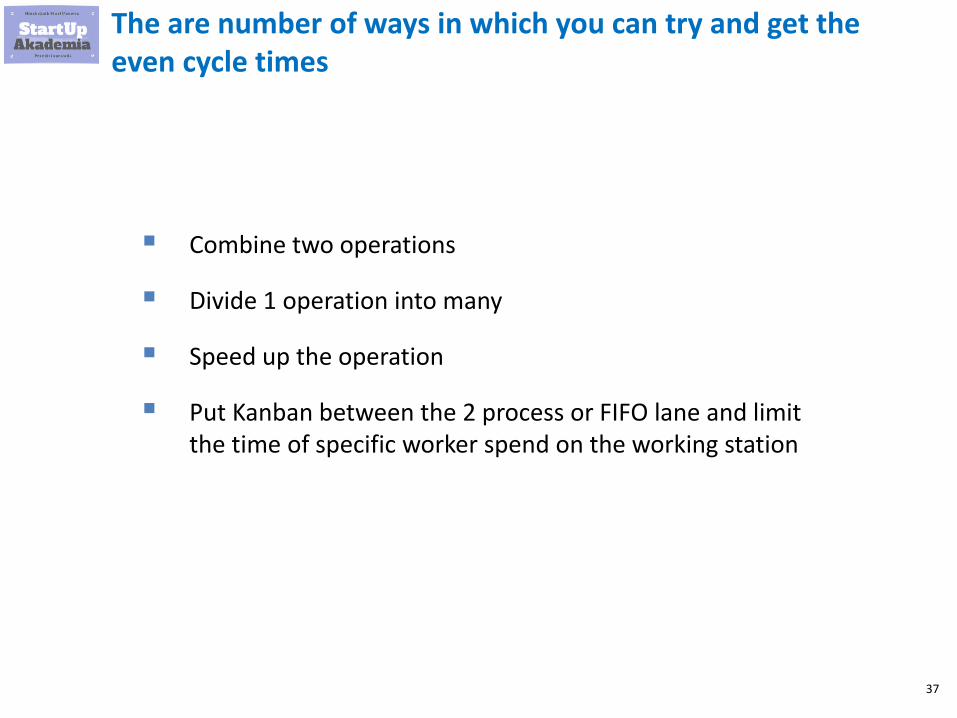
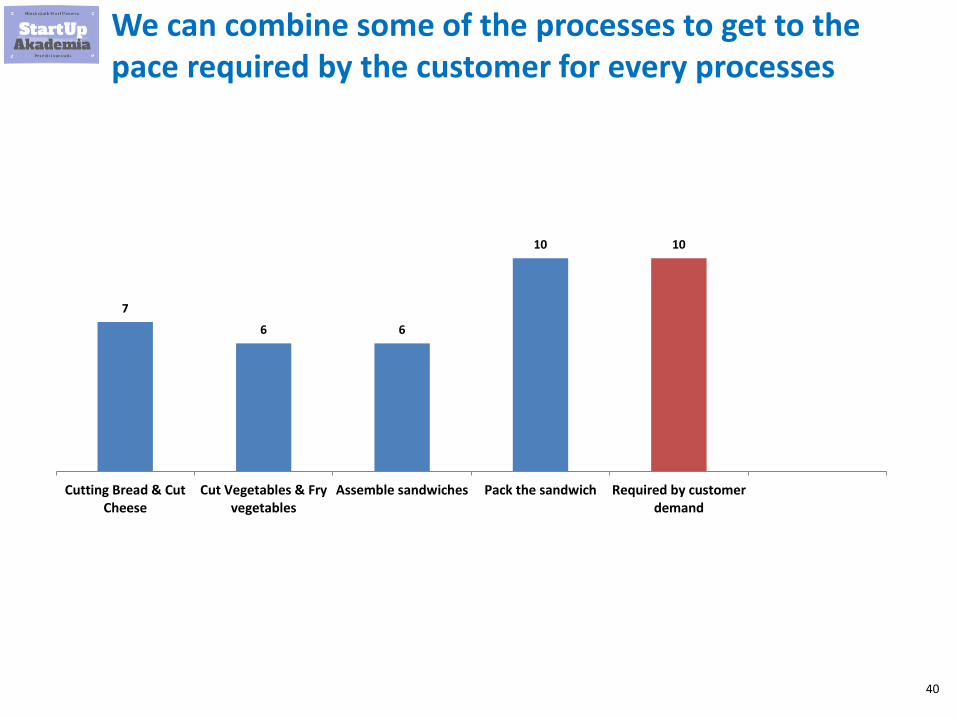
The are number of ways in which you can try and get the even cycle times
▪ Combine two operations
▪ Divide 1 operation into many
▪ Speed up the operation
▪ Put Kanban between the 2 process or FIFO lane and limit the time of specific worker spend on the working station
38
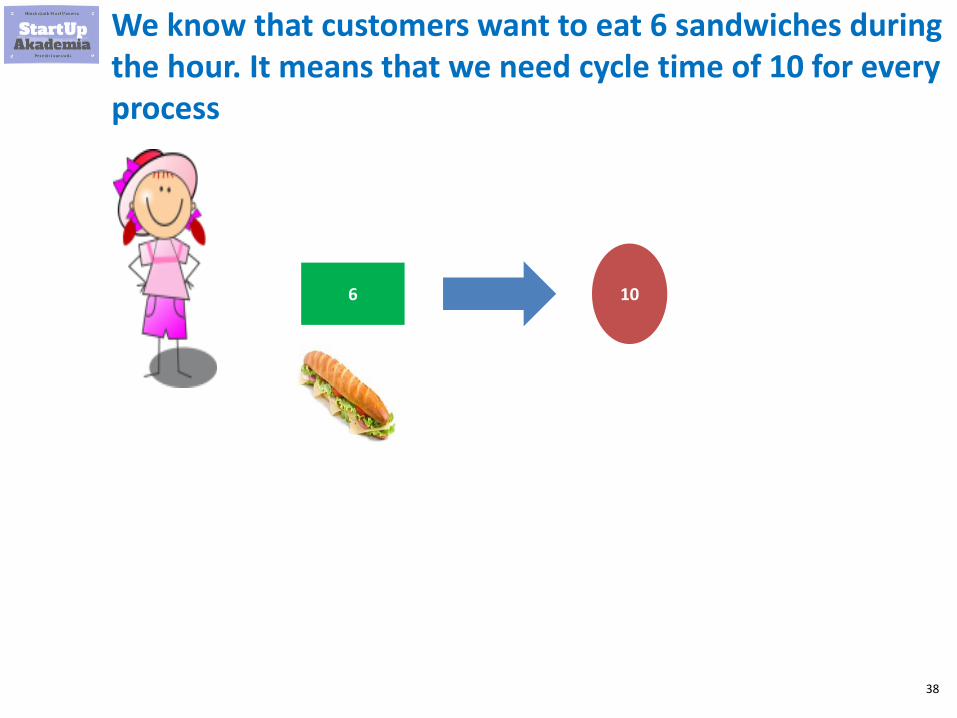
We know that customers want to eat 6 sandwiches during the hour. It means that we need cycle time of 10 for every process
106
39
Let’s see what we can do with our cycle times
3
2
4 4
6
10
Cutting Bread Cut Vegetables Cut Cheese Fry vegetables Assemble sandwiches Pack the sandwich
Takt time
40
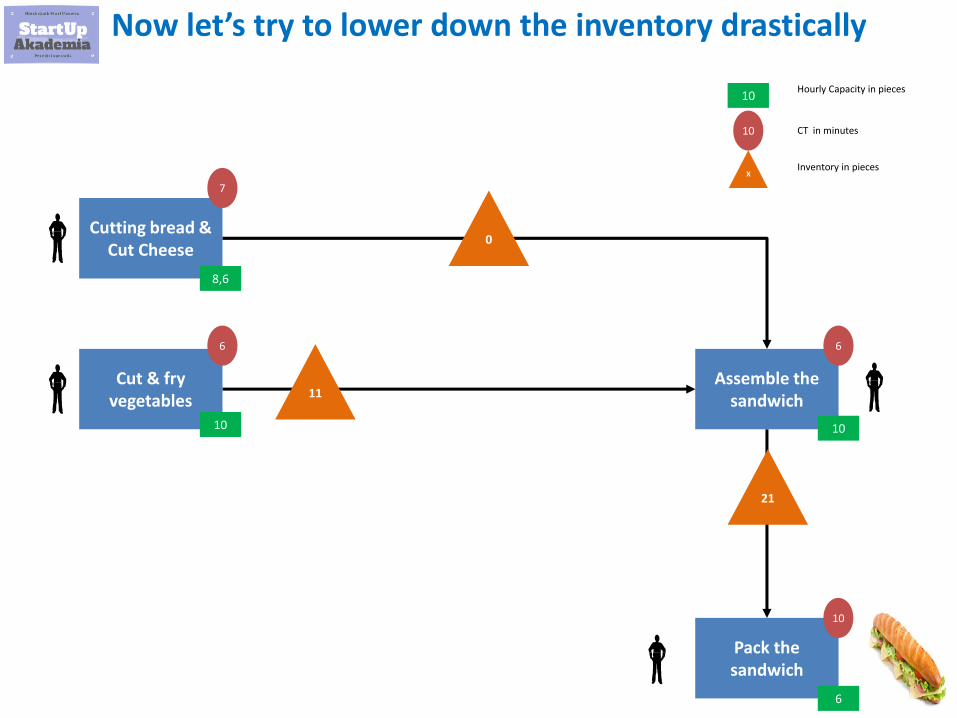
We can combine some of the processes to get to the pace required by the customer for every processes
7
6 6
10 10
Cutting Bread & CutCheese
Cut Vegetables & Fryvegetables
Assemble sandwiches Pack the sandwich Required by customerdemand
41
In this we lower down the inventory drastically and have fewer people
Cutting bread & Cut Cheese
Cut & fry vegetables
Assemble the sandwich
Pack the sandwich
10
8,6
10
6
10
7
6 6
10
10
0
X
Hourly Capacity in pieces
CT in minutes
Inventory in pieces
11
21
42
Let’s see how the 3 options compare with each other
All operations done by 1 person
Division of work and specialization
▪ 4# of people ▪ 6
▪ 36 minutesTotal cycle time needed to produce the sandwich
▪ 29 minutes
▪ We are not using the people – no customer cannot do anything
Type of waste ▪ We are wasting food that we have to throw out at the end of the shift
▪ 36 minutesTime the customer awaits for the product
▪ 6 minutes
▪ None; just raw materialsInventory of Work in Progress
▪ A lot . The biggest in vegetables – for 120 sandwiches
Continuous Flow CT 10; no limiting lanes or kanban
▪ 4
▪ 29 minutes
▪ 6 minutes
▪ 21 sandwiches are thrown and 11 sets of vegetables for sandwiches
43
Now let’s try to lower down the inventory drastically
Cutting bread & Cut Cheese
Cut & fry vegetables
Assemble the sandwich
Pack the sandwich
10
8,6
10
6
10
7
6 6
10
10
0
X
Hourly Capacity in pieces
CT in minutes
Inventory in pieces
11
21
44
If we put FIFO lanes and kanbans we can further improve the customer experience and lower inventory
Cutting bread & Cut Cheese
Cut & fry vegetables
Assemble the sandwich
Pack the sandwich
10
8,6
10
6
10
7
6 6
10
10
Hourly Capacity in pieces
CT in minutes
Lane limiting the inventory
FIFO Lane
Max 1
FIFO Lan
e
Max 2
FIFO Lane
Max 2
FIFO Lane
2
Kanban
45
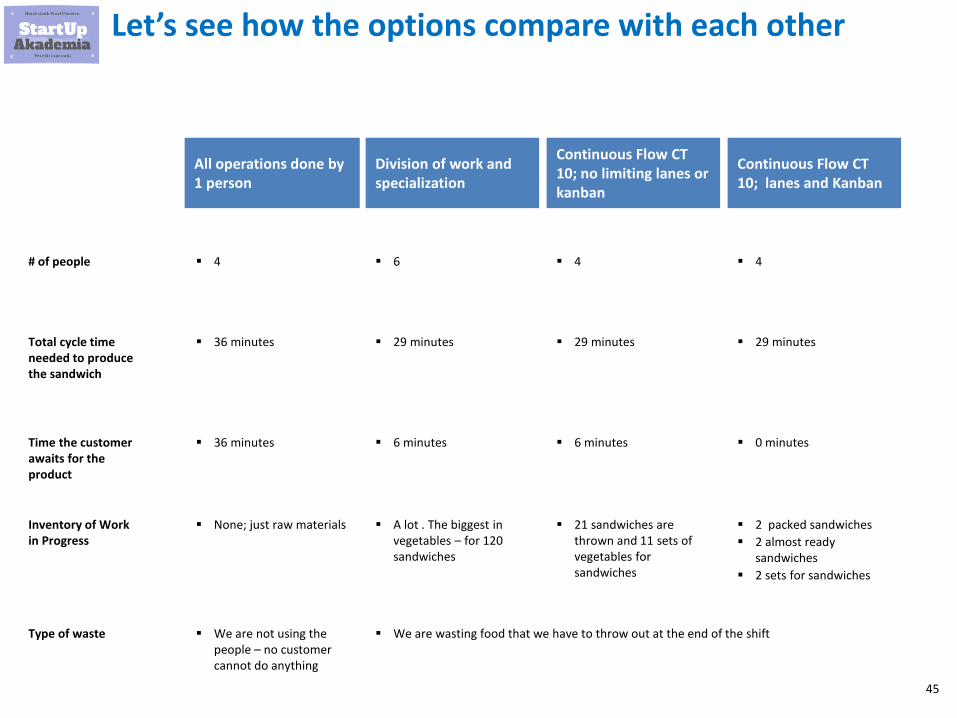
Let’s see how the options compare with each other
All operations done by 1 person
Division of work and specialization
▪ 4# of people ▪ 6
▪ 36 minutesTotal cycle time needed to produce the sandwich
▪ 29 minutes
▪ We are not using the people – no customer cannot do anything
Type of waste ▪ We are wasting food that we have to throw out at the end of the shift
▪ 36 minutesTime the customer awaits for the product
▪ 6 minutes
▪ None; just raw materialsInventory of Work in Progress
▪ A lot . The biggest in vegetables – for 120 sandwiches
Continuous Flow CT 10; no limiting lanes or kanban
▪ 4
▪ 29 minutes
▪ 6 minutes
▪ 21 sandwiches are thrown and 11 sets of vegetables for sandwiches
Continuous Flow CT 10; lanes and Kanban
▪ 4
▪ 29 minutes
▪ 0 minutes
▪ 2 packed sandwiches
▪ 2 almost ready sandwiches
▪ 2 sets for sandwiches
46
For more examples and templates in Excel go to my on-line course where I show you step by step how to find and estimate improvements in production
Click to check my course
Essential Lean Manufacturing for Management Consultants
$90$10

47
Standardization
48
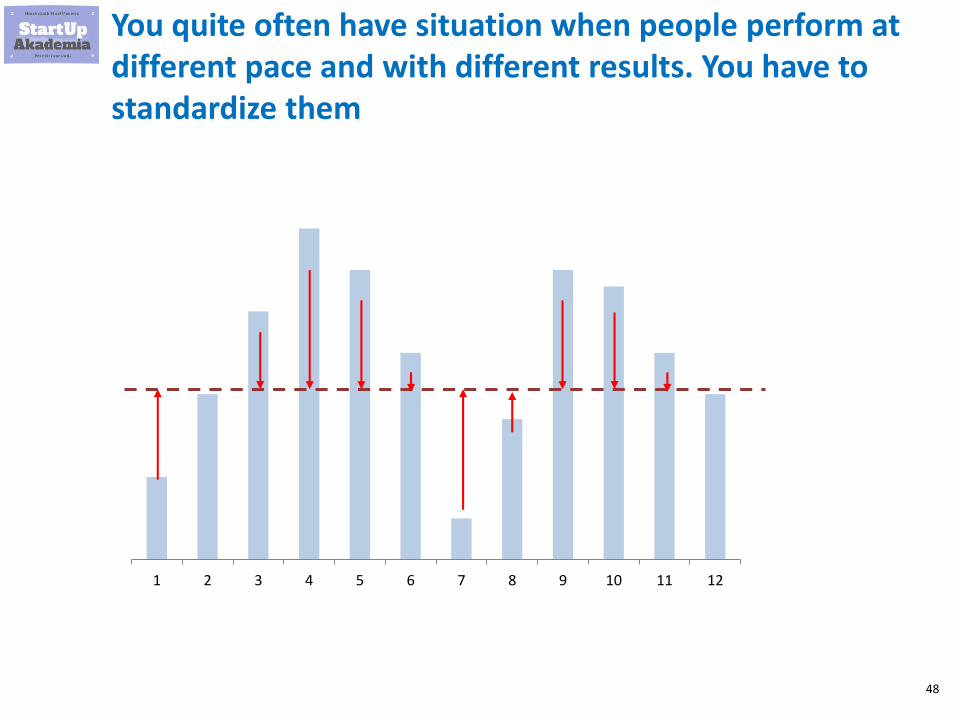
You quite often have situation when people perform at different pace and with different results. You have to standardize them
1 2 3 4 5 6 7 8 9 10 11 12
49
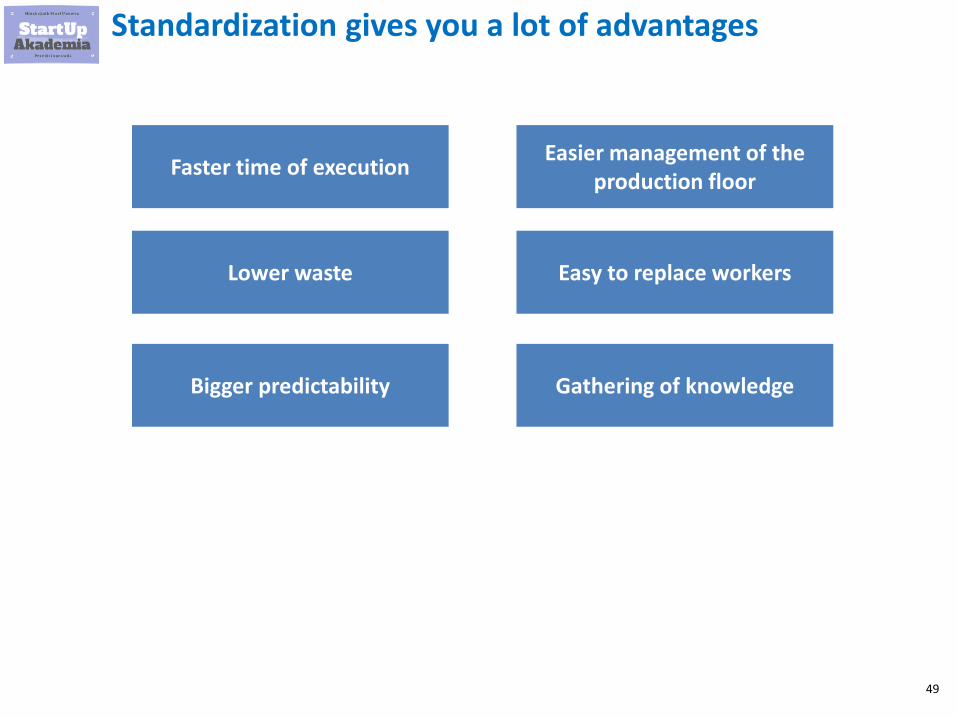
Standardization gives you a lot of advantages
Faster time of execution
Lower waste
Bigger predictability
Easier management of the production floor
Easy to replace workers
Gathering of knowledge
50
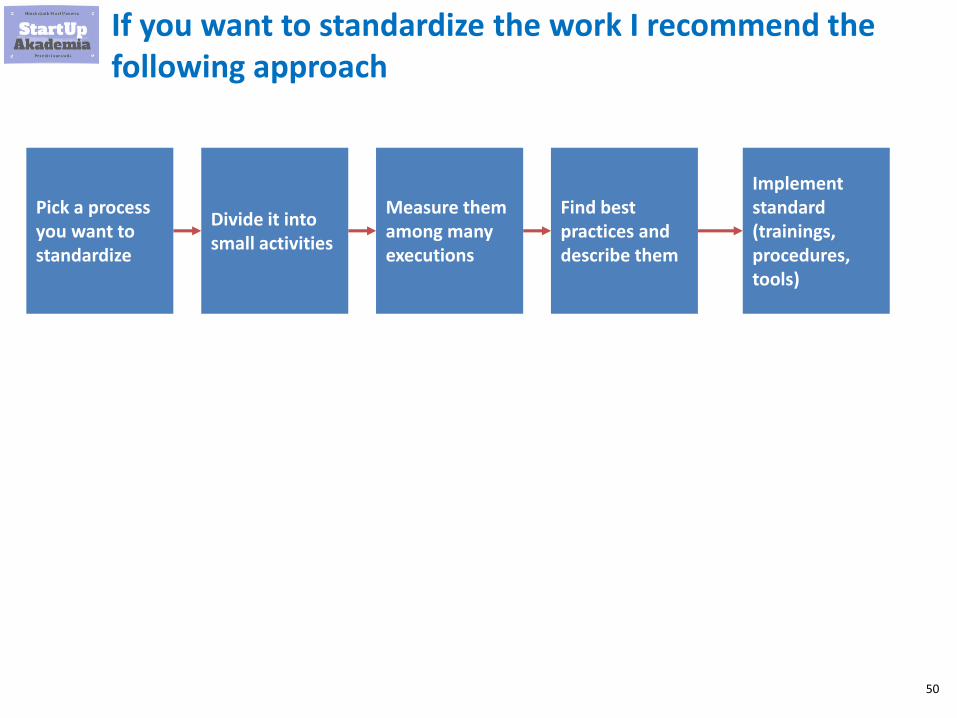
If you want to standardize the work I recommend the following approach
Pick a process you want to standardize
Divide it into small activities
Measure them among many executions
Find best practices and describe them
Implement standard (trainings, procedures, tools)

51
5S
52
5S in short is about cleaning your working station, putting everything in order and keeping it this way
53
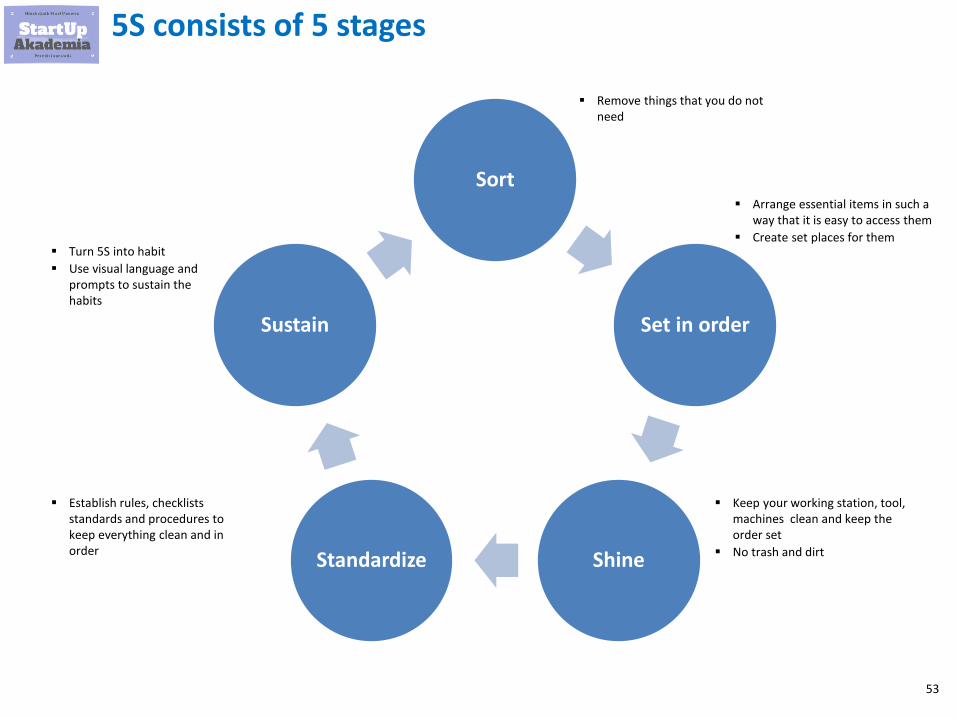
5S consists of 5 stages
Sort
Set in order
ShineStandardize
Sustain
▪ Remove things that you do not need
▪ Arrange essential items in such a way that it is easy to access them
▪ Create set places for them
▪ Keep your working station, tool, machines clean and keep the order set
▪ No trash and dirt
▪ Establish rules, checklists standards and procedures to keep everything clean and in order
▪ Turn 5S into habit
▪ Use visual language and prompts to sustain the habits
54
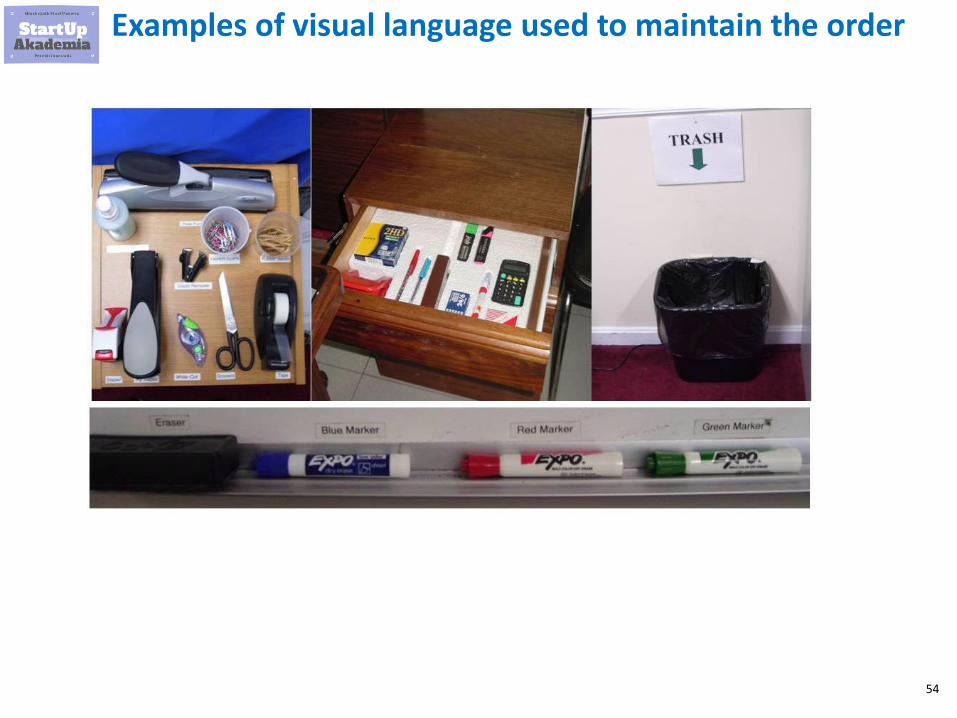
Examples of visual language used to maintain the order
55
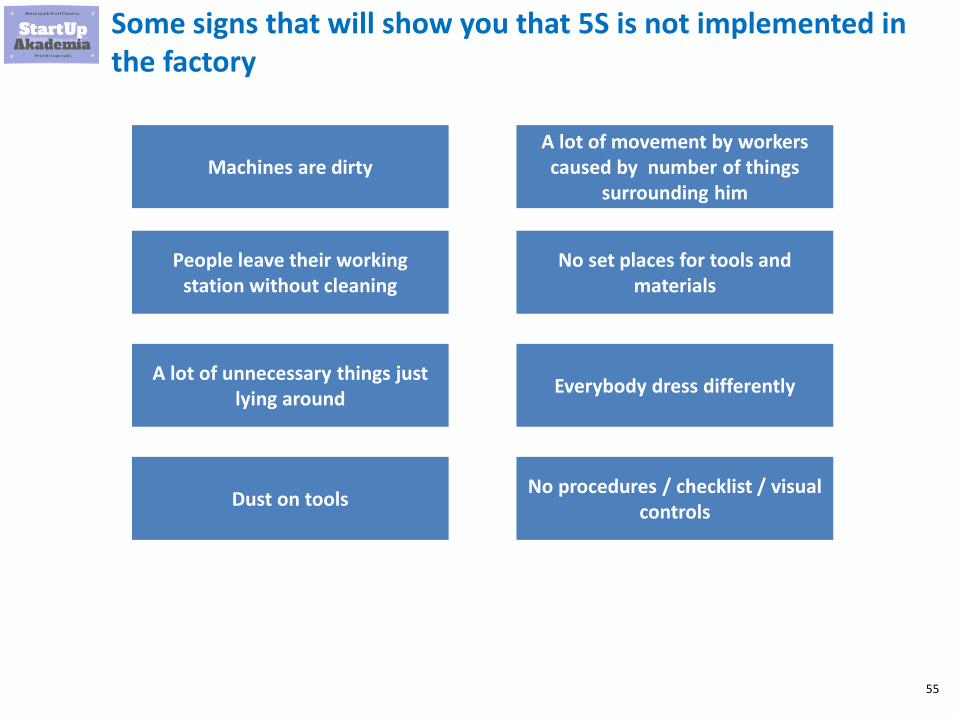
Some signs that will show you that 5S is not implemented in the factory
Machines are dirty
People leave their working station without cleaning
A lot of unnecessary things just lying around
Dust on tools
A lot of movement by workers caused by number of things
surrounding him
No set places for tools and materials
Everybody dress differently
No procedures / checklist / visual controls
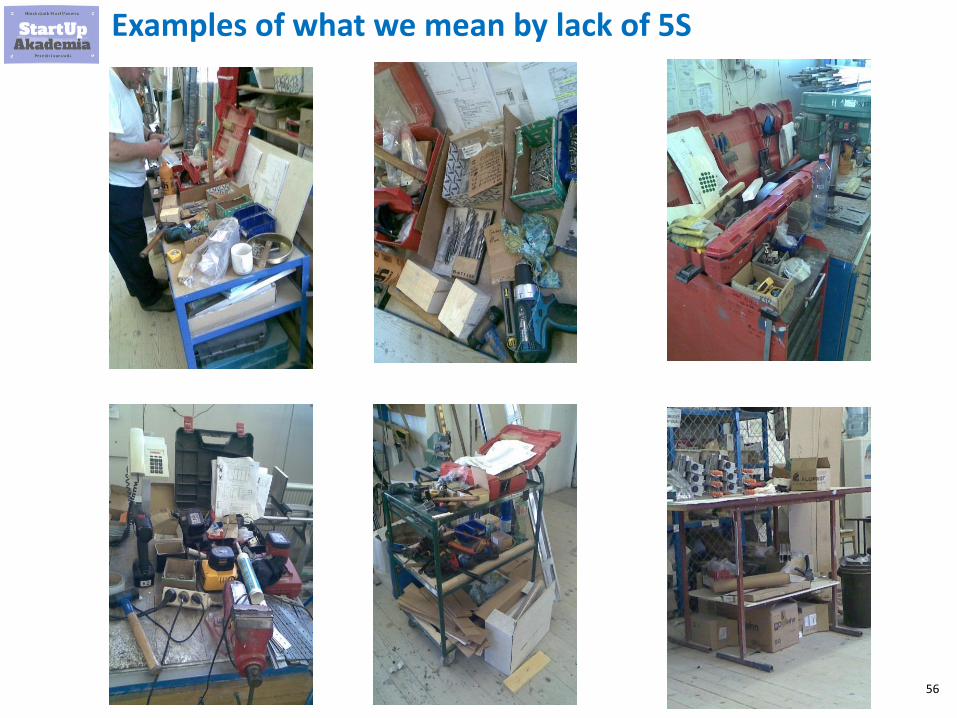
56
Examples of what we mean by lack of 5S

57
Get rid of unused things
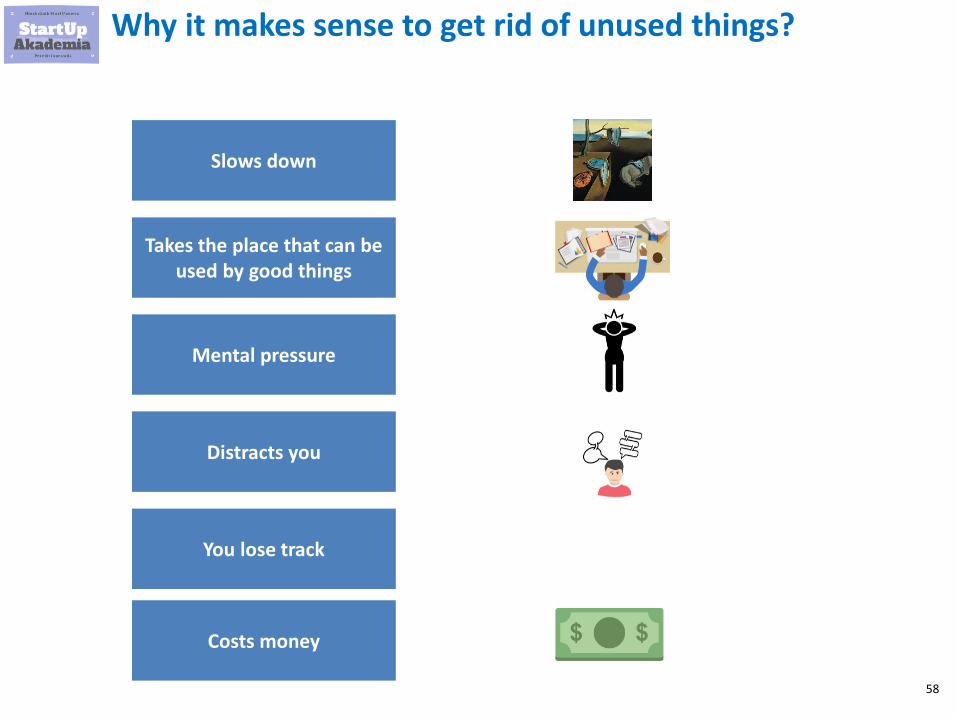
58
Why it makes sense to get rid of unused things?
Slows down
Takes the place that can be used by good things
Mental pressure
Distracts you
You lose track
Costs money
59
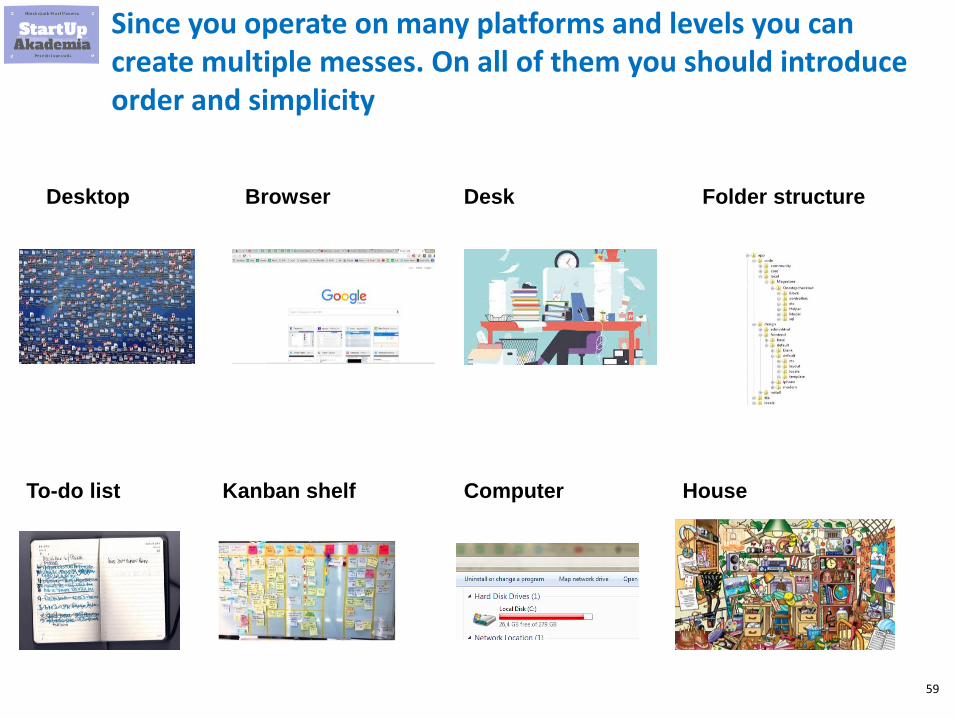
Since you operate on many platforms and levels you can create multiple messes. On all of them you should introduce order and simplicity
Desktop Browser Folder structure
To-do list Kanban shelf House
Desk
Computer

60
Kanban
61
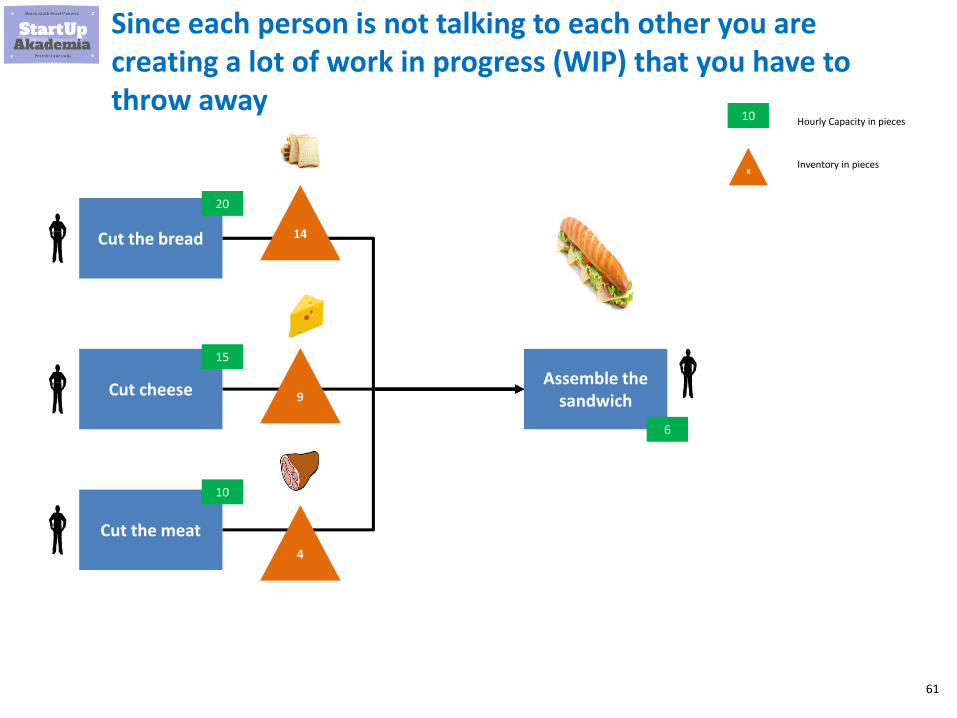
Since each person is not talking to each other you are creating a lot of work in progress (WIP) that you have to throw away
Cut the bread
Cut cheese
Cut the meat
Assemble the sandwich
20
15
10
6
10
X
Hourly Capacity in pieces
Inventory in pieces
14
9
4
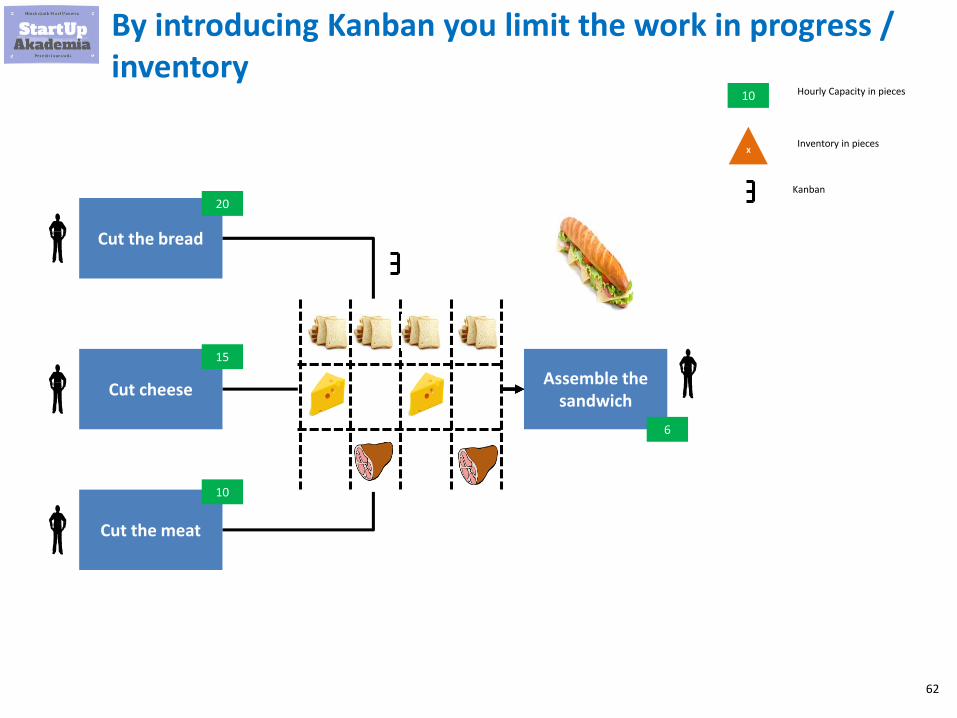
62
By introducing Kanban you limit the work in progress / inventory
Cut the bread
Cut cheese
Cut the meat
Assemble the sandwich
20
15
10
6
10
X
Hourly Capacity in pieces
Inventory in pieces
Kanban
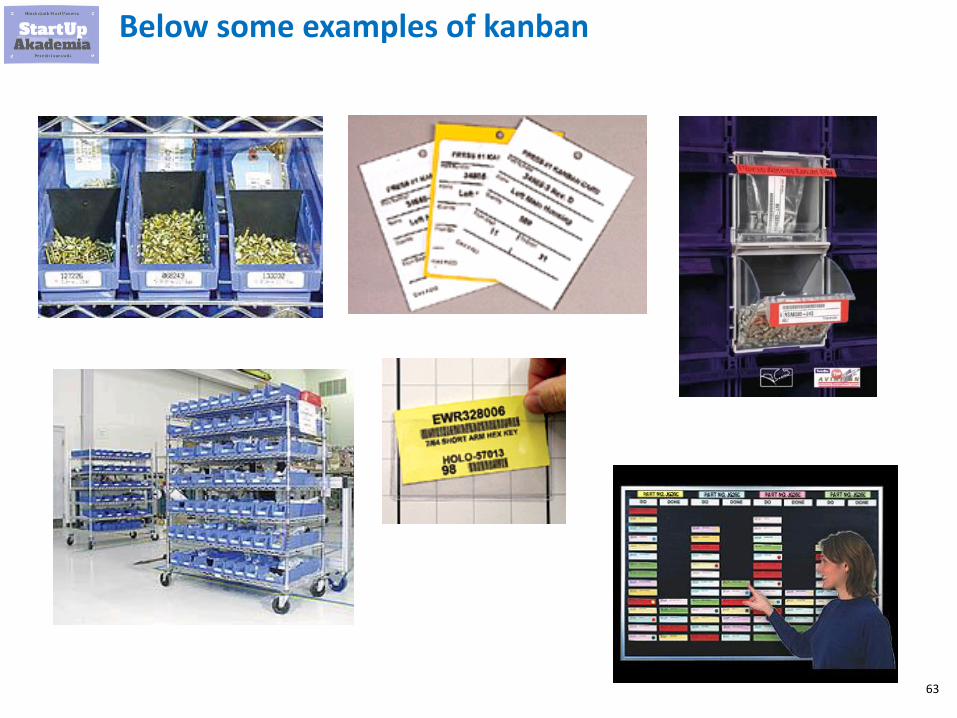
63
Below some examples of kanban

64
Kanban for services
65
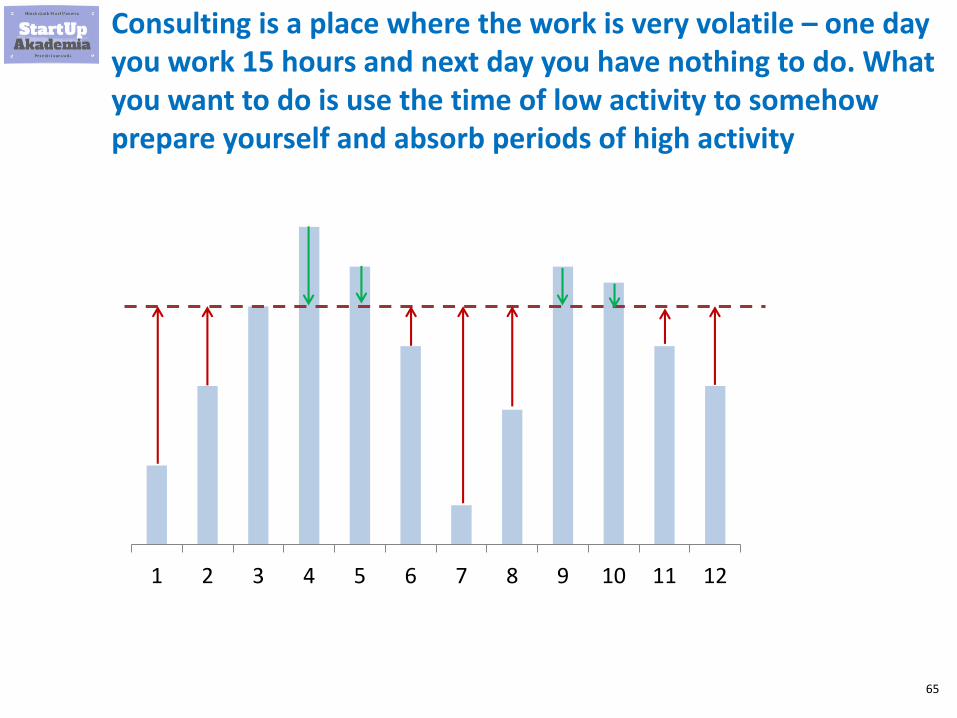
Consulting is a place where the work is very volatile – one day you work 15 hours and next day you have nothing to do. What you want to do is use the time of low activity to somehow prepare yourself and absorb periods of high activity
1 2 3 4 5 6 7 8 9 10 11 12
66
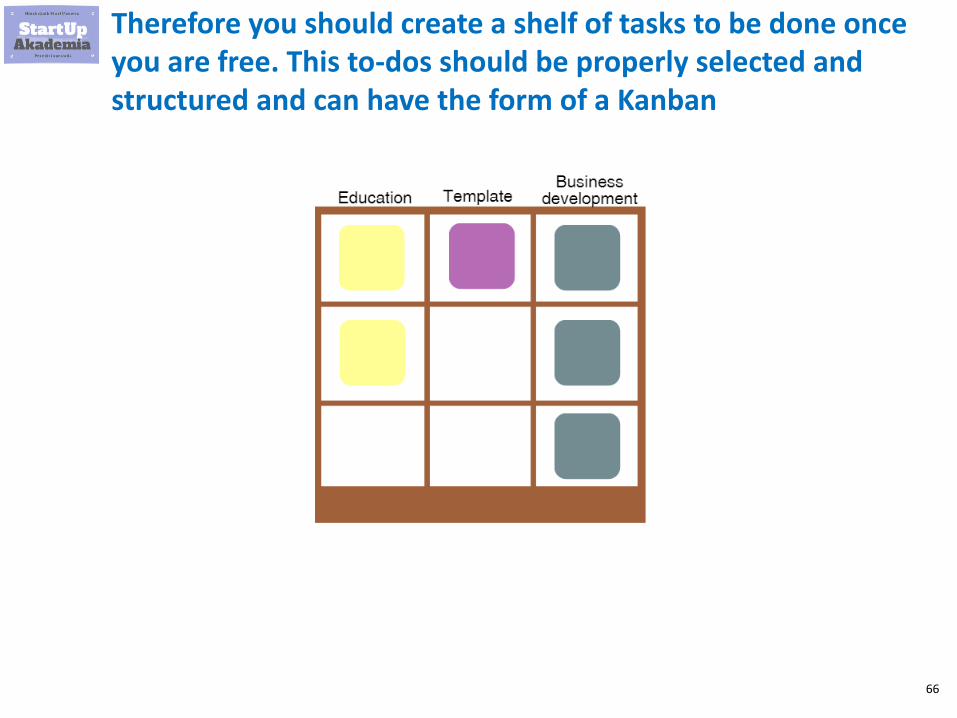
Therefore you should create a shelf of tasks to be done once you are free. This to-dos should be properly selected and structured and can have the form of a Kanban
67
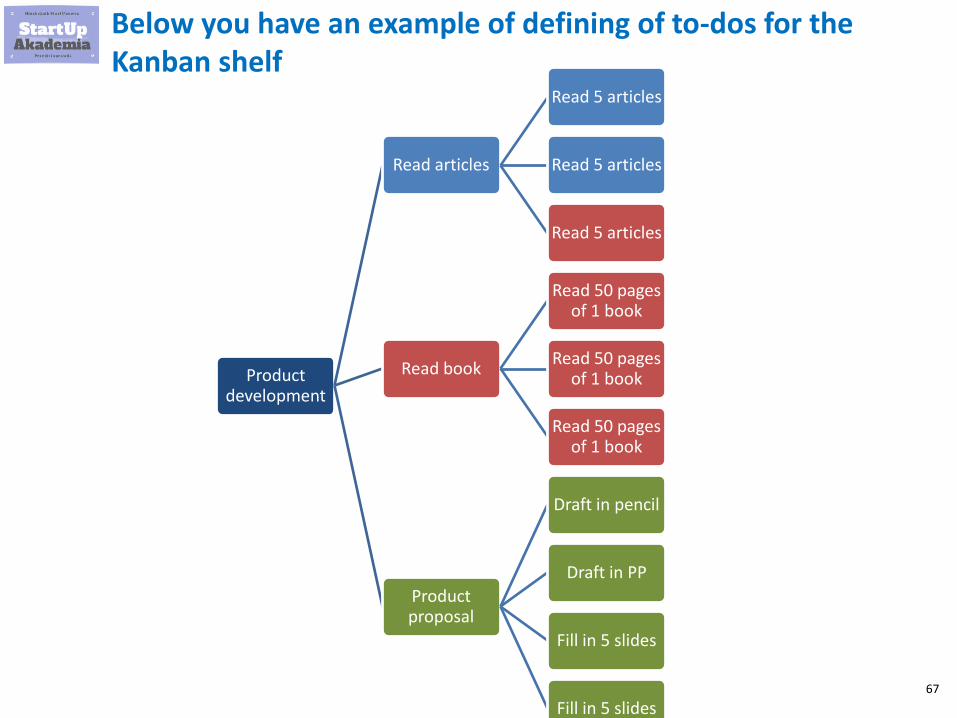
Below you have an example of defining of to-dos for the Kanban shelf
Product development
Read articles
Read 5 articles
Read 5 articles
Read 5 articles
Read book
Read 50 pages of 1 book
Read 50 pages of 1 book
Read 50 pages of 1 book
Product proposal
Draft in pencil
Draft in PP
Fill in 5 slides
Fill in 5 slides
68
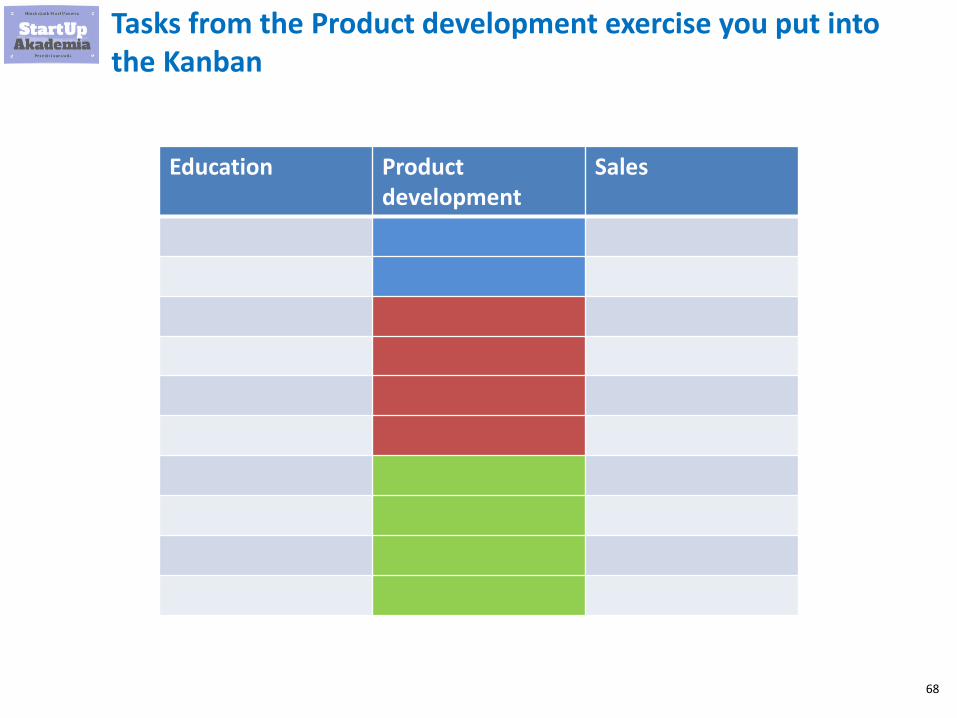
Tasks from the Product development exercise you put into the Kanban
Education Product development
Sales
69
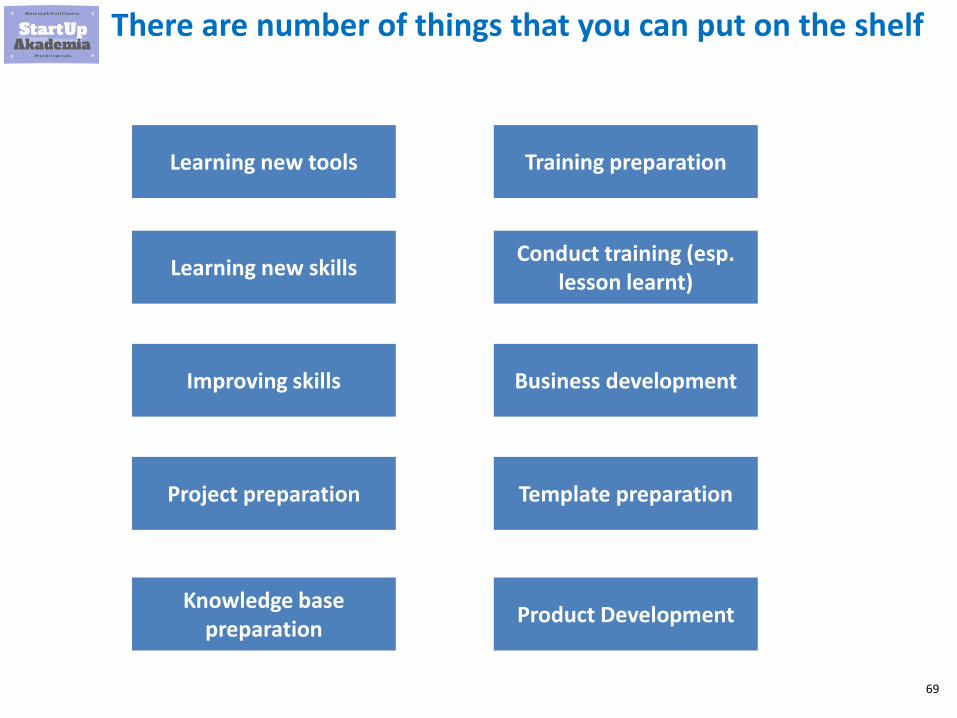
There are number of things that you can put on the shelf
Learning new tools
Learning new skills
Improving skills
Project preparation
Knowledge base preparation
Training preparation
Conduct training (esp. lesson learnt)
Business development
Template preparation
Product Development

70
Zero defect rule
71
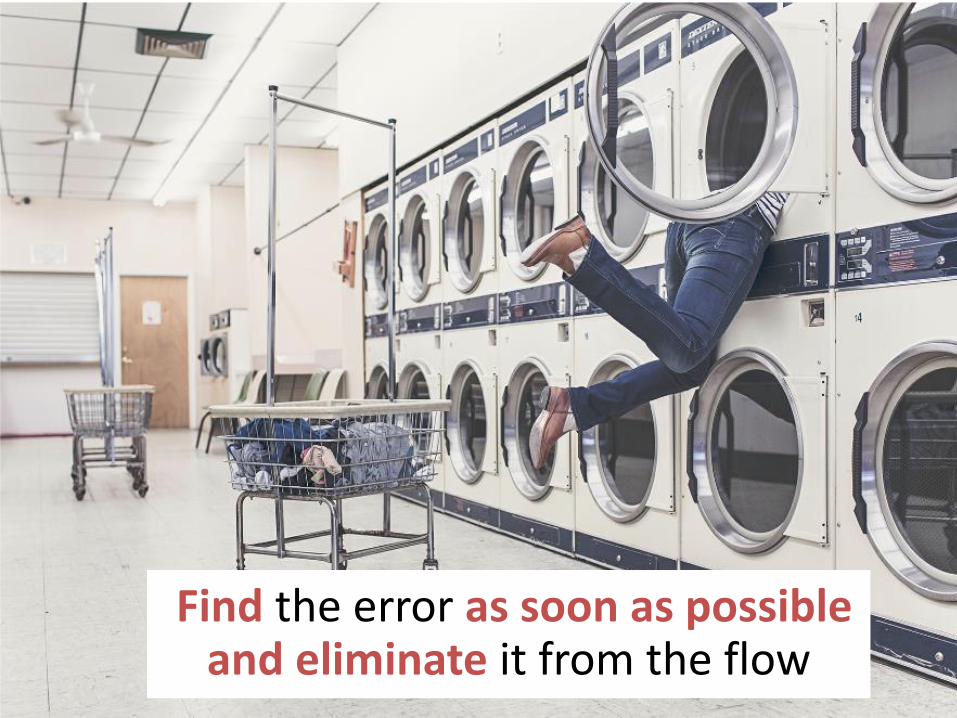
Zero defect rule
Find the error as soon as possible and eliminate it from the flow
72
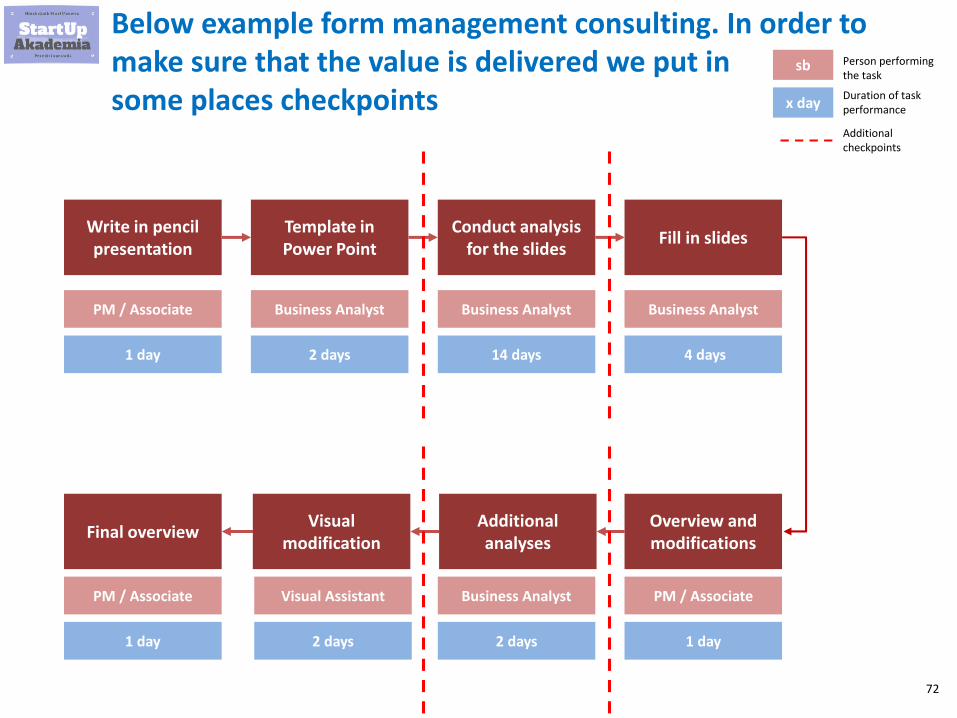
Below example form management consulting. In order to make sure that the value is delivered we put insome places checkpoints
Write in pencil presentation
Template in Power Point
Conduct analysis for the slides
Fill in slides
Person performing the task
Overview and modifications
Additional analyses
Visual modification
Final overview
PM / Associate
1 day
sb
x dayDuration of task performance
Business Analyst
2 days
Business Analyst
14 days
Business Analyst
4 days
PM / Associate
1 day
Business Analyst
2 days
Visual Assistant
2 days
PM / Associate
1 day
Additional checkpoints
73
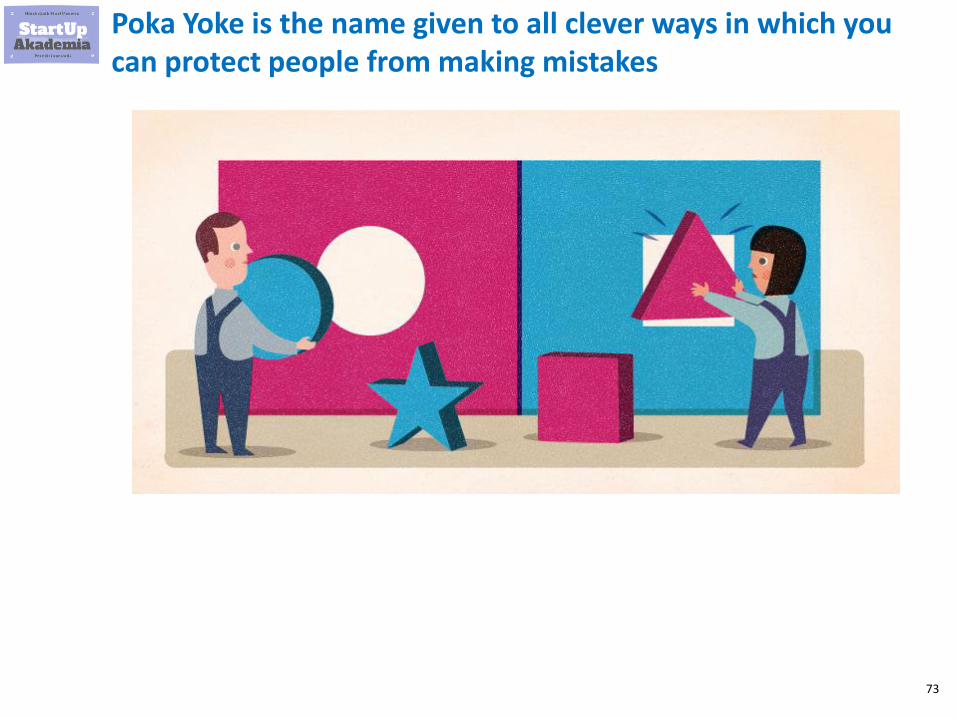
Poka Yoke is the name given to all clever ways in which you can protect people from making mistakes
74
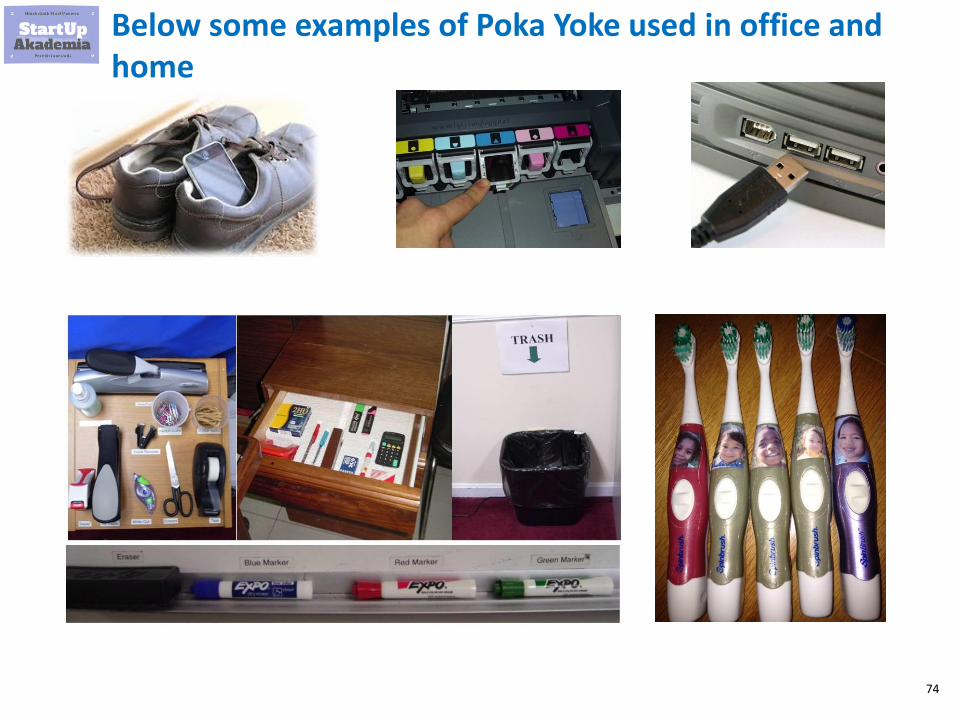
Below some examples of Poka Yoke used in office and home

75
For more examples and templates in Excel go to my on-line course where I show you step by step how to find and estimate improvements in production
Click to check my course
Essential Lean Manufacturing for Management Consultants
$90$10

76
Universal worker
77
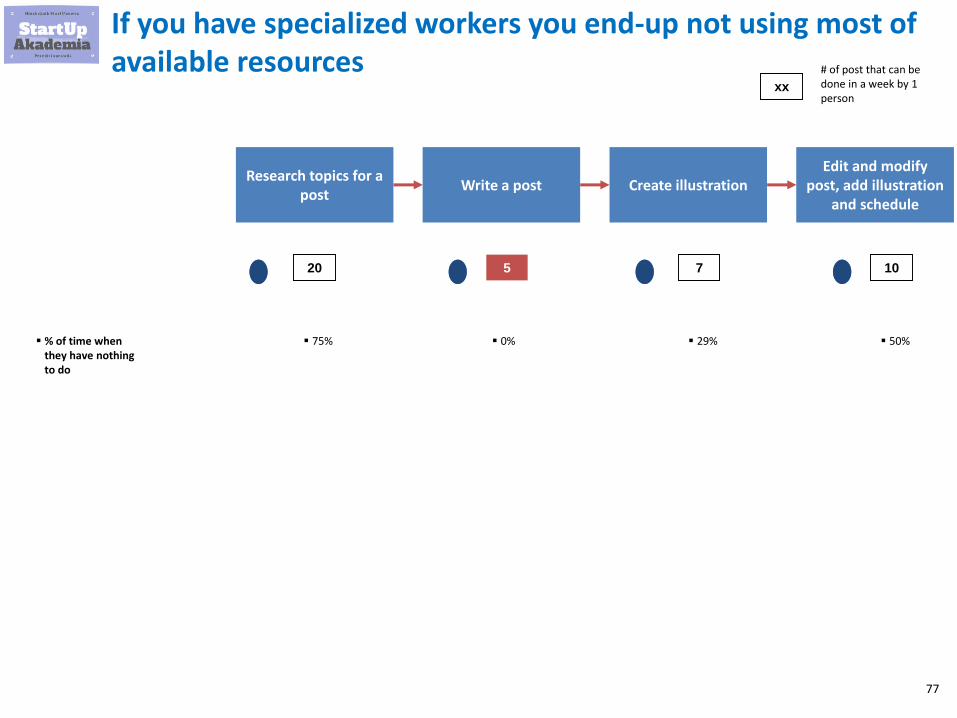
If you have specialized workers you end-up not using most of available resources
Research topics for a post
Write a post Create illustrationEdit and modify
post, add illustration and schedule
20 5 7 10
# of post that can be done in a week by 1 person
xx
▪ 75% ▪ 0% ▪ 29% ▪ 50%▪ % of time when they have nothing to do
78
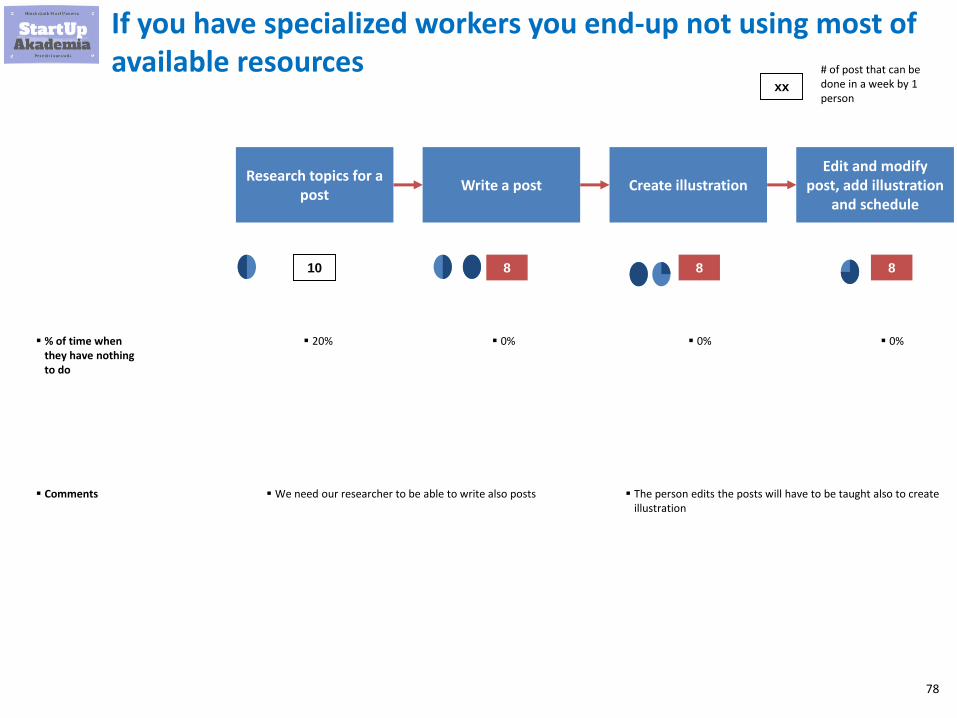
If you have specialized workers you end-up not using most of available resources
Research topics for a post
Write a post Create illustrationEdit and modify
post, add illustration and schedule
10 8 8 8
# of post that can be done in a week by 1 person
xx
▪ 20% ▪ 0% ▪ 0% ▪ 0%▪ % of time when they have nothing to do
▪ Comments ▪ We need our researcher to be able to write also posts ▪ The person edits the posts will have to be taught also to create illustration
79
1 worker - 2 machines
80
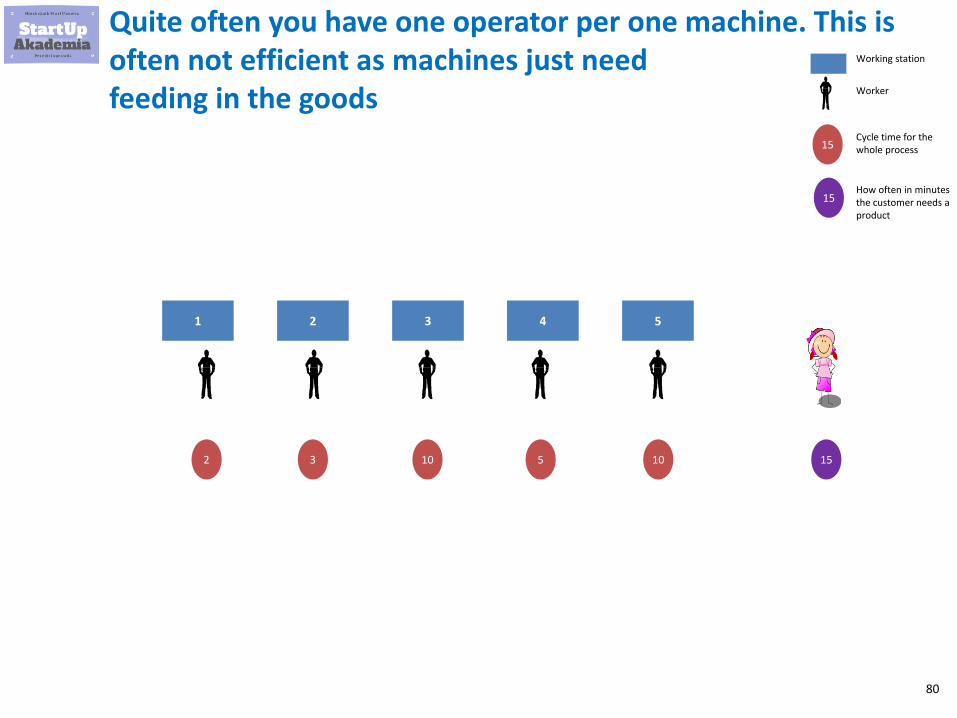
Quite often you have one operator per one machine. This is often not efficient as machines just need feeding in the goods
1 2 3 4 5
2 3 10 5 10 15
Working station
Worker
15
15Cycle time for the whole process
How often in minutes the customer needs a product
81
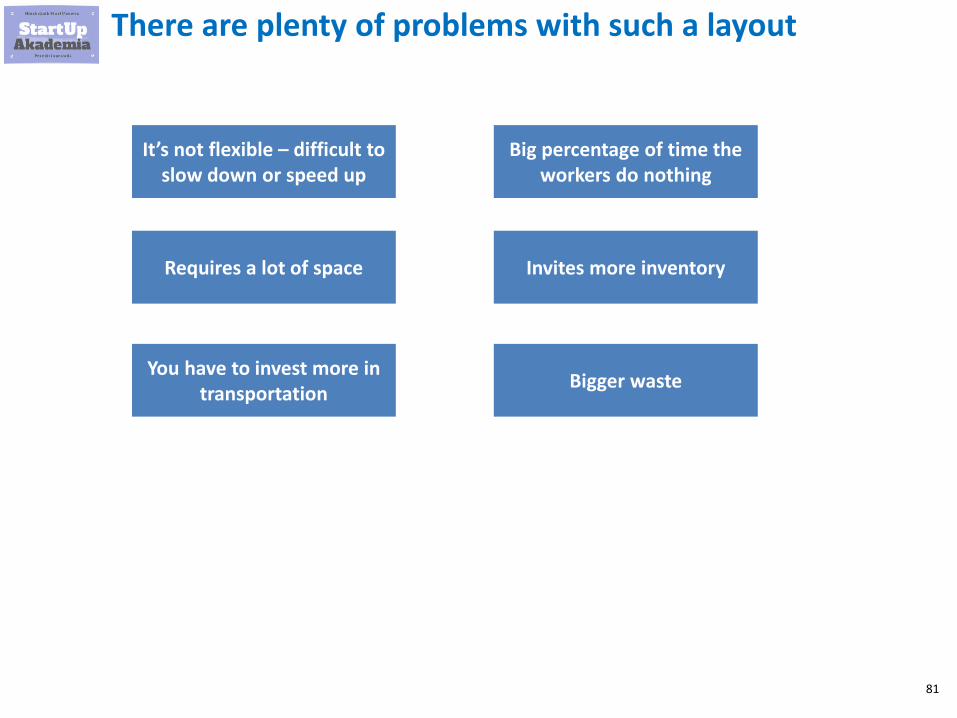
There are plenty of problems with such a layout
It’s not flexible – difficult to slow down or speed up
Requires a lot of space
You have to invest more in transportation
Big percentage of time the workers do nothing
Invites more inventory
Bigger waste
82
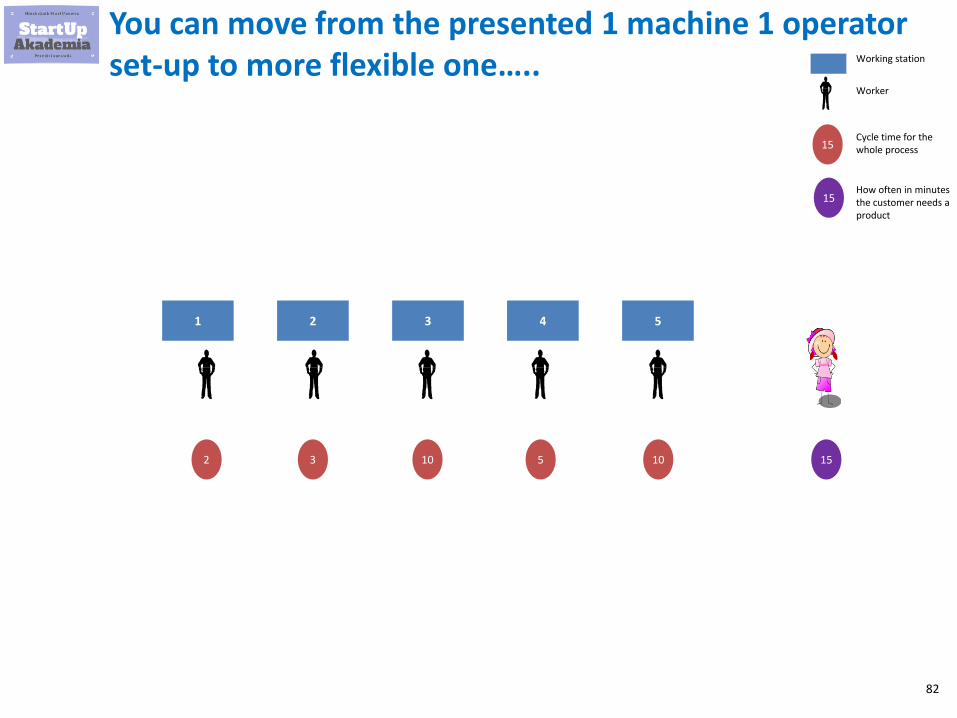
You can move from the presented 1 machine 1 operator set-up to more flexible one…..
1 2 3 4 5
2 3 10 5 10 15
Working station
Worker
15
15Cycle time for the whole process
How often in minutes the customer needs a product
83
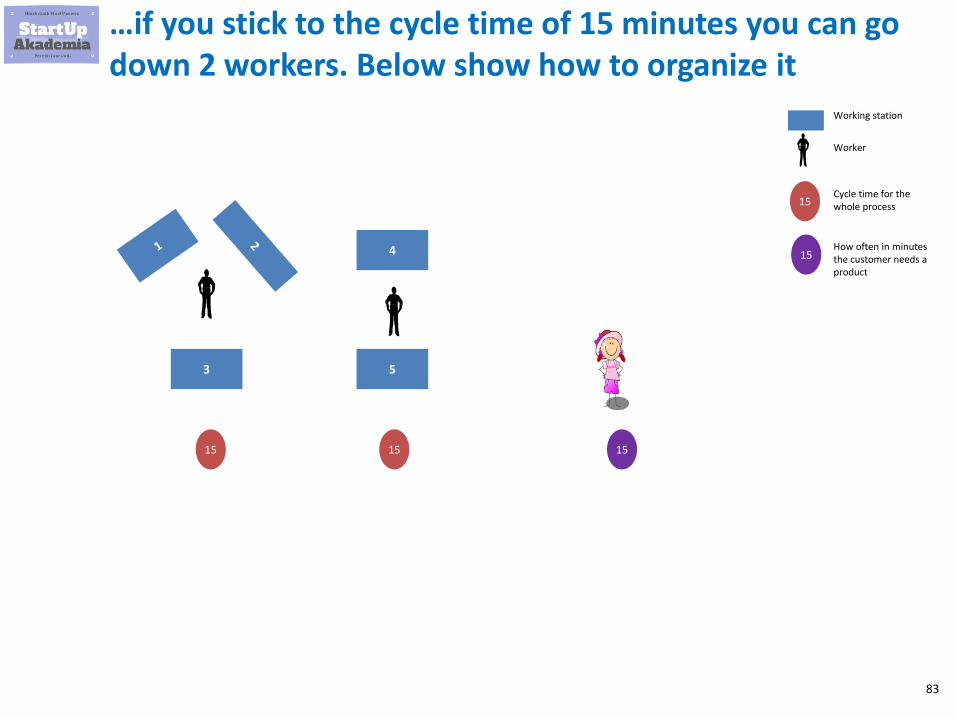
…if you stick to the cycle time of 15 minutes you can go down 2 workers. Below show how to organize it
3
4
5
Working station
Worker
15
15
15
15Cycle time for the whole process
How often in minutes the customer needs a product
15
84
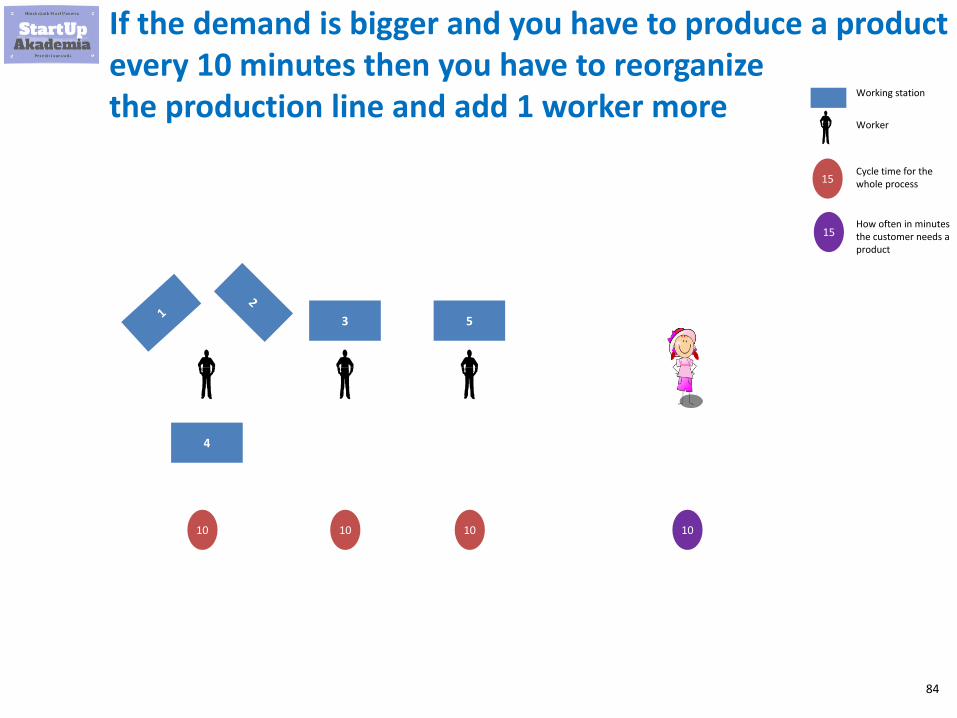
If the demand is bigger and you have to produce a product every 10 minutes then you have to reorganize the production line and add 1 worker more
3
4
5
10 10 10 10
Working station
Worker
15
15Cycle time for the whole process
How often in minutes the customer needs a product
85
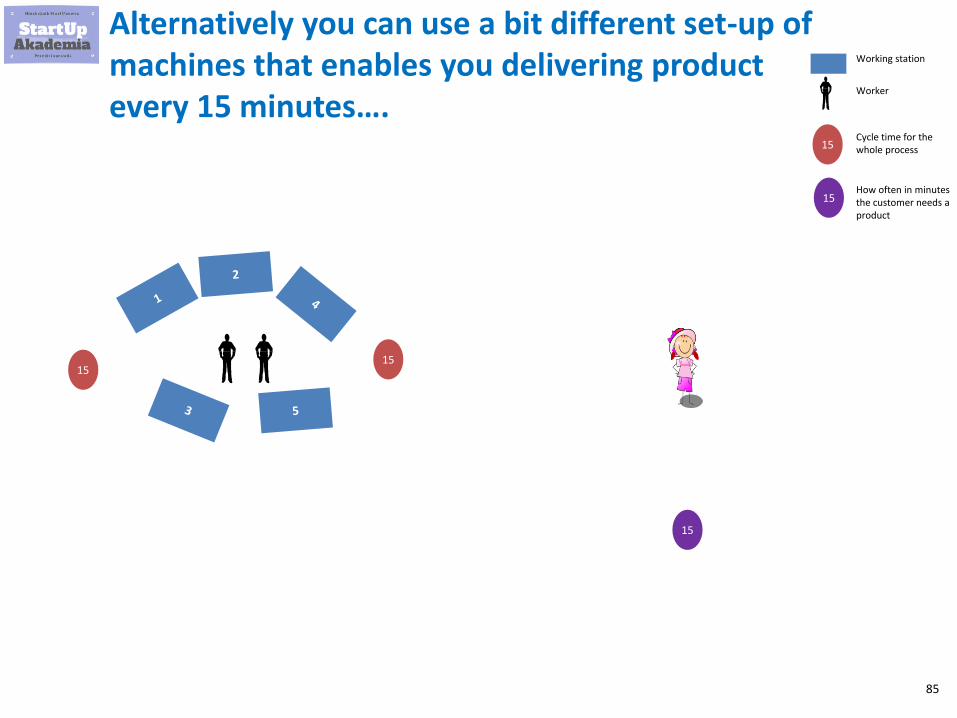
Alternatively you can use a bit different set-up of machines that enables you delivering product every 15 minutes….
1515
15
Working station
Worker
15
15Cycle time for the whole process
How often in minutes the customer needs a product
86
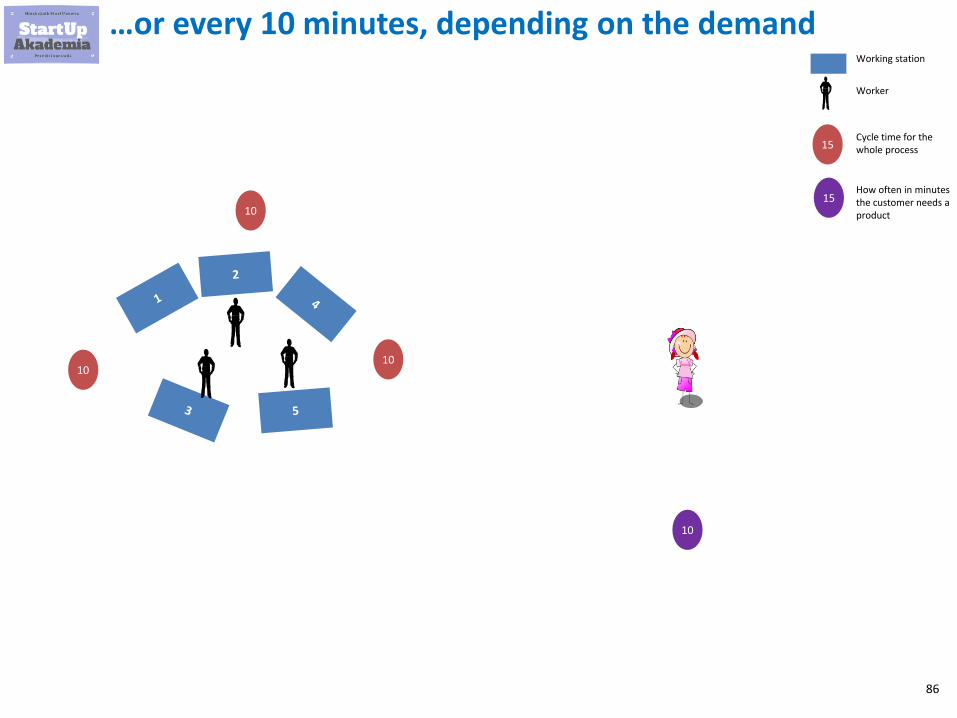
…or every 10 minutes, depending on the demand
1010
10
Working station
Worker
15
15Cycle time for the whole process
How often in minutes the customer needs a product10
87
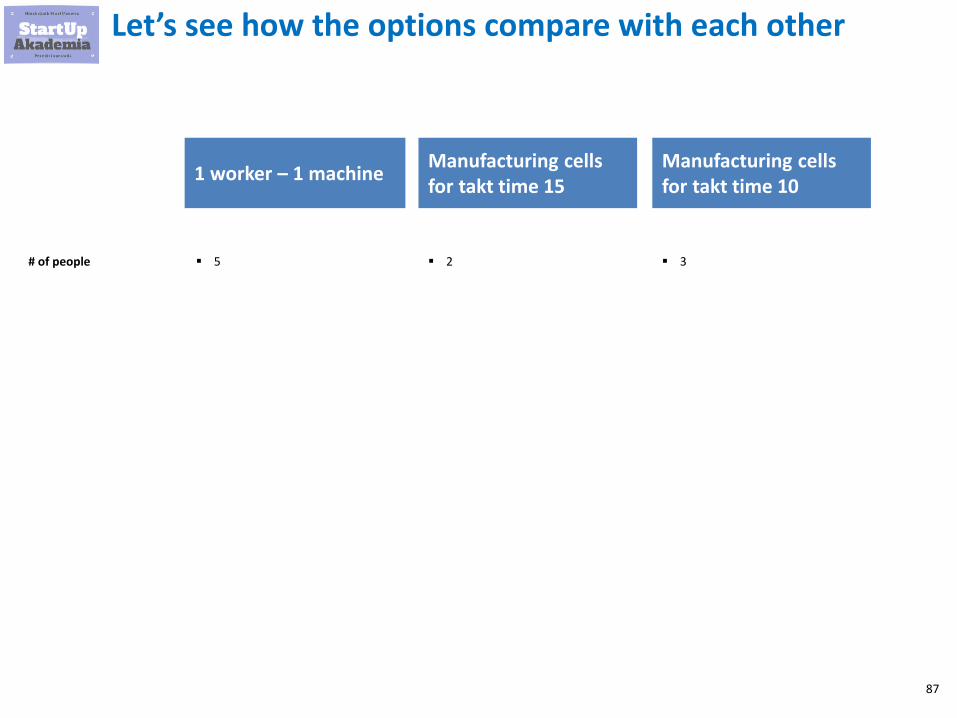
Let’s see how the options compare with each other
1 worker – 1 machineManufacturing cells for takt time 15
▪ 5# of people ▪ 2
Manufacturing cells for takt time 10
▪ 3
88
Advanced methods of improving production

89
OLE
90
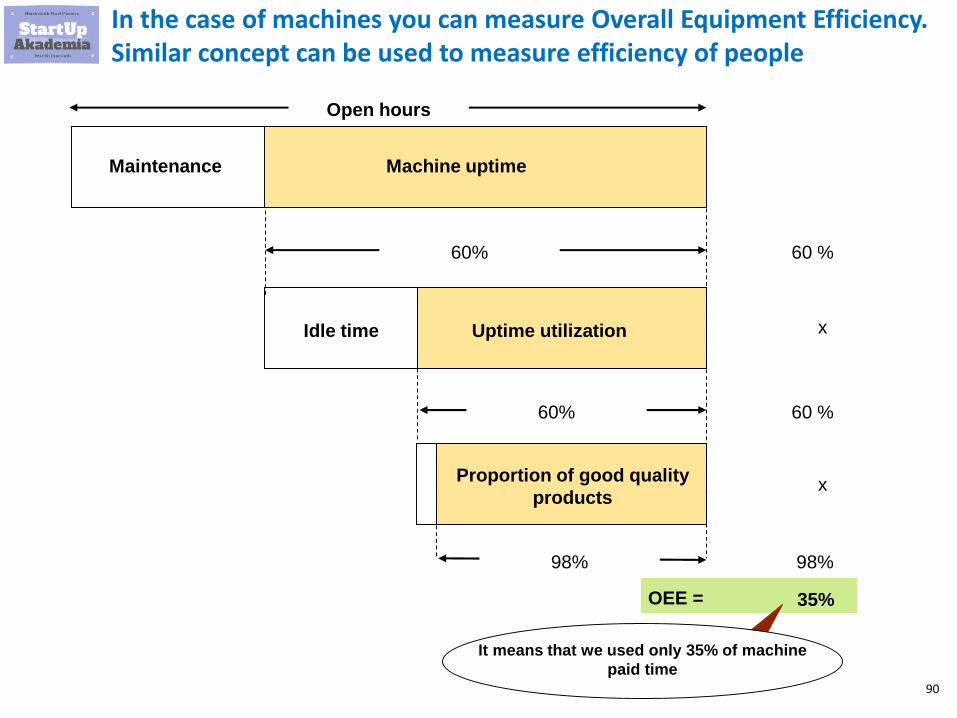
Open hours
Maintenance Machine uptime
Uptime utilizationIdle time
60%
60%
OEE =
60 %
60 %
x
x
98%
Proportion of good quality
products
98%
35%
It means that we used only 35% of machine
paid time
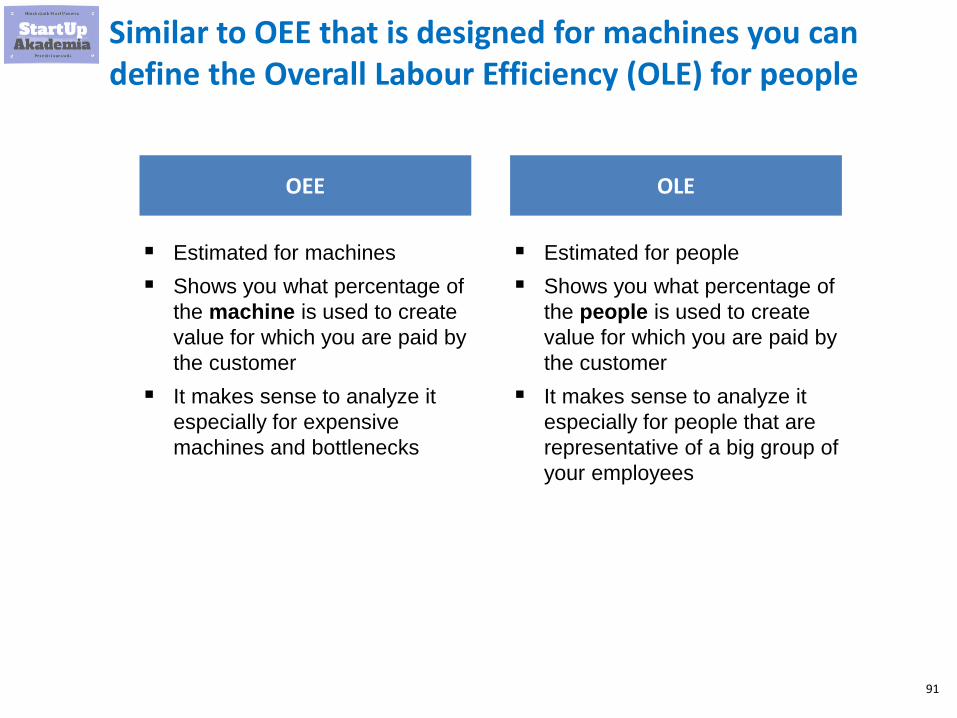
In the case of machines you can measure Overall Equipment Efficiency. Similar concept can be used to measure efficiency of people
91
Similar to OEE that is designed for machines you can define the Overall Labour Efficiency (OLE) for people
▪ Estimated for machines
▪ Shows you what percentage of
the machine is used to create
value for which you are paid by
the customer
▪ It makes sense to analyze it
especially for expensive
machines and bottlenecks
OEE
▪ Estimated for people
▪ Shows you what percentage of
the people is used to create
value for which you are paid by
the customer
▪ It makes sense to analyze it
especially for people that are
representative of a big group of
your employees
OLE

92
Waste analysis
93
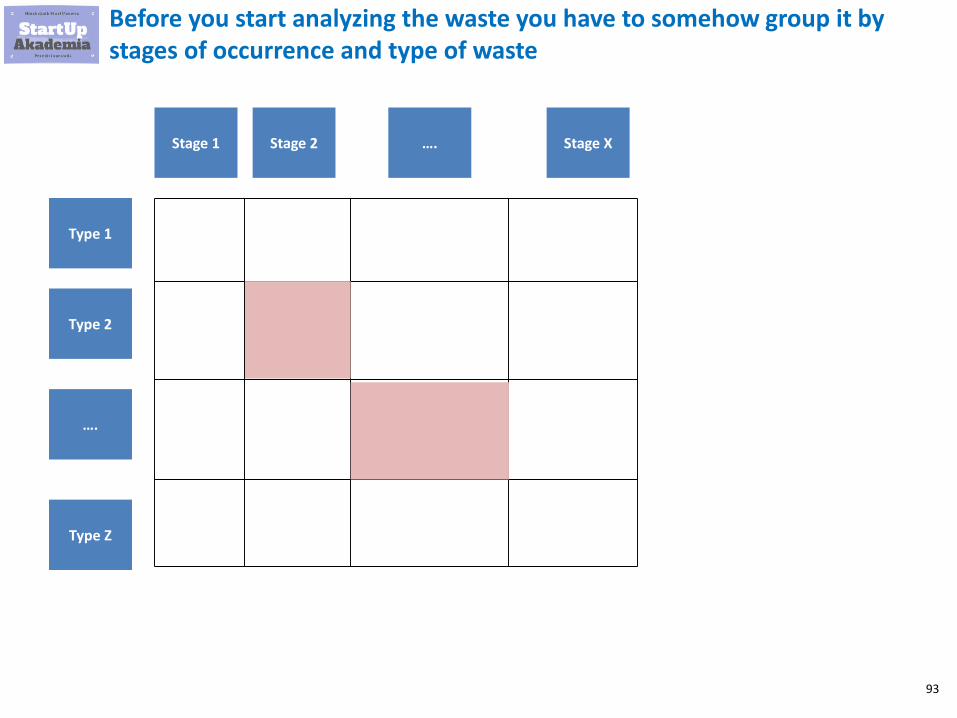
Before you start analyzing the waste you have to somehow group it by stages of occurrence and type of waste
Type 1
Type 2
Type Z
Stage 1 Stage 2 Stage X….
….
94
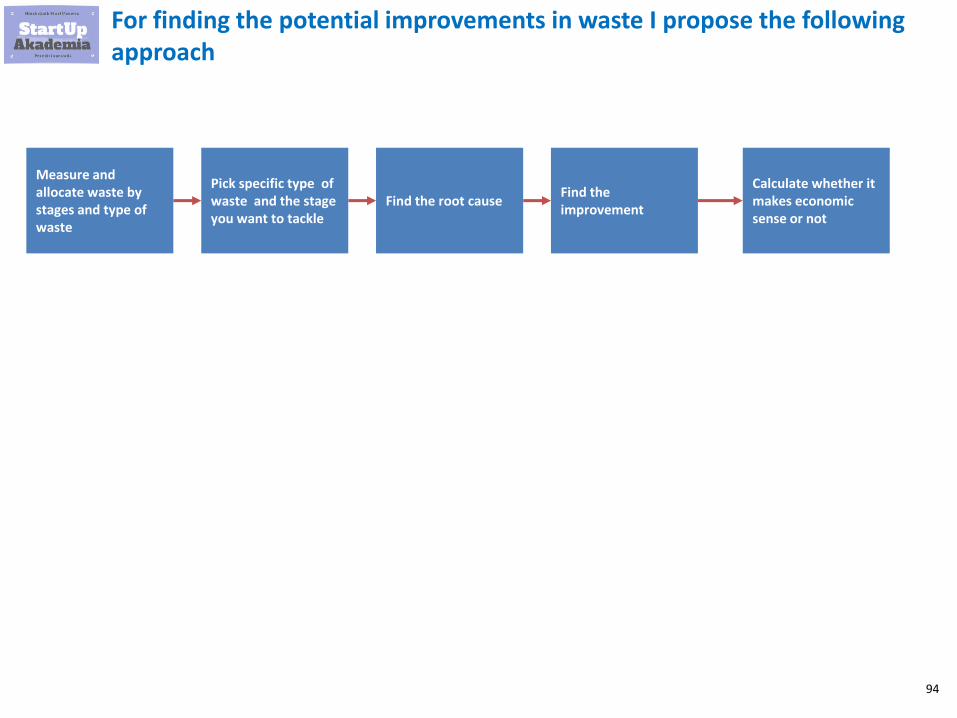
For finding the potential improvements in waste I propose the following approach
Measure and allocate waste by stages and type of waste
Pick specific type of waste and the stage you want to tackle
Find the root causeFind the improvement
Calculate whether it makes economic sense or not
95
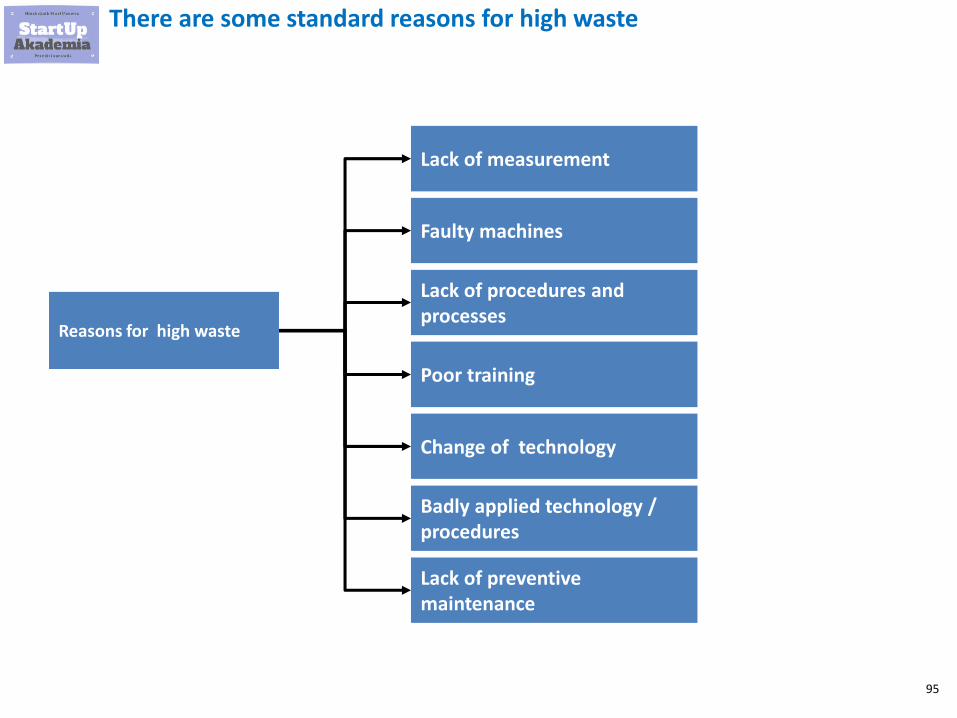
There are some standard reasons for high waste
Reasons for high waste
Faulty machines
Lack of procedures and processes
Poor training
Lack of measurement
Change of technology
Lack of preventive maintenance
Badly applied technology / procedures

96
Set-ups
97
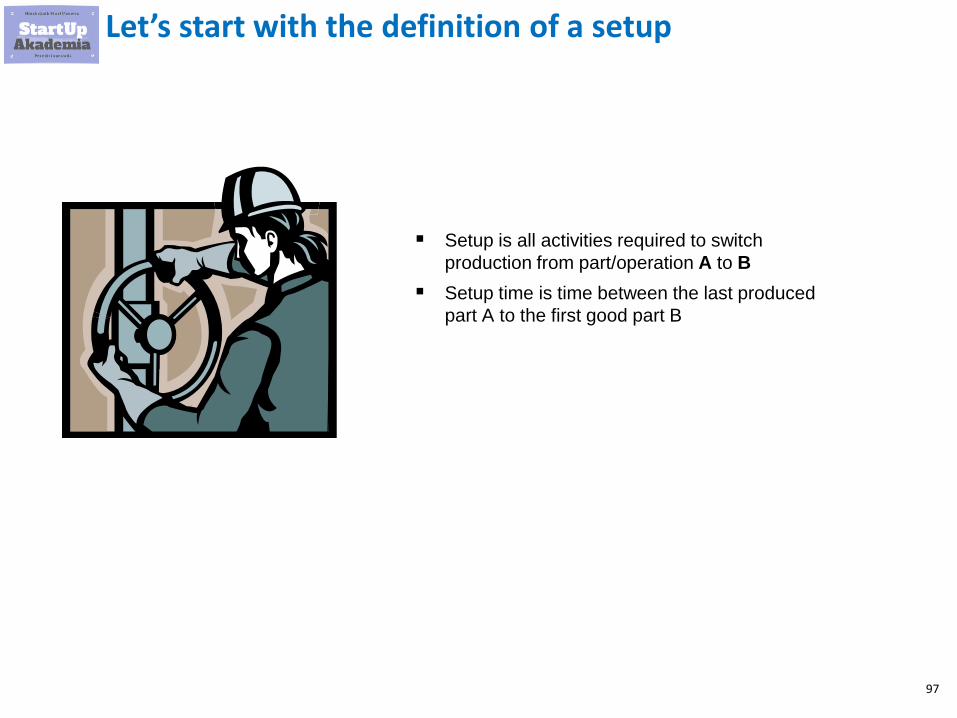
Let’s start with the definition of a setup
▪ Setup is all activities required to switch
production from part/operation A to B
▪ Setup time is time between the last produced
part A to the first good part B
98
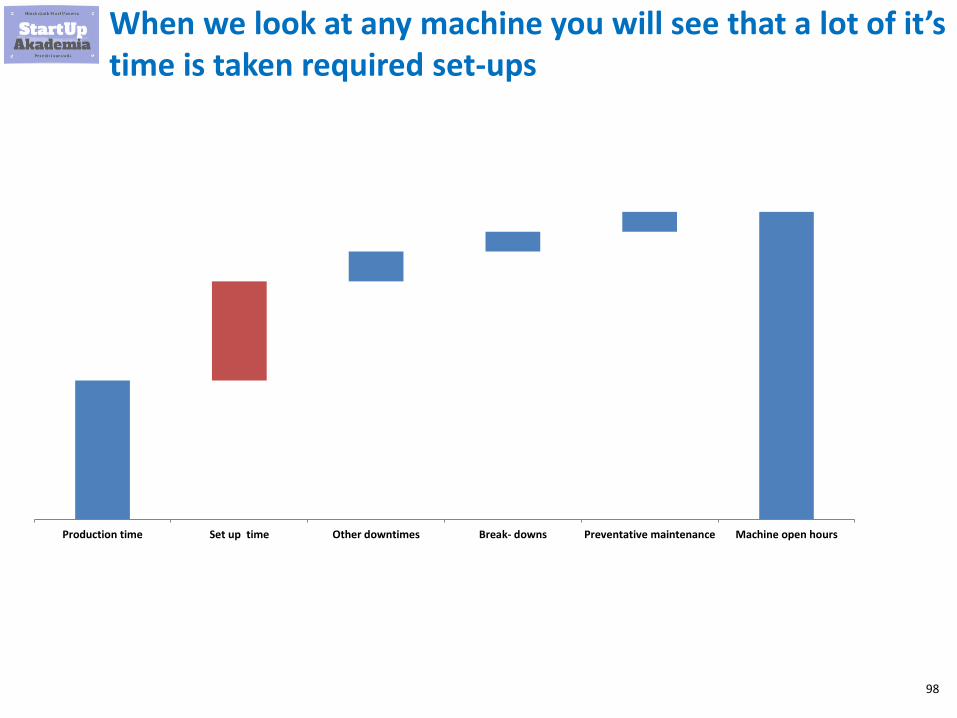
When we look at any machine you will see that a lot of it’s time is taken required set-ups
Production time Set up time Other downtimes Break- downs Preventative maintenance Machine open hours
99
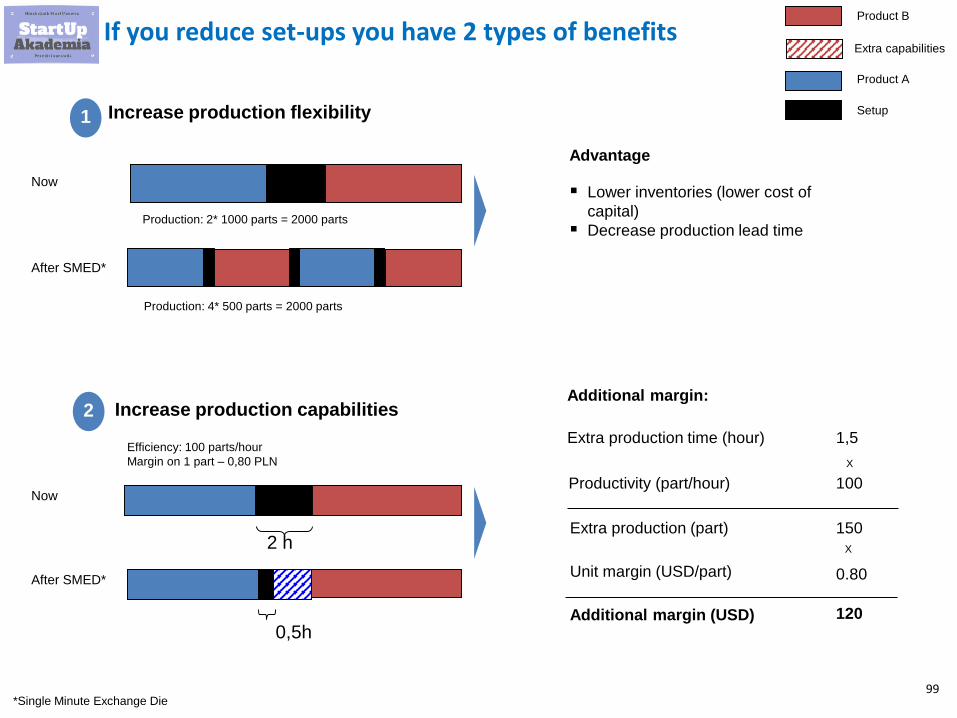
If you reduce set-ups you have 2 types of benefits
1
2 Increase production capabilities
Increase production flexibility
Now
After SMED*
Efficiency: 100 parts/hour
Margin on 1 part – 0,80 PLN
2 h
0,5h
Product A
Product B
Setup
Extra capabilities
Additional margin:
Extra production time (hour)
Productivity (part/hour)
Extra production (part)
Unit margin (USD/part)
1,5
100
150
0.80
Additional margin (USD) 120
X
X
Now
After SMED*
▪ Lower inventories (lower cost of
capital)
▪ Decrease production lead time
Advantage
Production: 2* 1000 parts = 2000 parts
Production: 4* 500 parts = 2000 parts
*Single Minute Exchange Die
100
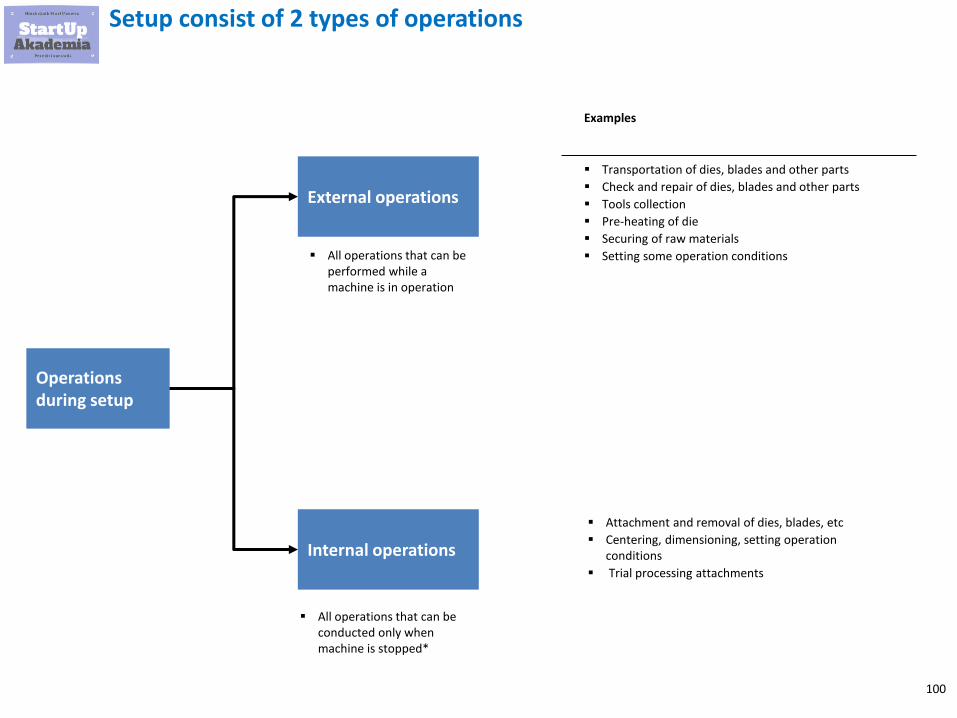
Setup consist of 2 types of operations
▪ Transportation of dies, blades and other parts
▪ Check and repair of dies, blades and other parts
▪ Tools collection
▪ Pre-heating of die
▪ Securing of raw materials
▪ Setting some operation conditions
▪ Attachment and removal of dies, blades, etc
▪ Centering, dimensioning, setting operation conditions
▪ Trial processing attachments
Operations during setup
Internal operations
External operations
▪ All operations that can be performed while a machine is in operation
▪ All operations that can be conducted only when machine is stopped*
Examples

101
For more examples and templates in Excel go to my on-line course where I show you step by step how to find and estimate improvements in production
Click to check my course
Essential Lean Manufacturing for Management Consultants
$90$10
102
SMED - Introduction
103
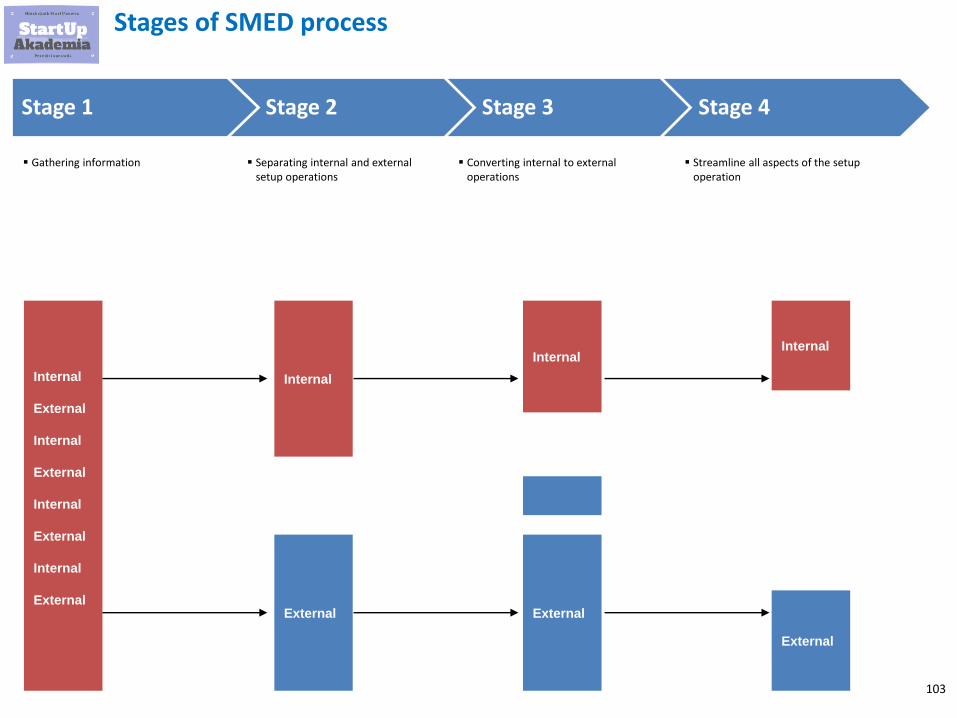
Stages of SMED process
Internal
External
Internal
Internal
External
Internal
External
Internal
External
Internal
ExternalExternal
Internal
External
Stage 1 Stage 2 Stage 3 Stage 4
▪ Gathering information ▪ Separating internal and external setup operations
▪ Converting internal to external operations
▪ Streamline all aspects of the setup operation
104
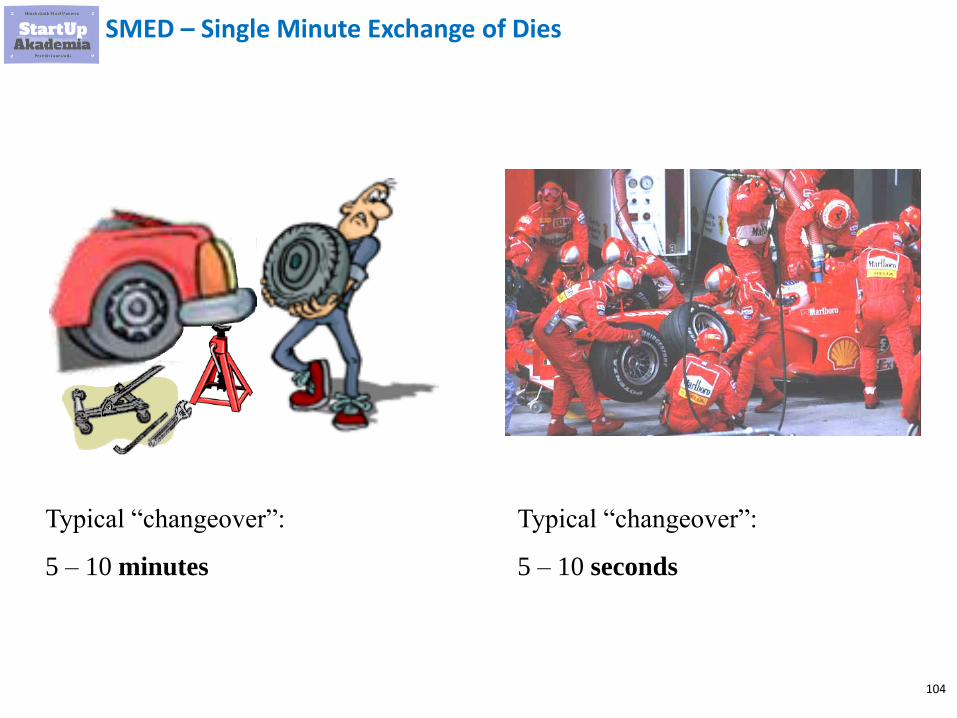
SMED – Single Minute Exchange of Dies
Typical “changeover”:
5 – 10 minutes
Typical “changeover”:
5 – 10 seconds
105
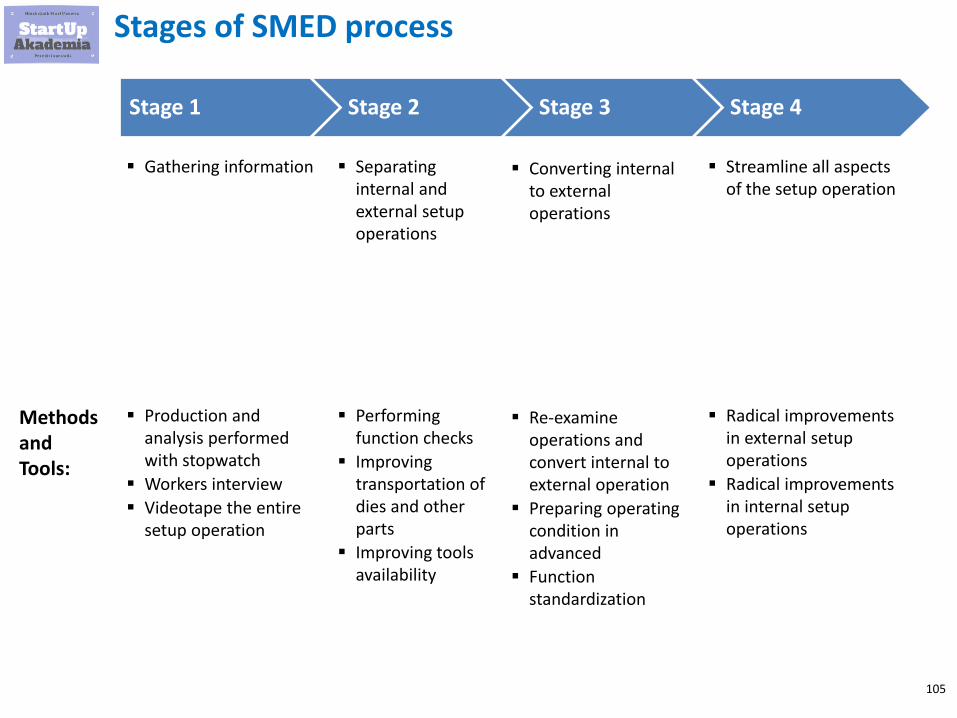
Stages of SMED process
Stage 1 Stage 2 Stage 3 Stage 4
▪ Gathering information ▪ Separating internal and external setup operations
▪ Converting internal to external operations
▪ Streamline all aspects of the setup operation
▪ Production and analysis performed with stopwatch
▪ Workers interview
▪ Videotape the entire setup operation
▪ Performing function checks
▪ Improving transportation of dies and other parts
▪ Improving tools availability
▪ Re-examine operations and convert internal to external operation
▪ Preparing operating condition in advanced
▪ Function standardization
▪ Radical improvements in external setup operations
▪ Radical improvements in internal setup operations
Methods and Tools:
106
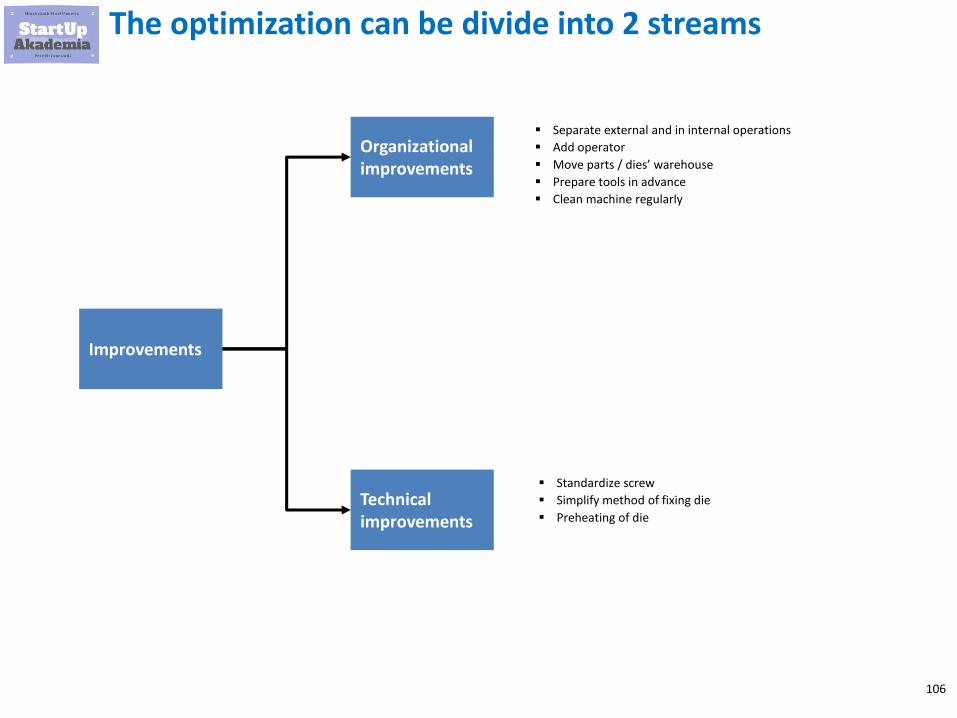
The optimization can be divide into 2 streams
▪ Separate external and in internal operations
▪ Add operator
▪ Move parts / dies’ warehouse
▪ Prepare tools in advance
▪ Clean machine regularly
▪ Standardize screw
▪ Simplify method of fixing die
▪ Preheating of die
Improvements
Technical improvements
Organizational improvements

107
TPM
108
Apart from production people you will have a lot of so called maintenance guys that are fixing the machines
3
4
5
Working station
Worker
15
15
15
15Cycle time for the whole process
How often in minutes the customer needs a product
15
Maintenance
109
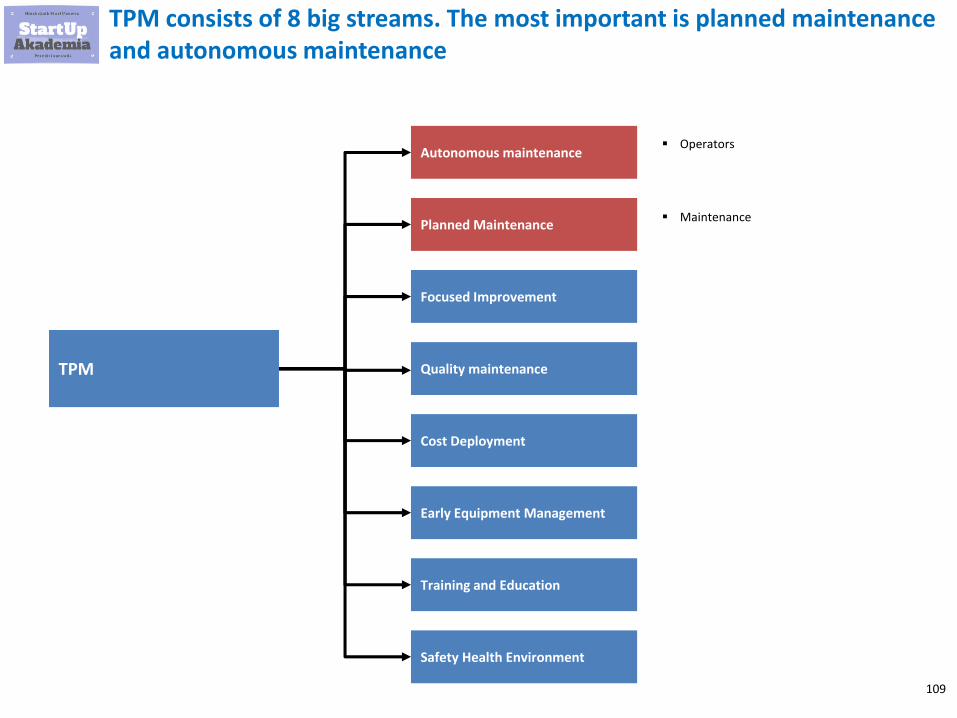
TPM consists of 8 big streams. The most important is planned maintenance and autonomous maintenance
TPM
Planned Maintenance
Focused Improvement
Quality maintenance
Autonomous maintenance
Cost Deployment
Training and Education
Early Equipment Management
▪ Operators
▪ Maintenance
Safety Health Environment
110
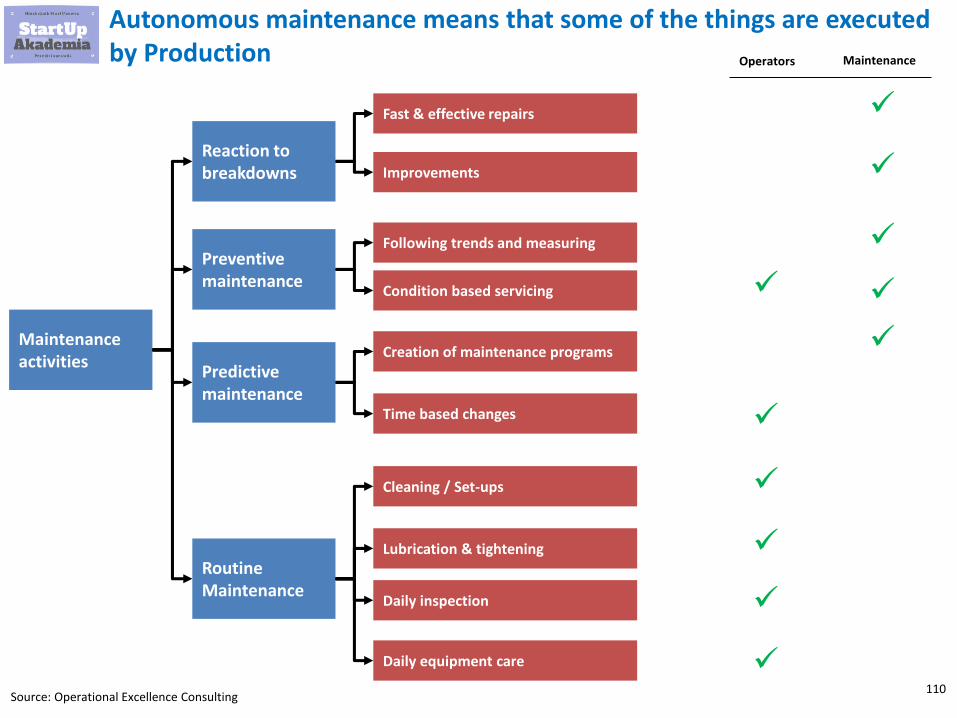
Autonomous maintenance means that some of the things are executed by Production
Maintenance activities
Routine Maintenance
Reaction to breakdowns
Preventive maintenance
Predictive maintenance
Cleaning / Set-ups
Lubrication & tightening
Daily inspection
Daily equipment care
Creation of maintenance programs
Time based changes
Following trends and measuring
Condition based servicing
Fast & effective repairs
Improvements
Operators Maintenance
Source: Operational Excellence Consulting
✓
✓
✓
✓
✓
✓
✓
✓
✓
✓
✓
111
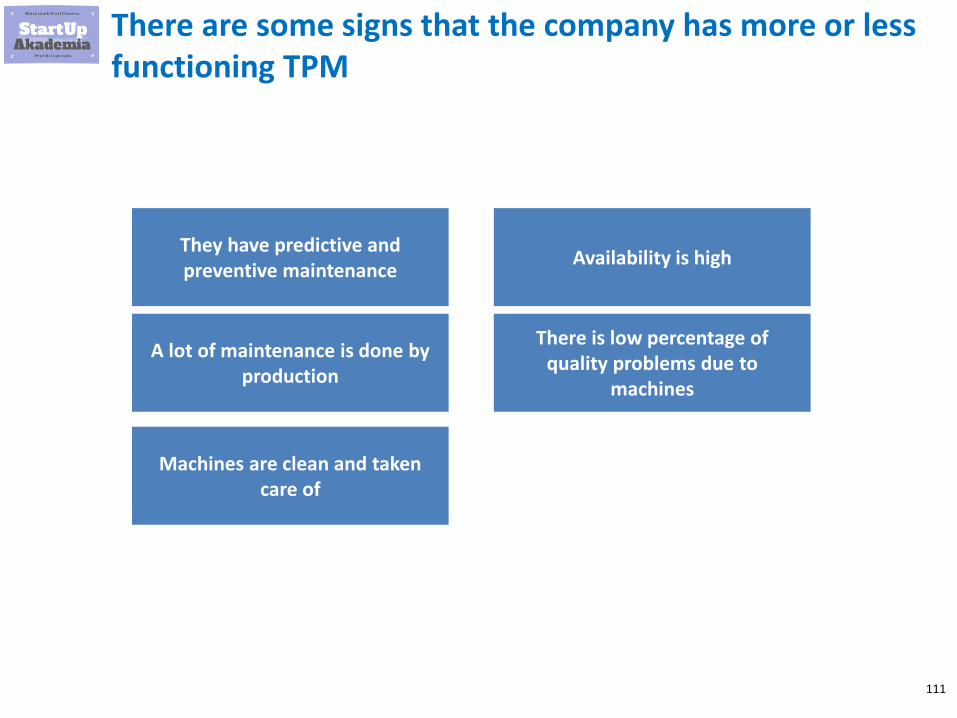
There are some signs that the company has more or less functioning TPM
They have predictive and preventive maintenance
A lot of maintenance is done by production
Machines are clean and taken care of
Availability is high
There is low percentage of quality problems due to
machines

112
Automation
113
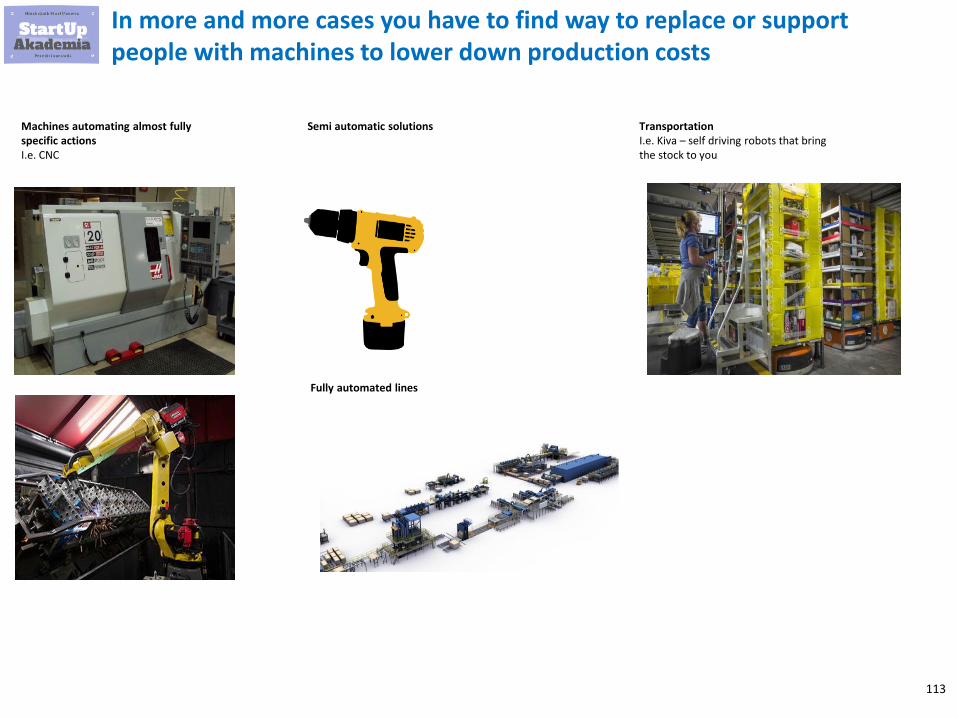
In more and more cases you have to find way to replace or support people with machines to lower down production costs
Machines automating almost fully specific actionsI.e. CNC
TransportationI.e. Kiva – self driving robots that bring the stock to you
Semi automatic solutions
Fully automated lines
114
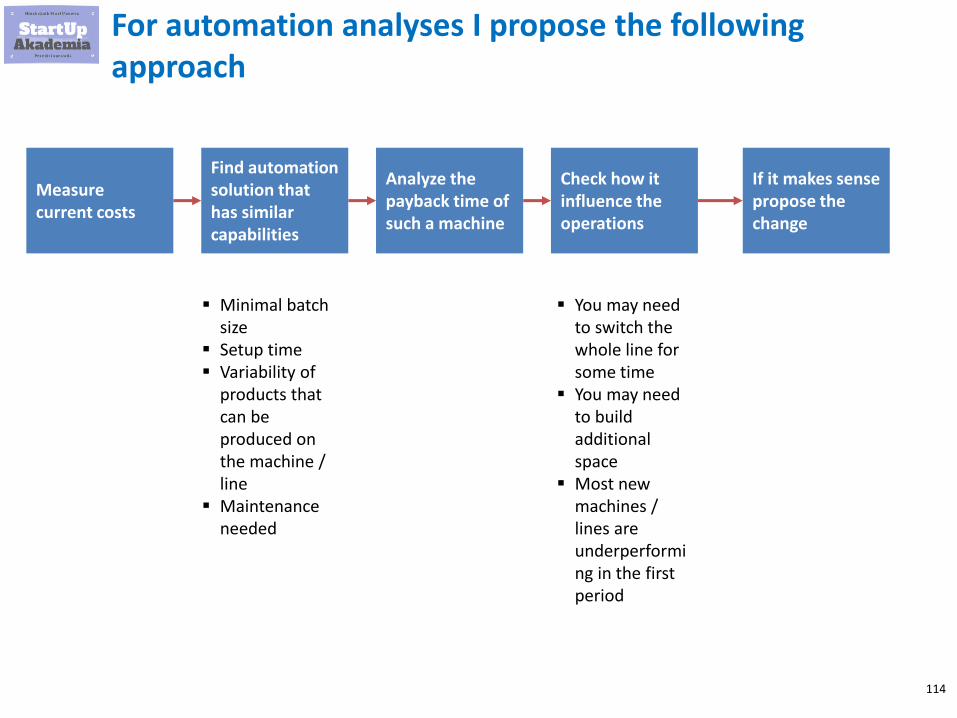
For automation analyses I propose the following approach
Measure current costs
Find automation solution that has similar capabilities
Analyze the payback time of such a machine
Check how it influence the operations
If it makes sense propose the change
▪ Minimal batch size
▪ Setup time▪ Variability of
products that can be produced on the machine / line
▪ Maintenance needed
▪ You may need to switch the whole line for some time
▪ You may need to build additional space
▪ Most new machines / lines are underperforming in the first period
115
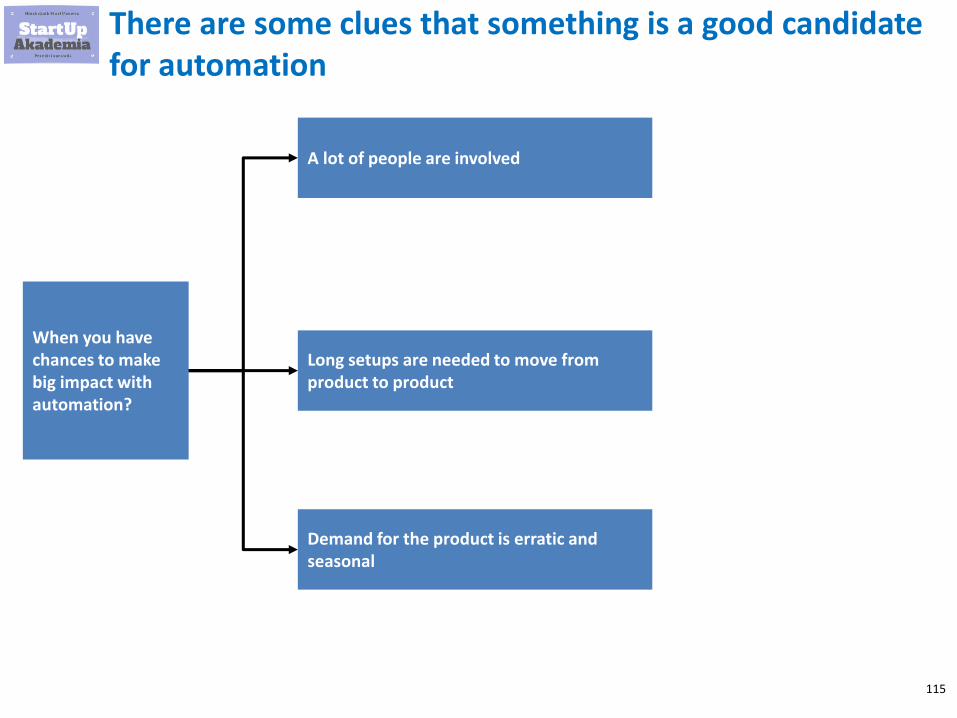
There are some clues that something is a good candidate for automation
When you have chances to make big impact with automation?
Demand for the product is erratic and seasonal
A lot of people are involved
Long setups are needed to move from product to product
116
Critical chain
117
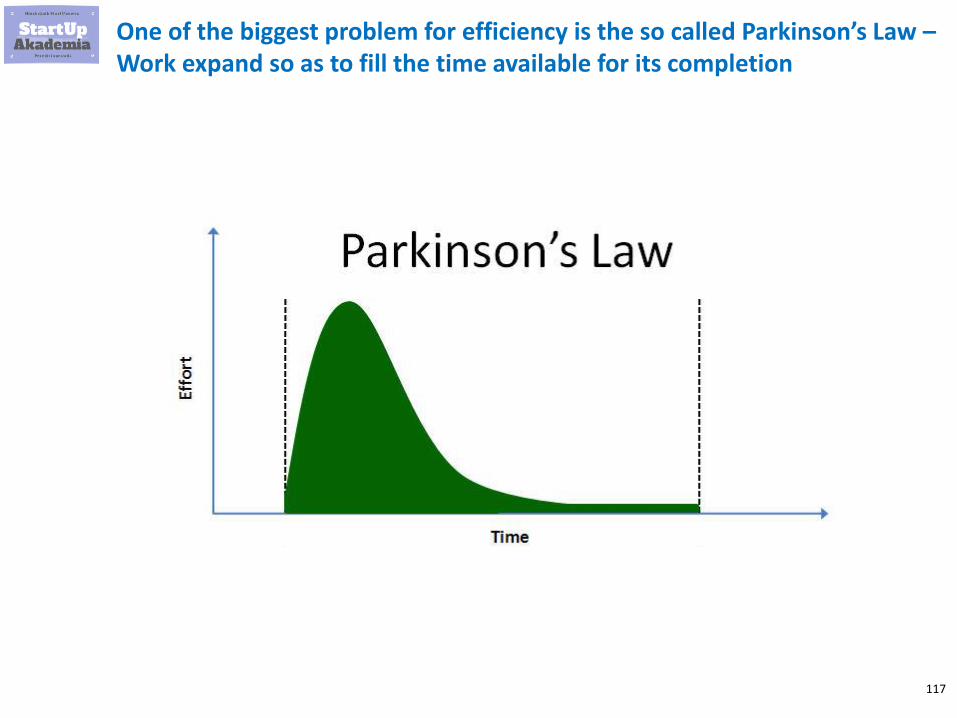
One of the biggest problem for efficiency is the so called Parkinson’s Law –Work expand so as to fill the time available for its completion

118
People when asked to evaluate the time certain things will take build in buffers
A B C
A + B + C
A + B + C
A B C Central buffer
Declared time
Buffer time
Real execution

119
I recommend reading the following books – click on the chosen cover to see details on each and every book
Click for more
120
Why you need to do capacity management
121
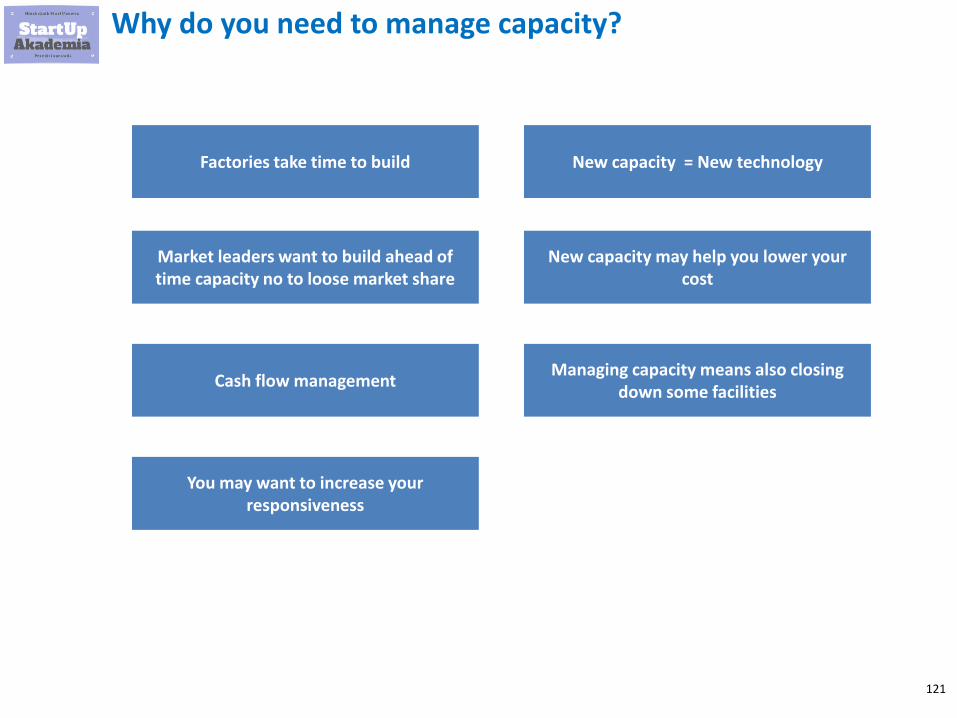
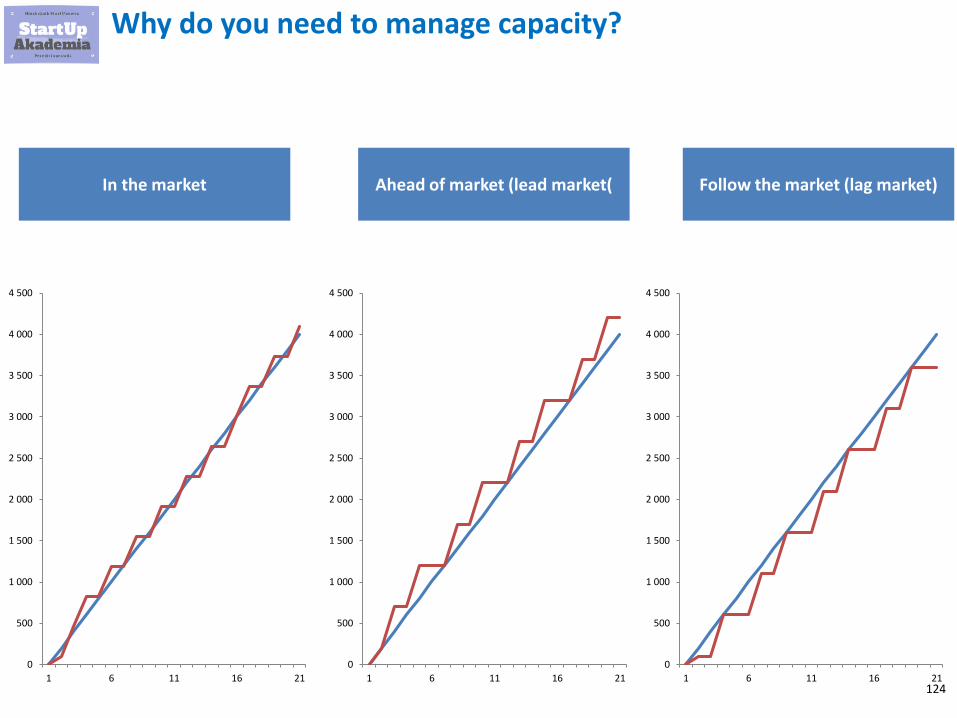
Why do you need to manage capacity?
Factories take time to build
Market leaders want to build ahead of time capacity no to loose market share
Cash flow management
You may want to increase your responsiveness
New capacity = New technology
New capacity may help you lower your cost
Managing capacity means also closing down some facilities

122
How to manage capacity?
123
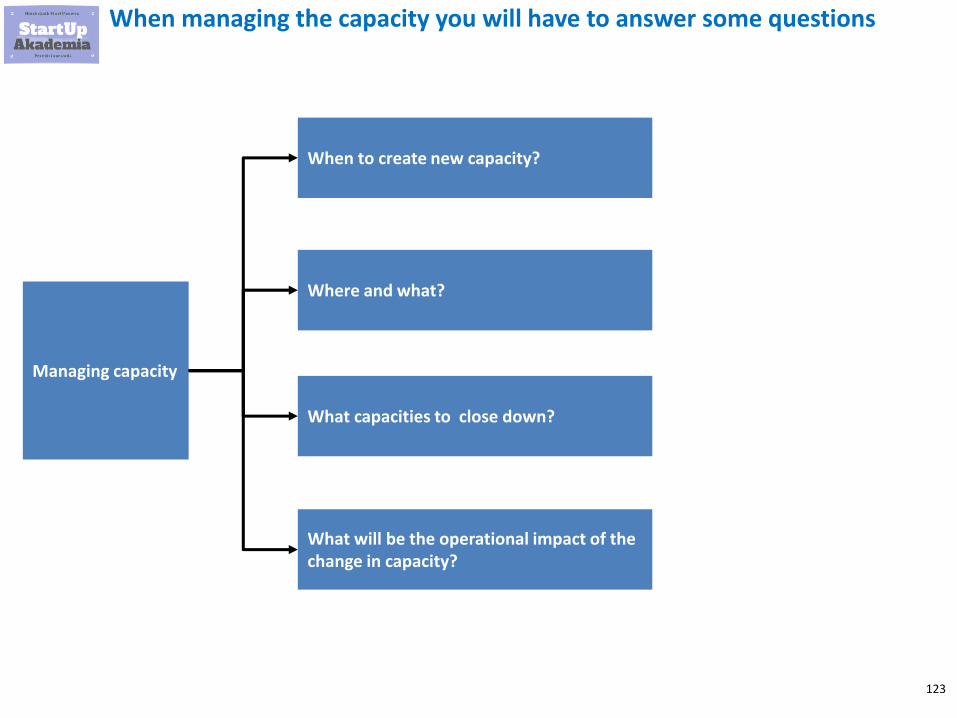
When managing the capacity you will have to answer some questions
Managing capacity
What will be the operational impact of the change in capacity?
When to create new capacity?
Where and what?
What capacities to close down?
124
Why do you need to manage capacity?
0
500
1 000
1 500
2 000
2 500
3 000
3 500
4 000
4 500
1 6 11 16 21
0
500
1 000
1 500
2 000
2 500
3 000
3 500
4 000
4 500
1 6 11 16 21
0
500
1 000
1 500
2 000
2 500
3 000
3 500
4 000
4 500
1 6 11 16 21
In the market Ahead of market (lead market( Follow the market (lag market)
125
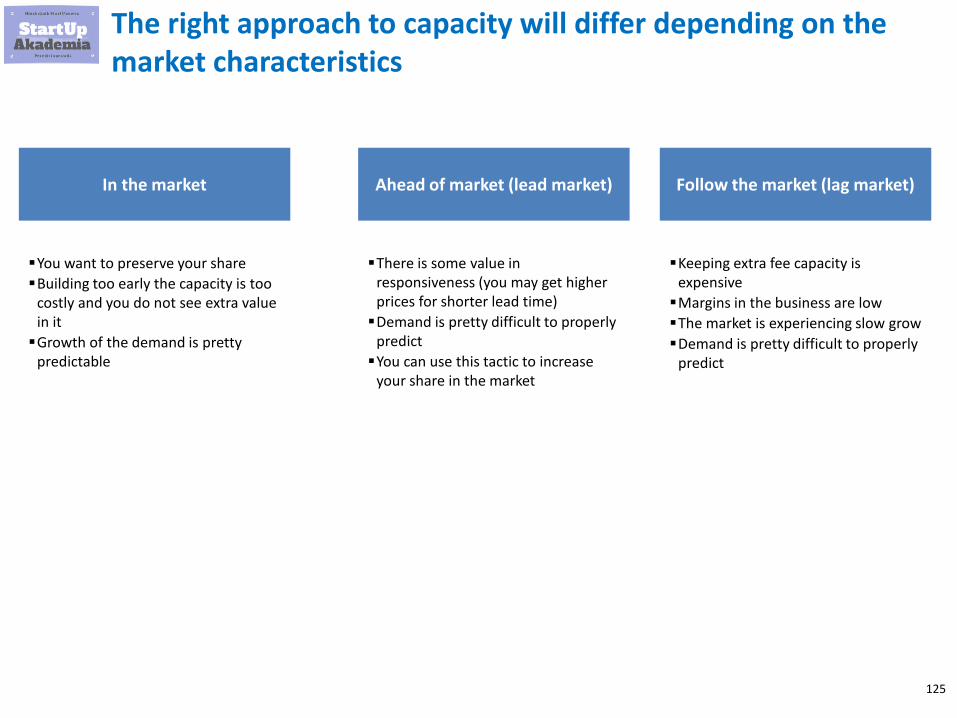
The right approach to capacity will differ depending on the market characteristics
In the market Ahead of market (lead market) Follow the market (lag market)
▪You want to preserve your share
▪Building too early the capacity is too costly and you do not see extra value in it
▪Growth of the demand is pretty predictable
▪There is some value in responsiveness (you may get higher prices for shorter lead time)
▪Demand is pretty difficult to properly predict
▪You can use this tactic to increase your share in the market
▪Keeping extra fee capacity is expensive
▪Margins in the business are low
▪The market is experiencing slow grow
▪Demand is pretty difficult to properly predict
126
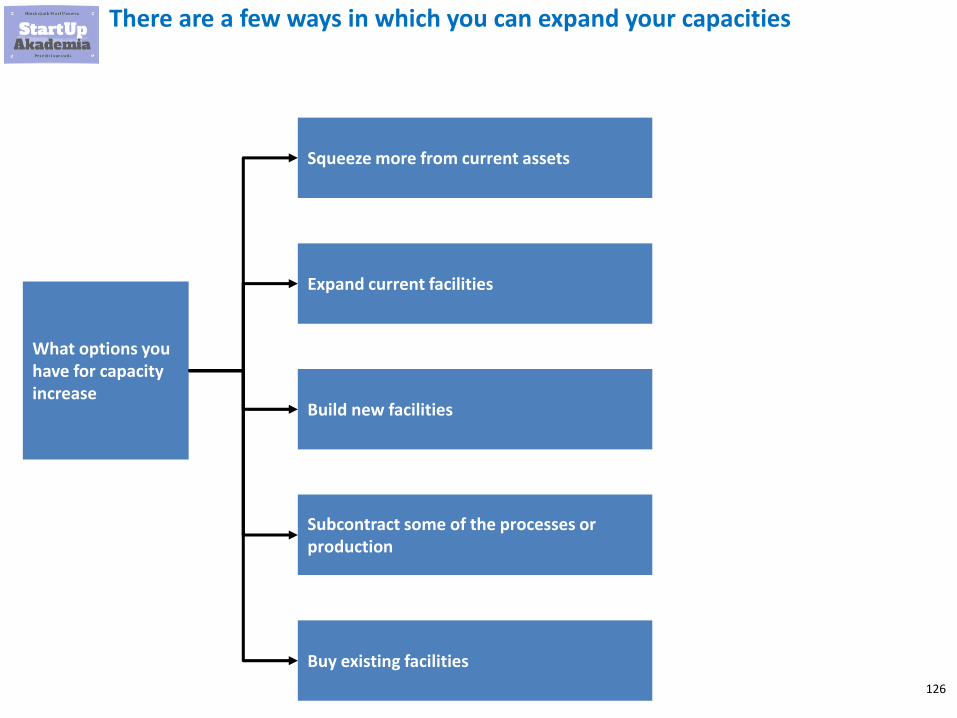
There are a few ways in which you can expand your capacities
What options you have for capacity increase
Subcontract some of the processes or production
Squeeze more from current assets
Expand current facilities
Build new facilities
Buy existing facilities

127
For more examples and templates in Excel go to my on-line course where I show you step by step how to find and estimate improvements in production
Click to check my course
Essential Lean Manufacturing for Management Consultants
$90$10
128
Check my presentation that will help you get into consulting
How to get into consultingPractical guide how to pass the case part
presentation

129
Check also my other presentations
Production for Management Consultants
Practical guide
presentation
130
Check also my other presentaions
Management Consulting Presentations
Practical guide how to prepare a great presentation
presentation
131
You can also find useful some tips on Excel
Essential Excel for Business Analysts and Consultants
A practical guide
presentation
132
Check also business modeling in Excel
Business modelsPractical guide for startups and entrepreneurs
presentation

133
I recommend also looking at some techniques to improve your business. Click on the cover below to go to the presentation
How to become world class analyst
A practical guide
presentation

134
….and how to perform market research
Market researchPractical guide for startups and entrepreneurs
presentation
135
Check my presentation on starting and running consulting company
How to create management consulting presentations?
A practical guide
presentation

136
Subscribe to our channels:
www
137
Check my extensive presentation on productivity hacks to see how you can me 10x more productive
Management consultant productivity hacks
How to be lazy and still get things done
presentation
138
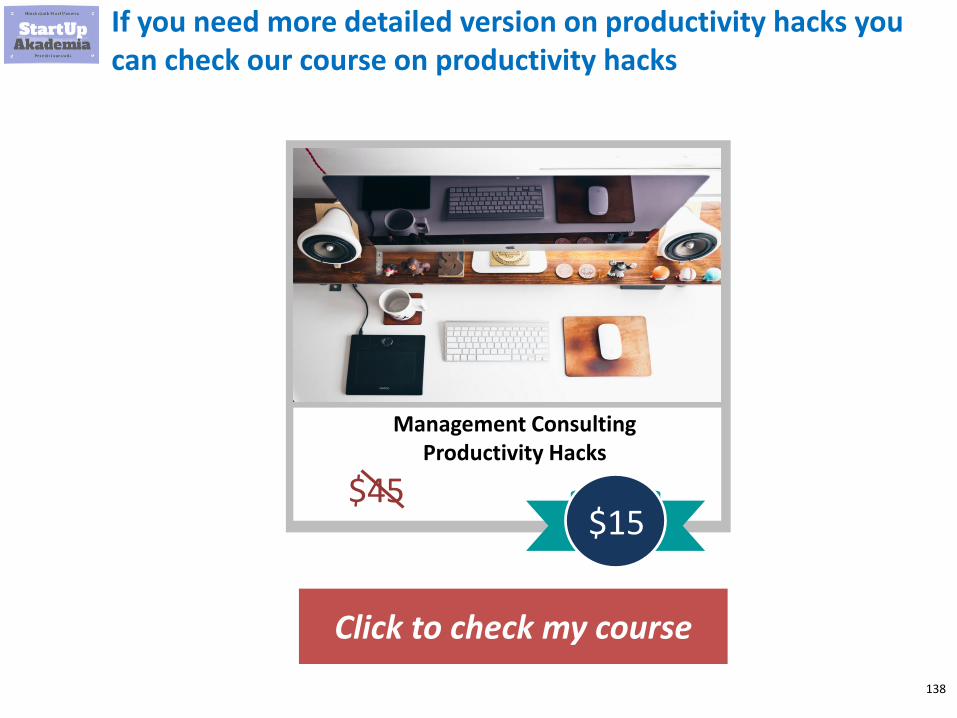
If you need more detailed version on productivity hacks you can check our course on productivity hacks
Click to check my course
Management ConsultingProductivity Hacks
$45$15
139
Check my presentation on restaurant business model to understand it properly
How to open a successful restaurantA practical guide
presentation
140
Check my presentation on on-line models to understand them properly
On-line Business ModeslA practical guide
presentation
141
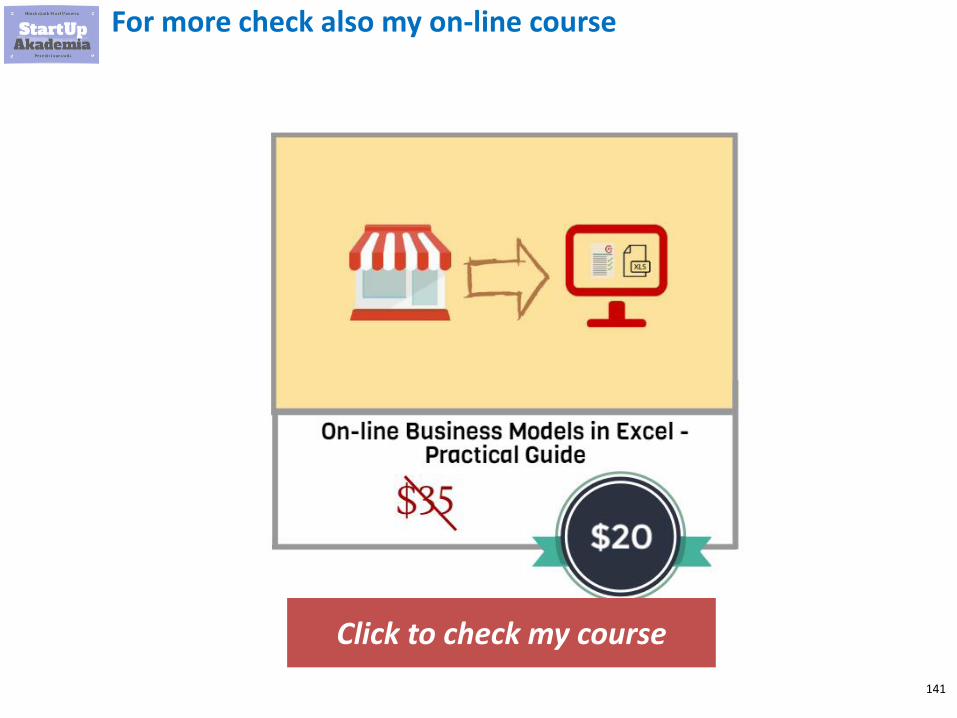
For more check also my on-line course
Click to check my course
142
Check my presentation on starting and running consulting company
Start and run consulting companyA practical guide
presentation

143
There is an interesting summary of ways to test cheaply businesses
MVP – how to test your business idea without building the
productA practical guide
presentation