lean principles for sme's
TRANSCRIPT
Welcome to
Lean Principles
January 22, 2018
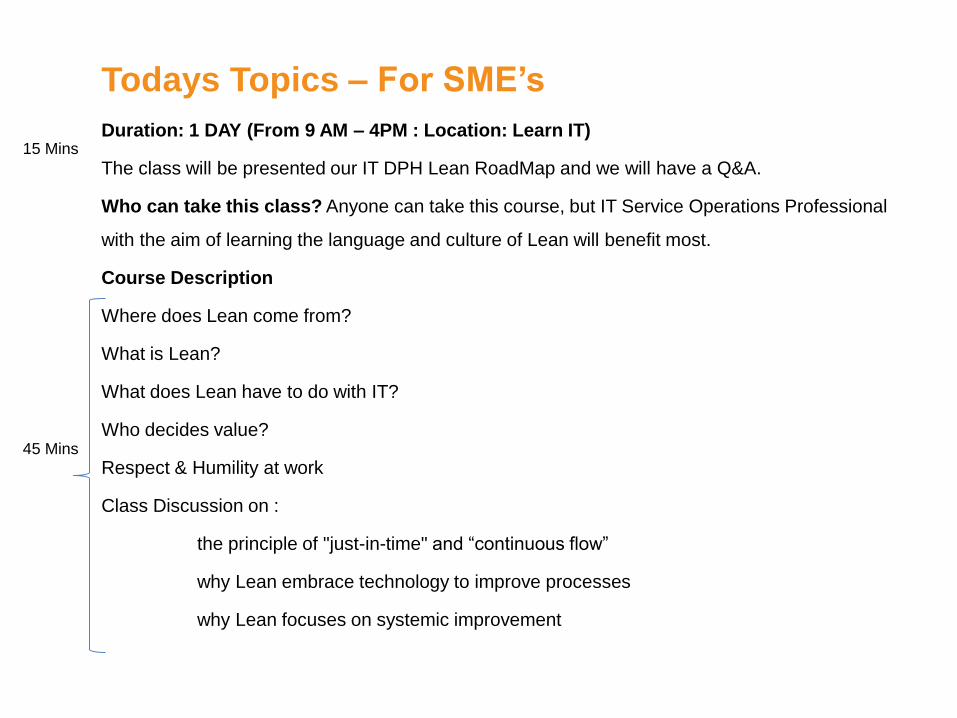
Todays Topics – For SME’s
Duration: 1 DAY (From 9 AM – 4PM : Location: Learn IT)
The class will be presented our IT DPH Lean RoadMap and we will have a Q&A.
Who can take this class? Anyone can take this course, but IT Service Operations Professional
with the aim of learning the language and culture of Lean will benefit most.
Course Description
Where does Lean come from?
What is Lean?
What does Lean have to do with IT?
Who decides value?
Respect & Humility at work
Class Discussion on :
the principle of "just-in-time" and “continuous flow”
why Lean embrace technology to improve processes
why Lean focuses on systemic improvement
45 Mins
15 Mins
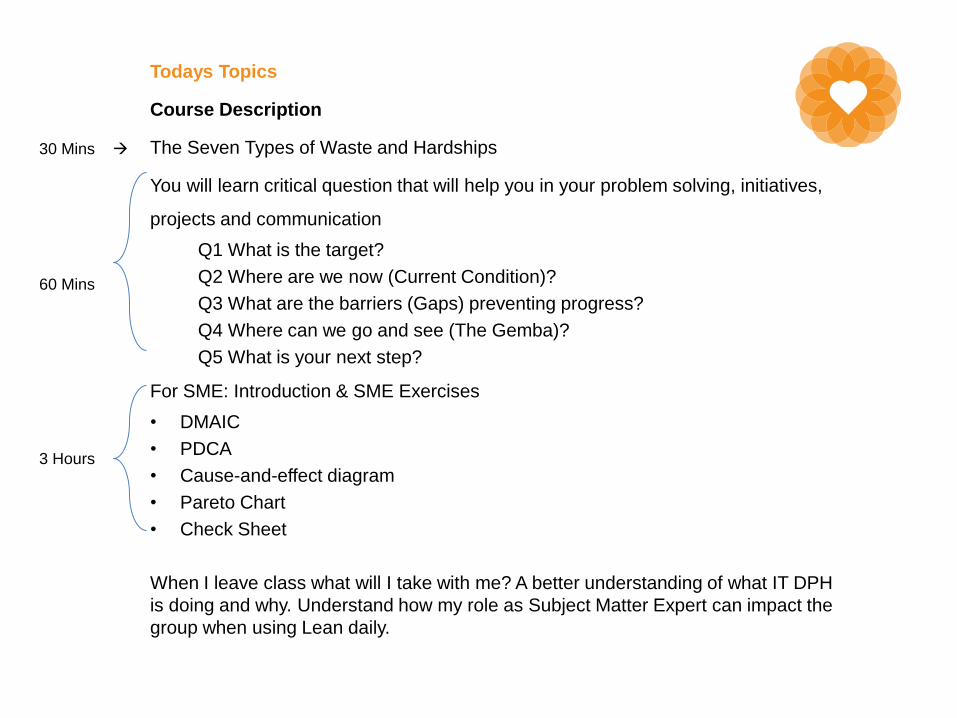
Todays Topics
Course Description
The Seven Types of Waste and Hardships
You will learn critical question that will help you in your problem solving, initiatives,
projects and communication
Q1 What is the target?
Q2 Where are we now (Current Condition)?
Q3 What are the barriers (Gaps) preventing progress?
Q4 Where can we go and see (The Gemba)?
Q5 What is your next step?
For SME: Introduction & SME Exercises
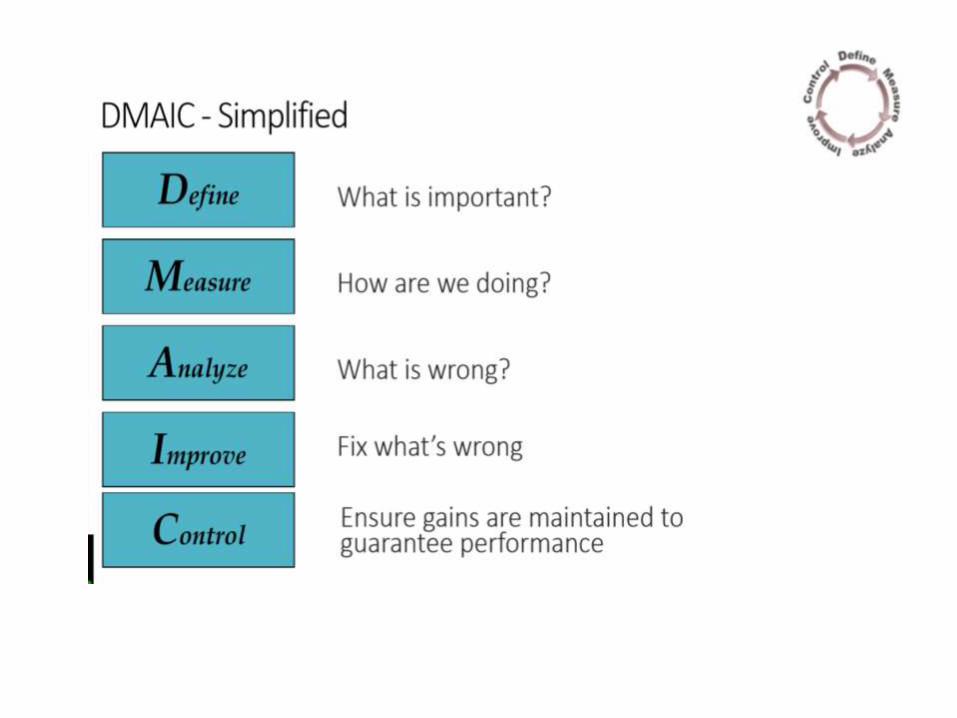
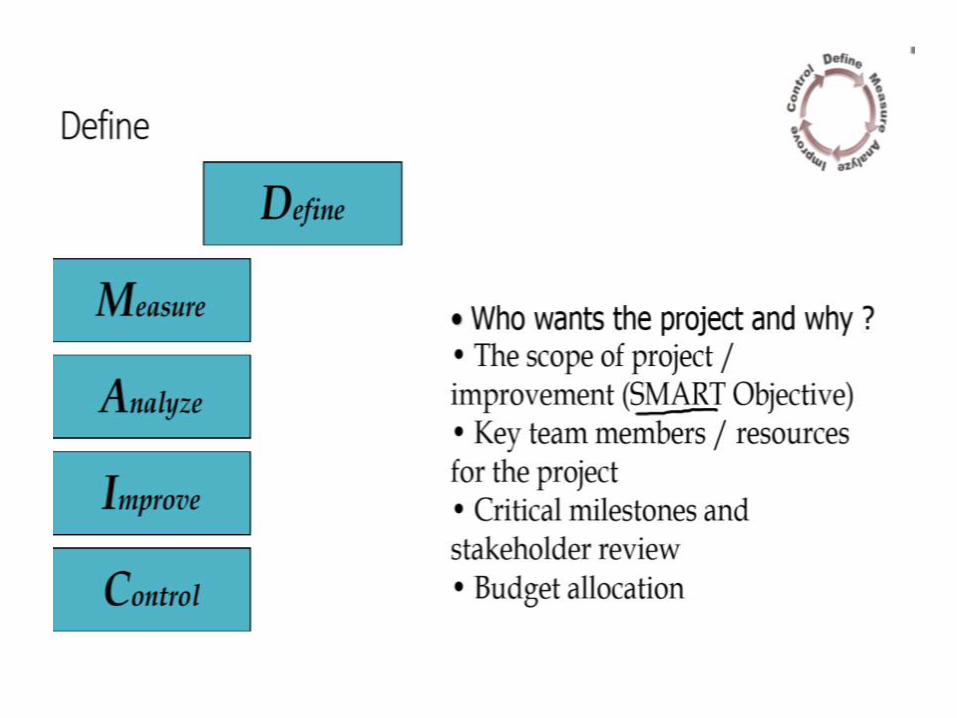
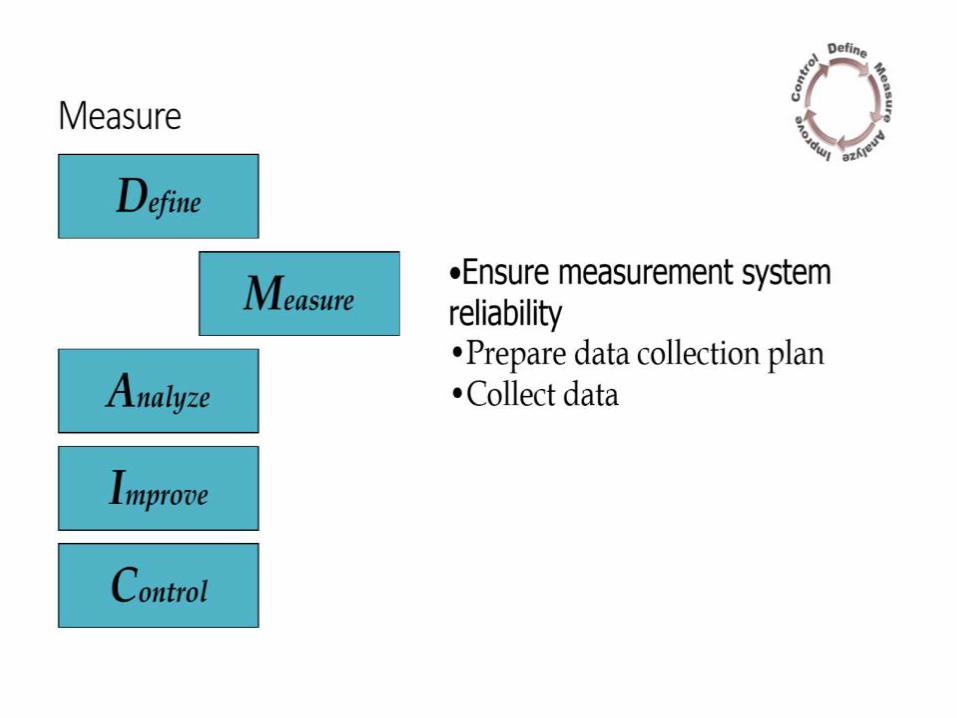
• DMAIC
• PDCA
• Cause-and-effect diagram
• Pareto Chart
• Check Sheet
When I leave class what will I take with me? A better understanding of what IT DPH
is doing and why. Understand how my role as Subject Matter Expert can impact the
group when using Lean daily.
60 Mins
30 Mins
3 Hours
We begin our Lean
Transformation
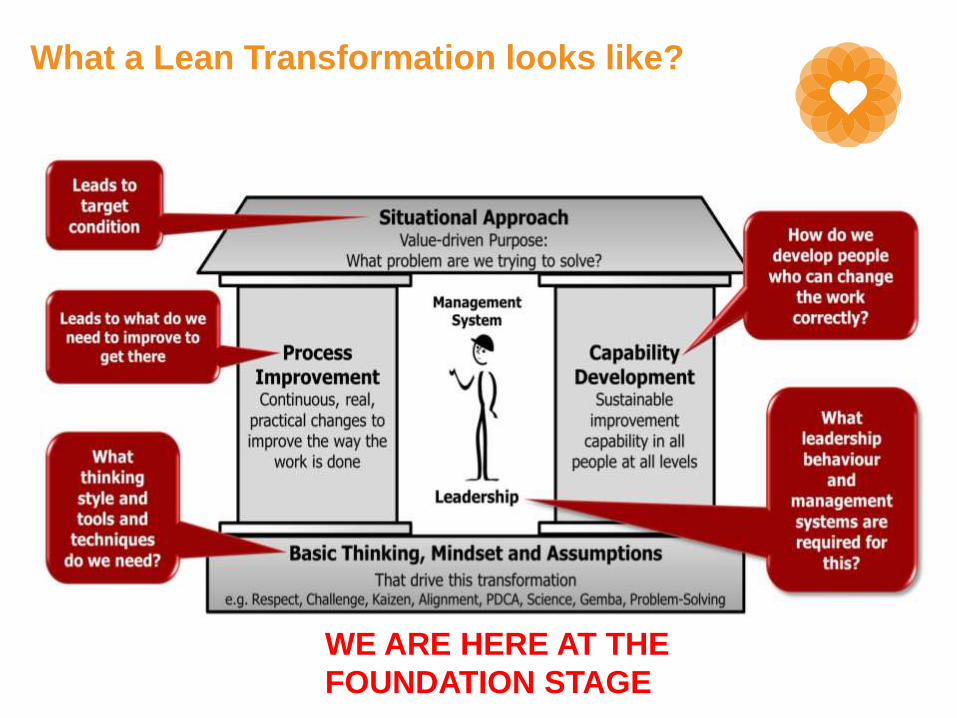
What a Lean Transformation looks like?
WE ARE HERE AT THE
FOUNDATION STAGE

Who decides value?
The customer decides value.
How does the customer communicate value to us?

Value
Everyone also has an important voice.
How can everyone communicate value?
Respect & Humility
Respect: We work at fostering a culture that enhances individual
creativity and teamwork value, while honoring mutual trust and
respect between labor and management.
A "Lean" culture is characterized by two learning elements: Humility
and Respect. Learning begins with humility.
How do I practice humility at work?
I don’t pretend - I know - I don't know.
I coach only 1 step ahead of the other person.
Waste & Hardship
In Lean you will here a lot about Waste and sometimes you may hear and
read about hardship… what is this all about? In Japan the word MUDA
means Waste. Taiichi Ohno who codified the Lean Philosophy, Practices
taught a culture of respect, humility, and the philosophy of "Daily
Improvements" and the “Elimination of Waste”.
In the USA we remember Waste using the acronym T-I-M-W-O-O-D
Transportation: In hospital's moving patient’s unnecessarily causes waste in
human resources, the nurse could be doing more important work, also
causes hardship for the patient being moved around while they are just laying
there. In IT Operations moving equipment, data, people around unnecessarily
is a waste of time, effort, and increases the likelihood that equip may be
damaged or a person could get hurt…
In Japan the word is MUDA = Waste
There are many types of waste and some are called Hardship
In the USA we can remember T-I-M-W-O-O-D
Inventory: In hospital’s we need stock but sometimes we have unused old materials just
sitting around for one day… one day we might need it. In the meantime, its right in front
of me, just taking up space in my mind, and in my work space. The same could be said
for IT.
Motion: The “wear and tear” on the body going up and down the same isle, “wear and
tear” on the equipment or the people involved in the process. In a pharmacy, reaching
across a counter or shelve to get the right medicine is waste, do it 10,000 times a year
and it becomes hardship. In IT, shuffling through equipment or materials to get the right
component, file or part is waste as well.
In Japan the word is MUDA = Waste
Here is a another type of Waste, its called Hardship
In the USA we can remember T-I-M-W-O-O-D
Waiting: Time that ‘stuff” is just sitting there – not being transported or processed.
• Waiting to be told what to do next.
• Waiting for a previous process to complete a batch.
• Waiting for a decision to be made or information to be transferred.
Over-processing: Doing more than is necessary.
Over-production: Making more than is necessary, adding work that is not required.
Defects: Anything that has to be re-done, defects in production. MANAGERs, we can
expect defects when we don’t provide training to our people; we throw them straight
into the deep end.
Why does Lean embrace technology?
We embrace and utilize technology that is useful now. We also
acknowledge the difficulty faced when it comes to change, because risks exist
in change. Resistance to change stops you from exposing yourself to new
things, then change becomes an impediment to the elimination of hardships
and waste and no one wants that.
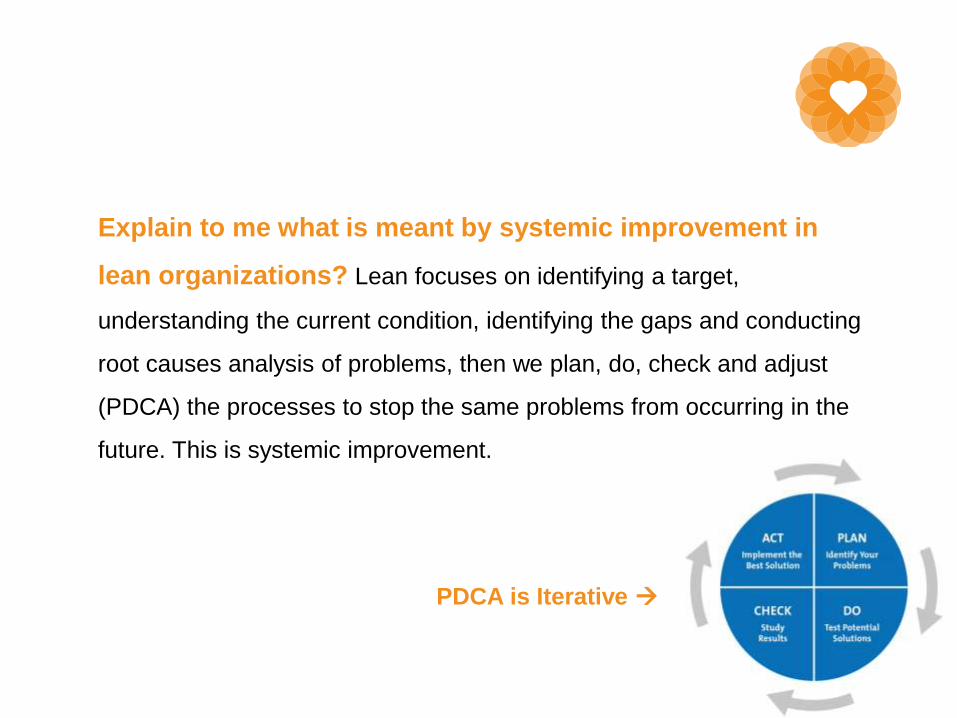
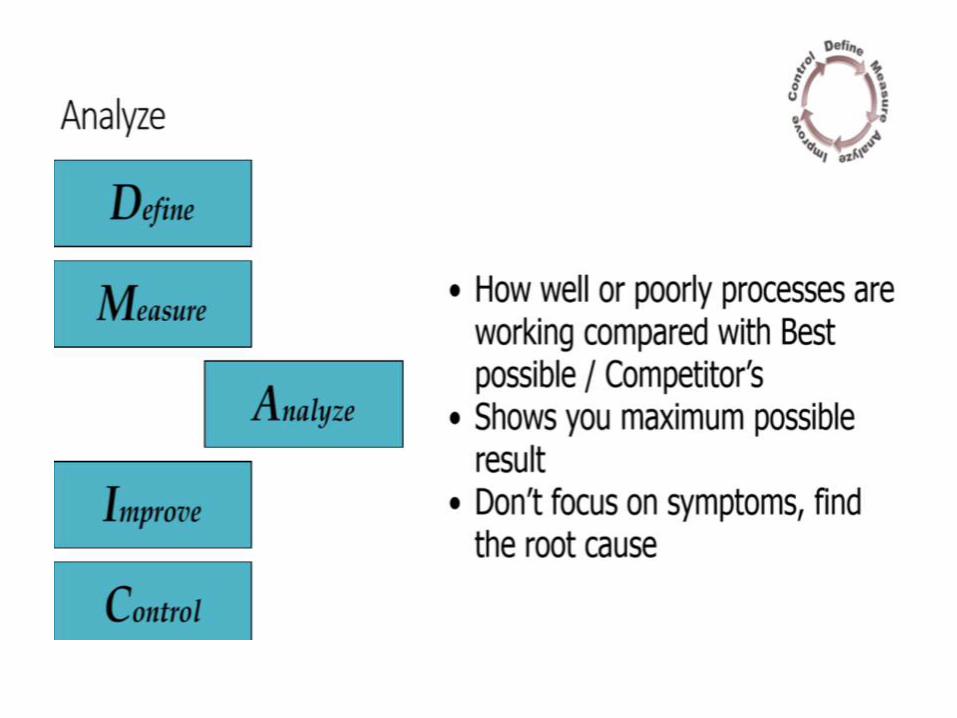
Explain to me what is meant by systemic improvement in
lean organizations? Lean focuses on identifying a target,
understanding the current condition, identifying the gaps and conducting
root causes analysis of problems, then we plan, do, check and adjust
(PDCA) the processes to stop the same problems from occurring in the
future. This is systemic improvement.
PDCA is Iterative
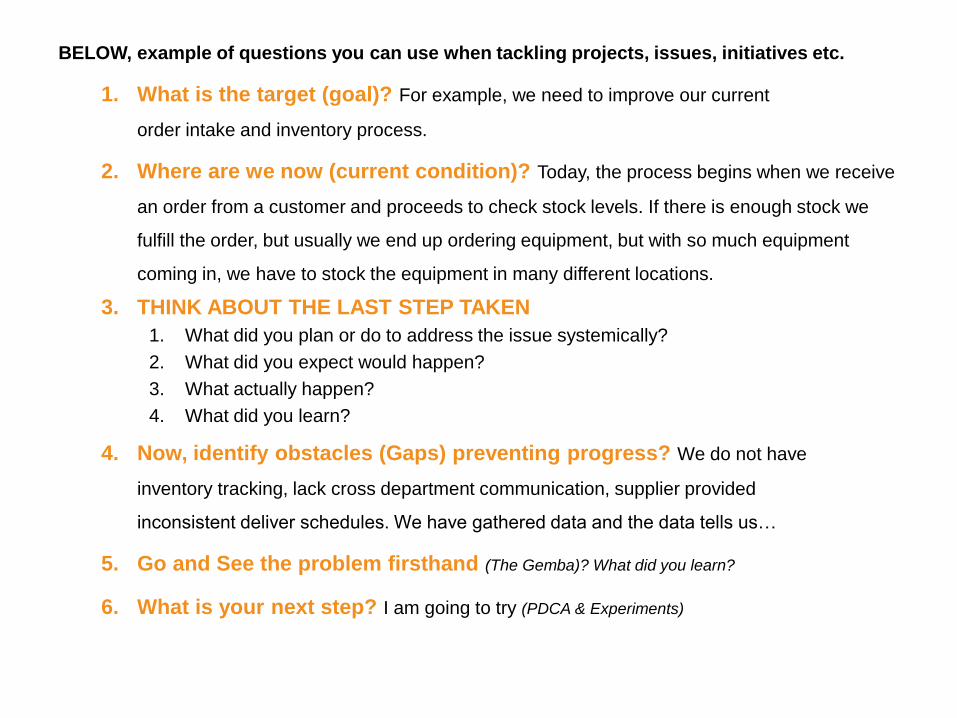
BELOW, example of questions you can use when tackling projects, issues, initiatives etc.
1. What is the target (goal)? For example, we need to improve our current
order intake and inventory process.
2. Where are we now (current condition)? Today, the process begins when we receive
an order from a customer and proceeds to check stock levels. If there is enough stock we
fulfill the order, but usually we end up ordering equipment, but with so much equipment
coming in, we have to stock the equipment in many different locations.
3. THINK ABOUT THE LAST STEP TAKEN
1. What did you plan or do to address the issue systemically?
2. What did you expect would happen?
3. What actually happen?
4. What did you learn?
4. Now, identify obstacles (Gaps) preventing progress? We do not have
inventory tracking, lack cross department communication, supplier provided
inconsistent deliver schedules. We have gathered data and the data tells us…
5. Go and See the problem firsthand (The Gemba)? What did you learn?
6. What is your next step? I am going to try (PDCA & Experiments)
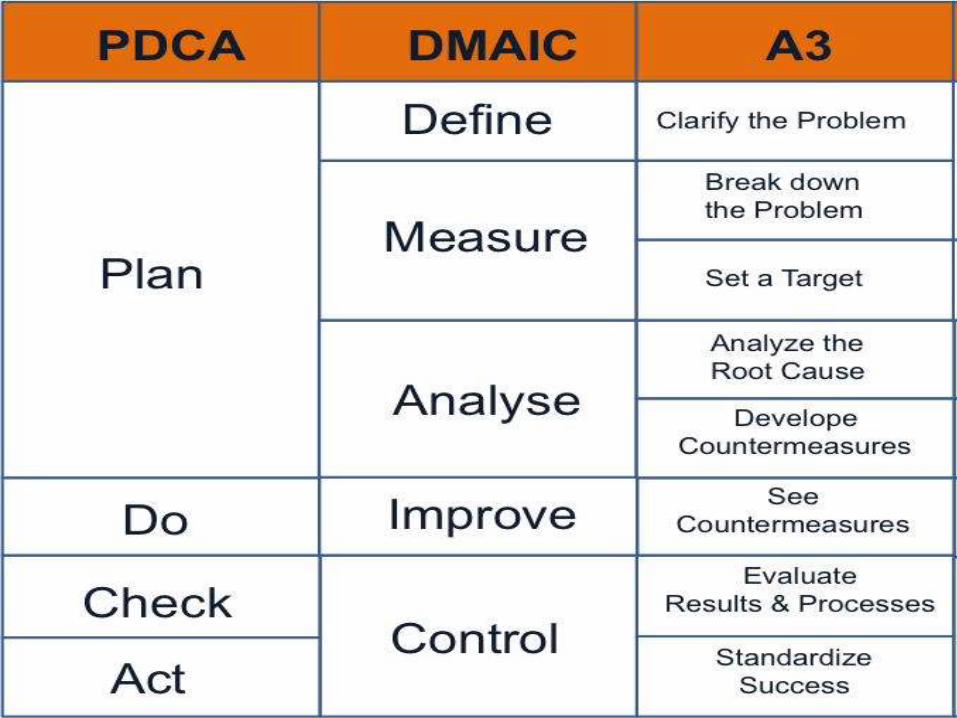
Intro to DAMIC
Intro to PDCA
As the Subject Matter Expert…
• As the Subject Matter Expert, you are called upon to actually practice and lead others
utilizing PDCA.
• You will need to learn how to map the new process and take a few words or ideas
(goals) and make them real for everyday workers like us.
• You will set measures, do (execute for PMI people) and capture said measures or
results and will from time to time have to audit others. OUCH !!! Get me out of this
class!
• You will learn and be involved in root cause analysis and based on the data from the
analysis and your experience along with team input, will come up with adjustments to
the current process.
• Maybe you will build a new process and phase out the old one. Maybe a process
never existed and you help design, construct, test, deploy and adopt a new process.
AND DEAL WITH THE LAW OF UNINTENDED CONSEQUENCESES
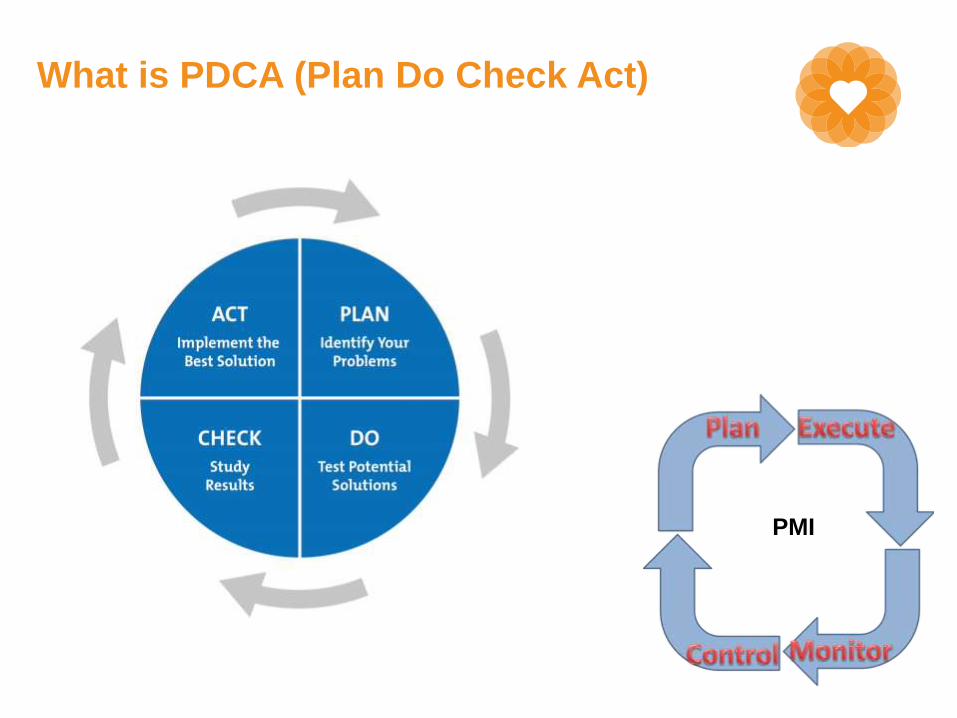
PMI
What is PDCA (Plan Do Check Act)
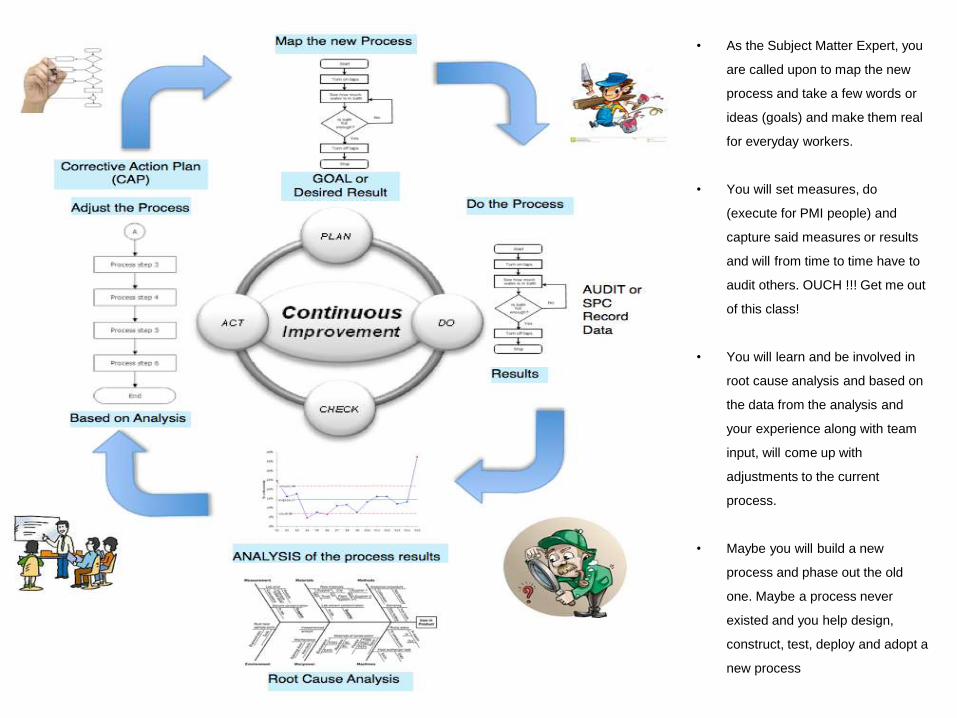
• As the Subject Matter Expert, you
are called upon to map the new
process and take a few words or
ideas (goals) and make them real
for everyday workers.
• You will set measures, do
(execute for PMI people) and
capture said measures or results
and will from time to time have to
audit others. OUCH !!! Get me out
of this class!
• You will learn and be involved in
root cause analysis and based on
the data from the analysis and
your experience along with team
input, will come up with
adjustments to the current
process.
• Maybe you will build a new
process and phase out the old
one. Maybe a process never
existed and you help design,
construct, test, deploy and adopt a
new process
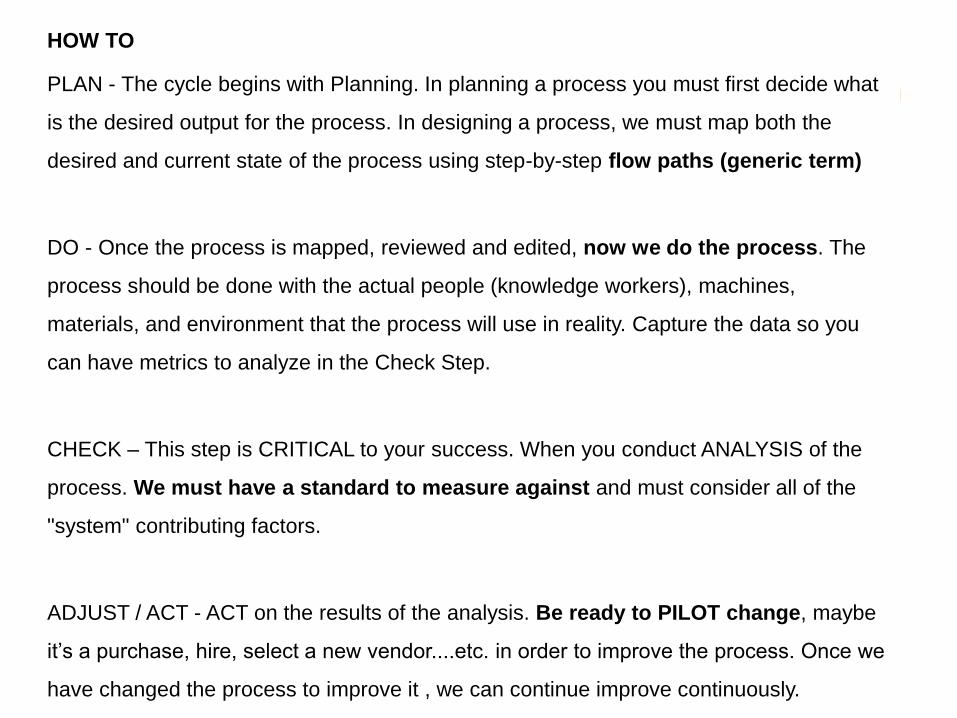
HOW TO
PLAN - The cycle begins with Planning. In planning a process you must first decide what
is the desired output for the process. In designing a process, we must map both the
desired and current state of the process using step-by-step flow paths (generic term)
DO - Once the process is mapped, reviewed and edited, now we do the process. The
process should be done with the actual people (knowledge workers), machines,
materials, and environment that the process will use in reality. Capture the data so you
can have metrics to analyze in the Check Step.
CHECK – This step is CRITICAL to your success. When you conduct ANALYSIS of the
process. We must have a standard to measure against and must consider all of the
"system" contributing factors.
ADJUST / ACT - ACT on the results of the analysis. Be ready to PILOT change, maybe
it’s a purchase, hire, select a new vendor....etc. in order to improve the process. Once we
have changed the process to improve it , we can continue improve continuously.
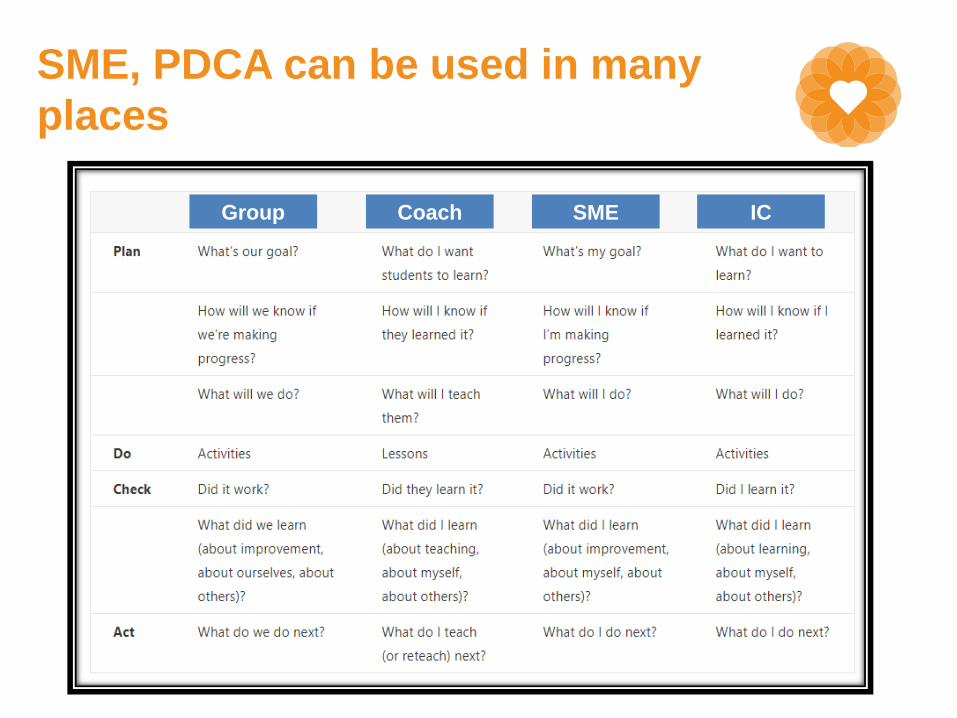
SME, PDCA can be used in many
places
Group Coach SME IC
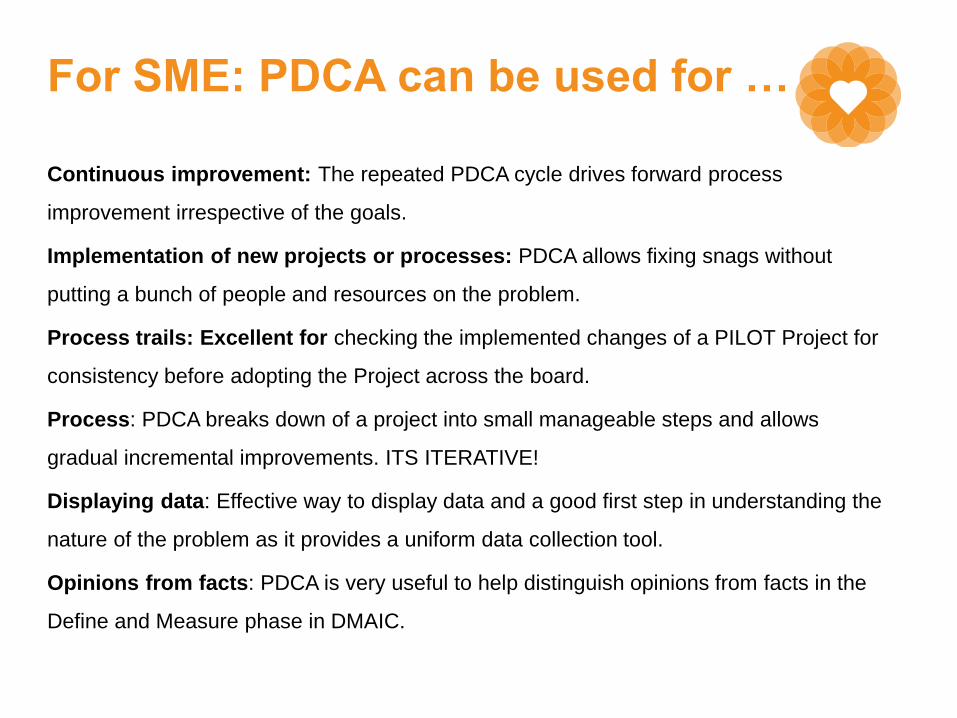
For SME: PDCA can be used for …
Continuous improvement: The repeated PDCA cycle drives forward process
improvement irrespective of the goals.
Implementation of new projects or processes: PDCA allows fixing snags without
putting a bunch of people and resources on the problem.
Process trails: Excellent for checking the implemented changes of a PILOT Project for
consistency before adopting the Project across the board.
Process: PDCA breaks down of a project into small manageable steps and allows
gradual incremental improvements. ITS ITERATIVE!
Displaying data: Effective way to display data and a good first step in understanding the
nature of the problem as it provides a uniform data collection tool.
Opinions from facts: PDCA is very useful to help distinguish opinions from facts in the
Define and Measure phase in DMAIC.

PLAN
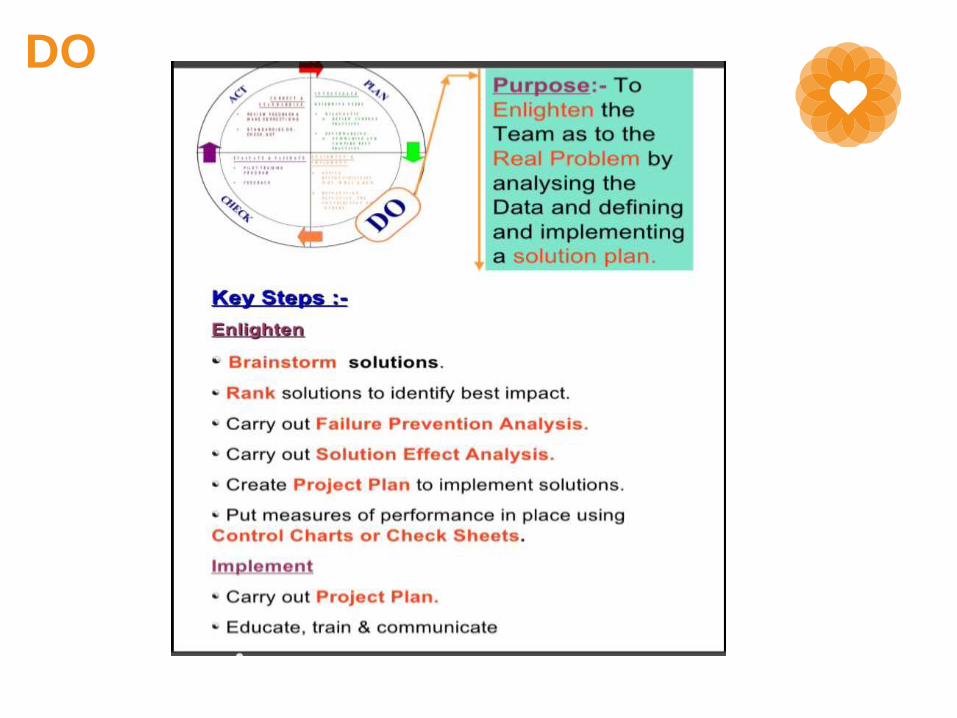
DO
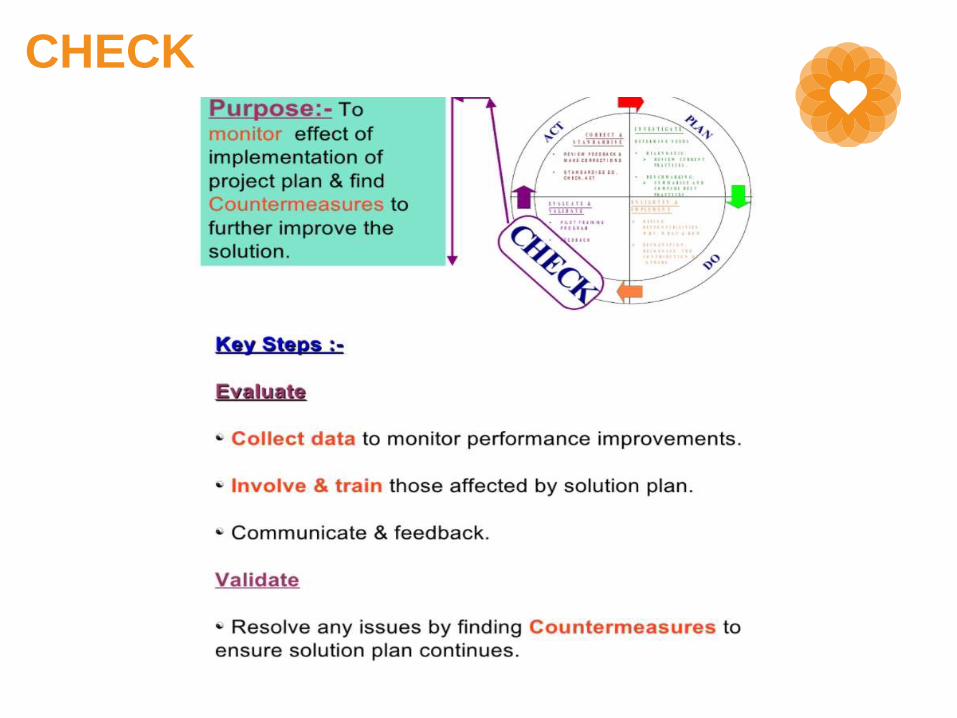
CHECK
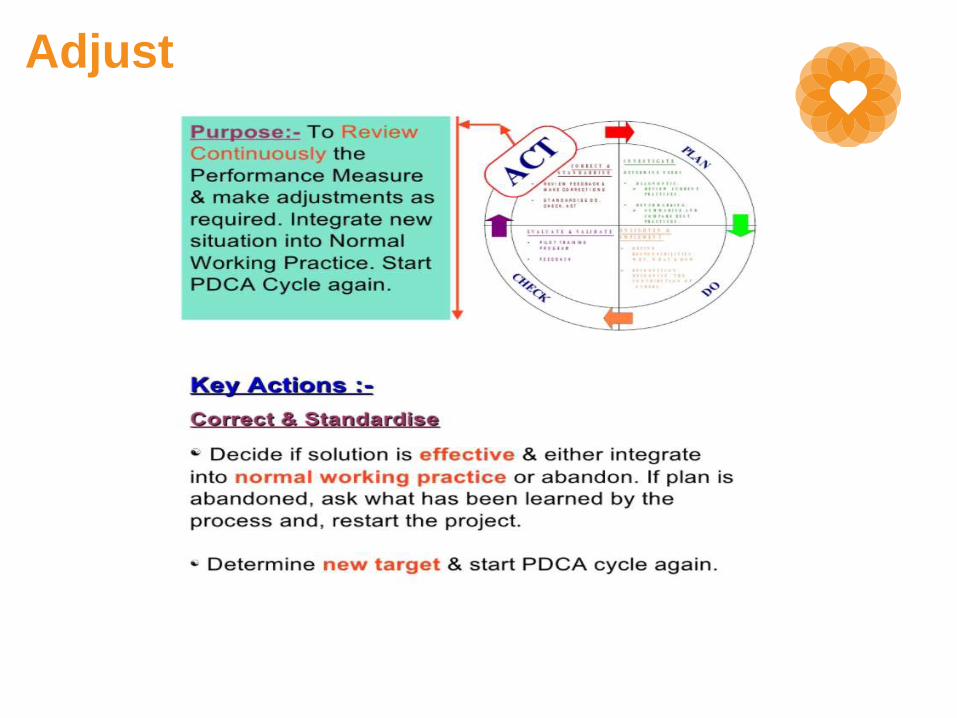
Adjust
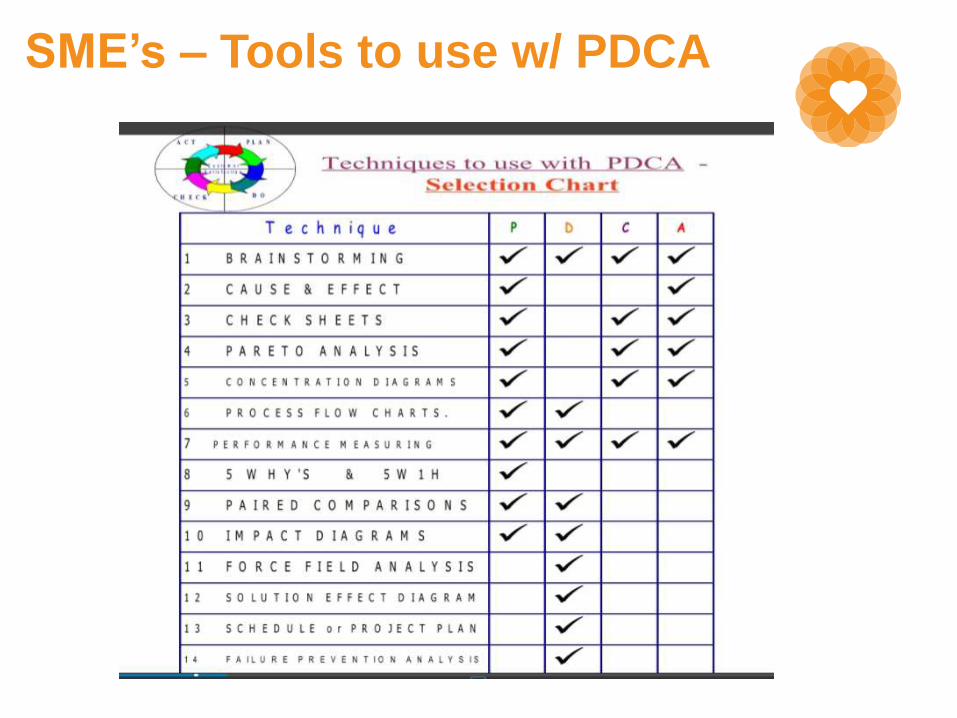
SME’s – Tools to use w/ PDCA

Intro to Check Sheet
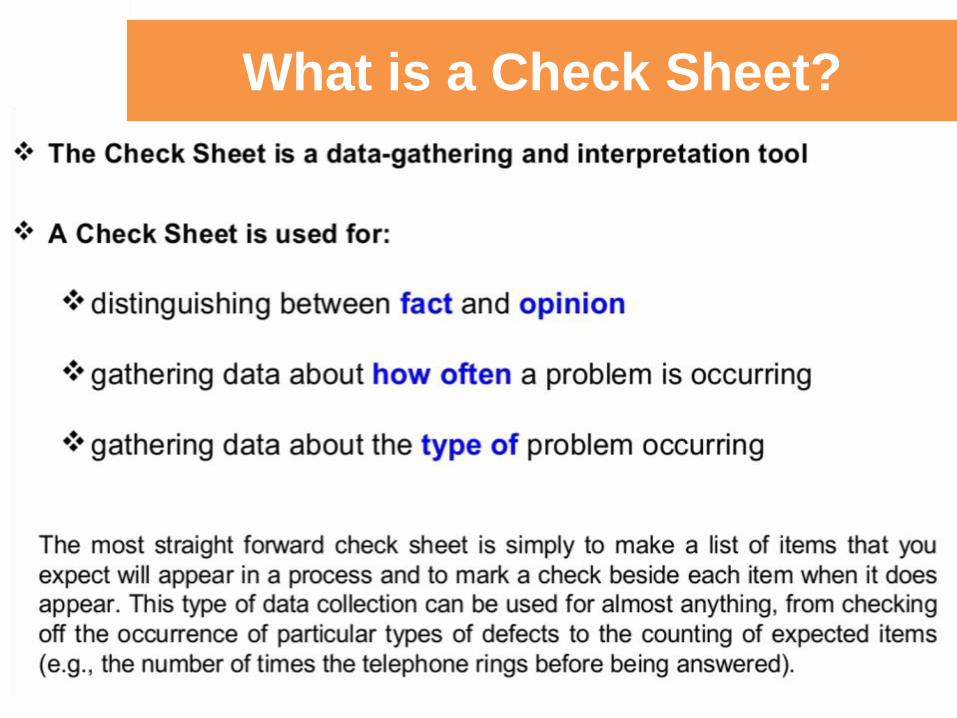
What is a Check Sheet?
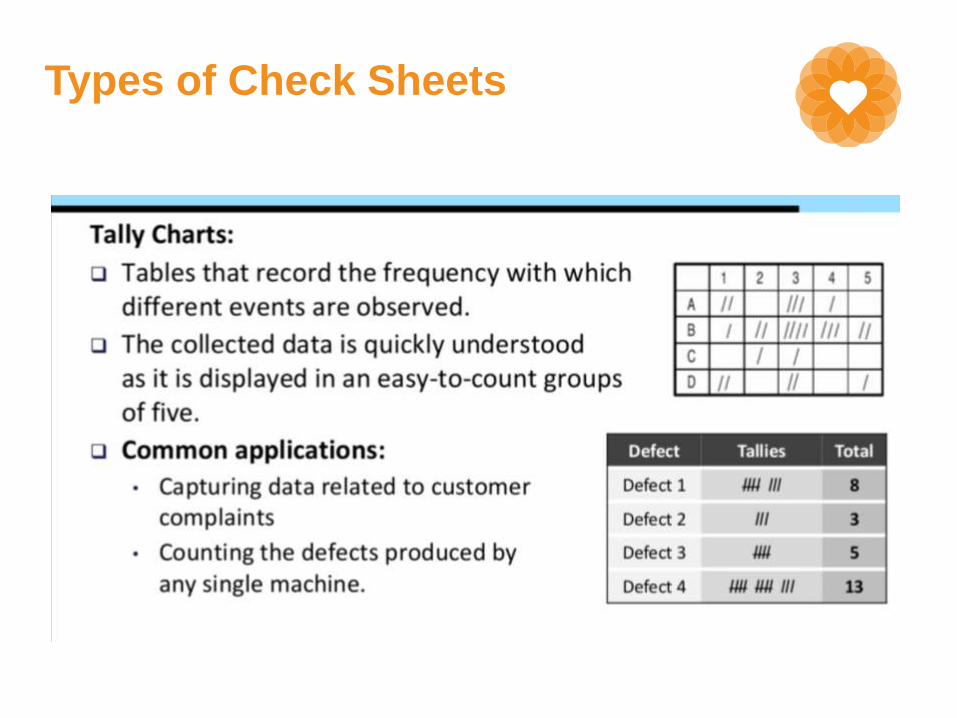
Types of Check Sheets
For SME’s: Medical Examples
The Problem: Frequent interruptions in the operating room, but everyone had a
different opinion about the causes and was unable to quantify (data) the magnitude
of the problem.
The Solution: We developed a check sheet to quantify (collect
data) based on the types interruptions and distractions in the operating room and
piloted the form for four weeks. Wow, the data in only 4 weeks, identify not opinion
what the leading causes of interruptions in the operating room were.
The Results: Interruption down by 90%, no mobile phones or hospital pager
allowed in the operating room.
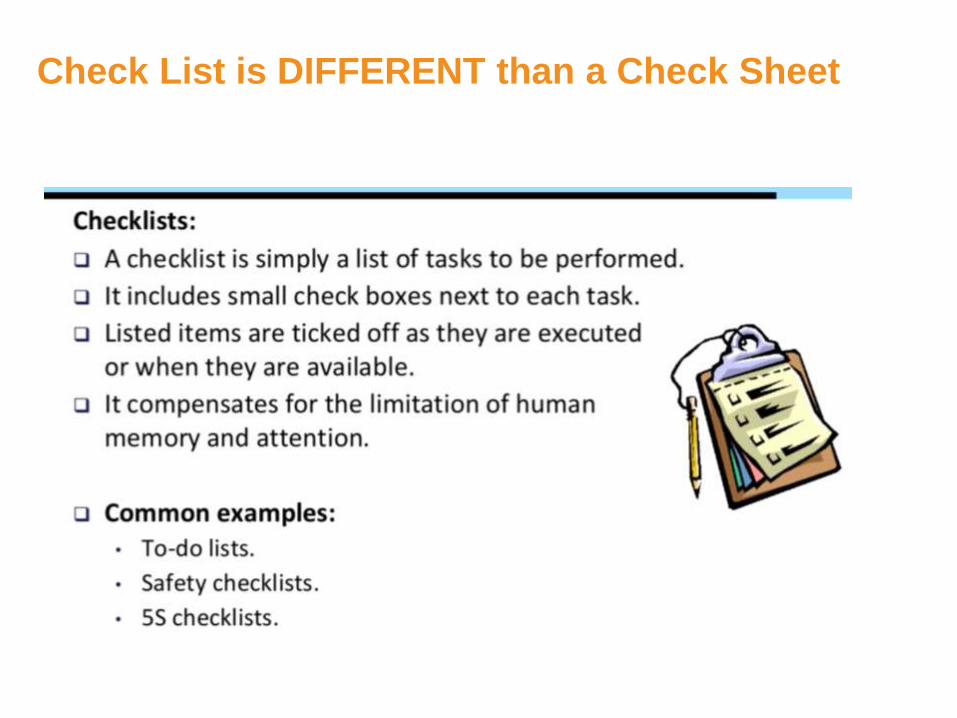
Check List is DIFFERENT than a Check Sheet
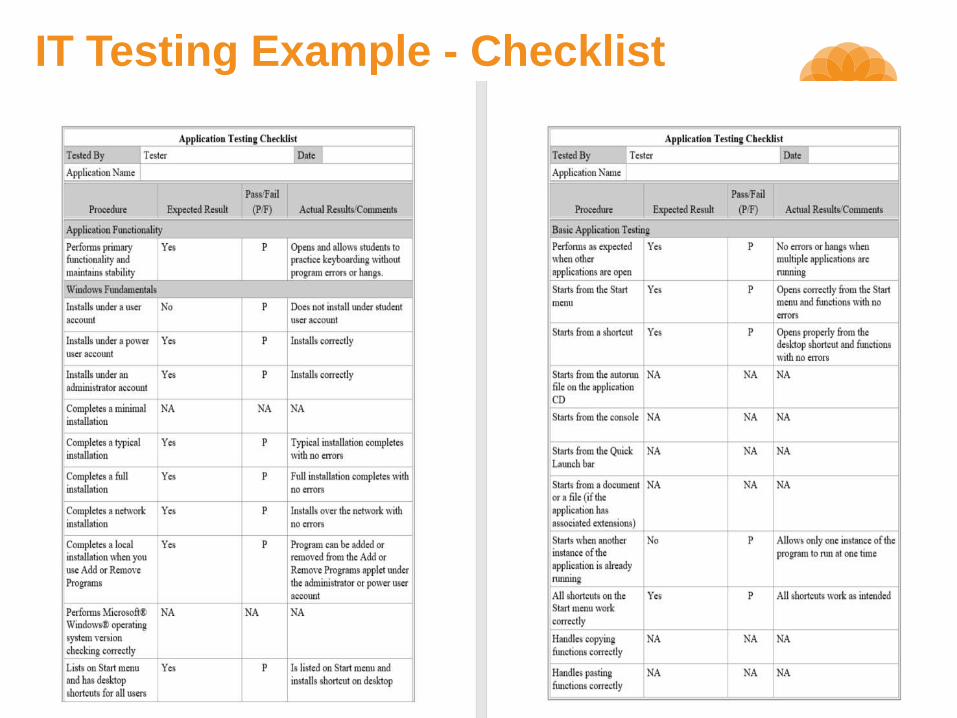
IT Testing Example - Checklist
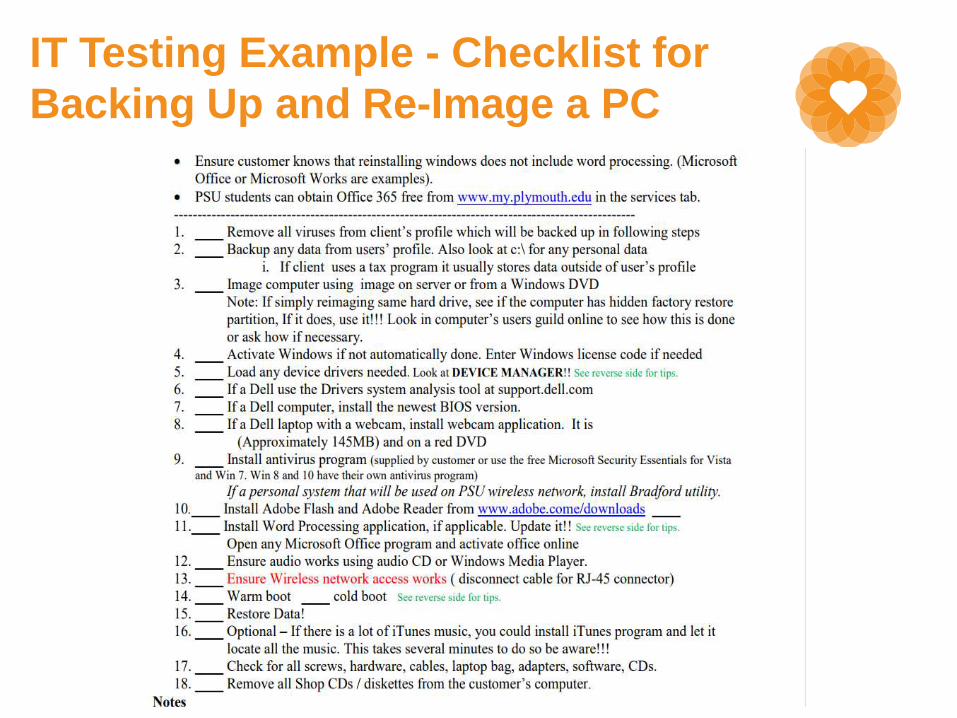
IT Testing Example - Checklist for
Backing Up and Re-Image a PC
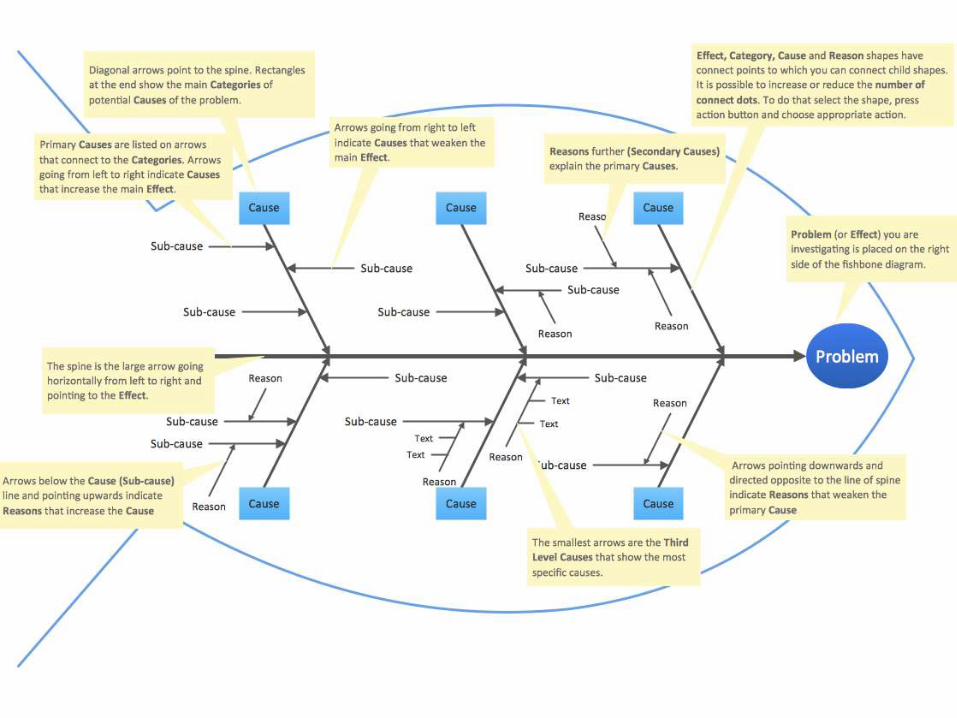
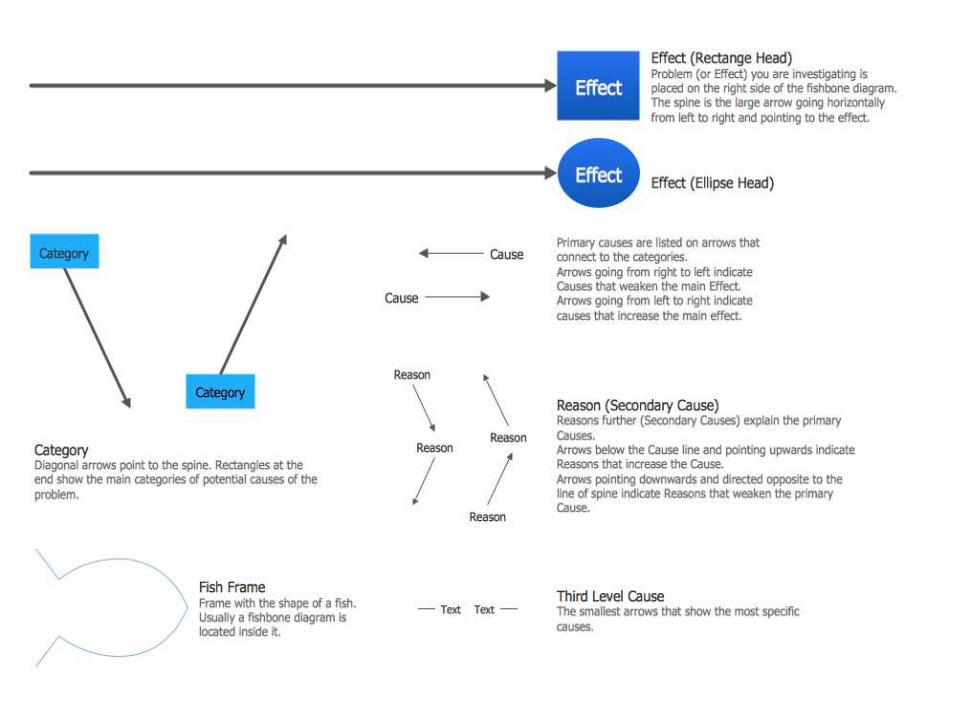
Intro to Cause and Effect
Ishikawa
Fish Head Diagram
SME’s use Cause and Effect to…Explore all of the potential or real causes (or inputs) that result in a single effect
(or output).
A STORY ABOUT BAD COFFEE: WOW we have bad coffee around here, I
wonder why? I’m going to explore, is it the cups, maybe we have dirty cups, you
know cups that are just old. Maybe the coffee does not come out of the coffee
maker hot enough, let me see? I’ll bet you someone is putting in too many
grounds. I have been known to do that, let me check this out. Did I see him put too
little water in the coffee maker…that will lead to bad coffee, many this person
needs some training.
And so on … we go and investigate, explore to see what is the problem based on
facts. The data is arranged according to their level of importance. The causes are
furthered arranged in categories.
Categories:
Manpower, Method, Materials and Machinery
Sub Categories:
• Equipment
• Policies
• Procedures
• People

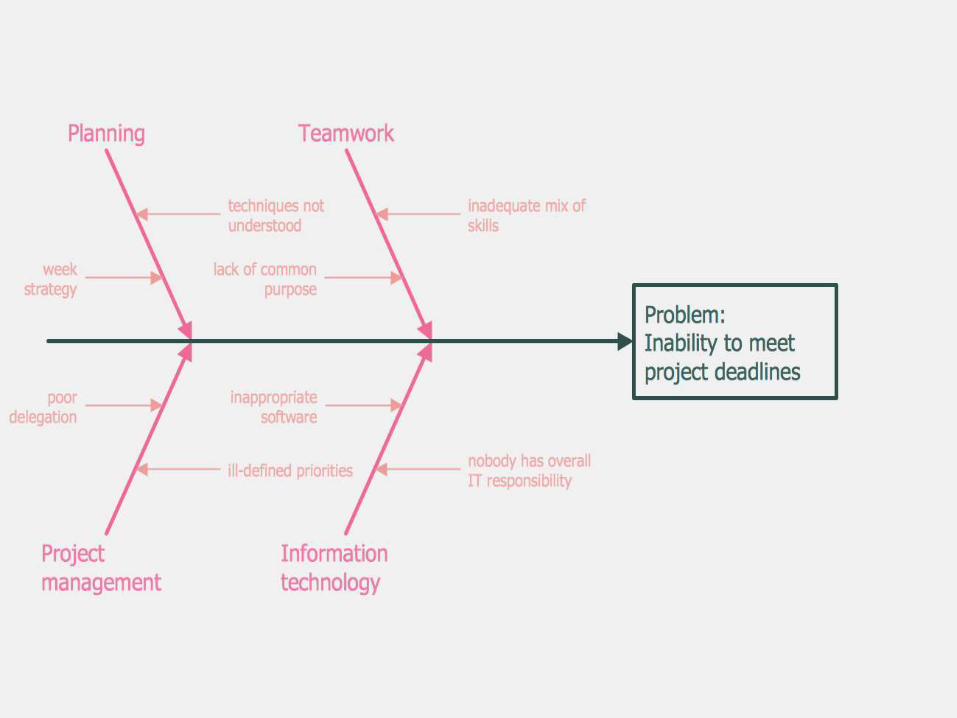
What will Managers be looking for?
Managers use the Fish Head diagram in process improvement to
identify all of the contributing root causes likely to be causing a
problem.
The Fishbone chart is an initial step in the screening process. After
identifying potential root cause(s), further testing will be necessary to
confirm the true root cause(s).
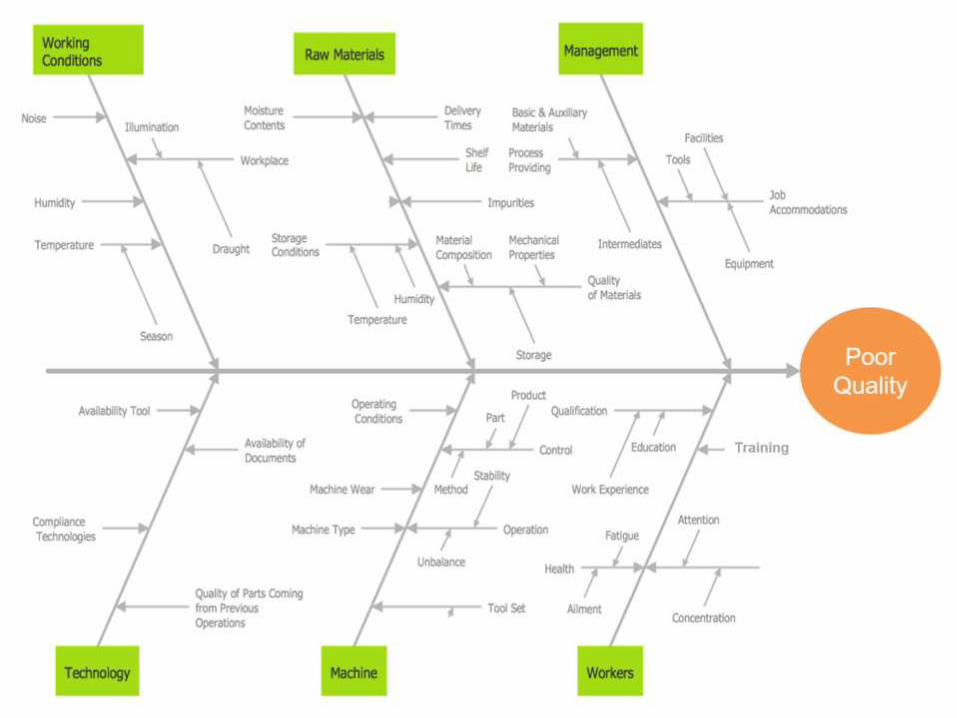
This can be used on any type of problem, and can be tailored by the
user to fit the circumstances.
Benefits:
• Constructing a Fishbone Diagram is easy to learn and do
• Excellent visual tool for organizing critical thinking
• Involves workers in problem resolution
• Explore root causes and record them helps organize the
discussion
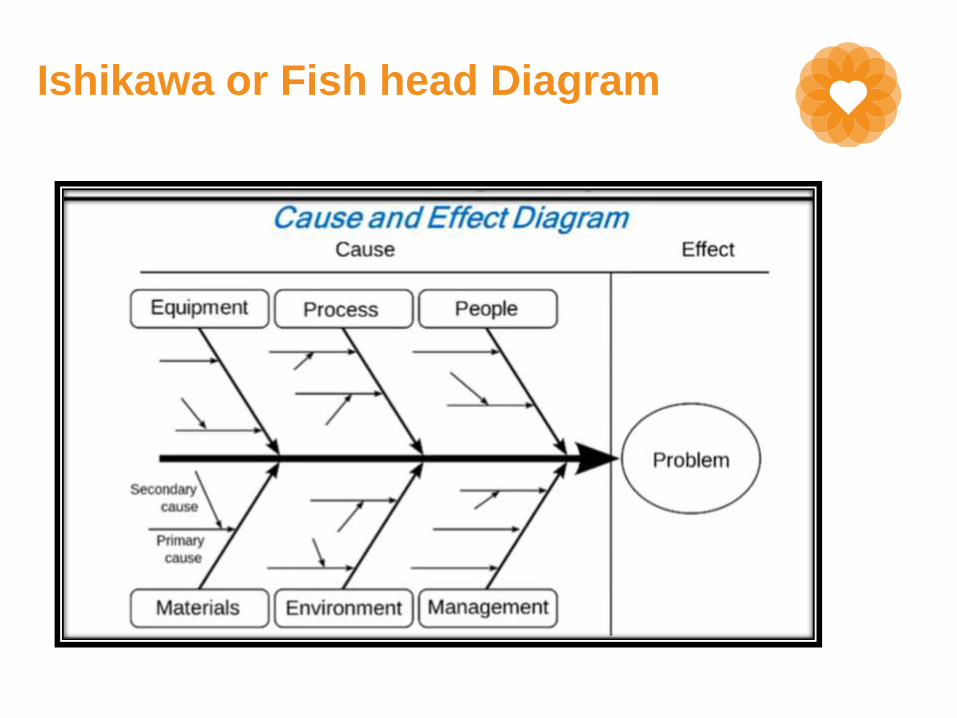
Ishikawa or Fish head Diagram
Intro to Pareto Chart
When to use Pareto Chart
The Pareto analysis is based on the Pareto Principle, also known as the
80/20 rule, which states that 20 percent of effort yields 80 percent of
results.
A Pareto analysis requires identifying organizational problems and they
are ranked in order from the (most) to the (least) severe. As a Manager,
problems ranked (most) in severity should become the main focus for
problem resolution or improvement.
Teams get along best when employees identify the root causes of
problems and spend time resolving the biggest problems to yield the
greatest organizational benefit.
When to use Pareto Chart
To organizes problems into cohesive categories, facts, not opinion or
emergency. You argue for change based on data. Once you've clearly
outlined facts, you can begin the planning to solve the problems within
the framework we have to work with.
Budget Prioritize Time and Changes
Balance and Focus
As an SME, Pareto allows me to conduct analysis and measure and
compare the impact of changes that have taken place.
I will think systematically and long term while producing small
continuous improvements along the way. This is the answer to a
stress free environment.
Small incremental improvements are the answer to relieving the
pain of fighting fires everyday. Pareto will help prepare you.
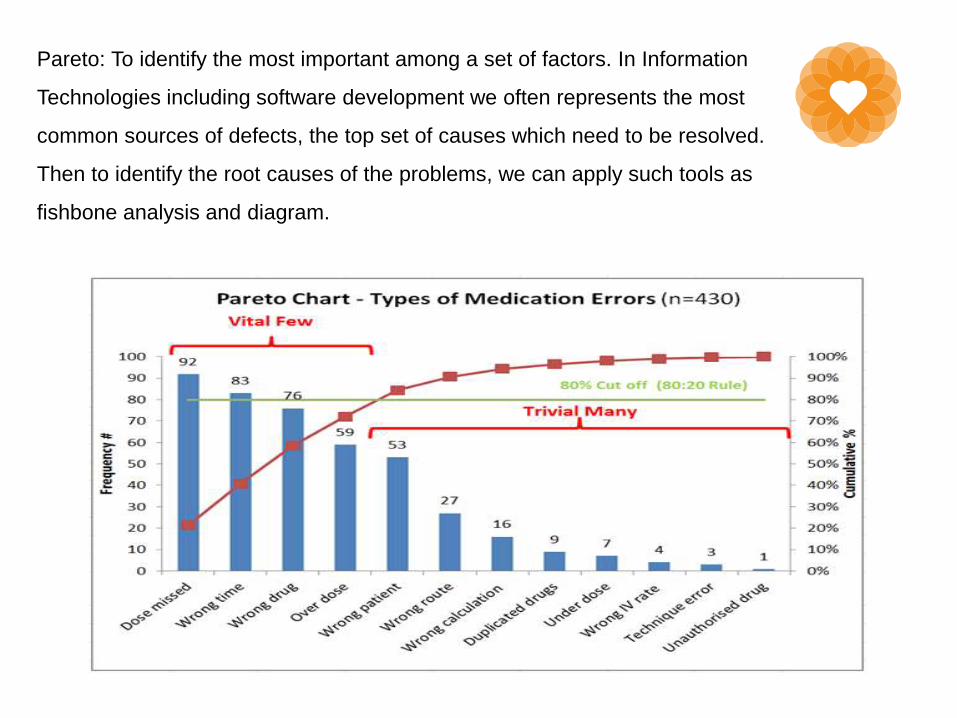
Pareto: To identify the most important among a set of factors. In Information
Technologies including software development we often represents the most
common sources of defects, the top set of causes which need to be resolved.
Then to identify the root causes of the problems, we can apply such tools as
fishbone analysis and diagram.
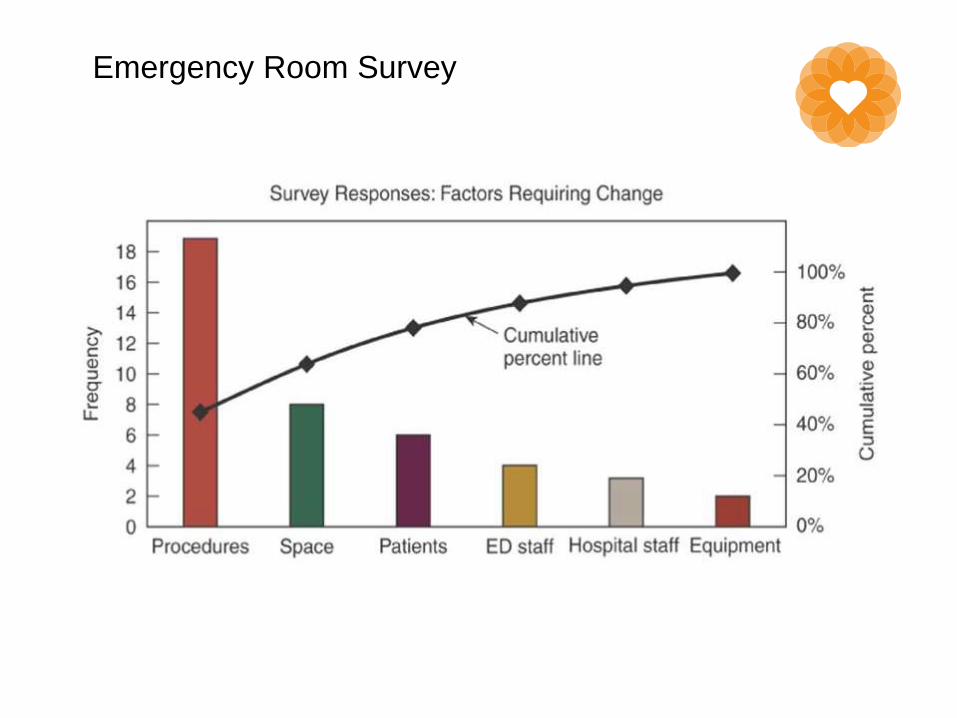
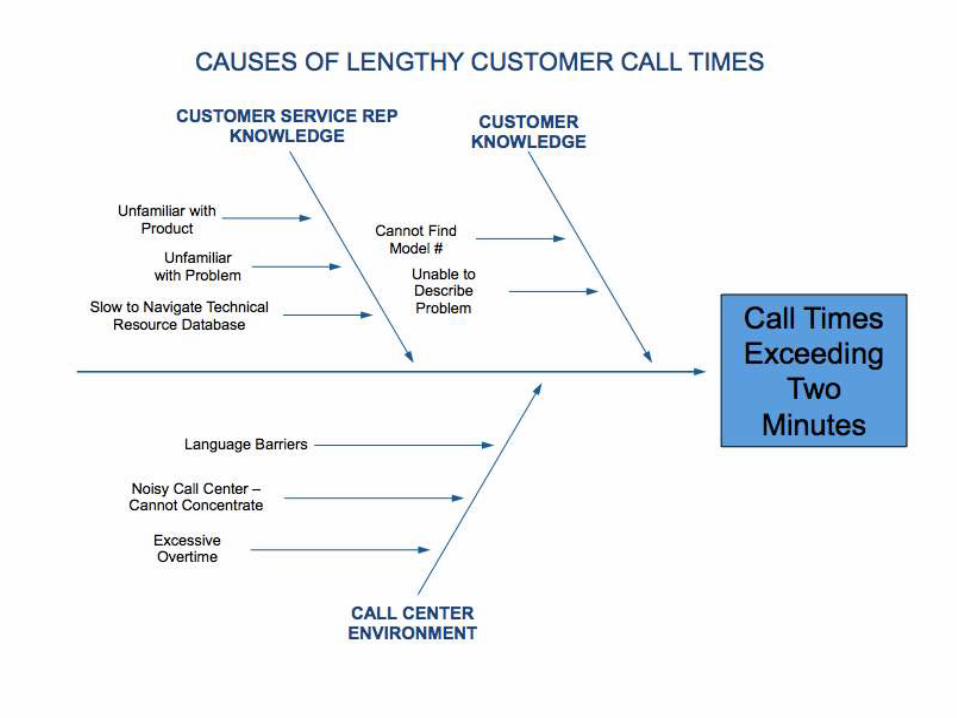
Emergency Room Survey

Types of Customer Service Calls
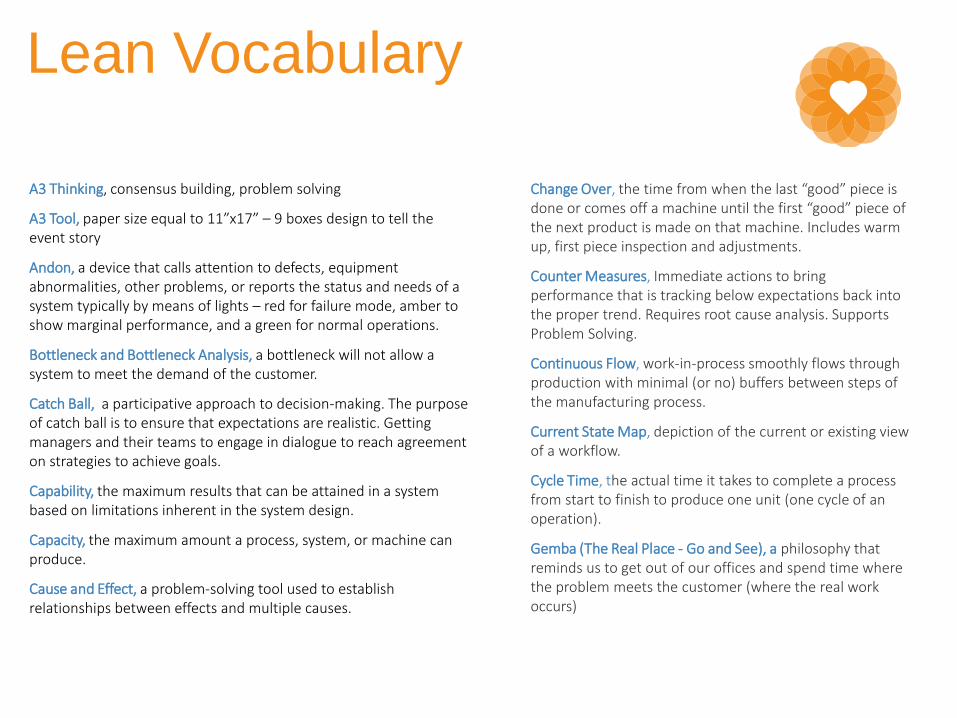
Lean Vocabulary
DPH’s Epic Implementation Story
A3 Thinking, consensus building, problem solving
A3 Tool, paper size equal to 11”x17” – 9 boxes design to tell the event story
Andon, a device that calls attention to defects, equipment abnormalities, other problems, or reports the status and needs of a system typically by means of lights – red for failure mode, amber to show marginal performance, and a green for normal operations.
Bottleneck and Bottleneck Analysis, a bottleneck will not allow a system to meet the demand of the customer.
Catch Ball, a participative approach to decision-making. The purpose of catch ball is to ensure that expectations are realistic. Getting managers and their teams to engage in dialogue to reach agreement on strategies to achieve goals.
Capability, the maximum results that can be attained in a system based on limitations inherent in the system design.
Capacity, the maximum amount a process, system, or machine can produce.
Cause and Effect, a problem-solving tool used to establish relationships between effects and multiple causes.
Change Over, the time from when the last “good” piece is done or comes off a machine until the first “good” piece of the next product is made on that machine. Includes warm up, first piece inspection and adjustments.
Counter Measures, Immediate actions to bring performance that is tracking below expectations back into the proper trend. Requires root cause analysis. Supports Problem Solving.
Continuous Flow, work-in-process smoothly flows through production with minimal (or no) buffers between steps of the manufacturing process.
Current State Map, depiction of the current or existing view of a workflow.
Cycle Time, the actual time it takes to complete a process from start to finish to produce one unit (one cycle of an operation).
Gemba (The Real Place - Go and See), a philosophy that reminds us to get out of our offices and spend time where the problem meets the customer (where the real work occurs)
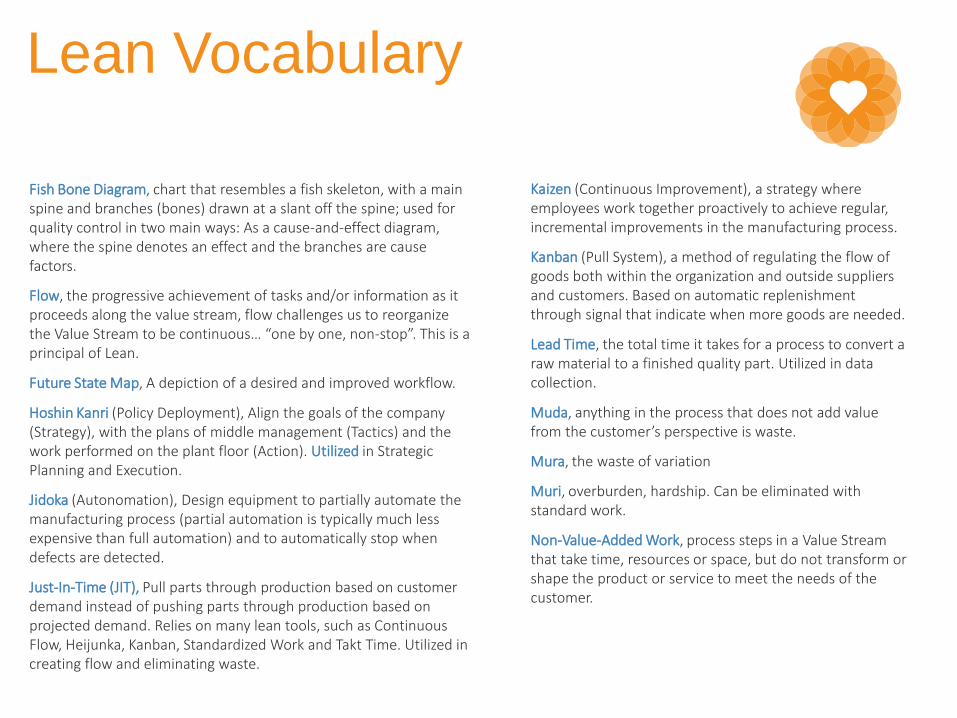
Lean Vocabulary
DPH’s Epic Implementation Story
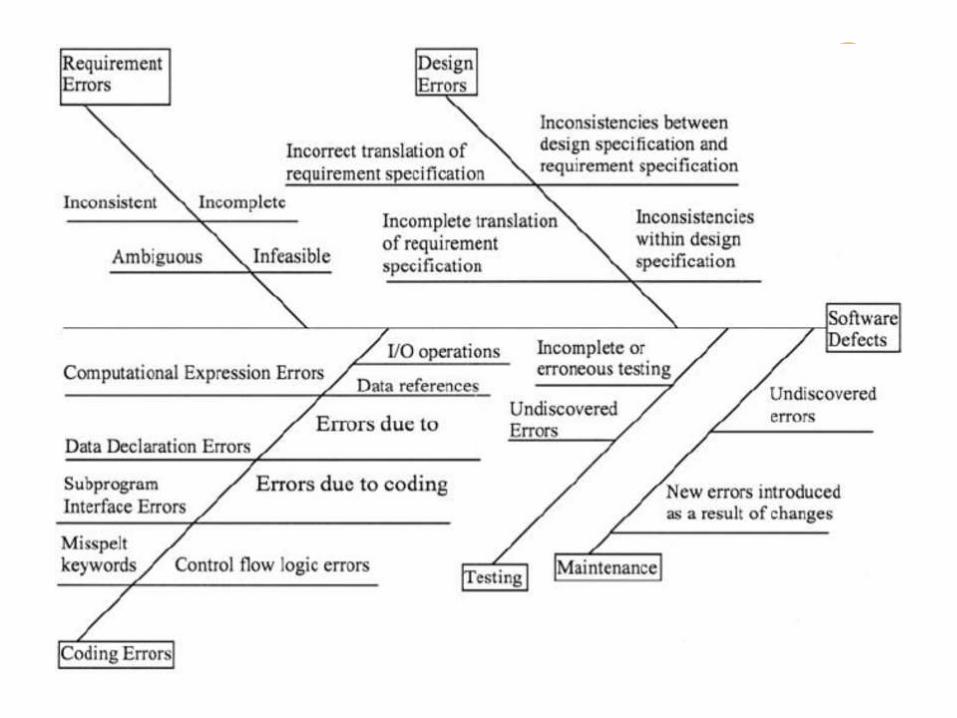
Fish Bone Diagram, chart that resembles a fish skeleton, with a main spine and branches (bones) drawn at a slant off the spine; used for quality control in two main ways: As a cause-and-effect diagram, where the spine denotes an effect and the branches are cause factors.
Flow, the progressive achievement of tasks and/or information as it proceeds along the value stream, flow challenges us to reorganize the Value Stream to be continuous… “one by one, non-stop”. This is a principal of Lean.
Future State Map, A depiction of a desired and improved workflow.
Hoshin Kanri (Policy Deployment), Align the goals of the company (Strategy), with the plans of middle management (Tactics) and the work performed on the plant floor (Action). Utilized in Strategic Planning and Execution.
Jidoka (Autonomation), Design equipment to partially automate the manufacturing process (partial automation is typically much less expensive than full automation) and to automatically stop when defects are detected.
Just-In-Time (JIT), Pull parts through production based on customer demand instead of pushing parts through production based on projected demand. Relies on many lean tools, such as Continuous Flow, Heijunka, Kanban, Standardized Work and Takt Time. Utilized in creating flow and eliminating waste.
Kaizen (Continuous Improvement), a strategy where employees work together proactively to achieve regular, incremental improvements in the manufacturing process.
Kanban (Pull System), a method of regulating the flow of goods both within the organization and outside suppliers and customers. Based on automatic replenishment through signal that indicate when more goods are needed.
Lead Time, the total time it takes for a process to convert a raw material to a finished quality part. Utilized in data collection.
Muda, anything in the process that does not add value from the customer’s perspective is waste.
Mura, the waste of variation
Muri, overburden, hardship. Can be eliminated with standard work.
Non-Value-Added Work, process steps in a Value Stream that take time, resources or space, but do not transform or shape the product or service to meet the needs of the customer.
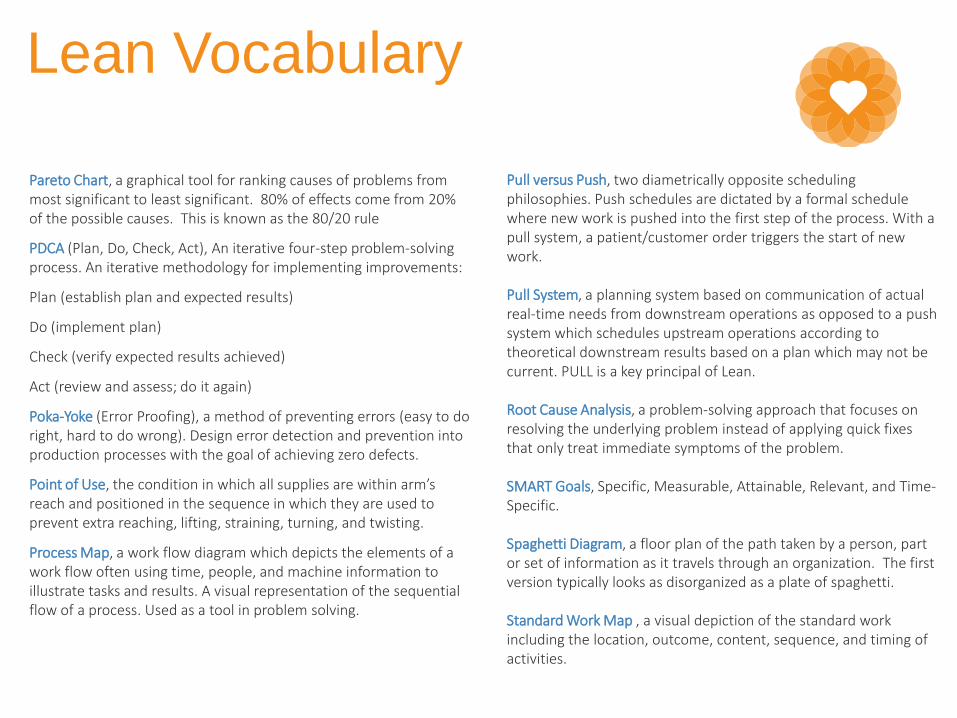
Lean Vocabulary
DPH’s Epic Implementation Story
Pareto Chart, a graphical tool for ranking causes of problems from most significant to least significant. 80% of effects come from 20% of the possible causes. This is known as the 80/20 rule
PDCA (Plan, Do, Check, Act), An iterative four-step problem-solving process. An iterative methodology for implementing improvements:
Plan (establish plan and expected results)
Do (implement plan)
Check (verify expected results achieved)
Act (review and assess; do it again)
Poka-Yoke (Error Proofing), a method of preventing errors (easy to do right, hard to do wrong). Design error detection and prevention into production processes with the goal of achieving zero defects.
Point of Use, the condition in which all supplies are within arm’s reach and positioned in the sequence in which they are used to prevent extra reaching, lifting, straining, turning, and twisting.
Process Map, a work flow diagram which depicts the elements of a work flow often using time, people, and machine information to illustrate tasks and results. A visual representation of the sequential flow of a process. Used as a tool in problem solving.
Pull versus Push, two diametrically opposite scheduling philosophies. Push schedules are dictated by a formal schedule where new work is pushed into the first step of the process. With a pull system, a patient/customer order triggers the start of new work.
Pull System, a planning system based on communication of actual real-time needs from downstream operations as opposed to a push system which schedules upstream operations according to theoretical downstream results based on a plan which may not be current. PULL is a key principal of Lean.
Root Cause Analysis, a problem-solving approach that focuses on resolving the underlying problem instead of applying quick fixes that only treat immediate symptoms of the problem.
SMART Goals, Specific, Measurable, Attainable, Relevant, and Time-Specific.
Spaghetti Diagram, a floor plan of the path taken by a person, part or set of information as it travels through an organization. The first version typically looks as disorganized as a plate of spaghetti.
Standard Work Map , a visual depiction of the standard work including the location, outcome, content, sequence, and timing of activities.
Lean Vocabulary
DPH’s Epic Implementation Story
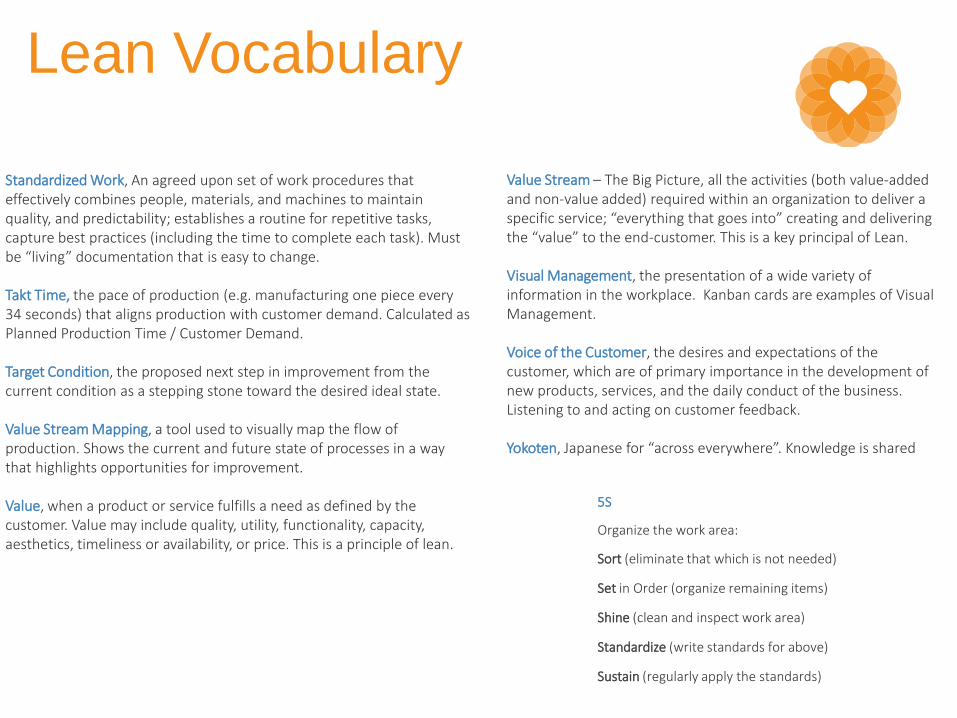
Standardized Work, An agreed upon set of work procedures that effectively combines people, materials, and machines to maintain quality, and predictability; establishes a routine for repetitive tasks, capture best practices (including the time to complete each task). Must be “living” documentation that is easy to change.
Takt Time, the pace of production (e.g. manufacturing one piece every 34 seconds) that aligns production with customer demand. Calculated as Planned Production Time / Customer Demand.
Target Condition, the proposed next step in improvement from the current condition as a stepping stone toward the desired ideal state.
Value Stream Mapping, a tool used to visually map the flow of production. Shows the current and future state of processes in a way that highlights opportunities for improvement.
Value, when a product or service fulfills a need as defined by the customer. Value may include quality, utility, functionality, capacity, aesthetics, timeliness or availability, or price. This is a principle of lean.
Value Stream – The Big Picture, all the activities (both value-added and non-value added) required within an organization to deliver a specific service; “everything that goes into” creating and delivering the “value” to the end-customer. This is a key principal of Lean.
Visual Management, the presentation of a wide variety of information in the workplace. Kanban cards are examples of Visual Management.
Voice of the Customer, the desires and expectations of the customer, which are of primary importance in the development of new products, services, and the daily conduct of the business. Listening to and acting on customer feedback.
Yokoten, Japanese for “across everywhere”. Knowledge is shared
5S
Organize the work area:
Sort (eliminate that which is not needed)
Set in Order (organize remaining items)
Shine (clean and inspect work area)
Standardize (write standards for above)
Sustain (regularly apply the standards)

Lean Key Concepts
Lean Intro
Welcome to Lean
What is Lean? The core principal of Lean is respect for the individual, provide value for
the customer while minimizing waste. Who defines value? The customer.
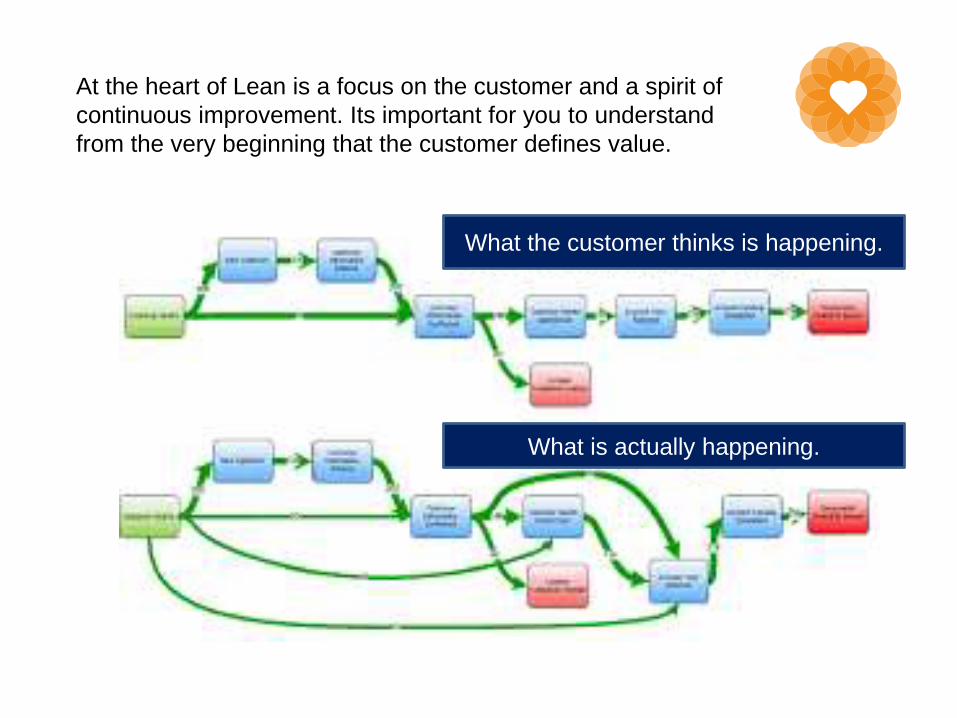
At the heart of Lean is a focus on the customer and a spirit of
continuous improvement. Its important for you to understand
from the very beginning that the customer defines value.
What the customer thinks is happening.
What is actually happening.
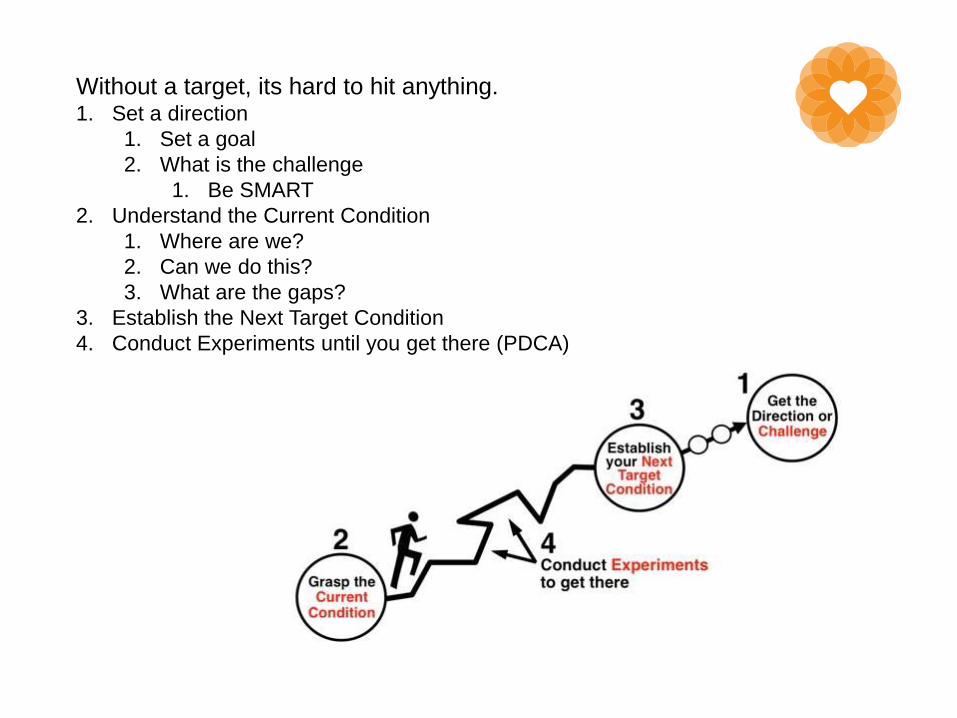
Without a target, its hard to hit anything. 1. Set a direction
1. Set a goal
2. What is the challenge
1. Be SMART
2. Understand the Current Condition
1. Where are we?
2. Can we do this?
3. What are the gaps?
3. Establish the Next Target Condition
4. Conduct Experiments until you get there (PDCA)
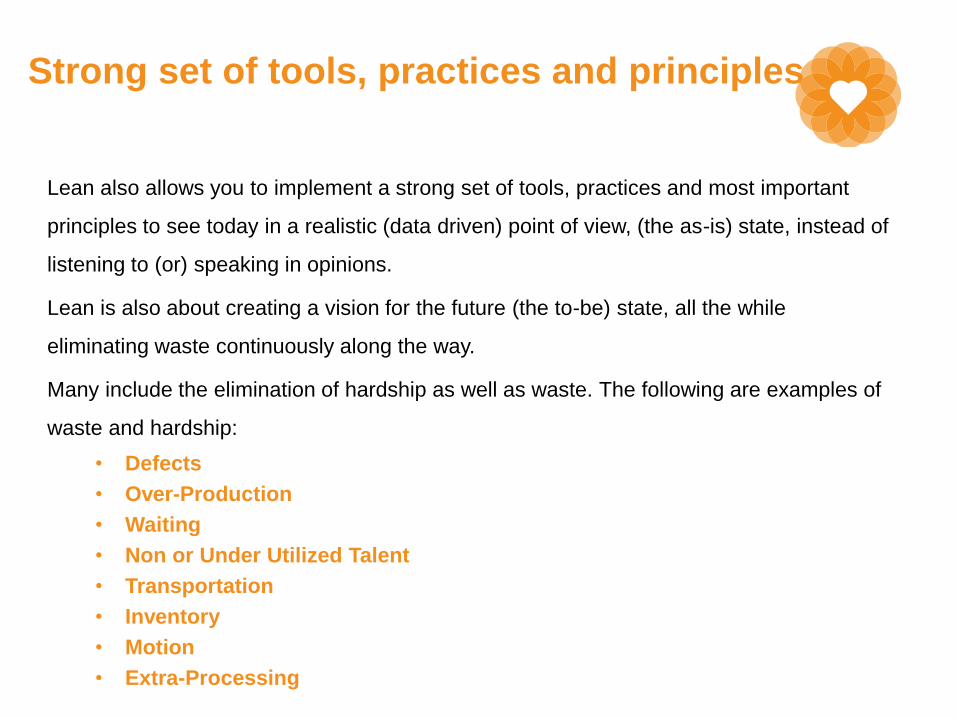
Strong set of tools, practices and principles
Lean also allows you to implement a strong set of tools, practices and most important
principles to see today in a realistic (data driven) point of view, (the as-is) state, instead of
listening to (or) speaking in opinions.
Lean is also about creating a vision for the future (the to-be) state, all the while
eliminating waste continuously along the way.
Many include the elimination of hardship as well as waste. The following are examples of
waste and hardship:
• Defects
• Over-Production
• Waiting
• Non or Under Utilized Talent
• Transportation
• Inventory
• Motion
• Extra-Processing
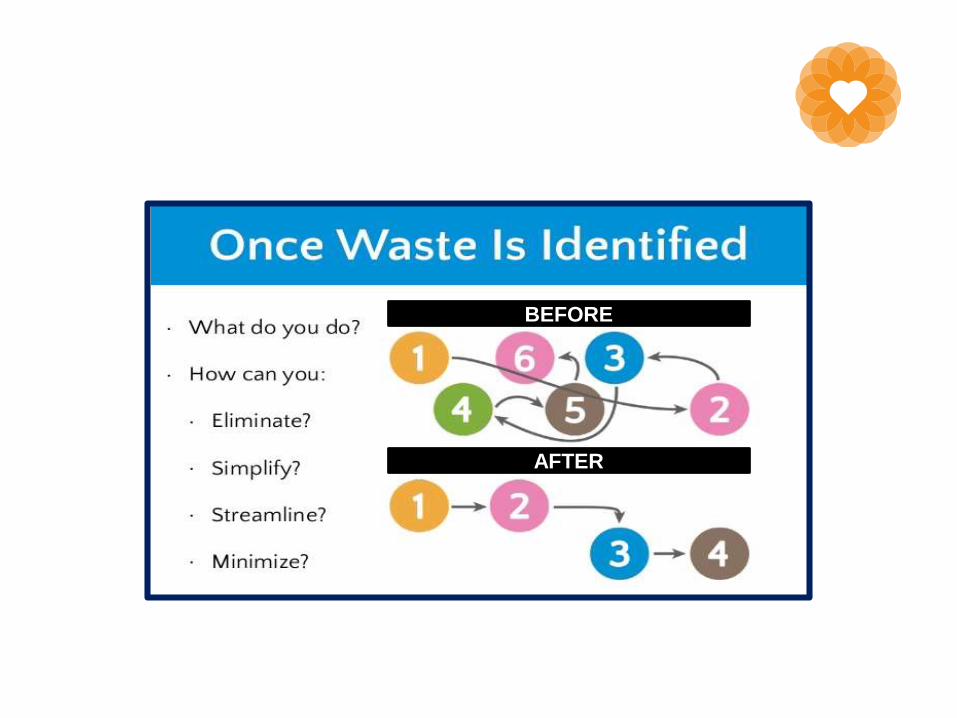
BEFORE
AFTER
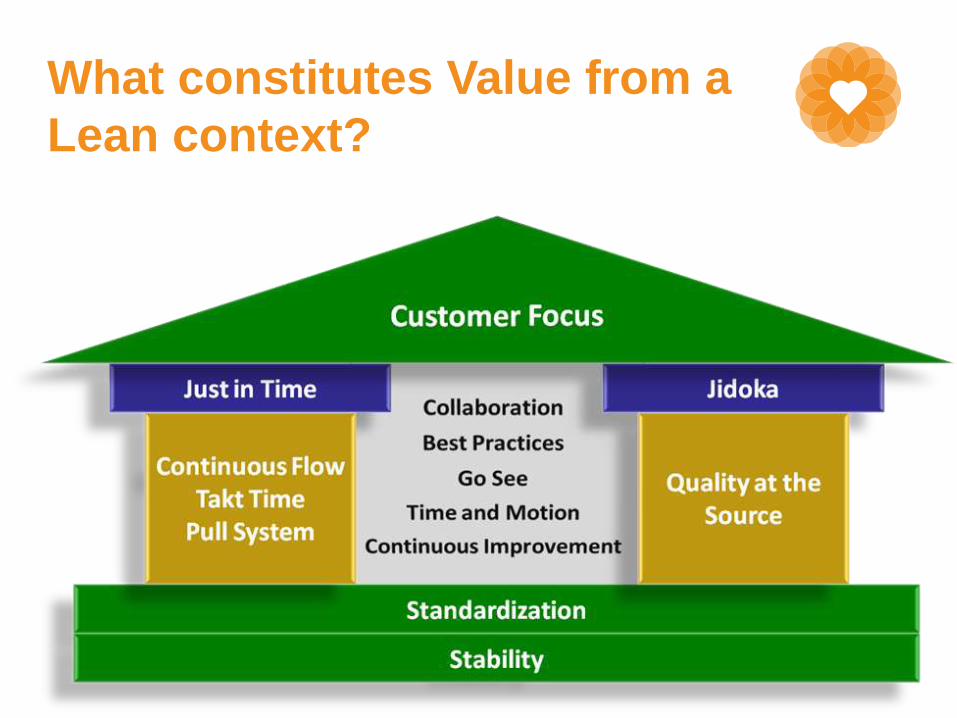
What constitutes Value from a
Lean context?
Everyone has their own perception of what
constitutes value.
What customers value and how they value it changes with circumstance and time.
In lean, we teach that in all cases, value is defined by the customer.
As you work with your customers to define value, you are also defining your activities and
action items:
What needs to be done
What I need to be doing
How I need to be doing the activities
and even...
...should I be doing this work?
Consider this question: When a barista writes your name on the cup for your double
espresso are they “adding value” to your drink? It all depends on how you define value.
You could decide yes, adding my name adds value, it lets me and the barista know the
drink belongs to me.
You could decide no, adding my name adds NO value to my double espresso.
Defining “value” is important
Defining “value” is important because it forms the foundation upon which you build Lean
processes to deliver that value and satisfy your customer.
What is more difficult to understand is what these customers deem worthy and then how
to define, apply, measure, and translate their definition of value into a real product, new or
improved process or service.
In lean, we teach that in all cases, value is defined by the customer.
Key Lean Concepts: Lean Enterprise
Institute: Source: Lean Lexicon.
Continuous Flow
Producing and moving one item at a time (or a small and consistent batch of items)
through a series of processing steps as continuously as possible, with each step making
just what is requested by the next step. It is also called one-piece flow, single-piece flow,
and make one, move one.
Cycle Time
How often a part or product is completed by a process, as timed by observation. This
time includes operating time plus the time required to prepare, load, and unload. The
appropriate calculation of cycle time may depend upon context. For example, if a paint
process completes a batch of 22 parts every five minutes, the cycle time for the batch is
five minutes. However, the cycle time for an individual part is 13.6 seconds (5 minutes x
60 seconds = 300 seconds, divided by 22 parts = 13.6 seconds).
At its core, Lean revolves around a
few key concepts.
Jidoka
Providing machines and operators the ability to detect when an abnormal condition has
occurred and immediately stop work. This enables operations to build-in quality at each
process and to separate men and machines for more efficient work. Jidoka is one of the
two pillars of the Toyota Production System along with just-in-time. Jidoka is sometimes
called autonomation, meaning automation with human intelligence.
Just-in-Time (JIT) Production
A system of production that makes and delivers just what is needed, just when it is
needed, and just in the amount needed. JIT and jidoka are the two pillars of the Toyota
Production System.
At its core, Lean revolves around a
few key concepts.
Kaizen
Continuous improvement of an entire value stream or an individual process to create
more value with less waste. There are two levels of kaizen: (1) System or flow kaizen
focuses on the overall value stream and (2) process kaizen focuses on individual
processes.
Kanban
A signaling device that gives authorization and instructions for the production or
withdrawal (conveyance) of items in a pull system. The term is Japanese for sign or
signboard.
At its core, Lean revolves around a
few key concepts.
Lean Thinking
A 5-step thought process proposed by James Womack and Dan Jones in their 1996 book
Lean Thinking to guide managers through a lean transformation. The steps are:
Specify value from the standpoint of the end customer.
Identify all the steps in the value stream.
Make the value creating steps flow toward the customer.
Let customers pull value from the next upstream activity.
Pursue perfection.
At its core, Lean revolves around a
few key concepts.
Plan, Do, Check, Act (PDCA)
An improvement cycle based on the scientific method of proposing a change in a
process, implementing the change, measuring the results, and taking appropriate action.
It is also known as the Deming Cycle after W. Edwards Deming who introduced the
concept in Japan in the 1950s. The PDCA cycle has four stages:
Plan: Determine goals for a process and needed changes to achieve them.
Do: Implement the changes.
Check: Evaluate the results in terms of performance.
Act: Standardize and stabilize the change or begin the cycle again, depending on the
results.
At its core, Lean revolves around a
few key concepts.
Production Lead Time (also Throughput Time and Total Product
Cycle Time)
The time required for a product to move all the way through a process from start to finish.
At the plant level this is often termed door-to-door time. The concept can also be applied
to the time required for a design to progress from start to finish in product development or
for a product to proceed from raw materials all the way to the customer.
At its core, Lean revolves around a
few key concepts.
Takt Time
The available production time divided by customer demand. For example, if a widget
factory operates 480 minutes per day and customers demand 240 widgets per day, takt
time is two minutes. Similarly, if customers want two new products per month, takt time is
two weeks. The purpose of takt time is to precisely match production with demand. It
provides the heartbeat of a lean production system.
Value Stream
All of the actions, both value-creating and nonvalue-creating, required to bring a product
from concept to launch and from order to delivery. These include actions to process
information from the customer and actions to transform the product on its way to the
customer.
At its core, Lean revolves around a
few key concepts.
Value Stream Mapping (VSM)
A simple diagram of every step involved in the material and information flows needed to bring a
product from order to delivery. A current-state map follows a product’s path from order to delivery to
determine the current conditions. A future-state map shows the opportunities for improvement
identified in the current-state map to achieve a higher level of performance at some future point.
Waste
Any activity that consumes resources but creates no value for the customer.
At its core, Lean revolves around a
few key concepts.
A Process is a group of steps, tasks, or activities, which take Inputs (People, Material, Information)
and changes them to produce an Output (Service, Product)
Measure of “What is important to Customer”. In Lean Six Sigma projects are designed to improve
CTQ. Examples of CTQ is improving customer / patience waiting time in clinic waiting room.
Defect is nonconformance on one of many possible quality characteristics of a product or service that
causes customer dissatisfaction. Not delivering what the customer wants or needs.
Process Capability: What the process can deliver.
Variation: What the customer sees and feels.
Stable Operations: Ensuring consistent, predictable processes to improve what the customer sees
and feels.
Design : Designing to meet customer needs and process capability.
Customers feel the variance, not the means. Meaning they feel the mistakes not the daily operations.