lean product development - irdg (industry research ... · pdf filethe objective of lean...
TRANSCRIPT

© IRDG 2014Slide 1
Lean Product Development
Executive Overview
Prepared for IRDG and
presented by –
Ron Mascitelli, PMP
President
Technology Perspectives
© IRDG 2014Slide 2
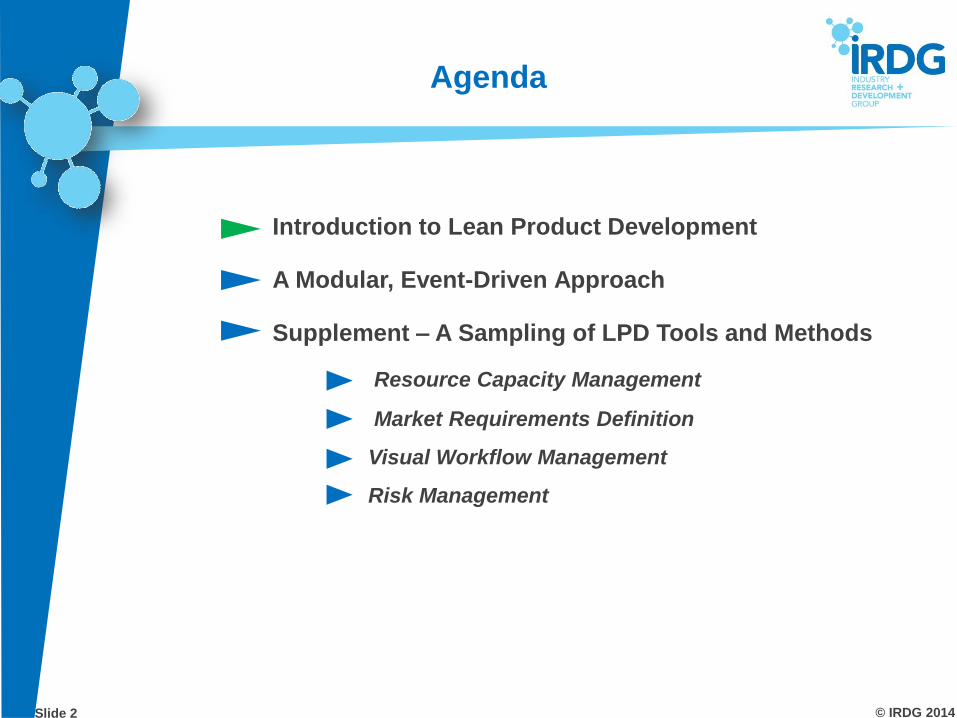
Agenda
Introduction to Lean Product Development
A Modular, Event-Driven Approach
Supplement – A Sampling of LPD Tools and Methods
Resource Capacity Management
Market Requirements Definition
Visual Workflow Management
Risk Management

© IRDG 2014Slide 3
What is Lean Product Development?
The objective of Lean Product Development is to
significantly improve the efficiency, effectiveness,
and speed of new product development.
This is accomplished through an integrated framework
of practical tools and methods that:
Ensure true cross-functional collaboration
Enable rapid and effective decision-making
Capture valuable knowledge for future reuse
Eliminate wasted time, cost, and resource capacity
The LPD framework is designed to fit within an existing
governance process (e.g., stage / gate), or can stand
on its own, providing both governance and execution
methodology.

© IRDG 2014Slide 4
The Challenge:
Elimination of Product Development Waste
Chaotic work environment – constant interruptions
Lack of available resources – resource bottlenecks
Lack of clear prioritization of projects / tasks
Failure to proactively mitigate project risks
Failure to reuse knowledge and learn from the past
Poorly defined initial product requirements
Disruptive changes to product requirements
Lack of early consideration of manufacturability
Over-designing, analysis paralysis, gold-plating
E-mail overload / Too many @!%&* meetings

© IRDG 2014Slide 5
What are the Benefits?
Significant improvement in schedule predictability
Reduced time-to-market consistent with cost and quality goals
Enhanced flexibility and agility in meeting changing market needs
Increased productivity of design and development resources
Ability to capture and benefit from organizational knowledge
Smoother transition from development to full-rate production

© IRDG 2014Slide 6
Fundamental Principle :
EARLY is Always BETTER!
A more focused effort in the early stages of a
development project will allow more time to truly optimize
a new product design:
Early intensive focus on customer requirements definition
Early collaborative planning of the project
Early identification of risks and mitigation strategies
Early consideration of multiple design options
Early learning – closing of knowledge gaps
Early consideration of manufacturability, cost & quality

© IRDG 2014Slide 7
Fundamental Principle:
Cross-Functional Collaboration and
Personal Accountability
True cross-functional collaboration goes well beyond
names on a team roster, to achieve emotional commitment and
personal accountability to team / project goals.
Week 1 Week 2
Mon Wed Fri Mon Wed Fri
2-weekPlan
MilestoneWk 3 +
Fabricate
Prototype
Prototype
Testing
Prototype
Validated
Production
Tooling
Test Plan
Complete
Final Drwg.
Release
Week 1 Week 2
Mon Wed Fri Mon Wed Fri
2-weekPlanTeam
Member
Tom
Dick
Harry
Jane
Sally
Mary
Wk 3 +Week 1 Week 2
Mon Wed Fri Mon Wed Fri
2-weekPlanTeam
Member
Tom
Dick
Harry
Jane
Sally
Mary
Wk 3 +Week 1 Week 2
Mon Wed Fri Mon Wed Fri
2-weekPlanTeam
Member
Tom
Dick
Harry
Jane
Sally
Mary
Wk 3 +
System Board – Milestone Focus
Functional / Sub-system Boards – Task Focus
© IRDG 2014Slide 8
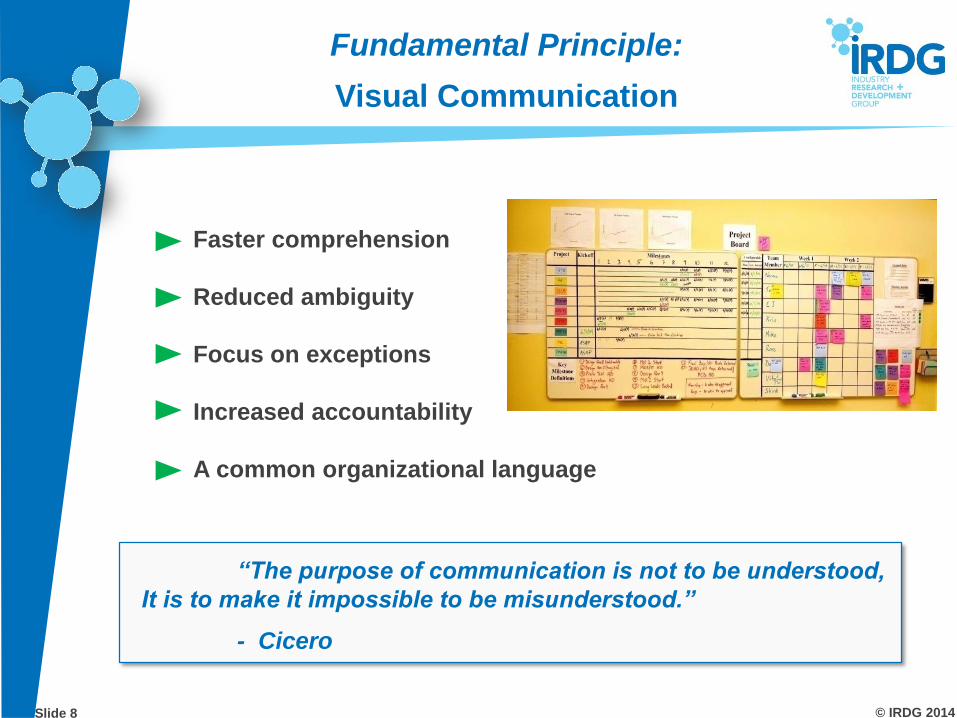
Fundamental Principle:
Visual Communication
“The purpose of communication is not to be understood,
It is to make it impossible to be misunderstood.”
- Cicero
Faster comprehension
Reduced ambiguity
Focus on exceptions
Increased accountability
A common organizational language

© IRDG 2014Slide 9
Fundamental Principle:
Knowledge-Based Development
LPD Tools and Events are designed to be “self-documenting”
and provide a straightforward mechanism for organizational learning:
Performance trade-offs
Cost reduction solutions
Risk mitigation strategies
Knowledge of market needs
Quality enhancements
Solutions to technical problems
Improvements to process and
execution

© IRDG 2014Slide 10
A Learning Organization Harnesses
Knowledge to Improve Their Odds
Known Market / Customer Risks
Source /
Reference
Proven
Mitigation
Strategies
Specific customer needs not known
Conflicting requirements of multiple market sub-segments
Use environment for new product not well-understood
User behavior when interacting with product not clear
System-level integration requirements for product not known
Regulatory requirements not fully understood
Advantages / disadvantages of competitors’ products not well-understood
Competitor releases new product prior to launch date
Volume forecast is not accurate
Price point for product is not accurate
Specific market conditions (e.g., price of fuel, preference trends) may undermine
business case
Customer requirements will change prior to launch date
Past negative history with current products may affect market acceptance of new
product
0
5
10
15
20
25
Months from Project Start
Pro
jec
t “R
isk
Ra
tin
g”
Month 1
Month 2 Month 3 Month 4 Month 5Wk 1 Wk 2 Wk 3 Wk 4
LoadingPlanTeam
Member
Tom
Dick
Harry
Jane
Sally
Mary
Date First Submitted: Submitted By:
Product Designation: Revision Number: Prepared By:
1 What specific customer problem(s) does the new product solve? 1 Market forecast:
Minimum "Most Likely" Optimistic
2 Description of target customers / market segments. Year 1 Target Market Price =
Year 2 Target Mfg. Cost =
3 Key differentiating features / performance levels. Year 3 Target Entry Date =
1 2 Risk Analysis:
2 Risk Impact (1-5)
3
4 Critical physical characteristics (weight / dimensions / etc.).
5 Critical performance requirements / features.
6 Other critical requirements / mandates for competitive parity 3 Investment: Total Non-Recurring Investment (Capital and Labor) =
4 Profitability Calculation:
Risk-Adjusted NPV = (NPV / Max. Risk Impact)
Description of Strategic Alignment:
Step 1 -
1 Supports Retention of Existing Customers - Step 2 -
2
3
4
5 Step 3 -
6
7
8
9
10
Product Business-Case Brief
Description of Opportunity Financial / Risk Analysis
Strategic Assessment
Sales Volumes -
Market Risk -
Description of Critical Risk(s)
Schedule Risk -
Technical Risk -
Assessment of Strategic Impact (1 - 10 Scale):
Cost / Quality Risk -
Net Present Value (NPV) =
Project Productivity Metric =
Increases "Mindshare" Among Customers -
Calculate Overall Project Rating .
(Productivity Metric x Total Strategic Score)
Overall Project Rating =
(Based on 3-Year "Most Likely" Sales)
Opportunity Assessment
Non-Recurring Engineering (NRE) =
Estimate the no. of design / development hours required to commercialize the new product.
Calculate the "Productivity Metric" for the proposed new product.
(Risk-Adjusted NPV / Est. NRE)
Notes and Comments:
Total Strategic Score =
Contributes to Growth of Market Share -
Encourages Pull-Through of Other Products -
Supports Development of New Markets -
Contributes to Product Line Cost Reduction -
Contributes to Image of Firm in Marketplace -
Enables Implementation of New Technologies -
Supports Development of Core Competencies -
Supports Overall Strategic Roadmap -
Business Case Brief
Risk “Trigger Lists”
Risk “Burn-Down” Tool
Knowledge Brief
Customer Persona
Capacity Planning Tool
Knowledge-Based
Risk Reduction
© IRDG 2014Slide 11
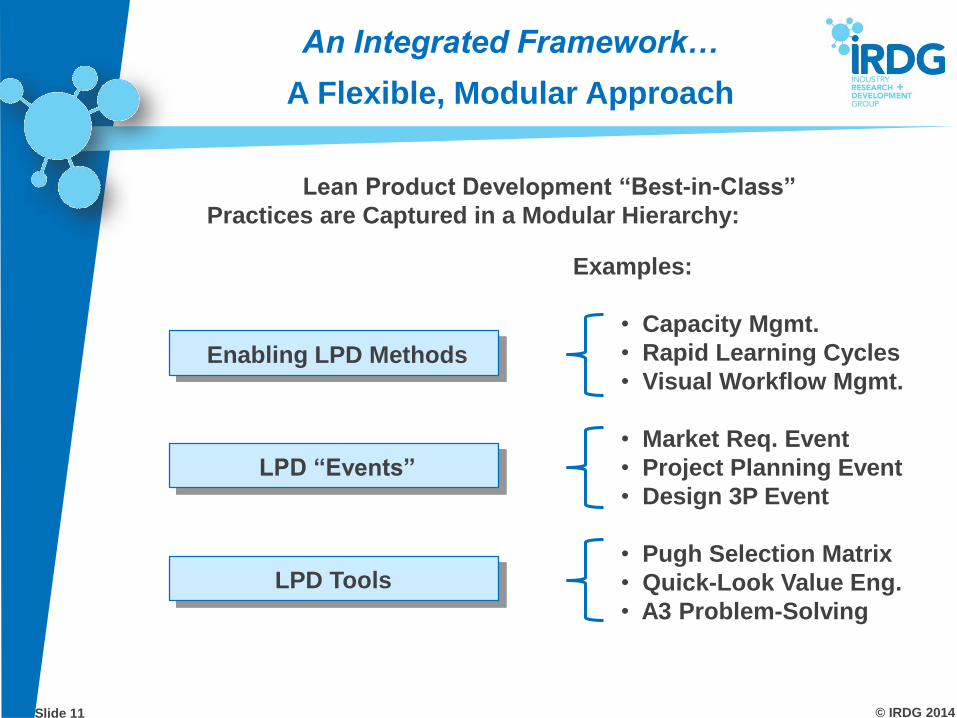
An Integrated Framework…
A Flexible, Modular Approach
Lean Product Development “Best-in-Class”
Practices are Captured in a Modular Hierarchy:
Enabling LPD Methods
Examples:
• Capacity Mgmt.
• Rapid Learning Cycles
• Visual Workflow Mgmt.
• Market Req. Event
• Project Planning Event
• Design 3P Event
• Pugh Selection Matrix
• Quick-Look Value Eng.
• A3 Problem-Solving
LPD “Events”
LPD Tools

© IRDG 2014Slide 12
Agenda and
Review of
Event Inputs
Prior
to Event
Event “Standard Work”
After
the EventCollaborative
Application of
Standard Tools
and Methods
Attendee
Expectations
and
Preparation
Creation of
Event Outputs
Recommendations and
Assignment of Actions
Disposition of Actions
and Report-Back to
Review Team
An Integrated Framework…
Lean Product Development “Events”

© IRDG 2014Slide 13
Learning Cycle
Event(s)
Project Planning /
Risk Mitigation
Event
Design Review
& Freeze Event(s)
Design 3P
Event
Process 3P
Event
Production 3P
Event
Knowledge-Based
Development
Production Process
Preparation (3P)
Visual Workflow Management
Governance – Project Prioritization – Capacity / Resource Mgmt.
Knowledge-Based Development / Learning Organization
Market Rqmts.
Event
An Integrated Framework…
The Full-Scale Event-Driven LPD Process

© IRDG 2014Slide 14
A Practical, Common-Sense Approach
to Slashing Waste
“Common Sense is genius dressed in its working clothes.”
- Ralph Waldo Emerson
“Common Sense is something that you already know...
once someone points it out to you.”
- Ron Mascitelli
=

© IRDG 2014Slide 15
Agenda
Introduction to Lean Product Development
A Modular, Event-Driven Approach
Supplement – A Sampling of LPD Tools and Methods
Resource Capacity Management
Market Requirements Definition
Visual Workflow Management
Risk Management
© IRDG 2014Slide 16
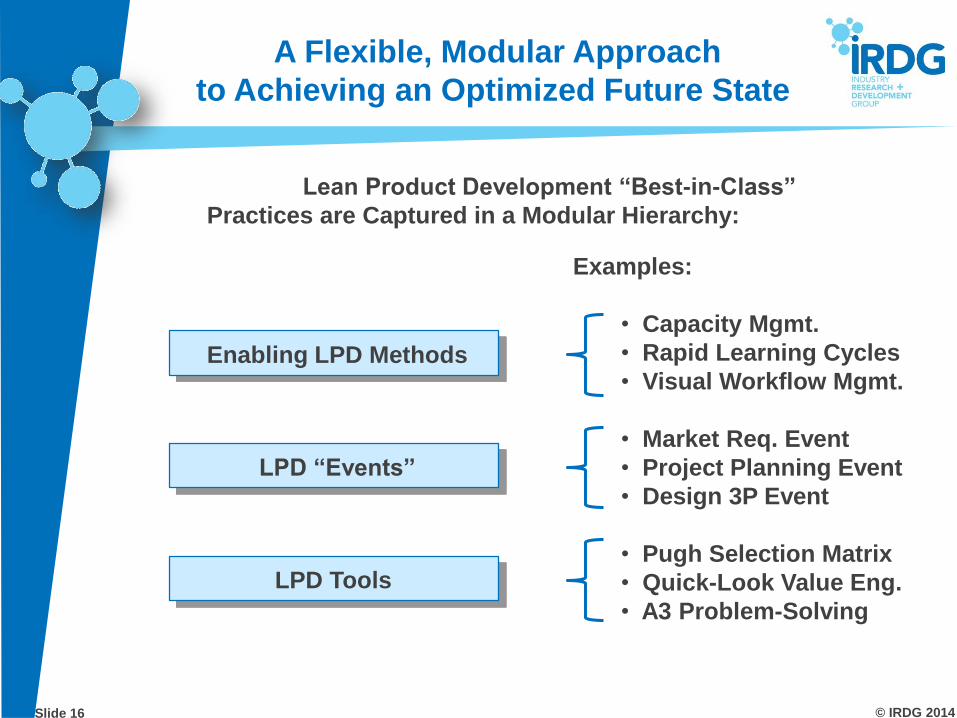
Lean Product Development “Best-in-Class”
Practices are Captured in a Modular Hierarchy:
Enabling LPD Methods
Examples:
• Capacity Mgmt.
• Rapid Learning Cycles
• Visual Workflow Mgmt.
• Market Req. Event
• Project Planning Event
• Design 3P Event
• Pugh Selection Matrix
• Quick-Look Value Eng.
• A3 Problem-Solving
LPD “Events”
LPD Tools
A Flexible, Modular Approach
to Achieving an Optimized Future State

© IRDG 2014Slide 17
Agenda and
Review of
Event Inputs
Prior
to Event
Event “Standard Work”
After
the EventCollaborative
Application of
Standard Tools
and Methods
Attendee
Expectations
and
Preparation
Creation of
Event Outputs
Recommendations and
Assignment of Actions
Disposition of Actions
and Report-Back to
Review Team
What are Lean Product Development
“Events”?

© IRDG 2014Slide 18
Learning Cycle
Event(s)
Project Planning /
Risk Mitigation
Event
Design Review
& Freeze Event(s)
Design 3P
Event
Process 3P
Event
Production 3P
Event
Knowledge-Based
Development
Production Process
Preparation (3P)
Visual Workflow Management
Governance – Project Prioritization – Capacity / Resource Mgmt.
Knowledge-Based Development / Learning Organization
Market Rqmts.
Event
A Full-Scale Implementation of an
Event-Driven LPD Process

© IRDG 2014Slide 19
Agenda
Introduction to Lean Product Development
A Modular, Event-Driven Approach
Supplement – A Sampling of LPD Tools and Methods
Resource Capacity Management
Market Requirements Definition
Visual Workflow Management
Risk Management

© IRDG 2014Slide 20
An A3 Template for Project Selection
and Prioritization
Date First Submitted: Submitted By:
Product Designation: Revision Number: Prepared By:
1 What specific customer problem(s) does the new product solve? 1 Market forecast:
Minimum "Most Likely" Optimistic
2 Description of target customers / market segments. Year 1 Target Market Price =
Year 2 Target Mfg. Cost =
3 Key differentiating features / performance levels. Year 3 Target Entry Date =
1 2 Risk Analysis:
2 Risk Impact (1-5)
3
4 Critical physical characteristics (weight / dimensions / etc.).
5 Critical performance requirements / features.
6 Other critical requirements / mandates for competitive parity 3 Investment: Total Non-Recurring Investment (Capital and Labor) =
4 Profitability Calculation:
Risk-Adjusted NPV = (NPV / Max. Risk Impact)
Description of Strategic Alignment:
Step 1 -
1 Supports Retention of Existing Customers - Step 2 -
2
3
4
5 Step 3 -
6
7
8
9
10
Product Business-Case Brief
Description of Opportunity Financial / Risk Analysis
Strategic Assessment
Sales Volumes -
Market Risk -
Description of Critical Risk(s)
Schedule Risk -
Technical Risk -
Assessment of Strategic Impact (1 - 10 Scale):
Cost / Quality Risk -
Net Present Value (NPV) =
Project Productivity Metric =
Increases "Mindshare" Among Customers -
Calculate Overall Project Rating .
(Productivity Metric x Total Strategic Score)
Overall Project Rating =
(Based on 3-Year "Most Likely" Sales)
Opportunity Assessment
Non-Recurring Engineering (NRE) =
Estimate the no. of design / development hours required to commercialize the new product.
Calculate the "Productivity Metric" for the proposed new product.
(Risk-Adjusted NPV / Est. NRE)
Notes and Comments:
Total Strategic Score =
Contributes to Growth of Market Share -
Encourages Pull-Through of Other Products -
Supports Development of New Markets -
Contributes to Product Line Cost Reduction -
Contributes to Image of Firm in Marketplace -
Enables Implementation of New Technologies -
Supports Development of Core Competencies -
Supports Overall Strategic Roadmap -

© IRDG 2014Slide 21
All Development Opportunities
Should Pass Through a Prioritization “Funnel”
Initial Review and
Screening Business-Case
Validation and Project
PrioritizationP
rod
uct
Idea
Su
bm
itta
l Te
mp
late
Fo
rmal
Bu
sin
ess
-
Case D
evelo
pm
en
t
Ideas f
rom
All S
ou
rces
© IRDG 2014Slide 22
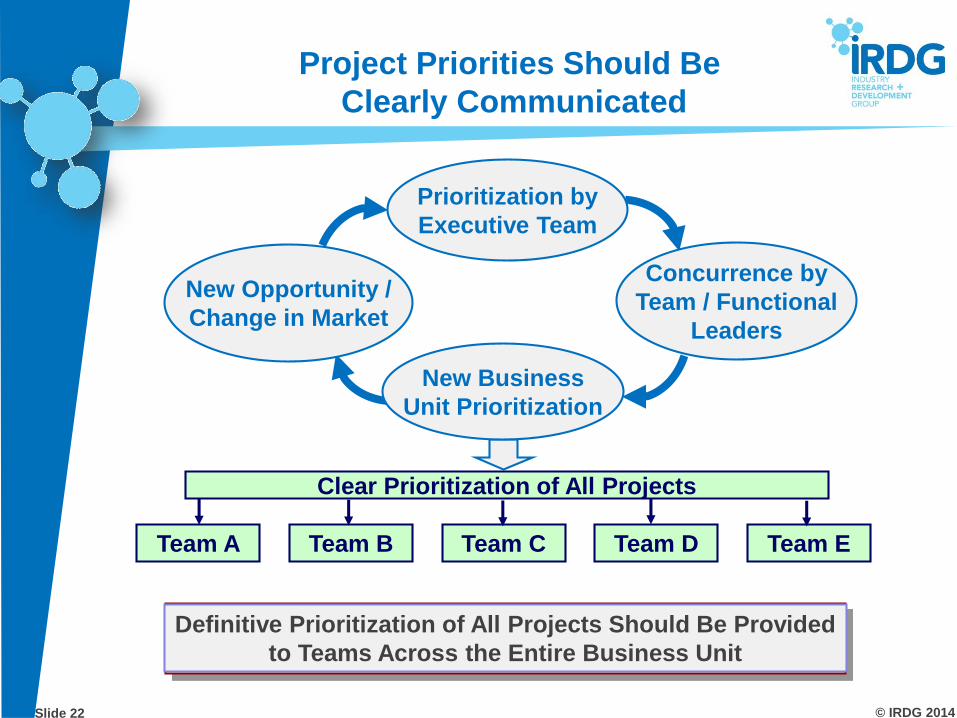
Project Priorities Should Be
Clearly Communicated
Clear Prioritization of All Projects
Team A Team B Team C Team D Team E
New Business
Unit Prioritization
New Opportunity /
Change in Market
Prioritization by
Executive Team
Concurrence by
Team / Functional
Leaders
Definitive Prioritization of All Projects Should Be Provided
to Teams Across the Entire Business Unit

© IRDG 2014Slide 23
A “Push” System for Capacity Management
Results in Turbulent “Batching”
Launch
Projects are
“pushed” into
funnel without
prioritization or
capacity mgmt.
Finite Development
Capacity
Business Case
Approved
Resulting in
“Turbulent Flow”

© IRDG 2014Slide 24
A “Pull” System Maximizes the Value and
Quantity of New Products
Launch
Projects are
prioritized and
submitted to
a “buffer
kanban”
Finite Development
Capacity
Business Case
Approved
Resulting in
“Laminar Flow”
1
2
3
4
Kanban is reviewed
monthly by mgmt.
team and are
“pulled” as capacity
becomes available.

© IRDG 2014Slide 25
Agenda
Introduction to Lean Product Development
A Modular, Event-Driven Approach
Supplement – A Sampling of LPD Tools and Methods
Resource Capacity Management
Market Requirements Definition
Visual Workflow Management
Risk Management

© IRDG 2014Slide 26
The Market Requirements Event
Objective –
To transform voice-of-the-customer (market) data
Into a prioritized list of product design requirements that
maximize customer value, market acceptance, and profits.
Key Outputs –
Market Positioning Statement
Prioritized Customer Benefits / Key Differentiators
Prioritized List of Features & Performance Levels
Action Assignments to Execute the Above

© IRDG 2014Slide 27
What Does “Market Positioning” Mean?
A product’s “position” in the market is its unique
combination of performance / features, price, and quality.
Ideally, that position is large and well-defined enough to
provide a robust business case.
Competitors’
Products
Price
Perc
eiv
ed
Qu
ality
Uncontested
Market
Position

© IRDG 2014Slide 28
A Concise Template for Capturing
a Customer “Persona”

© IRDG 2014Slide 29
Worked Example for a Speedboat Product
Key differentiators for this product (Scores > 3)
Critical “parity” factor for this product (Score > 1)
Your Current
Product
(N1)
Competitor A
Product (N2)
Competitor
B Product
(N3)
High Top Speed 3 0.3 0.4 0.4 7.50 0.3
Rapid Acceleration 3 0.4 0.5 0.5 6.00 0.3
High Towing Capacity 2 0.7 0.8 0.8 2.50 0.2Gas Mileage 1 0.7 0.7 0.8 1.25 0.1
Appearance 3 0.3 0.4 0.4 7.50 0.3
Safety 2 0.7 0.6 0.8 2.50 0.2
Next Gen. GPS Navigation 2 0.3 0.3 1 2.00 1.4
Advanced Two-Way Radio 1 0.3 0.5 0.5 2.00 0.2
Low Maintanence Cost 2 0.5 0.5 0.6 3.33 0.2
Fish-Finder Radar 1 TBD TBD TBD TBD TBD
Supports Scuba-Diving 2 0.3 0.4 0.4 5.00 0.2
Supports Water-Skiing 3 0.5 0.6 0.7 4.29 0.6
Assumptions /
Open Issues
Degree to Which Market Needs Are Totally
Satisfied (N = 30% to 100%)
Differentiation
Opportunity
(D = R / Max. N)
Need for Parity
(P = R x [Max. (N2,
N3) - N1])Possible Key Differentiators
Relevance to the
Buying Decision
(1 - 3)

© IRDG 2014Slide 30
Prioritized Requirements for Our
Worked Example
Derived Engineering
Requirement(s) Must-Have Should-Have Could-Have
Technical
Risk
(H,M,L)
Schedule
Risk
(H,M,L)
Cost
Risk
(H,M,L) Comments
Top End Speed 70 mph 80 mph 90 mph M M H
Engine Torque 350 ft-lbs. 400 ft-lbs. 450 ft-lbs. L M M
Engine Horsepower 300 hp 330 hp 380 hp L M M
Engine Power Band Optimization 1500-2500 rpm 1500-3000 rpm 1500-3500 rpm M M M
Trottle Response Time 3 sec. 2 sec. 1 sec. L L L
High-Performance Throttle
Linkage X N/A N/A N/A
Exterior Finish 2-color gel coat 3-color gel coat 3-color / met. L L M
Exterior Trim Chrome Chrome / Wood L M H
Next Gen. Navigation System X L L L
Single Hull / Carbon Fiber X H H H
Scuba Storage X L L LOn-board Tank Compressor X N/A N/A N/A

© IRDG 2014Slide 31
Agenda
Introduction to Lean Product Development
A Modular, Event-Driven Approach
Supplement – A Sampling of LPD Tools and Methods
Resource Capacity Management
Market Requirements Definition
Visual Workflow Management
Risk Management

© IRDG 2014Slide 32
An Integrated System for
Workflow Management
Stand-up Meeting Visual Project Board
Stand-up meetings, combined with visual
project board allow for maximum team
communication and efficiency.
Rapid Feedback
Communication
Risk Avoidance
Control

© IRDG 2014Slide 33
The “Visual Project Board” is a Living
Workflow Management Tool
Two-Week Action PlanProject Timeline
Parking Lot
Risk Management
0
5
10
15
20
25
Months from Project Start
Pro
jec
t “R
isk
Ra
tin
g”
Near-Term Action ItemResponsible
Team MemberDue Date
Completion
Date
M / S / C
PriorityComments
Create prototype parts kit Jane M. 4/27/09 M Parts missing
Draft test plan out for review Joe P. 5/1/09 5/8/09 S Complete
Complete circuit simulation Cedrick M. 5/1/09 M Need Resources!!
Order injection-mold tooling Joline Q. 5/5/09 M
Meet with key supplier Harry P. 5/10/09 C
Prepare for customer meeting Dave N. 5/10/09 S
Planned Work
Unplanned Work
Progress MilestoneCritical
Path?
Responsible
Team Member
Planned
Start Date
Actual
Start Date
Planned
Completion
Date
Actual
Completion
Date
Cost
Status
Schedule
Status
Tech.
StatusComments
Fabricate Prototype R David Copperfield 1/12/13 1/12/2013 2/7/13 2/7/13 G G G Complete
Prototype Testing Oliver Twist 1/25/13 1/30/13 3/5/13 G Y Y First Test Failed
Prototype Validated R Tiny Tim 2/1/13 R 2/14/13 R R Y May Require Rework
Production Tooling R Charles Darney 2/14/13 4/24/13 G R G Supplier Issues
Test Plan Complete Sydney Carton 2/20/13 3/20/13 Y Y G Resources Unavailable
Final Drawing Release Lucy Mannette 3/5/13 4/17/13 G G G
Fabricate Qual Units Charles Dickens 3/23/13 5/14/13 G G G
Week 1 Week 2
Mon Wed Fri Mon Wed Fri
2-weekPlanTeam
Member
Tom
Dick
Harry
Jane
Sally
Mary
Wk 3 +

© IRDG 2014Slide 34
Example of a Single-Project Visual Board

© IRDG 2014Slide 35
Example of a Multi-Project Visual Board
Project Cadence Board Multi-Project Wall Gantt

© IRDG 2014Slide 36
A Practical “Virtual” Version of the
Visual Project Board
Courtesy Foth Companies

© IRDG 2014Slide 37
Agenda
Introduction to Lean Product Development
A Modular, Event-Driven Approach
Supplement – A Sampling of LPD Tools and Methods
Resource Capacity Management
Market Requirements Definition
Visual Workflow Management
Risk Management

© IRDG 2014Slide 38
Proactive Risk MitigationR
eso
urc
e L
oad
ing
Time-to-Profit
Launch Date
Reso
urc
e L
oad
ing
Time-to-Profit
Launch Date
Reactive Risk Mitigation Proactive Risk Mitigation
Without risk mitigation, team leader will tend to ramp up
resources too slowly at the beginning, and try to
make up schedule slips at the end.
Front-end loading of risks gives the team leader a better
chance of meeting launch date.

© IRDG 2014Slide 39
Lessons Learned
from Previous
Projects
Historical Data
from Similar
Products
Experience of
Core Team
Members
Risk
Identification
and
Prioritization
Risk Management –
Harnessing Lessons-Learned From
Previous Projects
Market Risks
Technical Risks
Schedule Risks
Cost/Quality Risks
Other Filters?
Prioritized List
of Project Risks
to Be
Mitigated

© IRDG 2014Slide 40
Starting Point –
A Trigger List for Market / Customer Risks
Known Market / Customer Risks
Source /
Reference
Proven
Mitigation
Strategies
Specific customer needs not known
Conflicting requirements of multiple market sub-segments
Use environment for new product not well-understood
User behavior when interacting with product not clear
System-level integration requirements for product not known
Regulatory requirements not fully understood
Advantages / disadvantages of competitors’ products not well-understood
Competitor releases new product prior to launch date
Volume forecast is not accurate
Price point for product is not accurate
Specific market conditions (e.g., price of fuel, preference trends) may undermine
business case
Customer requirements will change prior to launch date
Past negative history with current products may affect market acceptance of new
product
© IRDG 2014Slide 41
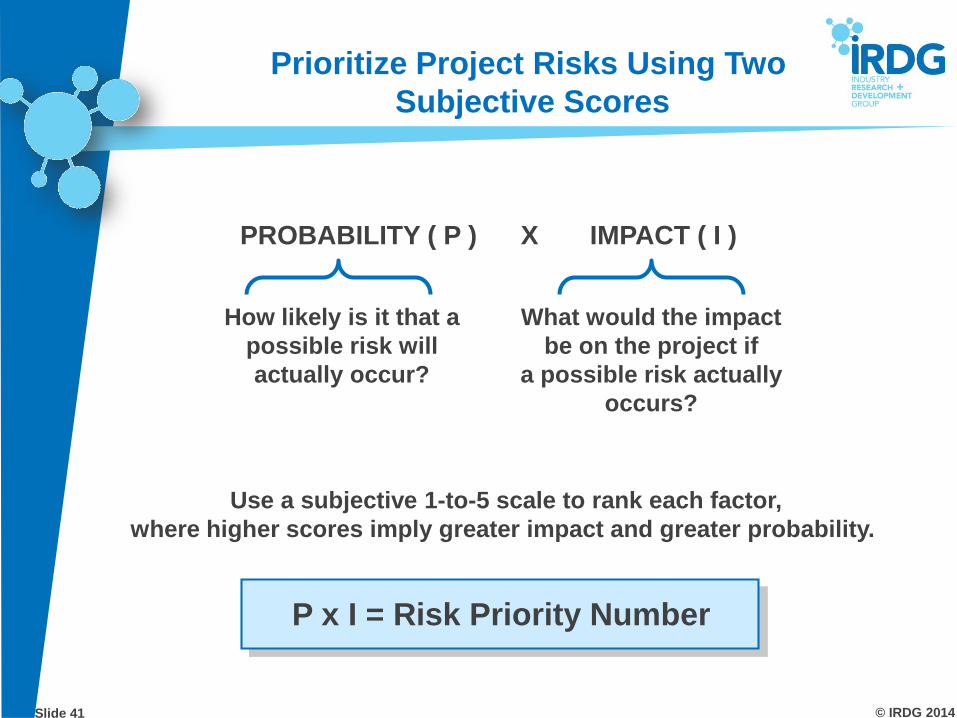
Prioritize Project Risks Using Two
Subjective Scores
PROBABILITY ( P ) X IMPACT ( I )
What would the impact
be on the project if
a possible risk actually
occurs?
How likely is it that a
possible risk will
actually occur?
P x I = Risk Priority Number
Use a subjective 1-to-5 scale to rank each factor,
where higher scores imply greater impact and greater probability.

© IRDG 2014Slide 42
A “Risk Register” is Created
to Track Risks and Mitigation Actions
Project Name:
Project Kick-off Date: Latest Revision Date:
Project Risk Description
Probability
of
Occurance
(1 - 5)
Project
Impact
(1 - 5)
Risk
Priority
Number
Triggering Event
(What determines
whether the RISK
has become an
ISSUE?)
Mitigation Deadline
(Latest date at
which risk
mitigation can be
effective)
Mitigation
Action
Taken
Responsible
Team
Member
Planned
Completion
Date
Actual
Completion
Date
Comments
0
0
0
0
0
0
0
0
0
0
0
0
0
0
0
0
0
0
0

© IRDG 2014Slide 43
A Simple Way to Assign Risk Priorities
Pro
bab
ilit
y o
f O
ccu
rren
ce
5
4
3
2
1
Impact
1 2 3 4 5
= Must assign action item(s) for mitigation

© IRDG 2014Slide 44
A Visual Tool for Managing Risk –
The Risk Burn-Down Chart
Concept
Freeze
Design
Freeze
Product
Launch
Exception:
New risks
identified
Target:
Ave. < 12 & none
higher than 16
Target:
Ave. < 8 & none
higher than 12
Some risks
may carry
into production
0
5
10
15
20
25
Months from Project Start
Pro
ject
“R
isk R
ati
ng
”

© IRDG 2014Slide 45
Biography of Ron Mascitelli, PMP
Ron served as both Senior Scientist and Director of R&D for Hughes Electronics and the
Santa Barbara Research Center. His industry experience includes management of advanced
projects for the Department of Defense, the Defense Advanced Research Projects Agency
(DARPA), Lawrence Livermore Laboratory, NASA, and the Department of Energy.
Since founding Technology Perspectives in 1994, Ron Mascitelli has worked with over
eighty companies to improve their product development performance and product-line
profitability. In addition, he has published more than twenty papers and technical articles in
major journals and trade publications, and is a contributing author for IEEE’s Technology
Management Handbook. He is the author of five critically acclaimed books, including the
recently published Mastering Lean Product Development. Ron currently lives with his wife and
their numerous pets in Northridge, CA.
Ron Mascitelli, PMP (Project Management Professional, Masters
Degree Solid State Physics, University of California, Los Angeles)
is the Founder and President of Technology Perspectives. Ron is
a recognized leader in the development of advanced product devel-
opment methods. He presents his workshops and seminars
internationally, and has created company-specific lean product
development improvement programs for over one hundred leading
firms, including Boeing, Intel, Beckman Coulter, Boston Scientific,
Adidas, Lockheed-Martin, Parker Hannifin, Briggs & Stratton,
Goodrich Aerospace, Hughes Electronics, and Rockwell Automation.