lean six sigma - oer universityh222767.temppublish.com/24_lss/013512512x_im.pdf · 1.2 what are the...
TRANSCRIPT
Online Instructor’s Manual with Selected Answers to accompany
Lean Six Sigma
Donna C. S. Summers
Upper Saddle River, New Jersey Columbus, Ohio

___________________________________________________________________________ Copyright © 2011 by Pearson Education, Inc., Upper Saddle River, New Jersey 07458. Pearson Prentice Hall. All rights reserved. Printed in the United States of America. This publication is protected by Copyright and permission should be obtained from the publisher prior to any prohibited reproduction, storage in a retrieval system, or transmission in any form or by any means, electronic, mechanical, photocopying, recording, or likewise. For information regarding permission(s), write to: Rights and Permissions Department. Pearson Prentice Hall™ is a trademark of Pearson Education, Inc. Pearson® is a registered trademark of Pearson plc Prentice Hall® is a registered trademark of Pearson Education, Inc. Instructors of classes using Summers, Lean Six Sigma, may reproduce material from the instructor’s manual for classroom use.
10 9 8 7 6 5 4 3 2 1
ISBN-13: 978-0-13-512512-0 ISBN-10: 0-13-512512-X

Table of Contents Chapter 1 1 Chapter 2 6 Chapter 3 9 Chapter 4 12 Chapter 5 15 Chapter 6 18 Chapter 7 22 Chapter 8 25 Chapter 9 32 Chapter 10 39 Chapter 11 44 Chapter 12 47 Chapter 13 48 Chapter 14 51 Chapter 15 53 Chapter 16 58 Chapter 17 62 Chapter 18 67 Chapter 19 70 Chapter 20 77 Chapter 21 79 Chapter 22 82

1
Chapter 1 Questions 1.1 Describe the goals of the lean methodology.
Lean techniques seek to improve value-added process flow. Lean concepts seek to reduce the waste present in processes and activities. This waste may be present in downtime, rework, waiting, or inspection. Lean techniques focus on finding and eliminating non-value added activities.
1.2 What are the benefits of implementing lean?
Lean tools and techniques are designed to improve process performance, improve quality and productivity, while reducing costs and enhancing profitability. Companies implementing lean have reported significant reductions in cycle times, handling costs, lead times, floor space usage, inventory, and customer service activities. At the same time, they see a significant improvement in quality, inventory turns, profit margins, and customer responsiveness.
1.3 What do lean projects focus on? Why?
Lean projects focus on reducing waste, wasted time, materials, people, and effort.
1.4 Why would an organization want to implement lean methodology?
Lean tools and techniques are designed to improve process performance, improve quality and productivity, while reducing costs and enhancing profitability. Companies implementing lean have reported significant reductions in cycle times, handling costs, lead times, floor space usage, inventory, and customer service activities. At the same time, they see a significant improvement in quality, inventory turns, profit margins, and customer responsiveness.
1.5 Review the seven sources of waste.
Over production: making more than the customer ordered Idle time: having parts waiting around to be worked on because a machine
isn’t working or having parts queuing up to be worked on because the line isn’t balanced.
Delivery: Conveying a part from one side of the plant to another because the two machine it needs to be processed on aren’t located near each other.
Waste in the work itself: having to repeat work because the first time there wasn’t enough information to complete the job.

2
Inventory waste: not using what was purchased or making too much of something in order to make up for quality problems.
Wasted operation motion: walking to go get tools or parts. Waste of rejected parts: not making something correctly the first time. 1.6 Describe the five steps of lean process improvement.
1. Study the process by directly observing the work activities, their connections, and flow. 2. Study the process to systematically eliminate wasteful activities, their connections, and flow. 3. Establish agreement among those affected by the process in terms of what the process needs to accomplish and how the process will accomplish it.
4. Attach and solve problems using a systematic method. 5. Integrate the above approach throughout the organization. 1.7 Describe the cycle that lean improvement projects often follow.
Lean improvement projects include: a. Practice the five Ss. b. Develop a continuous flow that operates based on takt time. c. Establish a pull system to control production. d. Introduce line balancing and level scheduling. e. Practice kaizen to continually eliminate waste, reduce batch sizes,
and create continuous flow. 1.8 Describe the Six Sigma methodology to someone who has not heard of it.
Six Sigma projects have eight essential phases: recognize, define, measure, analyze, improve, control, standardize, and integrate. This cycle is sometimes expressed as DMAIC (define, measure, analyze, improve and control). As The tools utilized during a project include statistical process control techniques, customer input, Failure Modes and Effects Analysis, Design of Experiments, process mapping, cause and effect diagrams, multivariate analysis, pre-control, design for manufacturability. Six Sigma also places a heavy reliance on graphical methods for analysis. Statistical methods, teamwork, and project management are key components of Six Sigma.
1.9 What do Six Sigma projects focus on? Why?
Essentially, Six Sigma is about results, enhancing profitability through improved quality and efficiency. Improvement projects are chosen based

3
on their ability to contribute to the bottom line on a company’s income statement by being connected to the strategic objectives and goals of the corporation. Projects that do not directly tie to customer issues or financial results are often difficult to sell to management. Six Sigma projects are easy to identify, since the Six Sigma methodology seeks to reduce the variability present in processes, project teams seek out sources of waste, such as overtime and warranty claims, investigate production backlogs or areas in need of more capacity, and focus on customer and environmental issues.
1.10 Describe the changes that occur to the spread of the process when the amount of variation in the process decreases.
When the amount of variation decreases, whatever is being produced or whatever service is being provided becomes more homogeneous. Each product or service becomes more similar to the one previous and the one following. By removing the variation present in the process, Six Sigma organizations narrow the spread of the process. This enables the products produced or the services provided to more easily meet the specifications placed on them by the customer.
1.11 What are the benefits of implementing the Six Sigma methodology?
An organization that implements the Six Sigma methodology is better able to produce more products and services with its existing resources through an improved customer focus and streamlined work processes. With its increased awareness of its internal and external customers, there is a greater focus on what really needs to be accomplished in order to meet their customers’ needs and expectations, therefore increasing their profitability through increased customer retention. Being able to meet customer expectations the first time and every time will enable the organization to increase its market share as new customers seek them out. Six Sigma organizations seek out sources of waste in the process. They focus on reducing the variability present in the process. Since a Six Sigma organization has focused and streamlined its work processes they will benefit from lower costs because of reduced waste and rework. One of the major savings that occurs is fewer customer complaints and warranty claims. More satisfied customers results in greater market share.
1.12 Why would a company want to follow the Six Sigma methodology?
Following the Six Sigma methodology enables organizations to capture more market share. This is due to their focus on the key processes that provide the organization’s customers with valuable products or services. A Six Sigma organization looks at how they do business from all

4
perspectives, from manufacturing, marketing, information technology, to research and development. Six Sigma organizations strive to provide value for their customers by adhering to a customer-centered philosophy that includes paying attention to organizational, strategic, environmental, and people factors. Following the Six Sigma methodology enables an organization to remain competitive in a changing, challenging business environment.
1.13 Describe what it takes to become a green belt.
Green belts are individuals who have completed a designated number of hours of training in the Six Sigma methodology. They must also complete a cost-savings project of a specified size, often $10,000, within a stipulated amount of time.
1.14 What does a person need to do to become a black belt?
Having achieved green belt status, black belt status may be achieved by continuing training and education in the Six Sigma methodology. Black belts must complete a specified number of successful projects, often resulting in a savings of $100,000 or more.
1.15 Describe the difference between a black belt and a master black belt.
Master black belt status can only be achieved by individuals with extensive training. These individuals have an in-depth understanding of design of experiments, regression analysis, and statistics. They also have training in project management. Many organizations require that the person have a master’s degree from an accredited university. Master black belts have also completed several large scale improvement projects, often resulting in a savings of $1,000,000 or more.
1.16 How do green belts, black belts, and master black belts interact when working on projects?
Responsibilities for the successful completion of a project are shared among green belts, black belts, and master black belts. Leadership on the project is the responsibility of the master black belt. The master black belt may also provide additional training or guidance to both green and black belts.
1.17 How does Six Sigma work together with lean concepts?
Six Sigma focuses on reducing the variation present in a process. Lean thinking enhance company performance by focusing on the reduction of waste. These techniques can work together because each is interested in

5
improving the value-added process flow. Lean techniques are not as statistically oriented as Six Sigma techniques. Six Sigma focuses on making improvements that enhance the overall financial health of the organization.

6
Chapter 2 Questions 2.1 What is an organizational culture? What cultural aspects would you expect to see in a Lean Six Sigma organization?
People who share the same culture share the same beliefs and values. These beliefs and values provide members of the culture with rules of behavior or accepted norms for conducting business. In a Lean Six Sigma organization, the culture should reflect a focus on creating value for customers. People should also be interested in seeking out and removing sources of waste. Process improvement through reduction of variation is key.
2.2 Describe each type of leadership style. Include a description of where you have seen each of these styles used.
See Chapter figures. 2.3 What role does leadership play in running a Lean Six Sigma organization?
When running an organization, effective leaders communicate the values of the organization to their employees by translating the vision and mission into day-to-day activities. To do this effectively, leaders talk with customers, identify the organization’s critical success factors, and share this information about the things the organization absolutely must do well in order to attract and retain customers. Creating alignment is essentially policy deployment, the step-by-step process of translating the organization’s vision and mission into strategies supported by goals and objectives which in turn become work activities for the employees. Leaders ensure that the organization’s vision, mission and strategies, goals and daily activities remain focused on these critical factors. Without this focus, the organization will not be as effective at creating and maintaining a customer focus.
2.4 What does it mean to manage by fact and with a knowledge of variation?
The theory of profound knowledge involves using data to understand situations. Dr. Deming encouraged the use of fact-based information when making decisions. Effective leaders gather and analyze information for trends, patterns and anomalies before reaching conclusions. Managing by fact and with a knowledge of variation means being able to distinguish between controlled and uncontrolled variation. This involves using data to understand situations. Leadership must make sure that employees in an organization are not blamed for faulty performance which in actuality it is the system that is faulty. Managing by fact and with a knowledge of variation enables companies to expand beyond small

7
process-improvement efforts and to optimize their systems in their entirety. Effective leaders have an appreciation for the systems that work together to create their organization’s products and services. Effective leaders also seek to create alignment between their customers’ needs, requirements, and expectations, the systems that produce products and services and their organization’s purpose. This alignment enables these organizations to do the right things right.
2.5 What characteristics should effective leaders have?
Effective leaders share key characteristics. They are optimistic and kind, with a preference for personal contact. While they display independent judgment, they are loyal team players, backing up their employees. Leaders display a characteristic calmness under stress. This trait enables them to face bad news squarely. They are decisive, able to combine a broad understanding of the whole picture and still see the detail. They define their jobs and the cultures of the organizations they work in.
2.6 What does a leader need to do in order to be a workforce motivator?
As a workforce motivator, leaders set performance expectations and clearly communicate them. While tracking the progress being made, they provide feedback.
2.7 What does a leader need to do in order to be a decision maker?
As befits a key decision maker, leaders also have an overall understanding of the situation. They assess the situation and analyze the associated problems. From this, they set a strategy that is aligned with the goals and objectives of the organization. This strategy guides them as they evaluate potential solutions and make effective decisions. They follow through with their decisions and deploy their strategy. Achieving these two purposes ensures that the goals of the individuals are aligned with the goals of the job, which are aligned with the goals of the department, which are aligned with the goals of the organization.
2.8 Research Dr. Deming’s fourteen points. Which of his points deal with leadership? Give examples from your own experience.
Could discuss:
Create a constancy of purpose (only leadership can create and enforce a focus on the customer) Adopt a new philosophy (leadership sets the direction of the organization)

8
Constantly and forever improve (leadership is responsible for guiding the organization’s focus on customer, the organization’s processes directly affecting the customer) Institute leadership (managing with a knowledge of variation, creating a focus on customer) Remove barriers (making working with the company appear seamless to the customer) Eliminate slogans, etc. (institute leadership) Eliminate arbitrary work standards, etc. (institute leadership)
9
Chapter 3 Questions 3.1 What role does leadership play in strategic planning?
Effective leaders communicate the values of the organization to their employees by translating the vision and mission into day-to-day activities. To do this effectively, leaders talk with customers, identify the organization’s critical success factors, and share this information about the things the organization absolutely must do well in order to attract and retain customers. Creating alignment is essentially policy deployment, the step-by-step process of translating the organization’s vision and mission into strategies supported by goals and objectives which in turn become work activities for the employees. Leaders ensure that the organization’s vision, mission and strategies, goals and daily activities remain focused on these critical factors. Without this focus, the organization will not be as effective at creating and maintaining a customer focus.
3.2 Why does an effective organization need a strategic plan?
Strategic plans allow leadership to put down in writing the direction the organization is heading and how it plans to get there. In a competitive business environment, an effective organization utilizes carefully designed strategic plans in order to create and sustain its competitive advantages and profit position. A well-structured strategic plan outlines the rational for besting the competition in the market by exploiting market opportunities, maximizing organizational strengths and playing off of the competitions’ weaknesses. Efforts to address these issues typically result in a product or service that provides the customer with greater value, either through improved quality, favorable economics, or enhanced service or performance. Strategic plans are the battle plans that enable an organization to accomplish their objectives. By implementing these plans, organizations are able to better place their products or services in the market. Strategic plans establish a direction for the organization, the results of implementing these plans is dependent upon the plans themselves, the individuals implementing them and the forces at work in the market.
3.3 What are the benefits of a strategic plan?
Because of their understanding of their markets and customers, effective organizations are able to create and maintain a distinctive customer base. Customer needs, wants, and expectations translate directly into requirements for major design parameters to develop, produce, deliver and service the product or service. A strategic plan uses this information and incorporates strategies for improving customer satisfaction through providing better products, services, economics, delivery and quality.

10
3.4 Describe each of the elements needed for the strategic planning process.
A strategic plan defines the business the organization intends to be in, the kind of organization it wants to be, and the kind of economic and non economic contribution it will make to its stakeholders, employees, customers and community. The plan spells out the organization’s goals and objectives and how the organization will achieve these goals and objectives. The strategic plan concentrates on the critical success factors (CSFs) for the organization, providing plans for closing the gaps between what the organization is currently capable of doing versus what it needs to be able to do. Using indicators or performance measures, the organization will monitor its progress toward meeting the short-term, mid-term and ultimately long-term goals. A good strategic plan also includes contingency plans in case some of the basic assumptions are in error or significant changes in the market occur.
3.5 Describe the steps necessary to create a strategic plan.
The strategic plan is essentially a framework that assists the organization in achieving its vision while allowing flexibility to deal with unforeseen changes in the business environment. To create a strategic plan, the following must be identified:
1. The Vision:
The organization’s strategic direction for the foreseeable future. 2. The Mission:
The translation of the organization’s vision into strategic actions. 3. The Critical Success Factors:
The 3 to 10 things, as identified by customers, that absolutely must be done well if the company is going to thrive.
4. The Goals The things that must be achieved in order to support the critical success factors.
5. The Objectives: The specific and quantitative actions that must be taken in order to support the accomplishment of the goals and ultimately the mission and vision.
6. The Indicators: The performance measures that indicate whether or not the organization is moving toward meeting their objectives, goals, mission and vision.
7. The Contingency Plans The plans in place that enable an organization to remain flexible in a complex, competitive environment.

11
3.6 Why is strategy deployment as important as strategic planning?
To be effective, a strategic plan must be deployed. As living documents, they are not meant to sit on a shelf, only to be touched when it is time for an annual revision. Without deployment, the work on the strategic plan remains unknown to the employees of an organization. They are not able to act and react to market forces in an organized, effective manner.
12
Chapter 4 Questions 4.1 Why would an organization want to be effective at maintaining a customer focus?
The current global business environment is extremely competitive. Today’s consumers are more than willing to switch from supplier to supplier in search of better service or availability or courtesy or features or for any variety of reasons. To attract and retain customers, effective organizations need to focus on determining and providing what their customers want and value. Effective organizations survive because they talk to customers, translate what their customers said into appropriate actions and aligned their key business processes to support what their customers want.
4.2 What must an organization do to maintain a customer focus?
Organizations practicing total quality management principles create a customer-focused management system and company culture that seeks to meet their customers’ needs the first time and every time. Effective organizations analyze their customer’s needs, wants, and expectations, translate them into technical specifics and organize their key business operations accordingly. These organizations ensure that their leadership creates and implements strategic plans that focus on what is important to their customers and markets.
Effective organizations need an accurate understanding of what their customers expect. They also need to identify the gap between their current performance and what the customer requires if they are going to properly target improvement activities. They recognize the importance of studying both customer value perceptions and customer satisfaction. Customer perceived value, the result of comparing purchasing alternatives, looks toward the future and is proactive, allowing a company to change its future product or service offerings to better suit its customers. Customer satisfaction, compares past experience or expectations to the realities experienced, is reactive and retrospective. Information about both can be used to help improve existing processes.
4.3 What are the benefits of maintaining a customer focus?
The benefits of maintaining a customer focus include: customer satisfaction, organization credibility and reputation, customer perception of value, successful customers, competitiveness, growth, attract and retain customers, survival, business success.

13
4.4 Using an example from personal experience, describe the difference between satisfaction and perceived value.
Customer perceived value is the result of comparing purchasing alternatives, allowing a customer to change its future product or service offerings to better suit its customers. Customer satisfaction, compares past experience or expectations to the realities experienced, is reactive and retrospective. Organizations offer product or service features to their customers, but what the customers are really buying is the benefits those products or services offer. Perceived value is the customer’s viewpoint of those benefits. Customer satisfaction, on the other hand, centers around how they felt the last time they bought a product or service from a company. It is a comparison between customer expectations and customer experience. Perceived value goes beyond customer satisfaction and concentrates on future transactions. Consumers’ perception of the value they have received in the recent transaction will affect their future decision to purchase the same thing again. If they perceive their overall experience with the product or service as valuable, they will most likely purchase in the future, if they do not, they won’t. Effective organizations realize that how the customer perceives the value of that transaction will determine whether or not they will buy from the same organization the next time.
4.5 Describe the principle parts of a quality function deployment matrix.
A QFD has two principle parts. The horizontal component records information related to the customer. The customer wants and needs are captured by listening to the voice of the customer and translating their wants and needs into operational goals. Customers are asked to rank these operational goals from least to most important. The horizontal component also captures information about customer preferences by comparing competitors. The vertical component records the organization’s technical response to these customer inputs. Essentially, a QFD matrix clearly shows what the customer wants and how the organization is going to achieve those wants. The essential steps to a QFD are shown in the chapter.
4.6 How is each of the principle parts of a QFD matrix created? What does each part hope to provide to the users?
QFD begins with the customer. Surveys and focus groups are used to gather information from the customers about their wants, needs and expectations. Several key areas that should be investigated include performance, features, reliability, conformance, durability, serviceability, aesthetics, and perceived quality. Often, customer information,

14
specifically, the way they say it, must be translated into actionable wording for the organization.
Once this information is organized into a matrix, the customers are contacted to rate the importance of each of the identified wants and needs. Information is also gathered about how customers rate the company’s product or service against the competition. Following this input from the customers, technical requirements are developed. These technical aspects define how the customer needs, wants, and expectations will be met.
4.7 Why would a company choose to use a QFD?
QFD allows for preventive action rather than a reactive action to customer demands. When a company uses the QFD format when designing a product or service, they stop developing products and services based solely on their own interpretation of what the customer wants. Instead, they utilize actual customer information in the design and development process. Two of the main benefits of QFD are the reduced number of engineering changes and fewer production problems. QFD provides key action items for improving customer satisfaction and perceived value. A QFD can enable the launch of a new product or service to go more smoothly because customer issues and expectations have been dealt with in advance. Translating customers what’s into an organization’s how’s is paramount to the success of any organization seeking to align their products, services and the processes that provide them with what the customer wants. Organizations that ignore the relationship between what a customer wants and how the organization is going to provide that want can never be effective.
4.8 Describe how you would begin creating a QFD.
QFD begins with the customer. Surveys and focus groups are used to gather information from the customers about their needs, wants, and expectations. Several key areas that should be investigated include performance, features, reliability, conformance, durability, serviceability, aesthetics, and perceived quality. Once this information is organized into a matrix, the customers are contacted to rate the importance of each of the identified needs and wants. Information is also gathered about how customers rate the company’s product or service against the competition. Following this input from the customers, technical requirements are developed. Once the matrix is constructed, the areas that need to be emphasized in the design of the product or service will be apparent.

15
Chapter 5 Questions 5.1 Who is Dr. Kaoru Ishikawa and what did he add to process improvement and the Lean Six Sigma methodology?
Dr. Ishikawa was one of the first people to encourage the use of teams made up of people closest to the problem to investigate and solve production issues. He advocated the use of the seven tools of quality to help find the root cause of a problem. He developed the cause and effect diagram. He stated that leadership can improve processes by encouraging: market in quality, worker involvement, education, and selfless personal commitment to improvement. 5.2 Describe the difference between education and training. Why is it important to have both?
Training refers to job-related skill training and is usually a combination of on-the-job training with classroom-type instruction. Effective employees are provided with the appropriate training to give them the skills and knowledge set needed to excel in their jobs. Job-related skill training prepares workers for the daily activities involved with their job. Such training should also include information that helps the employee deal with experiences they may rarely encounter. If training does not include problems that may arise infrequently, then the worker will be required to handle those situations as they arise with their own problem-solving and decision-making skills. If these infrequent situations are unsafe in any way, this could result in an accident or injury. Follow-up or refresher training is also key to skill acquisition. This type of training enables employees to maintain higher skill and performance levels by re-familiarizing employees with the best practices and eliminating poor habits.
Compared to training, education is more broad-based. Education provides individuals with a broader base of knowledge. This allows individuals to look at a situation from other dimensions. The education an individual receives may not be immediately applicable to the activities they are currently performing. 5.7 Describe the phases of team development. Formation stage is usually experienced in the first few meetings. During this time, the team establishes its goals and objectives. It also determines the ground rules for team performance. For teams to work well, leadership must set clear goals that are aligned with the mission and strategic direction of the firm. When leadership sets the direction, the team is much more focused and tends not to get bogged down in the problem-selection process. The team must know the scope and boundaries that it must work within. Leadership must communicate how the team’s progress and performance will be measured. During the stormy stage, the team gets acquainted with each others idiosyncrasies and the demands of the project. The goals and scope of the team

16
may be questioned. Since a team is composed of a group of individuals who are united by a common goal, the best teamwork will occur when the individuals focus on the team’s objectives rather than personal motives. While working together, team members must understand and agree on the goals of the team. They must establish and adhere to team ground rules for behavior and performance expectations. To ensure harmony in the team, all members must participate and the responsibilities and duties must be fairly distributed. This means that each team member must understand what his/her role is in the completion of the project. Knowledge of how internal or external constraints affect the project is also helpful. Team members must possess a variety of skills, including problem-solving skills, planning skills, facilitation and communication skills, and feedback and conflict management skills. The performing stage is when the team starts to work together smoothly. To be successful, teams need the appropriate skills in a supportive organizational culture and the authority to do the job that they have been asked to do. Leadership can do a lot to rid the team of the barriers that inhibit its performance. These barriers include: inadequate release time, territorial behavior from involved functional areas, lack of training, inadequate support systems, lack of guidance or direction, and lack of recognition. Senior leadership’s sincere interest and support in the resolution of the problem is evidenced by their willingness to commit money and time for training in problem-solving and facilitation. In any case, senior leadership must monitor and encourage their teams to solve problems. The teams will quickly become unmotivated if the solutions they propose are consistently turned down or ignored. Leadership support will be obvious in management’s visibility, diagnostic support, recognition, and limited interference. The concluding stage occurs as the team finishes its project. During this phase, team members draw the project to its conclusion, verify the results, and disband the team. Several key events take place during this time. The team, having taken action, perhaps by implementing a solution to a problem, must verify that what they planned to do got done and what they did actually worked. Teams are not finished when they have proposed a plan of action, teamwork is finished when the plans have been acted on and the results judged effective. Until then, the team can not be disbanded. 5.9 How will you guide people who work for you or with you through a change process?
Leadership must communicate to the employees the desired change and motivate individuals to make the change. People resist change because humans are control-oriented and when their environments are disrupted, they perceive that they have lost the ability to control their lives. Resistance to change can be based on the individual’s frame of reference, their individual values, emotions, knowledge and behavior. Leaders need to understand that resistance to change is a natural human reaction. Effective leaders know that in order for change to

17
occur, resistance to those changes must be expected and planned for. Leaders must clearly communicate the new expectations and the reasons behind the changes so that people understand why they are being asked to change. Effective leaders provide training and time to make the change. They also structure their reward system to support the change. Effective leaders realize that employees mold their behavior according to their interpretations of the signals leadership sends them. These signals may come policies, requests, edicts or from the day-to-day actions taken by leadership. Effective leaders recognize that actions speak louder than words. Communicating through leadership actions and examples is paramount to changing behavior. Effective leaders recognize that the tools need to be in place to support the desired change. To maximize the change process, effective leaders ensure that the worker/machine/computer interface, as well as, the worker-to-worker interface, is compatible with the needs, capabilities, and limitations of the worker. Further, effective leaders ensure that the reward system matches the desired expectations in order to change behavior. Alignment must exist between rewards, expectations, leadership actions, and customer needs. Both rewards and punishments must reinforce behavior expectations. What is the desired end result? Can you picture it? To change, a person must understand what the ultimate outcome of that change will be. What actions will you take to make the change? To change, a person takes a series of action which produces a result that moves the individual toward the desired outcome. What is the time frame for the change? Change takes time. How will you stay motivated? To change, it is necessary to stay motivated. How will you know you have changed? What will your indicators be? A person needs to have some sort of feedback that enables them to understand how they are progressing toward the desired outcome. 5.10 How will you motivate the people who work for or with you?
Begin by studying the processes and systems that the people work within. Are there improvements that can be made to simplify their jobs, make them more interesting, provide more value for the customer, or save time and effort? Study each system and process to determine if there are barriers that rob people of pride of workmanship. Once improvements have been made, lead by example. Find ways of sending appropriate and clear signals to the workforce so that they will know what is expected of them. Alignment must exist between rewards, expectations, leadership actions, and customer needs.

18
Chapter 6 Questions 6.1 Which of the following statements about quality costs is true?
False, True, True (this is one way of measuring business efficiency)
6.2 There are four specific types of quality costs. Define 2. Example answer: (see also answers to 3 and 4)
Appraisal costs are the costs associated with measuring, evaluating, or auditing products or services to make sure that they conform to specifications or requirements. Appraisal costs are the costs of evaluating the product or service during the production of the product or the providing of the service to determine if, in its unfinished or finished state, it is capable of meeting the requirements set by the customer. Appraisal activities are necessary in an environment where product, process, or service problems are found. Appraisal costs can be associated with raw materials inspection, work-in-process (activities-in-process for the service industries) evaluation, or finished product reviews. Examples of appraisal costs include incoming inspection, work-in-process inspection, final inspection or testing, material reviews, and calibration of measuring or testing equipment. When the quality of the product or service reaches high levels, then appraisal costs can be reduced.
6.3 What is a prevention cost? How can it be recognized? Describe where prevention costs can be found.
Prevention costs are those costs that occur when a company is performing activities designed to prevent poor quality in products or services. Prevention costs are often seen as front-end costs designed to ensure that the product or service is created to meet the customer requirements. Examples of such costs are design reviews, education and training, supplier selection and capability reviews, and process improvement projects. Prevention activities must be reviewed to determine if they truly bring about improvement in the most cost-effective manner.
Prevention efforts try to determine the root causes of problems and eliminate them at the source so reoccurrences do not happen. Preventing poor quality stops companies from incurring the cost of doing it over again. Essentially, if they had done it right the first time, they would not have to repeat their efforts. The initial investment in improving processes is more than compensated by the resulting cost savings.
19
6.4 Describe two types of failure costs. Where do they come from? How will a person recognize either type of failure cost?
Failure costs occur when the complete product or service does not conform to customer requirements. Two types exist: internal and external. Internal failure costs are those costs associated with product nonconformities or service failures found before the product is shipped or the service is provided to the customer. Internal failure costs are the costs of correcting the situation. The failure costs may take the form of scrap, rework, remaking, re-inspection, or retesting. External failure costs are the costs that occur when a nonconforming product or service reaches the customer. External failure costs include the costs associated with customer returns and complaints, warranty claims, product recalls, or product liability claims. Since external failure costs have the greatest impact on the corporate pocketbook, they must be reduced to zero. Because they are highly visible, external costs often receive the most attention. Unfortunately, internal failure costs may be seen as necessary evils in the process of providing good-quality products or services to the consumer. Nothing could be more false. Doing the work twice, through rework or scrap, is not a successful strategy for operating in today’s economic environment.
6.5 How do the four types of quality costs vary in relation to each other?
Investment in preventing quality errors results in significantly lower failure costs. Appraisal costs have some effect on lowering failure costs but do not affect failure costs as significantly as prevention costs. Not making the mistake in the first place will result in lower overall costs of quality.
6.6 Describe the relationship among prevention costs, appraisal costs, and failure costs. Where should a company’s efforts be focused? Why?
The four types of quality costs are interrelated. In summary, total quality costs are considered to be the sum of prevention costs, appraisal costs, failure costs, and intangible costs. Investments made to prevent poor quality will reduce internal and external failure costs. Consistently high quality reduces the need for many appraisal activities. Suppliers with strong quality systems in place can reduce incoming inspection costs. High appraisal costs combined with high internal failure costs signal that poor-quality products or services are being provided. Efforts made to reduce external failure costs will involve changes to efforts being made to prevent poor quality. Internal failure costs are a portion of the total production costs, just as external failure costs reduce overall profitability. A trade-off to be aware of when dealing with quality costs is the need to ensure that appraisal costs are well spent. Companies with a strong appraisal system need to balance two points of view: Is the company
20
spending too much on appraisal for its given level of quality performance or is the company risking excessive failure costs by under-funding an appraisal program? In all three areas—prevention, appraisal, and failure costs—the activities undertaken must be evaluated to ensure that the efforts are gaining further improvement in a cost-effective manner.
6.8 How can quality costs be used for decision making?
Quality costs can be used as justification for actions taken to improve the product or service. Typically, investments in new equipment, materials, or facilities require the project sponsor to determine which projects will provide the greatest return on investment. These calculations traditionally include information on labor savings, production time savings, and ability to produce a greater variety of products with better quality. The “better quality” aspect of these calculations can be quantified by investing in the costs of quality, particularly the failure costs. It is important to determine the costs of in-process and incoming material inspection., sorting, repair, and scrap, as well as the intangible costs associated with having a nonconforming product or service, reach the customer. Making a decision with more complete quality information, such as product appraisal costs, can help determine the true profitability of a product or service. Identifying and quantifying quality costs has a twofold benefit. Cost savings are identified and quality is improved. By improving the quality performance of a company, the company also improves (lessens) its quality costs.
6.9 Where should dollars spent on quality issues be invested in order to provide the greatest return on investment? Why?
Investment in preventing quality errors results in significantly lower failure costs. Appraisal costs have some effect on lowering failure costs but do not affect failure costs as significantly as prevention costs. Not making the mistake in the first place will result in lower overall costs of quality.
6.11 Why is the following statement true?
The further along the process that a failure is discovered, the more expensive it is to correct. This statement is true because of the costs associated with having a defective or faulty product reach the customer. For instance, if a hospital fails to teach their nurses to wash their hands correctly and then monitors for hand washing, nurses who do not practice good hand cleaning procedures can pass infections to patients. The cost of this failure to prevent a problem in the first place is high. Patients are infected, ill, may be readmitted to the hospital, will require drugs to cure the infection, will have a longer recovery period, and could ultimately die.

21
6.12 What should a quality cost program emphasize?
A quality cost system should emphasize the identification and elimination of unnecessary costs of quality, specifically failure costs and intangible costs associated with poor quality. The quality cost system should also determine where prevention costs should be spent to maximize value. The system should determine whether or not appraisal costs can be reduced or eliminated through judicious prevention cost spending.
6.13 What are the benefits of having, finding, or determining quality costs?
Quality costs are the costs that would disappear if every activity was performed without defects every time. Being able to find or determine quality costs provides an organization with a roadmap showing where to focus improvement efforts.
6.14 On what premise is the strategy for using quality costs based?
Prevention of problems results in lower overall costs. 6.15 For the Farmer Friendly case, discuss how quality costs were used for decision making.
Farmer Friendly used their quality-cost measurement system to guide their improvement efforts. By tracking each cost, they could determine the root cause and prevent the same type failure in the future. FF realizes that preventing problems in the first place is always cheaper. They used their quality-cost measurement system to establish a basic method of identifying correctable problems, correcting the problems, and achieving a new level of performance.
6.17 Identify whether the costs incurred should be allocated to the prevention, appraisal, failure (internal, external) or intangible costs category.
a. External failure cost, intangible cost b. Internal and external failure cost, intangible cost c. Appraisal cost d. Prevention and appraisal costs e. Internal failure costs f. External and intangible failure costs g. External and intangible failure costs h. Internal failure cost i. Prevention cost j. Prevention cost

22
Chapter 7 Questions 7.1 What does B.C. Forbes mean by ‘If you don’t drive your business, you will be driven out of business?’
Leaders must know what is really going on in their business. They need to be in control and understand how business decisions affect the overall success of the organization. Measures provide the key information that leaders can use to understand and control business activities. Measures provide them with the knowledge to make effective business decisions.
7.2 How do effective organizations use performance measures?
Leaders use measures of performance to ensure alignment between the organization’s mission, strategy, values and behavior. Measures of performance enable effective organizations to define the meaning of success numerically. Effective performance measurement systems are used for understanding, aligning, and improving performance at all levels and in all parts of the organization. In order to know how they are doing in key areas that affect their customers’ value perceptions, organizations must select and track indicators of their performance efforts.
7.3 What is the difference between process and results measures?
Processes are the activities that must take place in order to produce a product or provide a service. Since processes are how organizations do the work that they do, process measures monitor operational activities or how the work is done. Results relate to both organizations and their customers. To an organization, results are the objectives the organization wants to achieve. From a customer point of view, results represent what they hope to obtain by doing business with the organization, whether it be a product or a service. Performance measures related to organizational results focus on strategic intent.
7.4 Why is an effective performance measurement system necessary?
One of the chief goals of a performance measurement system is to provide leaders with a multi-dimensional and qualitative view of their organization. A measurement system is a critical element in the strategic planning process because it allows an organization to measure progress toward goals and objectives. Performance measures are decision tools that enable leaders to link their strategy with day-to-day operations. Effective organizations measure the performance of areas that the organization values the most. Measurement systems allow effective organizations to:

23
Determine that a gap exists between desired and actual performance. Determine the root cause of the gap. Determine the necessary corrective action to eliminate root cause of the gap. Determine whether or not the corrective actions eliminated the root cause and closed the gap between the actual and desired performance.
7.7 Create a set of measures, based on the Balanced Scorecard and the Lean Six Sigma Tools at Work feature Indicators or Measures of Performance, for a fast food restaurant. Customer measures: Results measures: Overall customer satisfaction Market share -number of customers -number of repeat customers -number of new customers Process measures: Changes in customer requirements versus Changes in processes to serve customers
Improvements to processes critical to serving customers
Financial measures: Results measures: Cost per food item Profitability Return on Investment
Process measures: Cost avoidance (safety, hygiene) Internal measures:
Results measures: Improvements in hours paid versus $ amount of food served
Process measures: Improvements in order turn-around time (Cycle time reduction/removal of non-value-added activities) Improvements in first time through quality (Reduction in rework/scrap)
Learning and Growth measures: Results measures: Improvements in employee retention
Process measures: Progress toward cross-training goals for critical processes as identified by customers

24
7.8 Create a set of measures, based on the Balanced Scorecard and the Lean Six Sigma Tools at Work feature Indicators or Measures of Performance, for a movie theater. Customer measures: Results measures: Overall customer satisfaction Market share -number of customers -number of repeat customers -number of new customers
Process measures: Improvements to processes critical to serving customers
Financial measures: Results measures: Cost per movie Profitability Return on Investment
Process measures: Cost avoidance (movie film strip quality) Internal measures: Results measures: Improvements in hours paid versus tickets sold Process measures: Improvements in theater turn-around time
(Cycle time reduction/removal of non-value-added activities) Improvements in first time through quality (Reduction in rework/scrap in food service area)
Learning and Growth measures: Results measures: Improvements in employee retention
Process measures: Progress toward cross-training goals for critical processes as identified by customers

25
Chapter 8 Questions 8.1 Why are project management skills important to apply in order to be
effective?
Project management skills allow us to approach a daunting project and figure out where to begin and where to focus. They also help us determine if there will be enough time. Projects consume time and effort outside of these day-to-day activities and employees must utilize good project management skills in order to integrate their project work with regular activities. Knowledge and skills in the area of project management are necessary any time an employee can answer yes to the following questions:
Do assignments have to be complete by a specified deadline? Do several tasks have to be accomplished during the day? Is there a limited set of resources with which to complete these tasks?
Is the involvement of other people necessary in order to complete the work? Do supervisors, colleagues or customers ever change their mind about what they want? Does the team have a clear idea of what they are trying to accomplish for the ultimate user? Does the team understand the perspectives of the people affected by the project? Are the constraints and directives that govern the project known?
Is the project broken down into manageable chunks? When disagreements arise, does the team have the skills to build effective agreements?
8.3 Why is completing a project like eating an elephant?
Projects are large, joining together a multitude of smaller tasks. Their size can be as intimidating as eating an elephant, on the surface appearing to be too much to accomplish.
8.4 How is a project selected to be worked on?
Effective organizations select projects based on the projects ability to contribute to one or all three of the following: customer perceived value and satisfaction, the organization’s financial strength, or operational necessities. For customer-focused organizations, many projects will be selected based on their ability to increase customer value, satisfaction, and retention. Projects may be chosen in order to enable the organization to maintain its competitive edge. These projects may involve the development of a new product or service or an extension to a product line or the development of a product or service enhancing feature. These projects will ultimately enhance an

26
organization’s financial success. Some projects are operational necessities like meeting government regulations or the repair or replacement of aging equipment. Regardless of the reasons behind a project being selected, effective organizations recognize that a project must be financially sound and provide a payback for their investment.
Projects can be identified through the use of customer feedback, internal customer feedback from the people doing the work, competitive benchmarking, existing measures of performance, or costs of poor quality studies. Any gap that exists between desired performance and actual performance is a candidate for a project. Projects should concentrate on a problem area for either the internal or external customer. A focused project will have boundaries and will not be so large as to become unmanageable. Projects have problem statements that are specific, measurable and identify the gap between the desired and actual performance.
8.5 What are the components of an effective project proposal?
An effective project proposal provides readers with insight into what needs to be accomplished and how it will get accomplished. Through the use of clearly stated mission, deliverables, goals and objectives associated with the project, proposals sell the project. As an introduction, proposals provide background information about the need for the project. They contain a description or overview of the expectations of the project, including details about the technical aspects of the project. Essential tasks are outlined and delineated. A thorough project proposal will contain information concerning financial requirements, time constraints, and administrative and logistical support for the project. In the proposal there is usually information about the key individuals associated with the project, including the identify of the project manager. Basic areas of performance responsibility are assigned. Tentative schedules and budgets are established. Chapter figures give a brief summary of the typical components of a project proposal.
The project proposal creates a general understanding of:
-what is needed, -what is going to be done, -why it is going to be done, -who is going to do it, -when it will be done, -where it will be done, -how it will be done?
8.7 What are the components of an effective project plan?
Project plans are significantly more detailed than project proposals. Projects have three interrelated objectives: meeting the budget, finishing

27
on schedule and meeting the performance specifications set by the client. A good project plan enables an organization to accomplish all three. Though a project plan may be modified several times during a project, effective project plans remain key to organizational success because no project always goes according to plan, but well planned projects are less likely to go astray. Project plans provide the information about:
-Mission and deliverables -Specific goals and objectives supporting the mission and its deliverables -Tasks required to meet the goals and objectives -Technicalities of who, what, where, when, why and how -Schedules, the time needed to support each aspect of the plan -Resources, what is needed to support each aspect of the plan -Cost analysis -Value analysis -Personnel, who is needed to support each aspect of the plan -Personnel, responsibilities and assignments -Evaluation measures for keeping the project on track -Risk analysis, what could go wrong and how will it be dealt with? -Project change management process
Chapter figures give a brief summary of the typical components of a
project plan.
8.10 What differentiates a Gantt chart from a PERT chart from a CPM?
A PERT chart improves upon a Gantt chart by showing the relationships between tasks. Unlike the Gantt chart which is a list of tasks, the PERT chart enables the project to be viewed as an integrated whole. Because it coordinates and synchronizes many tasks, it is well designed to handle complex projects.
8.11 A not-for-profit organization is interested in buying caramels and selling them to raise money. Create a PERT chart for the following information.
Weeks Cost Task Predecessor Normal Crash Normal Crash Design Ads (a) - 2 2 $250 0 Order Stock (b) - 12 8 $200 $35/wk Organizes Sales People (c) - 6 3 $120 $60/wk Place Ads (d) a 3 2 $25 $10/wk Select Distribution Sites (e) c 4 3 $100 $20/wk Assign Distribution Sites (f) c, e 4 3 $100 $10/wk Distribute Stock to Sales People (g) b, c, e, f 2 1 $100 $25/wk Sell Caramels (h) d, g 5 3 $100 $40/wk

28
8.11 cont. 2 Design Place Ads Ads Dist. Stock Sell Caramels 1 6 3 7 Order stock Org. Assign Sales Sites 4 5 Select Sites Paths: 1-2-3-7 1-6-3-7 1-4-5-6-3-7 8.12 Complete a CPM for the information in question 11. 2 Design Place Ads Ads Dist. Stock Sell Caramels 1 6 3 7 Order stock Org. Assign Sales Sites 4 5 Select Sites Paths: 1-2-3-7 = 10 1-6-3-7 = 19 1-4-5-6-3-7 = 21 Critical Path

29
8.13 If the leaders of the project completed in question 12 wanted to speed up their project by 3 weeks. What would be the most cost effective way of accomplishing that? Paths 1-2-3-7 = 10 1-6-3-7 = 19 1-4-5-6-3-7 = 21 Critical Path Reduce Critical Path first. It costs section: (c) 1-4 $60/week, 3 weeks available (e) 4-5 $20/week, 1 week available (f) 5-6 $10/week, 1 week available (g) 6-3 $25/week, 1 week available (h) 3-7 $40/week, 2 weeks available Least costly to speed up: crash (f) for $10 crash (e) for $20 crash (g) for $25 for a total crash cost of $55 for the three weeks. 8.14 What does it mean to keep a project under control? How is a project
controlled?
Throughout a project, effective project managers monitor the progress a project is making toward completion. Performance, cost and time, the three aspects of a project, all need to be monitored and controlled in order to ensure project success. Project control and monitoring involves gathering and appraising information on how the project’s activities compare with the project plan. Actual progress is tracked against the performance measures established in the project plan. These performance measures help a project manager assess how time, money and other resources have been used to produce the expected outcomes. Costs can also get out of control when the project costs are not watched closely and corrective cost control was not exercised in time. By closely monitoring the performance measures associated with the project, an alert project manager can be prepared to respond quickly to deviations in order to keep the project on track and under control. Though very few projects have not had their goals and objectives modified in some way or another from their beginning to the end, careful project control enables a project manager to minimize the effects of these changes on the overall project.

30
8.15 What are contingency plans? Why is it important to have contingency plans?
Projects, due to their very nature, are complex. For every project, there is a risk of failure. Contingency plans are created to ensure that the project team is ready to handle potential problems. While all problems can not be foreseen, a project plan that includes contingency plans keeps the team flexible and aware that they may be asked to make adjustments to their project plan some time during its lifetime.
8.16 What is a change control system? How are they structured? What are they used for?
Effective project managers recognize that clients make changes to the project as it progresses. All project proposals and plans should contain a description of how requests for changes in the project’s plan, budget, schedule, or performance deliverables will be handled. An effective change control system will have steps in place that review the requested changes for both content and procedure and identify how the change will impact the project. This impact must be reflected in adjustments to the projects performance objectives, the schedule and budget. Once accepted, change orders become part of the overall project plan. Part of the job of a change control system is to clearly communicate any changes to any person or part of the project affected by the change. The best way to ensure that this critical communication occurs is to have all changes approved in writing by all appropriate representatives of the impacted areas. Ultimately, the change should only be made if its benefits outweigh the costs of implementing the change.
8.17 What does it take to be an effective project manager?
An effective project manager achieves the desired results within budget and on time and according to the desired standards. Effective project managers realize that in order to accomplish what needs to be done on time and within budget, they must take time to plan their projects. Once a good plan has been created, effective project managers manage their plan.
Unlike functional managers, project managers are generalists with knowledge and experience in a wider variety of areas. A project manager is responsible for organizing, directing, planning, and controlling the events associated with a project. They deal with budgets and schedules.
Responsibility for the project rests on their shoulders and they must understand what needs to be done, when it must be done, and where the

31
resources will come from. Throughout a project, the manager will be the one who must clarify misunderstandings, calm upset clients, leaders and team members, and meet the client’s demands while keeping the project on time and within budget. Project managers are responsible for finding the necessary resources, motivating personnel, dealing with problems as they arise, making project goal trade-offs. In essence, an effective project manager is an individual who does whatever is necessary to keep the project on schedule, within budget, and able to meet performance expectations. Project managers must be prepared to make adjustments to schedules, budgets and resources in order to deal with the unexpected. For this reason, they must be good at recognizing the early signs of problems and be able to cope with stressful situations. As discussed under the heading of project plans, effective project managers utilize the checkpoints, activities and time estimates established in the project plan to guide those working on the project. Following a clearly laid out project schedule, with clearly delineated responsibilities, enables effective project managers to keep their projects on track in terms of time, performance and cost. Clear project plans enable the effective project manager to direct people individually as well as a team. Project managers manage people as well as projects. To do this, effective project managers schedule frequent progress reports. These meetings allow the project manager to react quickly when he or she recognizes that a difficulty has arisen.

32
Chapter 9 Questions 9.1 Outline the steps that they should take to solve this problem.
A structured problem-solving process allows us to work systematically through an issue in search of the real reasons behind the issues. A structured problem-solving process keeps the focus on finding a true solution. A structured problem-solving process insists on checking the solution too. Follow the steps shown in the chapter.
9.2 Create a problem statement for this situation. How will an improvement team
use the problem statement?
The purpose of a well-written problem statement is to serve as a guide for the problem-solving efforts. A problem statement helps team members stay focused on the task at hand. Problem statement: There is a need to find a way to prevent bike thefts on campus.
9.3 Why is a structured problem solving process critical to the success of finding
and eliminating a problem? What steps do you recommend they follow?
A structured problem-solving process allows us to work systematically through an issue in search of the real reasons behind the issues. A structured problem-solving process keeps the focus on finding a true solution. A structured problem-solving process insists on checking the solution too. Follow the steps shown in the chapter.
9.4 Pareto Diagram Cold Salad Not Flimsy Poor Food Food Lack Food Not Clean Utensils Serv. Tastes Greasy of Fresh Bad Courtesy

33
9.5 Pareto Diagram Balance Credit Trans. Paym’t Finance Other Quest. Card to Receipt Charge Payment Another Question Question Dept. 9.6 Once a Pareto chart has been created, what steps would you take to deal
with the situation given in Question 5 in your quality improvement team?
Once the Pareto chart has been created, the Lean Six Sigma team should focus on the most likely area in need of improvement. In this case, the size of the other column is nearly as large as that of “Balance Questions’. Steps to use this Pareto diagram would include further investigation into why ‘other’ has such a large number of occurrences as well as an investigation into what can be done to reduce the number of customers who have questions concerning their balance.
9.7 Review Question 3. What are two measures of performance that can be used
to determine if the changes they make are effective?
For example: Number of calls completed per hour Number of callers receiving a busy signal Number of reoccurrences of line failure

34
9.8 Review Question 5. What are two measures of performance that can be used
to determine if the changes they make are effective?
For example: Number of complains in a particular category Number of potential customers who leave before ordering Number of compliments in a particular category Number of repeat customers
9.12 Create a why-why diagram about waiting on the telephone. One you have created the diagram, how would you use it? workers not hasn’t scheduled at peak times been no peak times not known studied funding Toll-free service Waiting on Insufficient considered a Unaware of The phone operators Low pay ‘necessary evil’ importance To place an available by management of phone orders Order Many customers Customers Work/Schedule Calling at same time preferred ordering Time All catalogs shipped At same time always done no one
That way thought About it
Actions to put diagram to use: Create measures and document importance of phone orders to bottom line. Present to management at monthly meetings. Provide funding to study timing of calls. Utilize information about timing of calls and queuing theory to schedule employees Study activities surrounding advertising and promotions as they relate to calls.

35
9.13 Methods People Machine/Equipment Must Lack of Old Re-record Training Equipment Customer Equipment not Information Not Familiar Compatible With Products Product Code No customer Entry Complex Service Training What makes Customers Seating Wait? Product Uncomfortable Codes Complex Product Pertinent Noisy Examples Information Can hear Catalogs Not Available Not Readily Muzak Other Not Available On-site Available loud Workers At Each Work Clearly Station Information Environment Materials For use: The cause and effect diagram organizes people’s thinking. Team members should discuss all of the identified causes of the problem and determine which causes should be investigated more thoroughly in order to find the root cause of the problem.

36
9.14 Material Method Height of Worksurface Movement Stacking Method Location of items Time Picking Style To Distance Number of items in order Pick Clerk Reaches Items carried/reach Noise Environment Long Lines at Market Lighting
Staffing Part Timers Cart Time off Scanner Height Experience Length Point of Sale System Width Training Register Type People Equipment Price Correct Price Availability Scan Product Recorded in System Information For use: The cause and effect diagram organizes people’s thinking. Team members should discuss all of the identified causes of the problem and determine which causes should be investigated more thoroughly in order to find the root cause of the problem.

37
9.15 Create a force field diagram for Question 2 concerning bike thefts. Force Field Analysis Bikes being stolen on campus
Driving Forces Restraining Forces
1. Students are upset about 1. Administration is unconcerned bike thefts about problem 2. Loss of bike costly 2. Funding required to update existing
bike parking areas 3. Poor image for school 3. Funding required to create new bike parking areas 4. Hassle for student 4. Limited space available for bike parking areas Plan of Action
1. Create awareness in administration concerning severity of problem. Collect and analyze statistical data.
2. Hold funding raising events for purchase of bike racks and creation of parking areas.
3. Encourage administration to match raised funds and to set aside designated parking facilities for bikes.
9.16 Create a force-field diagram for a restaurant where customers are waiting more than 10 minutes for their food.
Force Field Analysis Wait for Food Exceeds 10 minutes
Driving Forces Restraining Forces
1. Increase customer satisfaction 1. Money for new menus 2. Increase employee 2. Time for retraining and
satisfaction standardizing methods 3. Reduce wait time for food 3. Negative attitude of workers 4. Increase business 4. New equipment costly 5. Improved atmosphere 5. Space needs of new equipment 6. Reduce congestion and Incorrect orders 7. Improve employee performance

38
9.16 Continued Plan of Action
1. Create awareness in everyone concerning severity of problem. Collect and analyze statistical data.
2. Standardize menus. 3. Standardize order-taking process, order placing process, cooking
methods, and check-in and check-out process. 4. Provide training in new methods for employees.

39
Chapter 10 10.1 Why is a process map such an excellent problem-solving tool?
A process map is a graphical representation of all of the steps involved in an entire process or a particular segment of a process. Diagramming the flow of a process or system aids in understanding it. Flowcharting is effectively used in the first stages of problem solving because the charts enable those studying the process to quickly understand what is involved in a process from start to finish. Problem-solving team members can clearly see what is being done to a product or provided by a service at the various stages in a process. Process flowcharts clarify the routines used to serve customers. Problems or non–value-added activities nested within a process are easily identified by using a flowchart. When a value stream is mapped, the stream or process is studied in order to capture all of the activities taking place, value added and non value added. After all the activities are documented, the process map is studied to determine what activities can be removed, combined, or simplified. The point is to eliminate wasteful steps and activities in the process.
10.2 How would you recognize that a process needs to be improved? Anytime there is waste in the process, non-value added activities, errors, complaints, or problems, there is room for improvement. Processes govern the activities involved and when waste is present, improvements to the process are needed.
10.3 What is mean by valued-added operation? Value-added operation refers to the activities in a process or system that transform raw materials, parts, components, etc., into a usable product or service for the customer.
10.4 How would you recognize a non-value-added activity? A non-value-added activity is any activity or action that does not directly affect the production of a product or the provision of a service.
10.5 Why is process mapping an important tool for improving processes? Every business, whether in manufacturing or the service industries, has key processes that it must absolutely perform well in order to attract and retain customers to whom to sell their products or services. Process mapping clearly shows the steps taken in a process. Knowledge gained during process mapping can be used to improve the process by removing non-value-added activities, creating clear work descriptions and designing standard process procedures. In most organizations very few people truly understand the myriad required activities in a process that creates a product or service. Process
40
maps are powerful communication tools that provide a clear understanding of how business is conducted within the organization. Identifying and writing down the process in pictorial form helps people understand just how they do the work that they do. Process maps have the ability to accurately portray current operations, and they can also be used to evaluate these operations. In addition, a process map identifies the activities that have been added to a process over time in order to adapt older processes to changes in the business. Once changes have been proposed, process maps are equally powerful for communicating the proposed changes in the process.
10.6 Why is it important to determine the process boundaries? Process boundaries identify where the process begins and ends. These boundaries are based on the customer’s perception of the process. Where do they see their first interaction with the process? Where do they see the process ending? Determining the process boundaries enables an organization to understand the process better from the customer point-of-view.
10.7 Why is it important to study the process from the customer’s point-of-view? The process should be studied from the customer’s point of view. True process improvement comes from a knowledge of what adds value or meaning for a customer. Not looking at the process from a customer viewpoint often leads to a narrow definition of the process. This narrow definition limits improvement efforts because it fails to study the customer experience.
10.8 What is meant by process ownership? Process ownership refers to identifying who is ultimately responsible for seeing that a process is completed in a manner that results in customer satisfaction. These individuals are in a position to make, and have the necessary power to make, changes to the process.
10.9 Who should be involved in process improvement efforts? How should the team be structured?
It is important to involve individuals from the key activities in the process in the improvement effort. Doing so will create buy-in. Remember, the people who are going to have to live with the new process should be the ones who fix it. If they are involved in identifying, creating, and making the necessary changes, chances are very good that they will live with those changes and work to make them permanent. Involvement from all key activities also breaks down barriers between existing departments and provides everyone with a clearer understanding of how work gets done in the organization.

41
10.13 WP process flow map example.
42
10.14 Candy making process map

43

44
Chapter 11 Questions 11.1 What are the two main pillars of the Toyota Production system?
Just-in-time and Jidoka
11.2 Describe each of the three basic components required by a Just-in-time system.
Just-in-time requires three basic components: A Pull system Continuous flow processing Adherence to Takt times
11.3 What is the goal of a Just-in-time system?
Mr. Ohno and Mr. Shingo stated their JIT goal as: ‘Deliver the right material, in the exact quantity, with perfect quality, in the right place just before it is needed.’ Just-in-time enhances the efficiency of processes and enables an organization to respond quickly to market changes.
11.4 How does waste affect Just-in-time systems?
Just-in-time systems encourage workers to find and eliminate the inefficiencies of their work methods that lead to defects, machine breakdowns, and shortages. Muda (waste), mura (unevenness), and muri (overburden) are attacked and eliminated in order to create a balanced production process. Waste, according to Fujio Cho of Toyota, is ‘anything other than the minimum amount of equipment, materials, parts, space, and worker’s time, which are absolutely essential to add value to the product.’
11.5 Calculate the Takt time for a company that works two 8 hour shifts per day. Each shift receives 30 minutes for a mid-shift meal and two 15 minute breaks. The customer would like to receive 4000 tubes of toothpaste per day.
To calculate takt time, an organization determines the amount of work time available during a day and the customer demand for that day. The customer demand is divided into the time available and the resulting takt time tells everyone how quickly each part must be produced in order to meet the customer demand for the day.
Available working time per day Takt time = -------------------------------------------------------- Customer demand rate per day
420 minutes per day
Takt time = --------------------------------- = 0.105 minutes

45
4000 per day
A tube must be produced every 0.105 minutes
11.6 Calculate the Takt time for a dairy that works an 8 hour shift each day. The shift receives 30 minutes for a mid-shift meal and two 15 minute breaks. The customer would like to receive 2500 gallons of milk per day.
To calculate takt time, an organization determines the amount of work time available during a day and the customer demand for that day. The customer demand is divided into the time available and the resulting takt time tells everyone how quickly each part must be produced in order to meet the customer demand for the day.
Available working time per day Takt time = -------------------------------------------------------- Customer demand rate per day
420 minutes per day
Takt time = --------------------------------- = 0.168 minutes 2500 per day
A gallon must be produced every 0.168 minutes
11.7 Calculate the Takt time for a company that works two 8 hour shifts per day. Each shift receives 30 minutes for a mid-shift meal and two 15 minute breaks. The customer would like to receive 25 generators per day.
To calculate takt time, an organization determines the amount of work time available during a day and the customer demand for that day. The customer demand is divided into the time available and the resulting takt time tells everyone how quickly each part must be produced in order to meet the customer demand for the day.
Available working time per day Takt time = -------------------------------------------------------- Customer demand rate per day
420 minutes per day
Takt time = --------------------------------- = 16.8 minutes 25 per day

46
A generator must be produced every 16.8 minutes
11.8 Create a diagram that describes how kanban systems work.
Kanban, which means display card in Japanese, is normally a sign, card, or label, that communicates what is needed and when. The kanban serves three purposes: a label for the items, an order for new items, and a record of the items used. Information on the cards include the name of the part, the number of parts to be produced, instructions related to the part, the creation date of the card, the due date of the parts, and other pertinent information.
Kanban cards control inventory by only allowing what is needed to be produced. A kanban card will tell the operator how many parts are needed. If it is an assembly, other kanban cards will tell the operator how many of each component will be needed. Only what is listed on the kanban card will be used or produced.
11.9 What does the word autonomation mean?
Jidoka is the Japanese word for autonomation. When a Jidoka or autonomation system is present, machines and equipment are designed to stop automatically when a problem is detected. Any operator on the line also has the power to stop production. Jidoka systems alert the worker to when a defective item is produced or a machine malfunction has occurred. This allows the problem to be dealt with immediately, preventing the production and passing of defects. Problems and the defects they cause can be more quickly localized, isolated, and corrected.
11.10 What are andon lights? How are they used?
When a piece of equipment stops after having recognized that an abnormal condition exists, an andon or trouble light may come on. Andon means lantern in Japanese. Andons are lanterns that guide people to where there is trouble. When illuminated, this light alerts anyone in the area that the equipment has stopped and that there is an issue that must be dealt with. Since the andon alerts everyone in the area of the existence of a problem, trouble-shooting can begin immediately. Corrective action can be taken quickly when problems are exposed. Andons can be lights, buzzers, alarms or any method that immediately transfers information to the appropriate people without delay.

47
Chapter 12 Questions 12.1 Describe Seiri. How would you do it?
Seiri: Separate or sort out what is needed at the work station from what is not. Remove excess items from the work area. Carefully judge what is truly used and what is clutter and what is used occasionally.
12.2 Describe Seiton. How would you do it?
Seiton : Create an orderly arrangement of the materials needed at each work station. Set the work area in order. Simplify the arrangement of machines, materials, tools, and information necessary to do the job. Find a place for everything and put everything in its place.
12.3 Describe Seiso. How would you do it?
Seiso: Keep everything clean. Seiso refers to shining, sweeping, and attaining an overall level of cleanliness in the work area.
12.4 Describe Seiketsu. How would you do it?
Seiketsu: Repeat seiri, seiton, and seiso at regular intervals. Essentially, Seiketsu means to standardize how the work area is arranged and maintained. There should be established methods, rules, and procedures for keeping the work area clean and organized.
12.5 Describe Shitsuki. How would you do it?
Shitsuki: Have the discipline to keep everything at the new level of performance. Sustaining the gains made by cleaning the work area takes self-discipline and sometimes some help from management to remind people not to go back to the old cluttered ways. Think of it as control at a new level.

48
Chapter 13 Questions 13.1 Describe the philosophy behind Kaizen.
The guiding words are: combine, simplify, and eliminate. Kaizen seeks to standardize processes while eliminating waste. Kaizen activities focus on studying the flow of the process and improving the value stream or they may focus on the elimination of waste.
13.2 Describe the Kaizen concept.
Pronounced ‘k-eye-zen’, the word Kaizen is the combination of two words. In Japanese ‘kai’ means ‘little’, ‘ongoing’, and ‘good’. ‘Zen’ means ‘for the better’ and ‘good’. Kaizen improvement efforts are little ongoing good improvements that make things better. Kaizen events are short, highly focused projects that improve the activities in a work area.
13.3 How do Dr. Deming’s teachings support Kaizen?
Dr. Deming’s summarizes his philosophies on management involvement and continuous improvement in his fourteen points. Several of those points directly relate to kaizen and continuous improvement. The first of his fourteen points for management states: Create a constancy of purpose toward improvement of product and service, with the aim to become competitive and to stay in business and to provide jobs. This first point encourages leadership to constantly improve their products or services through innovation, research, education, and continual improvement in all facets of their company. Dr. Deming’s fifth point clearly states the kaizen and continuous improvement concepts: Constantly and forever improve the system of production and service. An organization cannot remain truly competitive unless it strives to continually enhance its business processes that provide the products and services their customers want. In the chapter’s opening quote, to ‘have pride of workmanship no matter how small the task’ is reminiscent of Dr. Deming’s twelfth point ‘Remove barriers that rob people of their right to pride in workmanship.’ Barriers are any aspect of a job that prevents employees from doing their jobs well. By removing them, leadership creates an environment supportive of their employees and the continuous improvement of their day-to-day activities. In lean Six Sigma organizations, employees work patiently to continually improve the processes they work with. Dr. Deming’s sixth point, Institute training on the job, also supports continuous improvement. Continual education and training creates an atmosphere that encourages the discovery of new ideas and methods. This translates to continuous improvement and innovative solutions to problems.

49
13.4 List the steps for a Kaizen project.
During Kaizen events, lean and Six Sigma tools and techniques blend together, enabling participants to optimize process, product, or service performance. Six Sigma tools and techniques emphasize root cause analysis through the use of a standardized problem-solving technique (PDSA or DMAIC) in combination with statistical analysis and performance measures. Kaizen improvements must plan a corrective action (Plan), implement it (Do), confirm its success or failure (Study), and determine if more actions are needed (Act).
13.5 Describe each of the seven sources of waste.
Taiichi Ohno, also of Toyota Motor Company, categorized seven sources of waste: - waste from overproduction - waste from inventory - waste in unnecessary transportation - waste from producing defects - waste in processes - waste in waiting time - waste in motions. Overproduction waste is a common problem at both manufacturing and service industries. This waste is created every time too many products are produced for the market. Inventory waste carries with it a lot of costs. These costs include the cost of storing and managing the inventory. They also include the costs associated with having that inventory become obsolete or spoil. Excessive inventory hides problems too. Transportation waste is a non-value-added activity. Any time an item is handled or a customer is passed to another server, time and effort is wasted with no value to the process. Defects waste is obvious. Doing something wrong or making something wrong wastes time, effort, and resources. Process waste is sometimes more difficult to define. Processes develop over time, sometimes without rhyme or reason. Processes need to be studied using value added process mapping in order to identify and remove the non-value-added activities. Wait time waste is another obvious waste. Having the right material at the right time in the right location can prevent many wait time waste. Motion wastes refer to the human element in any process. Any time a person makes a move that does not correspond to a value-added activity, their motions are wasted. Simply put, if an activity or item does not add value or fill a key non-value added activity (such as accounting or payroll), then it is waste.

50
13.6 What is meant by error-proofing?
Poka-yoke or error proofing is used to counteract human variation or error. Kaizen events often focus on error proofing by developing simple methods of preventing human errors from occurring in a process. Coined by Shigeo Shingo, the Japanese word Poka-yoke can be translated as foolproof mechanism. Error proof designs do not hinder worker performance, instead they eliminate the chance for error by putting mechanisms in place that prevent wrong action. Significant benefits of error proofing a process include the decrease in defects and the reduced inspection requirements. Poka-yoke ideas come from a variety of sources including the workers and engineers working most closely with the process. Poka-yoke designs and devices may be based on weight, dimensions, shape, procedure, sequencing, meters or counters, limit switches, contact switches, or other technology. Error proofing should be clever, logical, simple, and inexpensive.
51
Chapter 14 Questions 14.2 What are the benefits of producing smaller batch sizes?
When smaller batch sizes are produced, if there is a problem, it will be found quickly. Smaller batch sizes also prevent overproduction waste by enabling the producer to create only what is needed when it is needed. This also reduces the lead time that it takes to create a product. Smaller batch sizes result in more frequent inventory turns, eliminating the waste of obsolescence or lack of need.
14.3 Describe what is meant by the term line-balancing.
Line balancing means that every workstation on the line is busy the same amount of time. No one workstation is idle, waiting for another workstation to finish its work. Operations are timed to match what is needed to be produced.
14.4 What is meant by the term ‘takt time’?
To calculate takt time, an organization determines the amount of work time available during a day and the customer demand for that day. The customer demand is divided into the time available and the resulting takt time tells everyone how quickly each part must be produced in order to meet the customer demand for the day.
14.5 Describe what is meant by the term ‘level scheduling’.
Level scheduling creates a steady flow of material through the process. When a schedule is level, the same amount is produced each day or shift. A level schedule allows production people to focus their attention on their work without having to deal with sudden fluctuations in the amount of work.
14.6 What do users hope to accomplish by reducing set-up time?
Set-up time is defined as the time between the production of the last good part in one series of parts and the production of the first good part in the next series of parts. Set-up time reduction can help balance a line by taking the non-value-added time out of the process. Reducing set-up time eliminates waste in the process.
14.7 Describe what is meant by the term ‘single minute exchange of dies’.

52
Single minute exchange of dies (SMED) calls for tooling and equipment designed to allow easy changes from one tool to another. Without quick changeovers, lead times remain long. Machines are not available for production for the length of the set-up. Since the cost of changing over tooling is high, small batch sizes cannot be justified. Large batch sizes hide quality problems. Lengthy changeovers limit an organization’s flexibility to respond quickly to customer needs. All of this points to the need to reduce the amount of time it takes to change from one tool to another.
14.8 Describe what is meant by the term ‘single piece flow’. In a continuous or single piece flow environment, as each piece is created, it flows immediately to the next activity with no delays, storages, or work-in-process inventories.
14.9 Describe what is meant by the term ‘standardized work’.
Standardized work is referred to as standard operating procedures. These standard operating procedures refer to the activities that must happen in order to complete a process. They mean that everyone doing that job does it exactly the same way each time. There would be no difference between the way operator A performs the work versus operator B. There would also be no difference between the fifth time they did the work or the 1000th time they performed the work. Well-designed standards and process procedures may include check lists, maintenance procedures, set-up procedures or other process steps.
14.10 What is meant by visual management? Whay types of tools are helpful for visual management?
Visual management or transparency refers to enabling anyone to have the ability to see, in real time, what is happening with a process. From the instantaneous information they gather, they should also be able to determine whether or not anything has changed or needs to be changed. Any visual aids are helpful, especially those found in 5S. Andon lights are also a form of visual management.
53
Chapter 15 Questions 15.1 At a local machining company, the maintenance manager and the plant
manager discussed the new moving assembly line and the new types of machines required to assemble their newest product. The maintenance manager suggested preparing a total productive maintenance plan. Based on what you learned while reading the chapter, discuss with the plant manager the need to prepare a TPM plan. Convince the manager that this is a great idea. Discuss why maintenance costs often over budget. Answer questions like: Why would the plant want to implement a TPM plan? What benefits would they receive?
The benefits of productive maintenance programs support lean Six Sigma by enhancing customer satisfaction, reducing costs, increasing productivity, and improving quality. Reliable, productive equipment is required for lean and Six Sigma. Complaints are often heard about the high costs of maintenance. Productive maintenance programs actually help reduce maintenance costs. Maintenance costs are often over budget because of the emergency response approach to maintaining equipment. This ‘ignore it until it fails’ mode of operating is expensive. Organizations that engage in fire fighting verses a prevention approach to maintenance endure high costs because they do not recognize the real costs of unavailable equipment. Malfunctions and unavailable equipment means lost time, lost productivity, poor quality, low morale, and decreased customer satisfaction. Productive maintenance programs build awareness of maintenance needs, monitor expenditures closely, and respond to difficulties quickly. Productive maintenance programs reduce costs by establishing policies and procedures that reduce equipment downtime and unplanned maintenance.
15.2 Describe the critical components of a TPM plan. What are the components? How do they work together to become a single plan? What will need to be done to ensure the critical components of the plan are actually performed?
A well-designed TPM plan will include four components: Elimination of equipment losses Preventive maintenance
Predictive or planned maintenance Autonomous maintenance
Productive maintenance programs focus on eliminating three key sources of equipment losses: equipment downtime, speed losses, and quality defects due to variation in equipment performance. A TPM plan will try to prevent the need for maintenance through the design and acquisition of equipment that will be easy to maintain and operate. A TPM plan will monitor overall Equipment Effectiveness (OEE) using the formula OEE =

54
Availability x efficiency x quality. Predictive maintenance monitors equipment performance over time by measuring, recognizing, and using signals from the process to diagnose the condition of the equipment and determine when maintenance will be required. Preventive and predictive maintenance reduce the amount of unexpected downtime in a process. If companies wait until something breaks before they fix it, they are at the mercy of chance, never knowing when to expect a breakdown. By carefully caring for equipment and machines by placing them on a maintenance program, companies know when a machine will be down for maintenance and they also know that there is a low probability of a piece of equipment failing unexpectedly. Maintenance reduces unexpected downtime and predicted downtime by taking care of existing equipment and machines on a regular basis. Autonomous maintenance refers to the day-to-day regular maintenance performed by equipment operators. Autonomous maintenance housekeeping rules are: ‐ Keep only necessary items at workplace ‐ Design locations for everything ‐ Keep workplace clean on a daily basis ‐ Ensure everyone participates ‐ Continuous adherence
15.4 Discuss any difficulties you can see in implementing a TPM plan. How could these difficulties be overcome?
A TPM program will require the support of management. A well-designed TPM plan will include four components:
Elimination of equipment losses Preventive maintenance
Predictive or planned maintenance Autonomous maintenance
These four components must all be championed otherwise the total program will become a disconnected effort. All four components must be implemented, which takes time and effort and most importantly, commitment. TPM programs do not bring results overnight. At a large company, it may take many years to bring all the equipment up to a high standard. Leadership must communicate to everyone the importance of eliminating equipment losses, preventing the need for maintenance, maintaining high standards of autonomous maintenance on a daily basis, and keeping and using maintenance records to predict and plan maintenance needs. This takes time out of the regular work day. Also, many people enjoy ‘fire-fighting’, so they can look like heroes. The goal is a smoothly running environment and this takes lots of detailed effort. Leadership must truly be committed to implement all four components in order to achieve the greatest rewards.

55
15.5 Outline a TPM plan. Provide details that you would be sure to include in a TPM plan for an entire assembly line.
A productive maintenance plan attacks two sources of production losses: machines or equipment availability and cycle time losses. A well-designed TPM plan will include four components:
Elimination of equipment losses Preventive maintenance
Predictive or planned maintenance Autonomous maintenance
Productive maintenance programs focus on eliminating three key sources of equipment losses: equipment downtime, speed losses, and quality defects due to variation in equipment performance. A TPM plan will try to prevent the need for maintenance through the design and acquisition of equipment that will be easy to maintain and operate. A TPM plan will monitor overall Equipment Effectiveness (OEE) using the formula OEE = Availability x efficiency x quality. Predictive maintenance monitors equipment performance over time by measuring, recognizing, and using signals from the process to diagnose the condition of the equipment and determine when maintenance will be required. Preventive and predictive maintenance reduce the amount of unexpected downtime in a process. If companies wait until something breaks before they fix it, they are at the mercy of chance, never knowing when to expect a breakdown. By carefully caring for equipment and machines by placing them on a maintenance program, companies know when a machine will be down for maintenance and they also know that there is a low probability of a piece of equipment failing unexpectedly. Maintenance reduces unexpected downtime and predicted downtime by taking care of existing equipment and machines on a regular basis. Autonomous maintenance refers to the day-to-day regular maintenance performed by equipment operators. Autonomous maintenance housekeeping rules are: ‐ Keep only necessary items at workplace ‐ Design locations for everything ‐ Keep workplace clean on a daily basis ‐ Ensure everyone participates ‐ Continuous adherence

56
15.6 Calculate the overall equipment effectiveness for a machine that is available 90% of the day, an efficiency rate of 85% and a quality output of 95%.
Availability = 90%
Efficiency = 85%
Quality = 95%
Overall Equipment Effectiveness = Availability x efficiency x quality
Overall Equipment Effectiveness = 0.90 x 0.85 x 0.95 = 0.73
The machine is up and running 73% of the time.
15.7 Calculate the overall equipment effectiveness for a copy machine that has an availability rate of 93%, an efficiency rate of 97% and a quality output of 90%.
Availability = 93%
Efficiency = 97%
Quality = 90%
Overall Equipment Effectiveness = Availability x efficiency x quality
Overall Equipment Effectiveness = 0.93 x 0.97 x 0.90 = 0.81
The machine is up and running 81% of the time.
15.8 Describe autonomous maintenance.
Autonomous maintenance refers to the day-to-day regular maintenance performed by equipment operators.
15.9 Describe the housekeeping rules used for a work area.
‐ Keep only necessary items at workplace ‐ Design locations for everything

57
‐ Keep workplace clean on a daily basis ‐ Ensure everyone participates ‐ Continuous adherence

58
Chapter 16 Questions 16.1 What is a supply chain? A supply chain is the network of organizations involved in the movement
of materials, information, and money as raw materials flow from their source through production until they are delivered as a finished product or service to the final customer.
16.2 What are the benefits of a well-managed supply chain? A well-designed supply chain ensures that the right product or service is
in the right place at the right time at an affordable price. Strong supply chains help lean Six Sigma organizations optimize quality, costs, and productivity. A well-designed supply chain ensures reliability, adaptability, reduced costs, and appropriate asset utilization. Effective supply chains are able to provide order fulfillment, on-time delivery, short response time, high value-added input per employee, high inventory turns, and short cycle times at a reasonable cost.
16.3 What are the objectives of effective supply chain management? Supply chains are driven by three factors: materials, money, and
information. The objective of supply chain management is to manage each of these three in ways to benefit the overall profitability and growth of the organization.
16.4 What organizations might be involved in a supply chain? A complete supply chain starts with raw material or parts or information
flowing in from the supplier side, value is added through internal processes, and ends with the final customer. The supply chain links all the components together in order to meet customer demand.
16.5 What do organizations involved in a supply chain transfer back and forth? Organizations taking part in a supply chains transfer back and forth three
factors: materials, money, and information. 16.6 Why is information so critical to supply chain management? Information is a key component of a supply chain. Organizations need to
know what is needed, how much, and when. Careful selection of the type of information system used to manage the supply chain ensures the integrity of the link between upstream and downstream suppliers and customers. Common information exchanged includes quotes, purchase orders, order confirmations, pricing information, shipping notices, and more.

59
16.7 What role does information play in a supply chain?
Organizations need to know what is needed, how much, and when. Without this information organizations cannot fulfill customer orders effectively. Effective organizations design and manage their information management systems, make technological improvements, and measure system performance in order to ensure data accuracy, integrity, reliability, timeliness, security, and confidentiality.
16.8 What role does e-commerce play in supply chain management?
E-commerce is the use of electronic technology to aid business transactions. E-commerce allows an organization to reach global markets with little effort. Their products and services can be accessed through the web, allowing consumers to make their choices. E-commerce often provides the following benefits:
Faster purchasing cycle times Reduced inventory Fewer order processing people Faster product or service search and ordering Greater information availability Automated validation and preapproved spending Less printed material like order forms or invoices Increased flexibility Online communication
16.9 What are the challenges to creating an effective supply chain?

60
Effective organizations treat their supply chains as processes that must be managed and improved. Effective organizations appraise the performance of the supply chain. Performance parameters are negotiated in advance and are measured and tracked. Supply chains are continuously improved and made lean. When a supply chain lacks synchronization, problems arise. The longer the supply chain, the greater the effects of changes in demand. Disruptions to any one of the organizations on the supply chain seriously affect its performance capabilities. These problems can be reduced by communication and information sharing throughout the supply chain. Information availability also helps to reduce lead times and supports smaller batch sizes.
16.10 Describe the role that purchasing plays in the supply chain.
The purchasing department is responsible for finding out what is out there, what the options are, how much it costs, and when it can be delivered. This means that they not only order goods and services but also select and manage suppliers. Purchasing agents negotiate contracts and act as the liaison between the organization’s internal departments and the external suppliers. Understanding the entire supply chain enables them to make effective purchases. In order to ensure that what they order is correct, they work closely with the internal departments making the requests for goods or services. These departments focus on the quality of the item purchased and the timeliness of the delivery. They provide purchasing with specifications and required delivery dates. In many cases they may also have an idea about where the items may be obtained. Purchasing adds value to the process by working to balance the costs associated with buying the goods and services. Efforts to reduce the material costs associated with providing a product or service often weigh heavily on the purchasing department.
Effective organizations seek to optimize the sourcing of their needed material, equipment, and services. To maintain an effective supply chain, these organizations develop a complete and accurate profile of their supplier base. As they judge supplier performance, they consolidate and grade suppliers, granting preferred status to those suppliers who perform best on meeting quality, quantity, performance, cost, and delivery requirements. Suppliers work closely with the purchasing department to determine material or service specifications, including quality, quantity, delivery date, and cost. Choosing reliable and trustworthy suppliers is crucial to maintaining the supply chain. Key performance factors to consider when choosing a supplier are:
Type of product (new technology versus mature product)

61
Quality Quality assurance Flexibility Reliability Location Price Delivery capability Lead times Financial stability Length of time in business Relationship strength Other factors, depending on the business
16.11 Describe the purchasing cycle. The purchasing cycle is summarized in Figure 16.7. 16.12 What is meant by logistics? Logistics is the process of determining the best methods of procuring,
maintaining, packaging, transporting, and storing of materials and personnel in order to satisfy customer demand. This physical side of supply chain management is sometimes called distribution. Logistics or distribution includes the material handling, packaging, warehousing, staging, and transportation of equipment, parts, subassemblies, tools, fuels, lubricants, office supplies, information, and anything else needed to keep the organization functioning.
16.13 Why does logistics play a key role in supply chain management?
Effective supply chains safeguard products while they are in transit. Since logistics involves determining the best methods of procuring, maintaining, packaging, transporting, and storing of materials and personnel in order to satisfy customer demand, it plays a key role in supply chain management. Without logistics there is no coordination of the things a customer has ordered from where it originates until it reaches the customer.

62
Chapter 17 Questions 17.1 Describe the concepts of a sample and a population.
Sample: A small portion of a population that, when analyzed, may provide information concerning the entire population. Population: The total set of observations being considered in a statistical procedure.
17.3 x x x x x x x x x x x x x x x x x x x 220 221 222 223 224 225 226 227 228 229 230 This diagram is skewed to the left. 17.4 Make a histogram. x x x x x x x x x x x x x x x x x x x x x x x x x x x x x x x x x x x x x x x 0.6535 0.6540 0.6545 0.6550 0.6555 0.6560 0.6565 0.6570 0.6575 0.6580 0.6585 0.6590 0.6595 17.5 Range = R = 0.6595 – 0.6535 = 0.0060 0.0060 h = ------------ + 1 = 21 0.0003 0.0060 h = ------------ + 1 = 13 0.0005

63
0.0060 h = ------------ + 1 = 10 0.0007 0.0060 h = ------------ + 1 = 8 Choose 0.0009 Lowest Midpoint = 0.6535 Other Midpoints = 0.6544, 0.6559, 0.6562, 0.6571, 06580, 0.6589, 0.6598 Boundaries = 0.65305, 0.65395, 0.65485, 0.65575, 0.65665, 0.65755, 0.65845, 0.65935, 0.66055 17.6 Make a histogram. Range = R = 230 – 221 = 9 9 h = --------- + 1 = 4 3 Lowest Midpoint = 221 Other Midpoints = 224, 227, 230 Boundaries: 219.5, 222.5, 225.5, 228.5 17.7 Make a histogram. Describe the distribution’s shape, spread, and location. Range = R = 120.2 -119.4 = 0.8 0.8 h = -------- + 1 = 4 Chose 0.3 0.8 h = -------- + 1 = 3 0.5 0.8 h = -------- + 1 = 2 0.7 Lowest Midpoint 119.4 Other Midpoints = 119.7, 120, 120.3

64
17.7 continued.
Boundaries = 119.25, 119.55, 119.85, 120.15, 120.45 17.8 What is meant by the following expression: the central tendency of the data?
The central tendency of the data refers to describing where the data is grouped in relation to the desired target value. The central tendency is described by the mean, the mode, and the median.
17.9 What is meant by the following expression: measures of dispersion?
Measures of dispersion refer to the spread of the data in the distribution or around the desired target value. Measures of dispersion are the range and the standard deviation.
17.10 Mean = 39 Mode = 34 Median = 38 17.11 Mean = 1.123 Mode = 1.122 Median = 1.123 17.12 Mean = 0.6563 Mode = 0.6540 Median = 0.6570 Range = 0.006 Standard Deviation = 0.002 17.13 Mean = 119.8 Mode = 119.8 Median = 119.8 Range = 0.8 Standard Deviation = 0.2 17.14 15 - 12 Z = ------------- = 1 3
Area = 0.8413 84.13% of the patrons wait less than 15 minutes for their main course to be brought to the table.

65
17.15 0.93 – 0.917 Z = ----------------------- = 2.60 0.005
Area = 0.9953 1- 0.9953 = 0.0047 0.47% of the parts are above 93 mm.
17.16 65 - 70 Z = ------------- = -1.67 3
Area = 0.0475 Area = 1 – 0.0475 = 0.9525 95.25% of the parts are acceptable.
17.17 19.7 – 20.6 Z = ------------------ = -0.69 1.3
The amount of product produced that falls below the lower specification limit of 19.7 pounds is 24.51%.
17.18 119.7 – 119.8 Z = ---------------------- = - 0.5 0.2 120.3 – 119.8 Z = ------------------------ = 2.5 0.2
The amount of product produced that falls below the lower specification limit of 119.7 mm is 30.85%. The amount of product produced that falls above the upper specification limit of 120.3 mm is 1 – 0.9938 = 0.0062 or 0.62%.

66
17.18 continued. These results verify that the process is not centered correctly in order to meet the specifications. The standard deviation is also large, showing that a lot of variation is present in the process. 17.19 Since α = 0.10, then Z(α/2) = 1.645 1.645(0.0008)
0.0015 +/- ------------------------ = (0.0017, 0.0013) √32
The engineers know with 90% confidence that the interval values for the population mean are (0.0017, 0.0013). This means that there is a 90% chance that the mean lies between those two numbers.
17.20
Since α = 0.05, then t(α/2) = 2.365 2.365(0.402)
44.795 +/- ------------------------ = (45.131, 44.458) √8
They know with 95% confidence that the interval values for the population mean are (45.131, 44.458). This means that there is a 95% chance that the mean lies between those two numbers.

67
Chapter 18 Questions 18.1 Describe the difference between chance and assignable causes.
Chance causes refer to the variation present in the system at all times. Assignable causes represent the variation in the process that can be identified and isolated as having a root cause. Assignable causes
18.2 Calculate the centerline and control limits for the X-bar and R charts. n = 5 XDB = 16 min R-bar = 7 UCLx = 16 + (0.577)(7) = 20 UCLr = 2.114(7) = 15 LCLx = 16 – (0.577)(7) = 12 LCLr = (0)(7) = 0 18.3 Calculate the centerline and control limits for the X-bar and R charts. n = 4 XDB = 50.2 R-bar = 0.68 UCLx = 50.2 + (0.729)(0.68) = 50.7 UCLr = 2.282(0.68) = 1.6 LCLx = 50.2 – (0.729)(0.68) = 49.7 LCLr = (0)(0.68) = 0 Revising the chart: Remove 5 points from both charts. 1255 – 251.7 XDBnew = ----------------------- = 50.2 25 - 5 R-barnew = 0.67 0.67 Sigma = ---------- = 0.325 2.059 UCLx = 50.6 UCLr = 1.5 LCLx = 49.8 LCLr = 0

68
18.4 Set up the X-bar and R charts on this process. Does the process seem to be in control? Why? Why not? If necessary, assume assignable causes and revise the trial control limits.
n = 5 4189 164 XDB = --------- = 349 R-bar = -------- = 14
12 12
UCLx = 349 + (0.577)(14) = 357 UCLr = 2.114(14) = 30 LCLx = 349 – (0.577)(14) = 341 LCLr = (0)(14) = 0 18.5 Describe how both an X-bar and R chart would look if they were under
normal statistical control.
An X-bar and R under normal statistical control exhibits the following characteristics. All three charts will have no patterns, trends, runs, or cycles. There will be a few points on or near the centerline. No points will be beyond the control limits. Two-thirds of the points will be near the centerline. The points will be balanced on both sides of the centerline and the points will move freely back and forth across the centerline.
18.6 Why is the use and interpretation of an R chart so critical when examining
an X-bar chart?
The use and interpretation of an R chart is critical when examining an X-bar chart because the R chart allows the user to see the spread of the data. The charts show if the spread of the data, the variation present in the process is reasonable for the measurements on the X-bar chart. The R chart shows the variation present in the process, they show the repeatability of the process.
18.7 Calculate the centerline and control limits for the X-bar and R charts. n = 5 1.8798 0.0102 XDB = ------------ = 0.0627 R-bar = ------------- = 0.0003
30 30 UCLx = 0.0627 + (0.577)(0.0003) = 0.0629 LCLx = 0.0627 – (0.577)(0.0003) = 0.0625
UCLr = 2.114(0.0003) = 0.0006 LCLr = (0)(0.0003) = 0

69
UCLx = 16 + (0.577)(7) = 20 UCLr = 2.115(7) = 15 LCLx = 16 – (0.577)(7) = 12 LCLr = (0)(7) = 0 18.8 Calculate the centerline and control limits for the X-bar and R charts.
n = 8
XDB = 3.02 R-bar = 0.10
UCLx = 3.02 + (0.373)(0.10) = 3.06 UCLr = 1.864(0.10) = 0.19 LCLx = 3.02 – (0.373)(0.10) = 2.98 LCLr = (0.136)(0.10) = 0.01

70
Chapter 19 Questions 19.1 What do control limits represent? What do specification limits represent? Describe the three cases that compare specification limits to control limits. Control limits represent the realities of what the process is capable of producing. They show the spread of the current process over time. Specification limits are set by the designer or customer and represent what they wish the process could produce. Figures in the chapter show the three cases that compare specification limits to control limits. 19.2 Why can a process be in control but not be capable of meeting specifications? A capable process is a process that is producing to the best of its ability (i.e. consistently, precisely, and accurately). A capable process exhibits control as shown by the six checks from Chapter 18. A process can be in control but not capable of meeting specifications when the specifications set by the designer/customer are narrower in spread than the spread of the process as shown by 6 sigma. The realities of the process cannot be forced to meet the desires of the customer. The process must be improved. 19.3 Calculate 6σ, Cp, and Cpk. Interpret the indices.
R-bar 7 σ = ----------- = ----------- = 3
d2 2.326 6σ = 18 USL – LSL 21 – 13 Cp = ------------------ = ----------------- = 0.44 6σ 18 Z(min) Cpk = ----------- 3 (USL – X-bar) 21 – 16 Z(U) = -------------------- = -------------- = 1.66 σ 3

71
(X-bar – LSL) 16 – 13 Z(L) = -------------------- = -------------- = 1 σ 3 1 Cpk = ------- = 0.33 3 The process is not capable and it is not centered. 19.4 Calculate 6σ, Cp, and Cpk. Interpret the indices.
R-bar 0.68 σ = ----------- = ----------- = 0.33
d2 2.059 6σ = 1.98 USL – LSL 50.5 – 49.5 Cp = ------------------ = --------------------- = 0.51 6σ 1.98 Z(min) Cpk = ----------- 3 (USL – X-bar) 50.5 – 50.2 Z(U) = -------------------- = ------------------- = 0.91 σ 0.33 (X-bar – LSL) 50.2 – 49.5 Z(L) = -------------------- = ------------------- = 2.12 σ 0.33 0.91 Cpk = ----------- = 0.3 3 The process is not capable and it is not centered.

72
19.5 Calculate 6σ, Cp, and Cpk. Interpret the indices.
s-bar 1 σ = ----------- = ----------- = 1
c4 0.693 6σ = 6 USL – LSL 36 – 30 Cp = ------------------ = ----------------- = 1.0 6σ 6 Z(min) Cpk = ----------- 3 (USL – X-bar) 36 – 32 Z(U) = -------------------- = -------------- = 4 σ 1 (X-bar – LSL) 32 – 30 Z(L) = -------------------- = -------------- = 2 σ 1 2 Cpk = ------- = 0.66 3 The process is just capable and it is not centered. 19.6 Calculate 6σ, Cp, and Cpk. Interpret the indices.
R-bar σ = ----------- = 1.446
d2 6σ = 8.676 USL – LSL 10 – 8 Cp = ------------------ = ----------------- = 0.23 6σ 8.676

73
Z(min) Cpk = ----------- 3 (USL – X-bar) 10 – 8.624 Z(U) = -------------------- = ----------------- = 0.95 σ 1.446 (X-bar – LSL) 8.624 – 8 Z(L) = -------------------- = ------------------ = 0.43 σ 1.446 0.43 Cpk = ---------- = 0.14 3 The process is not capable and it is not centered.
19.7 Calculate 6σ, Cp, and Cpk. Interpret the indices.
R-bar 2 σ = ----------- = ----------- = 1
d2 2.059 6σ = 6 USL – LSL 29 – 23 Cp = ------------------ = ----------------- = 1 6σ 6 Z(min) Cpk = ----------- 3 (USL – X-bar) 29 – 25 Z(U) = -------------------- = -------------- = 4 σ 1

74
(X-bar – LSL) 25 – 23 Z(L) = -------------------- = -------------- = 2 σ 1 1 Cpk = ------- = 0.66 3 The process is capable but it is not centered. 19.8 Calculate 6σ, Cp, and Cpk. Interpret the indices.
R-bar 0.10 σ = ----------- = ----------- = 0.04
d2 2.847 6σ = 0.24 USL – LSL 3.05 – 2.95 Cp = ------------------ = ------------------- = 0.42 6σ 0.24 Z(min) Cpk = ----------- 3 (USL – X-bar) 3.05 – 3.02 Z(U) = -------------------- = ------------------ = 0.8 σ 0.04 (X-bar – LSL) 3.02 – 2.95 Z(L) = -------------------- = ------------------- = 1.8 σ 0.04 0.8 Cpk = --------- = 0.27 3 The process is not capable and it is not centered.

75
19.9 Calculate 6σ, Cp, and Cpk. Interpret the indices.
s-bar 50 σ = ----------- = ----------- = 56
c4 0.8862 6σ = 336 USL – LSL 550 – 250 Cp = ------------------ = ------------------ = 0.9 6σ 336 Z(min) Cpk = ----------- 3 (USL – X-bar) 550 – 390 Z(U) = -------------------- = ----------------- = 2.9 σ 56 (X-bar – LSL) 390 – 250 Z(L) = -------------------- = ----------------- = 0.7 σ 56 0.7 Cpk = ------- = 0.23 3 The process is nearly capable and it is not centered. 19.10 Calculate 6σ, Cp, and Cpk. Interpret the indices.
R-bar 1.66 σ = ----------- = ----------- = 0.8
d2 2.059 6σ = 4.8 USL – LSL 90 – 70 Cp = ------------------ = ----------------- = 4.2 6σ 4.8
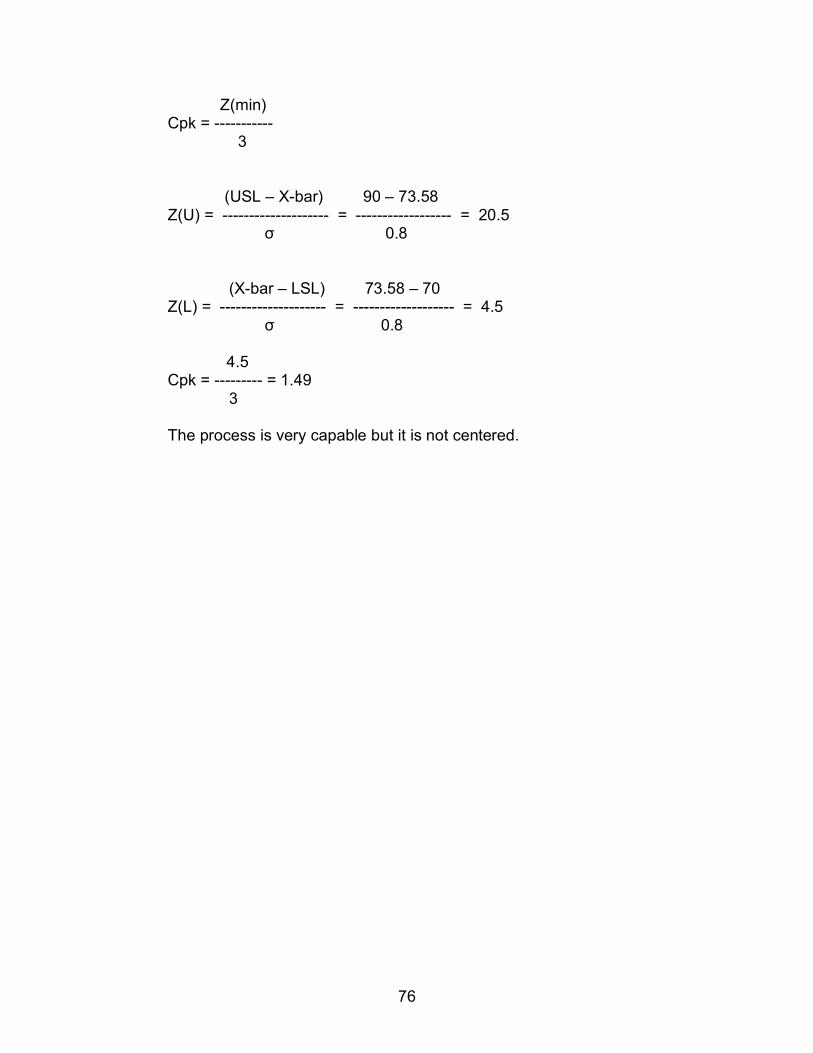
76
Z(min) Cpk = ----------- 3 (USL – X-bar) 90 – 73.58 Z(U) = -------------------- = ------------------ = 20.5 σ 0.8 (X-bar – LSL) 73.58 – 70 Z(L) = -------------------- = ------------------- = 4.5 σ 0.8 4.5 Cpk = --------- = 1.49 3 The process is very capable but it is not centered.

77
Chapter 20 Questions 20.1 Reliability is quality in the long term. It is the ability of a product or service to perform its intended function under specified design conditions. 20.2 Describe the three phases of the life history curve. The life cycle of a product is commonly broken down into three phases: early failure, chance failure, and wear-out. The early failure, or infant mortality, phase is characterized by failures occurring very quickly after the product has been produced or put into use by the consumer. The curve during this phase is exponential, with the number of failures decreasing the longer the product is in use. During the chance failure portion of a product’s useful life, failures occur randomly. This may be due to inadequate or insufficient design margins. Manufacturing or material problems have the potential to cause intermittent failures. At this stage the consumer can also affect product reliability. Misapplication or misuse of the product by the consumer can lead to product failure. Overstressing the product is a common cause of random failures. As the product ages, it approaches the final stage of its life cycle, the wear-out phase. During this phase, failures increase in number until few, if any, of the product are left. Wear-out failures are due to a variety of causes, some related to actual product function, some cosmetic.
4 20.3 λ = --------------------------------------------- = 0.00035
80 + 150 + 350 + 465 + 21(500) Θ = 2857 hours
2 20.4 λ = -------------------------- = 0.002
45 + 72 + 10(90) Θ = 500 hours
2 20.5 λ = ------------------------------------ = 0.0000254
8(8776) + 2460 + 5962 Θ = 39,315 hours

78
39,315 Availability = --------------------- = 99.7
39.315 120 20.6 Parallel systems are more reliable because only one of its components has to be working properly for the system to function. With series systems, all components are required to work for the system to function. 20.7 Rs = Ra *[Rb + Re(1 – Rb)]*[1 – (1 – Rc)(1 – Rd)]
Rs = 0.99*[0.98 + 0.98(1 – 0.98)]*[1 – (1 – 0.94)(1 – 0.95)] Rs = 0.99*0.9996*0.997 Rs = 0.987 The system will be operational 98.7% of the time.
20.8 Rs = 0.99*[1 – (1 – 0.89)(1 – 0.89)]*0.98*[0.95 +0.95(1 – 0.95)] Rs = 0.99*0.9879*0.98*0.9975 Rs = 0.9561 The system will be operational 95.61% of the time.
20.9 Rs = 0.99*[1 – (1 – 0.98)(1 – 0.97)]*[0.95 +0.93(1 – 0.95)]*[1 – (1 – 0.98)(1 – 0.95)(1 – 0.96)]
Rs = 0.99*0.9994*0.9965*0.99996 Rs = 0.9859
20.10 Rs = 0.99*0.98*0.99*0.97*[1 – (1 – 0.9125)(1 – 0.9125)] = 0.926 The system will be operational 92.6% of the time
20.11 Rs = 0.80*[1 – (1 – 0.414)(1 – 0.238)] = 0.442
The system will work 44.2% of the time.

79
Chapter 21 Questions 21.1 Define the components
Factors: Supplier, Size, Plating Levels:
Factors Levels Supplier A, B Size 2” 3” Plating Yes No
Effect: Bending strength, when does the part fail? Response Variable: Bending strength Treatment: an arrangement of factors at chosen levels, For example: Supplier A, 2”, and Plating Degrees of Freedom (2 x 2 x 2) – 1 = 7 Interaction may occur between any one or all of the factors. Run: the application of one treatment to one experiment. For example: Supplier B, 2”, no plating Replicate: repeat one treatment
Significance: does the size, plating, or supplier matter to bending strength?
21.2 Full-factorial experiment
A, 2, Plating B, 2, Plating A, 3, Plating B, 3, Plating A, 2, No Plating B, 2, No Plating A, 3, No Plating B, 3, No Plating
21.3 Factors Levels Temp 250, 275, 300 Time 5, 7, 9 seconds Pressure 200, 250, 300 psi 21.4 Factors Levels Temp 250, 275, 300 Time 5, 7, 9 seconds Pressure 200, 250, 300 psi The effect or response variable is part strength Treatment: Temperature 250, Time in mold 7 seconds, Pressure 300 psi Degrees of Freedom (3 X 3 x 3) – 1 = 26 Interaction between temperature, time, or pressure Significance: do any of these items (temp, time, pressure) matter to part
strength?

80
21.5 Temp Time Pressure
250 5 200 250 7 200 250 9 200
250 5 250 250 7 250 250 9 250
250 5 300 250 7 300 250 9 300
275 5 200 275 7 200 275 9 200
275 5 250 275 7 250 275 9 250
275 5 300 275 7 300 275 9 300
300 5 200 300 7 200 300 9 200
300 5 250 300 7 250 300 9 250
300 5 300 300 7 300 300 9 300
21.6 Tire pressure and vehicle speed have no effect on gas mileage.
21.7 One error happens when you think something is true but it is not. The other error happens when you think something is not true when it is.

81
21.8 Factors Level 1 Level 2 Width 18 24 Shelving Flat Angled Line Straight Curved
The response variable being investigate is throughput time, the time to assemble and pack the items.

82
Chapter 22 Questions 22.1 Why do Lean Six Sigma practitioners use failure modes and effects analysis? Lean Six Sigma practitioners realize that FMEAs are effect tools to use to prevent failures of their products or services. FMEAs are used to study a product, service, process or system in order to find and make plans to eliminate potential failures. FMEAs identify not only the failure, but the types of consequences of those failures. By assigning risk priorities to these failures, Lean Six Sigma practitioners know where to focus their efforts first. 22.2 Describe the three types of FMEAs discussed in this chapter. Systems FMEA: Systems are large scale operations that can be quite complex. Six Sigma practitioners use system FMEAs in order to follow the flow of a product or service or person through a system. These FMEAs enable users to see where the system may break down or fail. Process FMEA: A process FMEA studies the flow of a process. It is used to determine where the process might break down or fail. It focuses on the step by step procedures that take place in a process and studies how these steps relate to each other and to the activities taking place. Design FMEA: A design FMEA is used to study potential failures in a product. These FMEAs help Six Sigma practitioners evaluate product designs and make them more robust. 22.3 Describe the steps involved in creating an FMEA 1. Create the form (Figure 22.1) 2. Study the system, process, or part 3. Brainstorm the items involved in the system, process or part and their
functions (Figure 22.2) 4. For each item, determine all potential failure modes 5. For each item, determine all potential failure causes 6. For each item, determine all potential failure consequences 7. For each item, determine the current conditions or controls in place 8. For each item, determine the existing countermeasures 9. For each item, determine the severity of failure (seriousness of failure) 10. For each item, determine the probability of occurrence of the failure 11. For each item, determine the RPC 12. Develop solutions for all RPC’s of 1.

83
22.4 Create and analyze an FMEA for a refrigerator.
Item Function
Potential Failure Modes
Potential Causes
Failure Effect
Existing Controls, Countermeasures, Detection Methods
Pro
babi
lity
Sev
erity
Risk Priority Code
Recommended Action, Responsibility, Target Date
Coils Provide Coil corrosion No cooling visual
Cooling Ruptures Maintenance check C III 3
electric wire failure
No cooling visual
current detacted maintenance Failure short check D III 3 Light actuation short no light visual C III 3 Switch broken maintenance Failure check
lightbulb fails burnt out no visual B III 3
to light no current Light Maintenance
check electric No No light Visual C III 3 current Current Check Failure Motor No Motor Bearings Fire Visual C I 1 JR to Overheat Cooling Faulty Tight Smell Determine Fix by 10/8
Use question 22.4 as a model for the following questions: 22.5 Create and analyze an FMEA for a chain saw. 22.6 Create and analyze an FMEA for a prescription filling process. 22.7 Create and analyze an FMEA for the operation of a lathe, mill, or drill. 22.8 Create and analyze an FMEA for a hospital patient check-in procedure. 22.9 Create and analyze an FMEA for a food preparation area in a restaurant.