lean six sigma yellow belt advanced program - hmg.com.au yellow belt mz2019.pdf · dynamic view vs...
TRANSCRIPT
Lean Six Sigma Yellow Belt Advanced Program
Ver. 2019.1

ii
iii
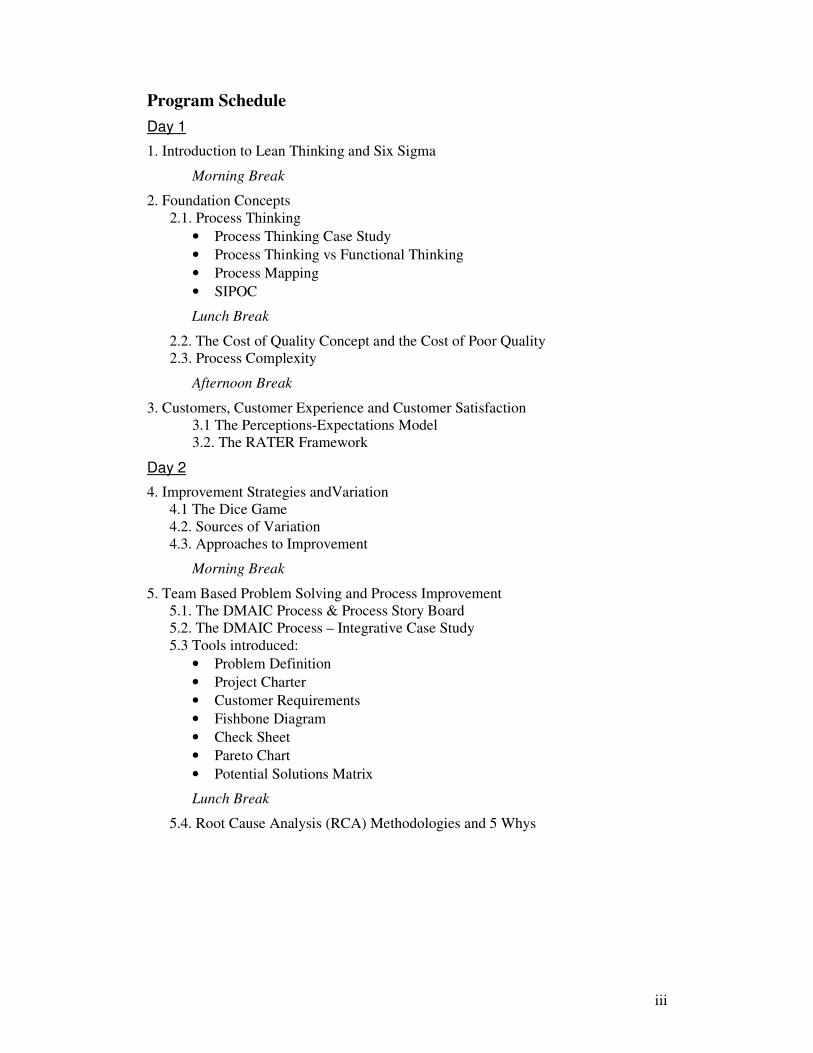
Program Schedule
Day 1
1. Introduction to Lean Thinking and Six Sigma
Morning Break
2. Foundation Concepts
2.1. Process Thinking
• Process Thinking Case Study
• Process Thinking vs Functional Thinking
• Process Mapping
• SIPOC
Lunch Break
2.2. The Cost of Quality Concept and the Cost of Poor Quality
2.3. Process Complexity
Afternoon Break
3. Customers, Customer Experience and Customer Satisfaction
3.1 The Perceptions-Expectations Model
3.2. The RATER Framework
Day 2
4. Improvement Strategies andVariation
4.1 The Dice Game
4.2. Sources of Variation
4.3. Approaches to Improvement
Morning Break
5. Team Based Problem Solving and Process Improvement
5.1. The DMAIC Process & Process Story Board
5.2. The DMAIC Process – Integrative Case Study
5.3 Tools introduced:
• Problem Definition
• Project Charter
• Customer Requirements
• Fishbone Diagram
• Check Sheet
• Pareto Chart
• Potential Solutions Matrix
Lunch Break
5.4. Root Cause Analysis (RCA) Methodologies and 5 Whys

iv
6. Process Change/The DMADV Process
6.1. DMADV, BPR, Process Redesign and Kaikaku
6.2. DMADV Application Case Study
6.3. Tools and Techniques
• Process Deployment Chart/Zig-Zag Analysis
• Value Added/Non-Value Added Analysis
• Double Fishbone
6.4. Process/People/Technology Redesign Principles
Afternoon Break
7. Process Flow and Work Management
7.1. Dynamic View vs Static View of Processes
7.2. The Water-Bucket Method
7.3. Little’s Law
7.4. Flow Measures and Decision Making
7.5. Process Balancing
7.6. Dealing with common dynamic effects
8. Implementation Issues and Conclusion
v
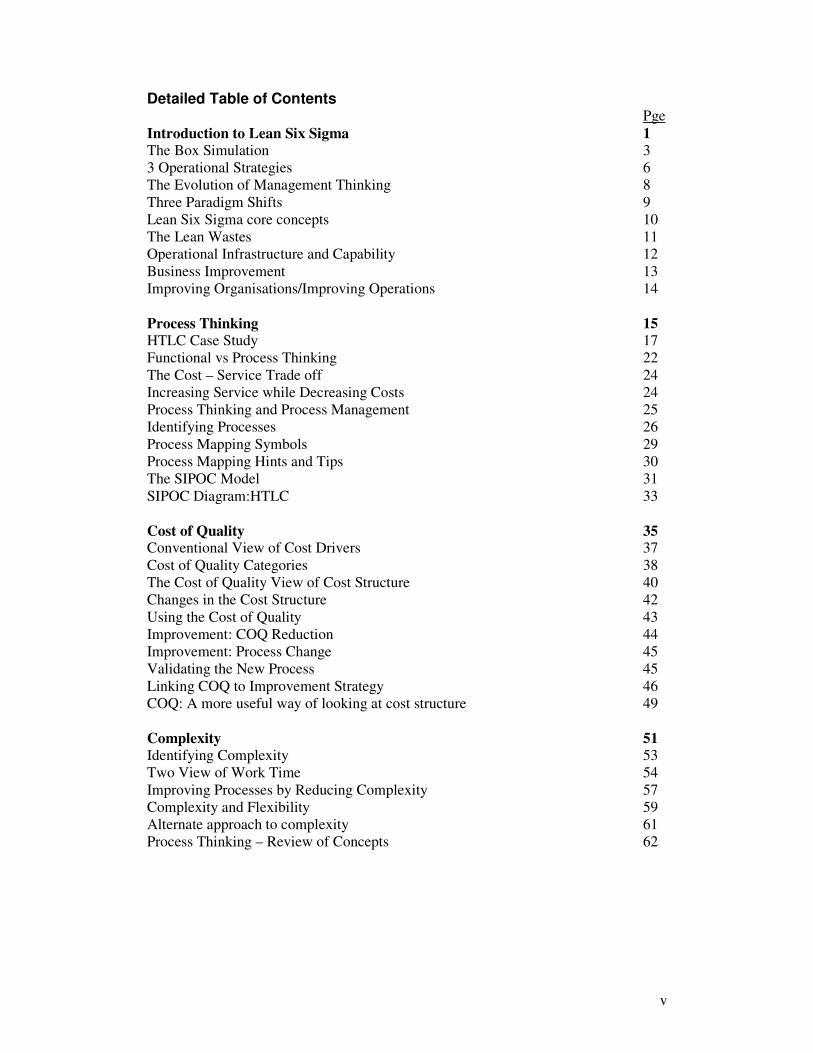
Detailed Table of Contents Pge
Introduction to Lean Six Sigma 1
The Box Simulation 3
3 Operational Strategies 6
The Evolution of Management Thinking 8
Three Paradigm Shifts 9
Lean Six Sigma core concepts 10
The Lean Wastes 11
Operational Infrastructure and Capability 12
Business Improvement 13
Improving Organisations/Improving Operations 14
Process Thinking 15
HTLC Case Study 17
Functional vs Process Thinking 22
The Cost – Service Trade off 24
Increasing Service while Decreasing Costs 24
Process Thinking and Process Management 25
Identifying Processes 26
Process Mapping Symbols 29
Process Mapping Hints and Tips 30
The SIPOC Model 31
SIPOC Diagram:HTLC 33
Cost of Quality 35 Conventional View of Cost Drivers 37
Cost of Quality Categories 38
The Cost of Quality View of Cost Structure 40
Changes in the Cost Structure 42
Using the Cost of Quality 43
Improvement: COQ Reduction 44
Improvement: Process Change 45
Validating the New Process 45
Linking COQ to Improvement Strategy 46
COQ: A more useful way of looking at cost structure 49
Complexity 51
Identifying Complexity 53
Two View of Work Time 54
Improving Processes by Reducing Complexity 57
Complexity and Flexibility 59
Alternate approach to complexity 61
Process Thinking – Review of Concepts 62
vi
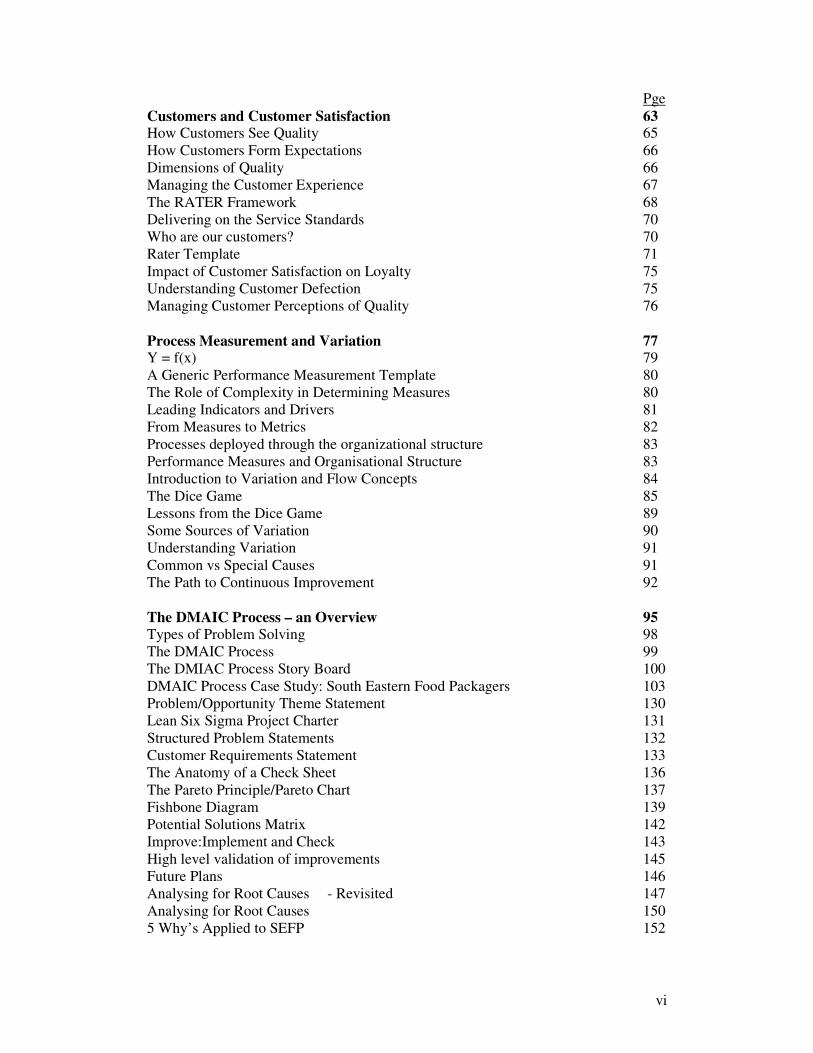
Pge
Customers and Customer Satisfaction 63 How Customers See Quality 65
How Customers Form Expectations 66
Dimensions of Quality 66
Managing the Customer Experience 67
The RATER Framework 68
Delivering on the Service Standards 70
Who are our customers? 70
Rater Template 71
Impact of Customer Satisfaction on Loyalty 75
Understanding Customer Defection 75
Managing Customer Perceptions of Quality 76
Process Measurement and Variation 77 Y = f(x) 79
A Generic Performance Measurement Template 80
The Role of Complexity in Determining Measures 80
Leading Indicators and Drivers 81
From Measures to Metrics 82
Processes deployed through the organizational structure 83
Performance Measures and Organisational Structure 83
Introduction to Variation and Flow Concepts 84
The Dice Game 85
Lessons from the Dice Game 89
Some Sources of Variation 90
Understanding Variation 91
Common vs Special Causes 91
The Path to Continuous Improvement 92
The DMAIC Process – an Overview 95
Types of Problem Solving 98
The DMAIC Process 99
The DMIAC Process Story Board 100
DMAIC Process Case Study: South Eastern Food Packagers 103
Problem/Opportunity Theme Statement 130
Lean Six Sigma Project Charter 131
Structured Problem Statements 132
Customer Requirements Statement 133
The Anatomy of a Check Sheet 136
The Pareto Principle/Pareto Chart 137
Fishbone Diagram 139
Potential Solutions Matrix 142
Improve:Implement and Check 143
High level validation of improvements 145
Future Plans 146
Analysing for Root Causes - Revisited 147
Analysing for Root Causes 150
5 Why’s Applied to SEFP 152

vii
Pge
Process Change: The DMADV Process at Work 155 Process Change/Reengineering 157
The DMADV Process 158
The DMADV Process Storyboard 159
The Process Redesign Framework 161
Deciding if Process Redesign is the best approach 162
Joan’s Story Case Study 163
Measures: HTLC Current Process 167
Process Deployment chart 168
Reengineering/Redesign Opportunities 169
Reengineering Enablers 170
Process Redesign Methodology Toolkit 171
Value Added/Non-Value Added Analysis 172
The Double Fishbone 174
Quick wins 177
Process Challenge Templates 177
Process Flow Management 181 The Structural View of Processes 183
The Flow View of Processes 186
WIP, Lead Time and Service Level (Little’s Law) 189
Key Work Management System Relationships 191
Case Study: Smith’s Auto-Service Centre 193
A more comprehensive view of an organization 197
Key Lean Work Flow Principles 198
Prioritisation, Scheduling and Customer “Pull” 199
Work Leveling and “One Piece” Flow 199
What do we measure? 200
What influences productivity? 200
Urgent Work – The Crisis Management Trap 201
Telephone Calls and Shrinking Capacity 202
Rework and Shrinking Capacity 203
Implementation Issues 205 Succeeding at Operational Excellence 208
Lean Six Sigma Support Structure 209
Templates 213
viii
Additional Reading and References
Some useful reference books and materials:
Books
Six Sigma and Lean Specific:
• Pyzdek, Thomas (2003) The Six Sigma Handbook, McGraw Hill
• Gygi, Graig., DeCarlo, Neil., and William, Bruce (2005) Six Sigma for Dummies,
Wiley Publishing Inc.
• Gygi, Graig., DeCarlo, Neil., and William, Bruce (2005) Six Sigma for Dummies
Workbook, Wiley Publishing Inc.
• Liker, Jeffrey K. and Meier, David (2005) The Toyota Way, McGraw-Hill
• Liker, Jeffrey K. and Meier, David (2006) The Toyota Way Field Book, McGraw-
Hill
• Liker, Jeffrey K. and Franz, James K., (2011) The Toyota Way to Continuous
Improvement, McGraw-Hill
• DeCarlo, Neil (2007) A Complete Idiot’s Guide to Lean Six Sigma, Penguin Group
• George, Michael L., Rowlands, David., Prices, Max and Maxey, John (2005) The
Lean Six Sigma Pocket Tool Book, McGraw Hill
• Womack, James P., Jones, Daniel T. and Roos, Daniel (2007) The Machine That
Changed the World (2007 reprint of 1990 book), Free Press.
• Womack, James P. and Jones, Daniel T. (2003) Lean Thinking, Simon and
Schuster.
• Womack, James P. and Jones, Daniel T. (2005) Lean Consumption, Simon and
Schuster.
• Sayer, Natalie J. and Williams, Bruce (2007) Lean for Dummies, Wiley Publishing.
• Evans, James R. and Lindsay, William M. (2008) Managing for Quality and
Performance Excellence, Thomson Publishing.
• Breyfogle III, Forrest W., Implementing Six Sigma, John Wiley & Sons, Inc.
• Pande, Peter S., Neuman, Robert P. and Cavanaugh, Roland R. , The Six Sigma Way
• Pande, Peter S., Neuman, Robert P. and Cavanaugh, Roland R. , The Six Sigma Way
Team Fieldbook
• Gitlow, Howard S., Levine, David. And Popvich, Edward A. (2006) Design for Six
Sigma for Green Belts and Champions, Prentice Hall.
Statistics Specific
• Levine, David M., (2006) Statistics for Six Sigma Green Belts with Minitab and
JMP, Prentice Hall. Comes bundled with:
• Berenson, Mark L., Levine, David M., and Krehbeil, Timothy C. (2006) Basic
Business Statistics, Concepts and Application, Prentice Hall.
ix
Business Improvement and Team Work
• Pfeffer, Jeffrey and Sutton, Robert I. (2006) Hard Facts, Dangerous Half-Truths and
Total Nonsense, Harvard Business School Press.
• Harrington, J (1991) Business Process Improvement, McGraw Hill.
• Joiner, Brian (1996), The Team Handbook, 2nd
Edition, Straus Printing Company
• Scholtes, Peter R., The Leader’s Handbook.
• Goldratt, Eliyahu M. and Cox, Jeff. The Goal, Gower.
• Weisbord, Marvin. Productive Workplaces
• Evans, James R. and Lindsay, William M. (2008), Managing for Quality and
Performance Excellence, Thomson South-Western, 7th Edition
• Brown, Tim (2009), Change by Design, Harper Collins.
For Small Business
• Gerber, Michael E., (1995), The E-Myth Revisited, Harper Business. (Read this
first).
• Gerber, Michael E., (2005), E-Myth Mastery, Harper Business
Thinking and General Interest
• Meadows, Donella H. (2008), Thinking in Systems, Chelsea Green Publishing
• Senge, Peter M., (2006), The Fifth Discipline, Random House
• Gladwell, Malcolm (2000), The Tipping Point, Back Bay Books
• Gladwell, Malcolm (2005), Blink, Back Bay Books
• Gladwell, Malcolm (2008), Outliers, Allen Lane
• Taleb, Nicholas Nassim (2004), Fooled by Randomness, Penguin Books.
• Taleb, Nicholas Nassim (2007), The Black Swan, Penguin Books.
• Ferris, Timothy, (2007) The 4-Hour Work Week, Crown Publishers
.
Magazines:
• Quality Progress Magazine, published by ASQ (American Society for Quality)
• iSixSigma Magazine, published by iSixSigma
• Harvard Business Review (occasionally)
Web Sites
www.iSixSigma.com
Lean Advancedment Initiative (lean.mit.edu)
Lean Enterprise Institute (www.lean.org)
American Society for Quality (asq.org)
Henley Management Group Pty Ltd (www.hmg.com.au)

x
Personal Profile for Mr Max Zornada
Mr. Max Zornada B.E. (Mech), Hons. M.B.A.
Max is a Management Educator and Consultant with extensive
experience teaching MBA, Executive Education and Management
Development Seminars and as a hands-on practitioner, consulting to
major corporations on a range of Operational and Strategic issues,
throughout Australia, the US, Middle East, UK, Western Europe
and Asia, with a focus on achieving Business and Operational Excellence.
Max Zornada is an Adjunct Lecturer in the University of Adelaide,
Business where he currently teaches Operations Management and
Business Performance Improvement in the MBA Program. He has also taught Statistical and
Quantitative Analysis, Project Management, Quality Management, Managing Innovation and
Technology and e-Business.
He is a graduate of the University Innovation Fellows Program at the Stanford University
d.School and qualified to teach the d.School Design Thinking program.
He delivers various Executive Education Programs including the “Yellow Belt Advanced”
module in the Professional Management Program , the Lean Six Sigma Yellow Belt
Advanced Program, Green Belt and Black Belt Public Programs.
He has been a presenter in Australian Graduate School of Management’s (AGSM), University
of New South Wales, Executive MBA and Southern Cross University, College of
Management MBA Programs. Max was a Visiting Professor in the MBA program at
Consorzio MIP in the Politecnico di Milano in Milan.
Max is also the Director of the Australian based Management Consulting and Education firm
Henley Management Group. In this capacity he has presented many in-house Executive
Programs for major corporations on topics such as Six Sigma, Business Improvement, Lean
Thinking, The Balanced Scorecard, Project Management, and Maintenance Management,
both throughout Australia and internationally in Asia, the US, UK, Italy and the Middle East.
Prior to founding HMG, Max spent several years with the London based international
management and technology consultancy PA Consulting Group, after holding various
managerial and professional engineering positions in the chemicals processing and
petrochemicals industry with Adelaide and Wallaroo Fertilisers, ICI and Santos.
From his base in Adelaide, South Australia Max maintains an active local, Australian and
International consulting and Management Education practice, with a focus on capital
intensive (petrochemical, energy and chemicals) businesses, and back-office operations in
financial services and services organisations. In recent years, a major focus of his consulting
activity has been Lean Six Sigma and Process Improvement implementation in industries
spanning Financial Services, Business Process Outsourcing, Aerospace, Mining, IT and
Energy.
Contact Details
Max Zornada may be contacted at:
The University of Adelaide,
Business School Level 12, 10 Pultney Street,
Adelaide, 5005,
South Australia.
Tel: +61 8 83035525 Fax: +61 8 8223 4782.
Email: [email protected]
Henley Management Group Pty Ltd
Mob: +61 (0)412 500 844
Email: [email protected]

Introduction to Lean Six Sigma
1

2

The Box Simulation
3

4
Introduction to Lean Six Sigma
© Max Zornada Slide 1
Lean Six Sigma: Yellow Belt Advanced
An Introduction to Lean Six Sigma
© Max Zornada Slide 2
Lean Six Sigma: Yellow Belt Advanced
The Box Simulation
5

Introduction to Lean Six Sigma
© Max Zornada Slide 3
Lean Six Sigma: Yellow Belt Advanced
The Box Simulation - Results
Max =
Min =
Ave. =
Max =
Min =
Ave. =
Max =
Min =
Ave. =
© Max Zornada Slide 4
Lean Six Sigma: Yellow Belt Advanced
3 Operational Strategies
ObjectivePerformance
MeasureResultsstrategyGoalMission
Strategy
Execution/Operations
_____ ____________ _____
_____ ____________ _____
_____ ____________ _____
6

Introduction to Lean Six Sigma
© Max Zornada Slide 5
Lean Six Sigma: Yellow Belt Advanced
Structure
Teamwork + Structure
Teamwork
© Max Zornada Slide 6
Lean Six Sigma: Yellow Belt Advanced
Processes = Structure• Explicit Processes & Procedures
• IT Systems
• Organisation Structure
– Relative location of functional expertise with the
organisation;
– Relative location of authority – authorisation structure;
• Implicit processes – individual competence, “I know how
to do that”;
• Culture and norms – “the way we do things around here”.
7
Introduction to Lean Six Sigma
© Max Zornada Slide 7
Lean Six Sigma: Yellow Belt Advanced
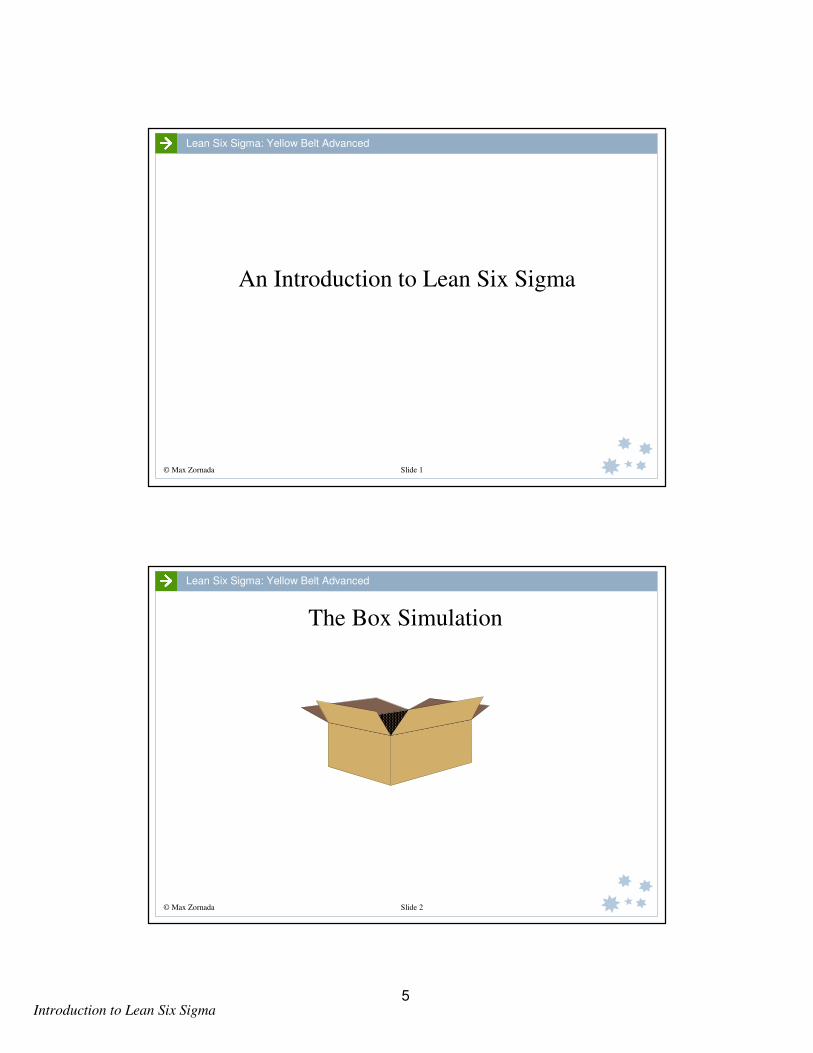
People, Teamwork and Processes
People and
Teamwork
+
Customer
Organisation’s
Productive
Outputs
Value
or ?
Processes
© Max Zornada Slide 8
Lean Six Sigma: Yellow Belt Advanced
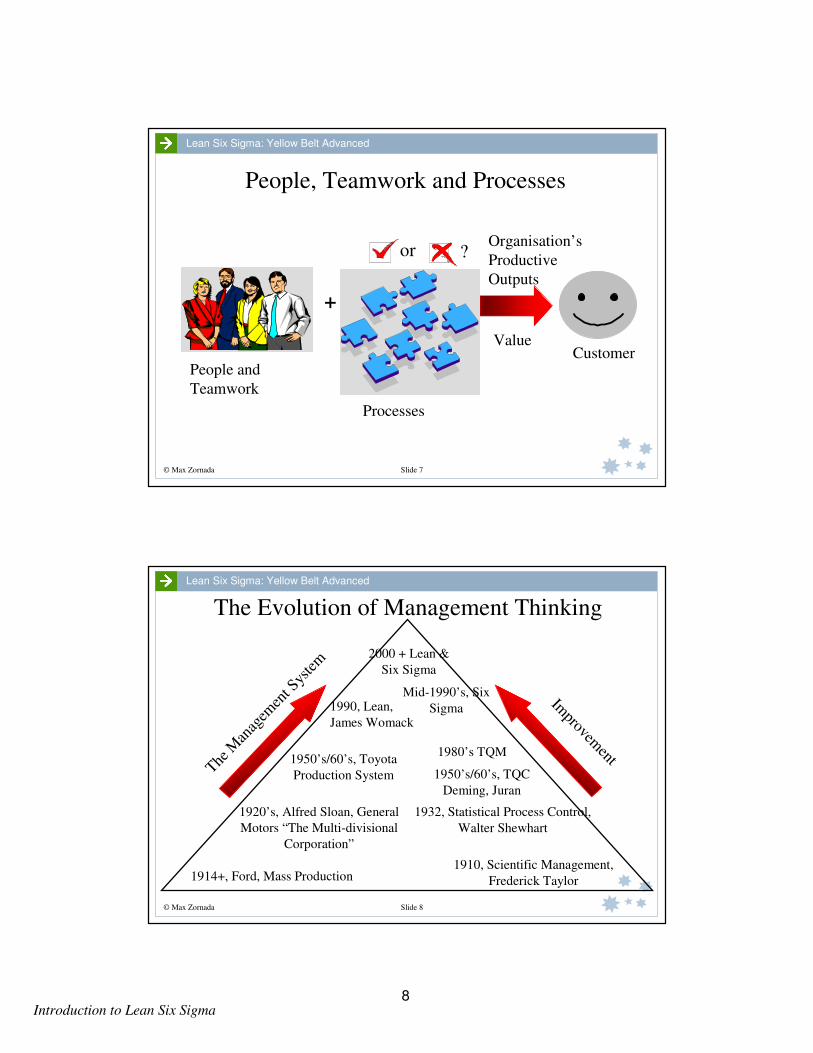
The Evolution of Management Thinking
1910, Scientific Management,
Frederick Taylor1914+, Ford, Mass Production
1932, Statistical Process Control,
Walter Shewhart
1950’s/60’s, Toyota
Production System 1950’s/60’s, TQC
Deming, Juran
1980’s TQM
1990, Lean,
James Womack
2000 + Lean &
Six Sigma
Improvem
entThe
Man
agem
ent S
yste
m
1920’s, Alfred Sloan, General
Motors “The Multi-divisional
Corporation”
Mid-1990’s, Six
Sigma
8

Introduction to Lean Six Sigma
© Max Zornada Slide 9
Lean Six Sigma: Yellow Belt Advanced
1910, Scientific Management,
Frederick Taylor
1990, Six
Sigma
1990, Lean
Thinking,
1920’s, Alfred Sloan, “The
Multi-divisional Corporation”
Managing Individual
Workers. Focus of
efficiency and control in
what individuals workers do.
Managing Organisational
Units (Divisions,
Departments, Work Groups)
Focus on efficiency and
control of organisational units.
Managing Processes Focus on
efficiency and control of
organisational and operational
processes.
Management Focus Management Practices Process thinking/management;
Team based (collaborative) decision
making, problem solving and
improvement;
Process Scorecards;
Cross-process collaboration.
Budgeting & Budgetary control;
Hierarchical organisational structure
(usually by function);
Leadership;
Effective management decision making
and problem solving.
Time & motion studies;
Standardised procedures;
Standard times & costs;
Financial incentives;
Supervisory control.
Three paradigm shifts
© Max Zornada Slide 10
Lean Six Sigma: Yellow Belt Advanced
1910, Scientific Management,
Frederick Taylor
1990, Six
Sigma
1990, Lean
Thinking,
1920’s, Alfred Sloan, “The
Multi-divisional Corporation”
Managing Individual
Workers. Focus of
efficiency and control in
what individuals workers do.
Managing Organisational
Units (Divisions,
Departments, Work Groups)
Focus on efficiency and
control of organisational units.
Managing Processes Focus on
efficiency and control of
organisational and operational
processes.
Management Focus Management Practices
Three paradigm shifts
Process Effectiveness/
Enterprise Effectiveness
Organisational Effectiveness
Individual Effectiveness
Process thinking/management;
Team based (collaborative) decision
making, problem solving and
improvement;
Process Scorecards;
Cross-process collaboration.
Budgeting & Budgetary control;
Hierarchical organisational structure
(usually by function);
Leadership;
Effective management decision making
and problem solving.
Time & motion studies;
Standardised procedures;
Standard times & costs;
Financial incentives;
Supervisory control.
9
Introduction to Lean Six Sigma
© Max Zornada Slide 11
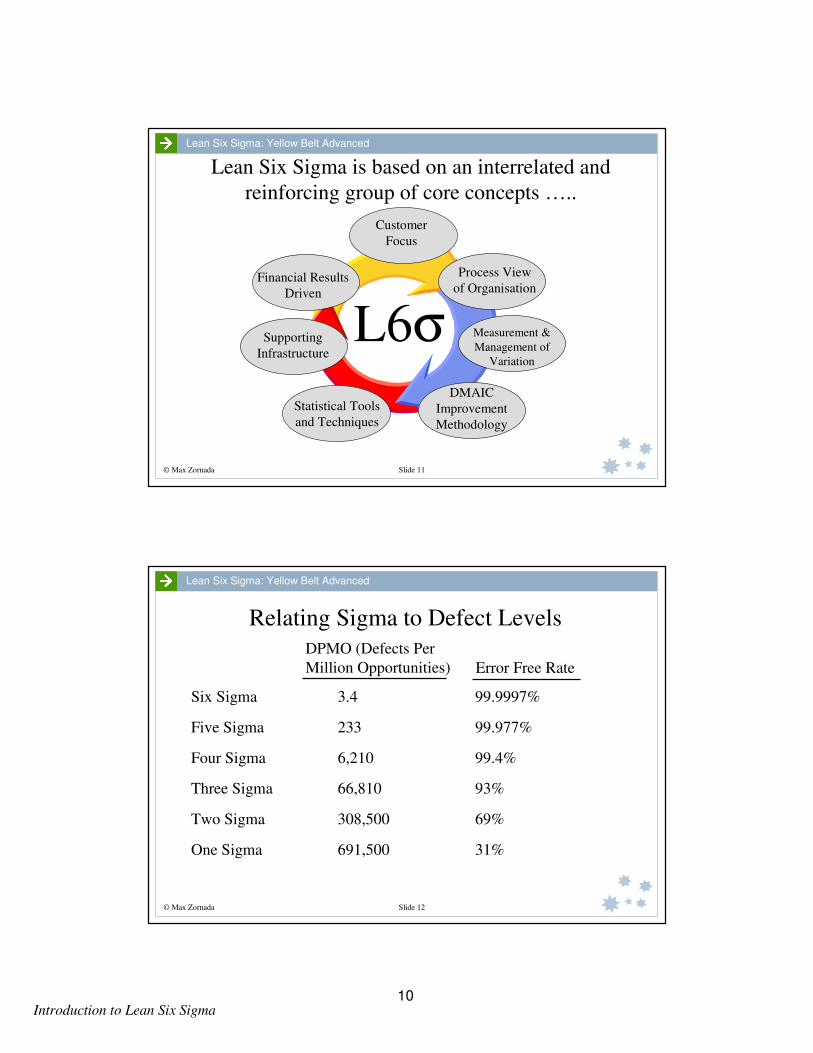
Lean Six Sigma: Yellow Belt Advanced
Lean Six Sigma is based on an interrelated and
reinforcing group of core concepts …..
L6σ
Process View
of Organisation
Measurement &
Management of
Variation
Customer
Focus
DMAIC
Improvement
Methodology
Statistical Tools
and Techniques
Supporting
Infrastructure
Financial Results
Driven
© Max Zornada Slide 12
Lean Six Sigma: Yellow Belt Advanced
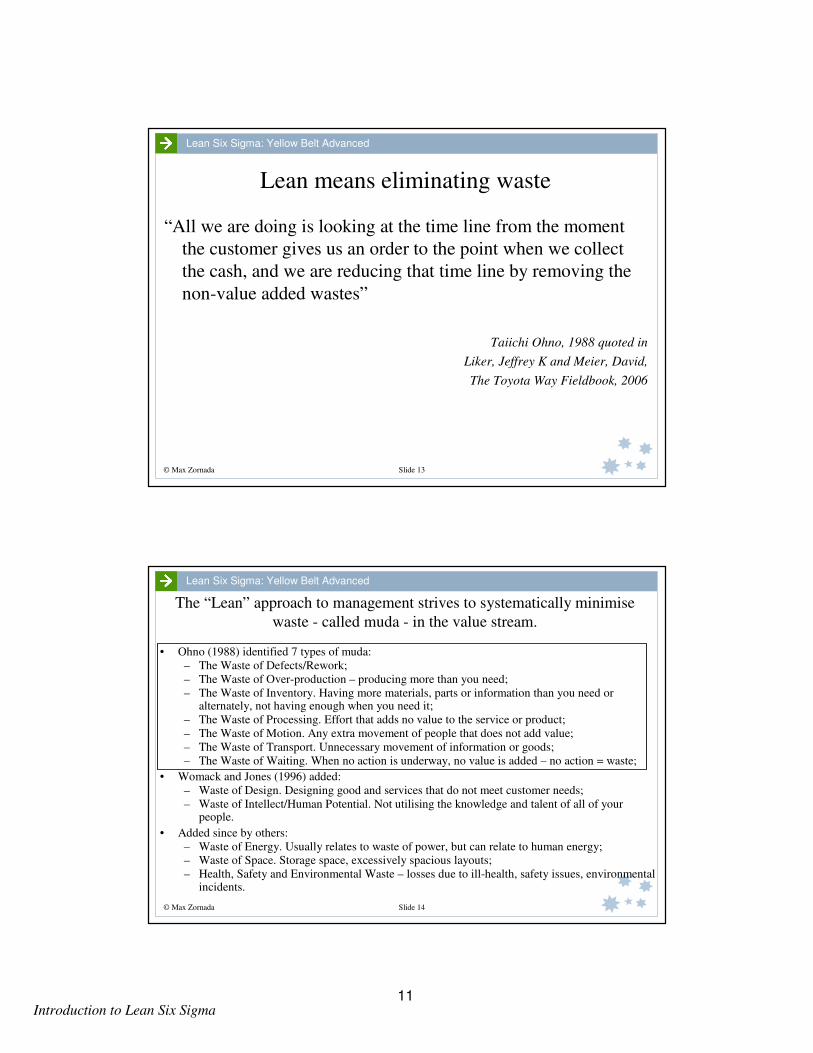
Relating Sigma to Defect Levels
Six Sigma 3.4 99.9997%
Five Sigma 233 99.977%
Four Sigma 6,210 99.4%
Three Sigma 66,810 93%
Two Sigma 308,500 69%
One Sigma 691,500 31%
DPMO (Defects Per
Million Opportunities) Error Free Rate
10
Introduction to Lean Six Sigma
© Max Zornada Slide 13
Lean Six Sigma: Yellow Belt Advanced
Lean means eliminating waste
“All we are doing is looking at the time line from the moment
the customer gives us an order to the point when we collect
the cash, and we are reducing that time line by removing the
non-value added wastes”
Taiichi Ohno, 1988 quoted in
Liker, Jeffrey K and Meier, David,
The Toyota Way Fieldbook, 2006
© Max Zornada Slide 14
Lean Six Sigma: Yellow Belt Advanced
The “Lean” approach to management strives to systematically minimise
waste - called muda - in the value stream.
• Ohno (1988) identified 7 types of muda:
– The Waste of Defects/Rework;
– The Waste of Over-production – producing more than you need;
– The Waste of Inventory. Having more materials, parts or information than you need or alternately, not having enough when you need it;
– The Waste of Processing. Effort that adds no value to the service or product;
– The Waste of Motion. Any extra movement of people that does not add value;
– The Waste of Transport. Unnecessary movement of information or goods;
– The Waste of Waiting. When no action is underway, no value is added – no action = waste;
• Womack and Jones (1996) added:
– Waste of Design. Designing good and services that do not meet customer needs;
– Waste of Intellect/Human Potential. Not utilising the knowledge and talent of all of your people.
• Added since by others:
– Waste of Energy. Usually relates to waste of power, but can relate to human energy;
– Waste of Space. Storage space, excessively spacious layouts;
– Health, Safety and Environmental Waste – losses due to ill-health, safety issues, environmental incidents.
11
Introduction to Lean Six Sigma
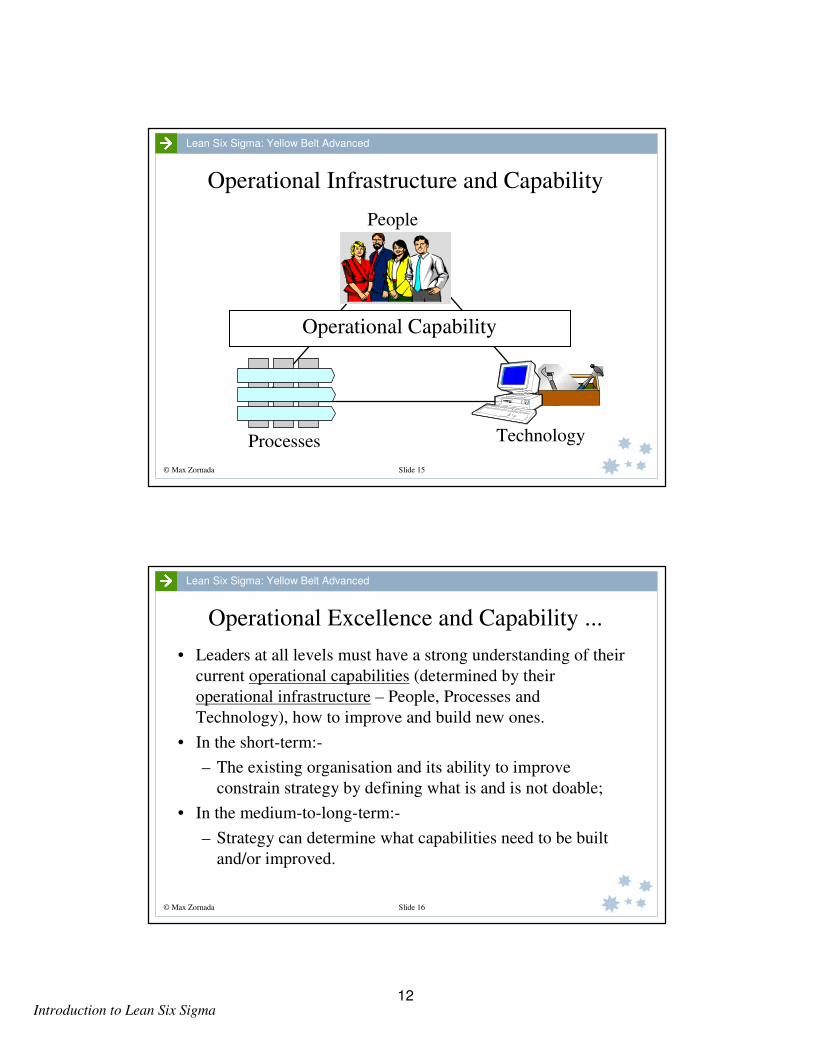
© Max Zornada Slide 15
Lean Six Sigma: Yellow Belt Advanced
Operational Infrastructure and Capability
Processes
People
Technology
Operational Capability
© Max Zornada Slide 16
Lean Six Sigma: Yellow Belt Advanced
Operational Excellence and Capability ...
• Leaders at all levels must have a strong understanding of their
current operational capabilities (determined by their
operational infrastructure – People, Processes and
Technology), how to improve and build new ones.
• In the short-term:-
– The existing organisation and its ability to improve
constrain strategy by defining what is and is not doable;
• In the medium-to-long-term:-
– Strategy can determine what capabilities need to be built
and/or improved.
12

Introduction to Lean Six Sigma
© Max Zornada Slide 17
Lean Six Sigma: Yellow Belt Advanced
Business Improvement
The (only) 3 Paths
Problem Solving Process Change Dynamic Balancing of
Process FlowsIdentify and Solve the
problems which stop
the process from
working as intended.
Change the Process,
implement a new
process design.
Maintain “balanced”
flows through out the
process to maximise
performance.
?
© Max Zornada Slide 18
Lean Six Sigma: Yellow Belt Advanced
Improving Organisations / Improving Operations
Problem Solving Process Change Balance and Flow
Underlying Assumption
Business or work process assumed to be
sound
Problems impacting of process impede its
ability to consistently function as
intended
Underlying Assumption
Business or work process not assumed
to be sound
Process operates as intended but fails
to meet customer requirements
Underlying Assumption
No particular assumption made about
business or work process soundness - work
with you’ve got.
Once you load a process with work you
create workflows and associated dynamic
effects which are independent of process
design and structure.
Lean
Kaizen/Root Cause Analysis Kaikaku/Value Stream Mapping Heijunka, Process Leveling
Six SigmaDMAIC DFSS/DMADV
Team Based Problem Solving Business Process Reengineering Process Flow Management
Generic
13

Introduction to Lean Six Sigma
© Max Zornada Slide 19
Lean Six Sigma: Yellow Belt Advanced
The Giants on whose shoulders we stand onW. Edwards Deming – The Theoretician
Quality is customer defined;
Reducing variation improves quality and reduces costs;
There are two types of variation, common cause and special cause variation, it is important to be able
to tell the difference;
We need statistical tools and techniques to understand and reduce variation and to solve problems.
Joseph Juran – The Strategist
Quality is conformance to specification and fitness for use;
Improvement can only be progressed project-by-project;
Improvement and improvement planning must be integrated into overall company strategic planning,
resourcing and budgeting processes.
The Cost-of-Quality provides an objective measure of improvement.
Philip Crosby – The Salesman
Quality is conformance to specification;
Zero Defects is the aim and Quality is Free – the cost of improving quality is less than the cost
of living with the impact of poor quality.
The Cost-of-Quality provides an objective measure of improvement.
Taiichi Ohno – The Philosopher The Toyota Production System – “Lean”
Waste – Flow - Time
Continuous Improvement culture – improvement is EVERYBODY’S
responsibility
Lean Philosophy
14

Process Thinking
15

16

Process Thinking
Case Study
Hi-Tech Leasing Corporation
17

Hi-Tech Leasing Corporation
Case Study OMHTLC/1.1∗
Hi-Tech Leasing
Corporation (A)
John Briggs is the General Manager of Hi-Tech Leasing Corporation
(HTLC), an organisation that leases scientific equipment, ranging from
simple personal computers to high-tech laboratory and field test equipment.
One of his sales representatives, Jane, who had been with the company
almost six months, had recently complained to him about how long it was
taking to fill the various orders for leased equipment. Despite the fact that
the company's promotional material stated that all orders would be delivered
within 7 to 10 days, Jane had highlighted the fact that several recent orders
from major customers had taken over 21 days before the equipment was
finally delivered and installed.
John wondered whether or not there was some thing wrong with the basic
process, or if it was just Jane's lack of familiarity with the "system" that had
caused these delays.
John decided to take a look at the "system" and considered the various steps
that were gone through when an order for equipment lease was filled. He
identified the steps in the process as follows:
1. A customer decides to lease some equipment supplied by HTLC,
telephones a Sales Representative, and tells them what they require over
the telephone. This is then confirmed by fax.
2. If the Sales Representative is not available to take the call, the customer
will call back later as most products require some discussion with a Sales
Rep. before an order can be placed.
3. The Sales Rep. receives the fax, checks it and passes it on to a Sales
Clerk who types up an official order.
4. The order is then passed on to a Data Entry Clerk who types the order
details onto the computer system.
∗
This case was prepared by Max Zornada. Copyright © Henley Management Group Pty Ltd, 2010
18
Hi-Tech Leasing Corporation
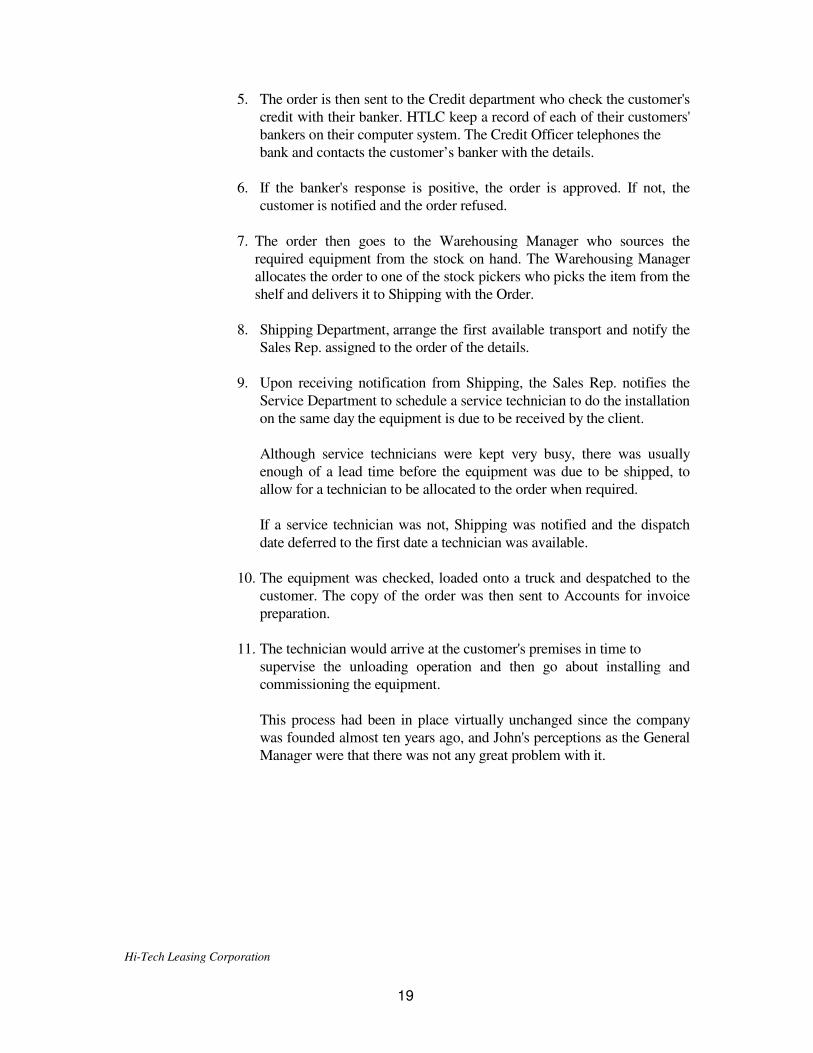
5. The order is then sent to the Credit department who check the customer's
credit with their banker. HTLC keep a record of each of their customers'
bankers on their computer system. The Credit Officer telephones the
bank and contacts the customer’s banker with the details.
6. If the banker's response is positive, the order is approved. If not, the
customer is notified and the order refused.
7. The order then goes to the Warehousing Manager who sources the
required equipment from the stock on hand. The Warehousing Manager
allocates the order to one of the stock pickers who picks the item from the
shelf and delivers it to Shipping with the Order.
8. Shipping Department, arrange the first available transport and notify the
Sales Rep. assigned to the order of the details.
9. Upon receiving notification from Shipping, the Sales Rep. notifies the
Service Department to schedule a service technician to do the installation
on the same day the equipment is due to be received by the client.
Although service technicians were kept very busy, there was usually
enough of a lead time before the equipment was due to be shipped, to
allow for a technician to be allocated to the order when required.
If a service technician was not, Shipping was notified and the dispatch
date deferred to the first date a technician was available.
10. The equipment was checked, loaded onto a truck and despatched to the
customer. The copy of the order was then sent to Accounts for invoice
preparation.
11. The technician would arrive at the customer's premises in time to
supervise the unloading operation and then go about installing and
commissioning the equipment.
This process had been in place virtually unchanged since the company
was founded almost ten years ago, and John's perceptions as the General
Manager were that there was not any great problem with it.
19
Hi-Tech Leasing Corporation
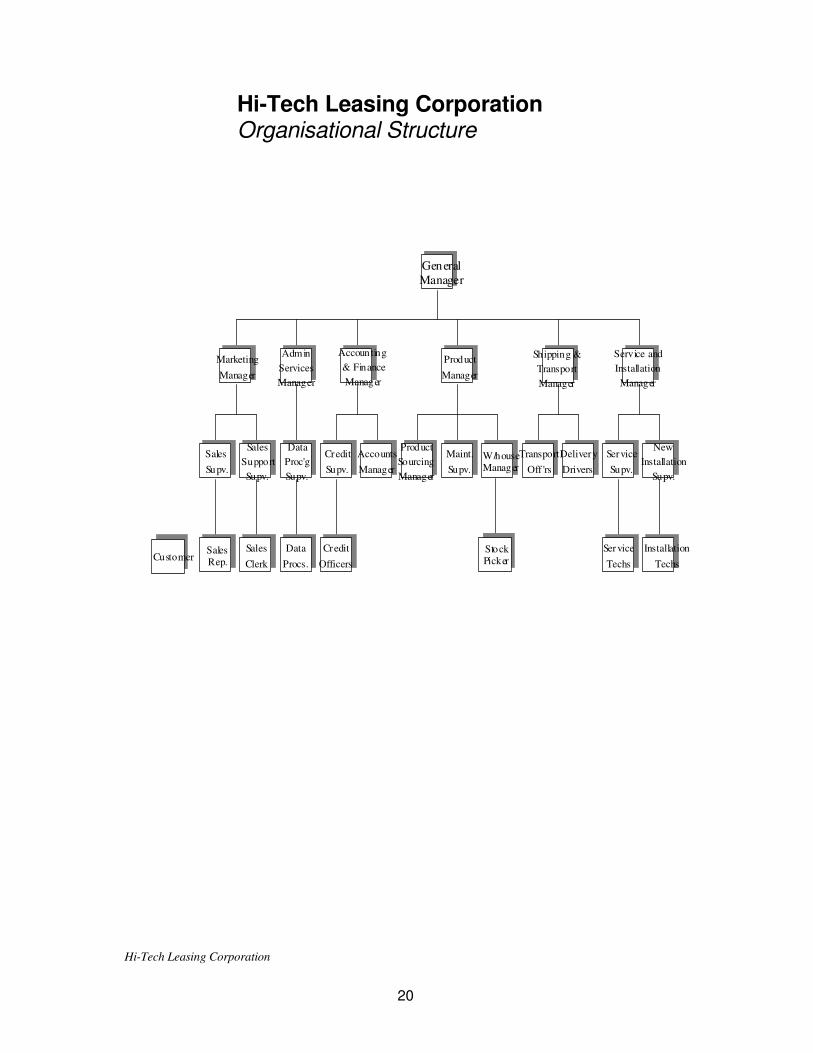
Hi-Tech Leasing Corporation Organisational Structure
General
Manager
Marketing
Manager
Sales
Supv.
Sales Rep.
Sales
Support
Supv.
Sales
Clerk
Admin
Services
Manager
Data
Proc'g
Supv.
Data
Procs.
Accounting
& Finance
Manager
Credit
Supv.
Credit
Officers
Accounts
Manager
Product
Manager
Product
Sourcing
Manager
Maint.
Supv.
W/house Manager
Shipping &
Transport
Manager
Transport
Off 'rs
Delivery
Drivers
Service and
Installation
Manager
Service
Supv.
Service
Techs
New
Installation
Supv.
Installation
TechsCustomer
Stock Picker
20

Process Thinking
© Max Zornada Slide 4
Lean Six Sigma: Yellow Belt AdvancedLean Six Sigma: Yellow Belt Advanced
Process Thinking
Understanding Business and Work Processes
© Max Zornada Slide 5
Lean Six Sigma: Yellow Belt AdvancedLean Six Sigma: Yellow Belt Advanced
Process Thinking
Hi- Tech Leasing Corporation
Case Study
21
Process Thinking
© Max Zornada Slide 6
Lean Six Sigma: Yellow Belt AdvancedLean Six Sigma: Yellow Belt Advanced
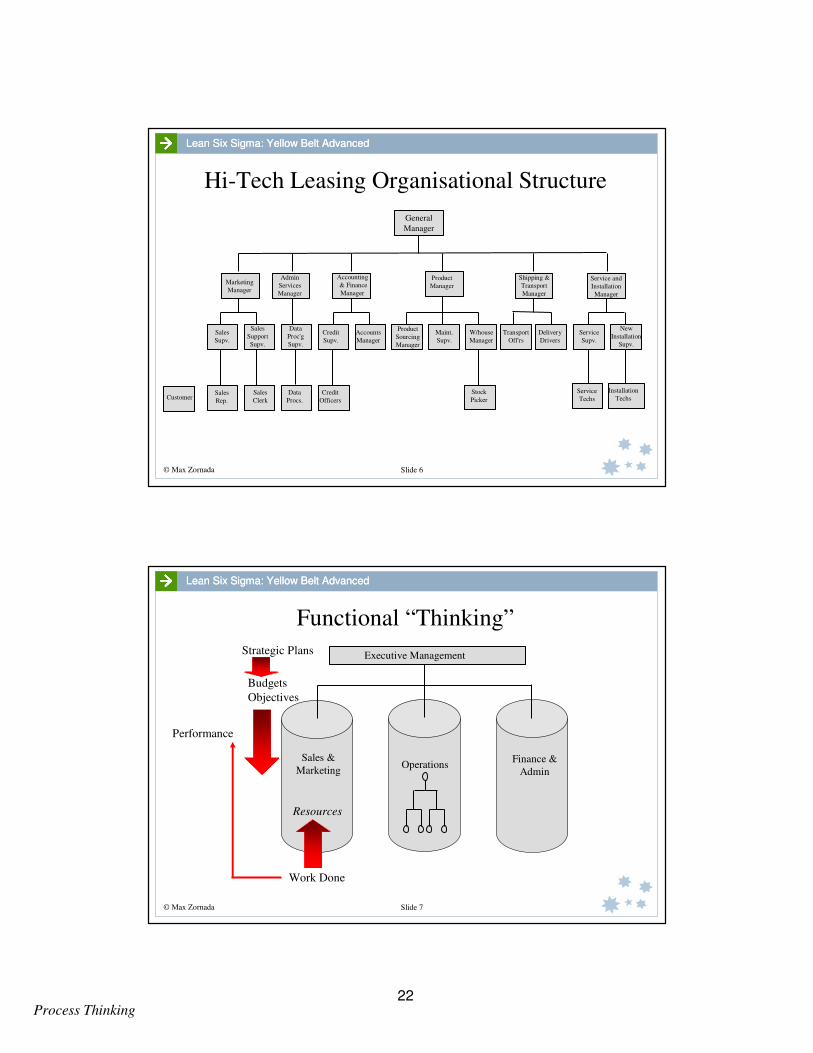
Hi-Tech Leasing Organisational Structure
General
Manager
Sales
Supv.
Sales
Support
Supv.
Data
Proc'g
Supv.
Accounts
Manager
Product
Sourcing
Manager
Maint.
Supv.
W/house
Manager
Transport
Off'rs
Delivery
Drivers
Service
Supv.
New
Installation
Supv.
Credit
Supv.
Sales
Rep.
Sales
Clerk
Data
Procs.
Credit
Officers
Service
Techs
Installation
TechsCustomerStock
Picker
Admin
Services
Manager
Accounting
& Finance
Manager
Product
Manager
Shipping &
Transport
Manager
Service and
Installation
Manager
Marketing
Manager
© Max Zornada Slide 7
Lean Six Sigma: Yellow Belt AdvancedLean Six Sigma: Yellow Belt Advanced
Functional “Thinking”
Executive Management
Sales &
MarketingOperations
Finance &
Admin
Strategic Plans
Budgets
Objectives
Work Done
Resources
Performance
22
Process Thinking
© Max Zornada Slide 8
Lean Six Sigma: Yellow Belt AdvancedLean Six Sigma: Yellow Belt Advanced
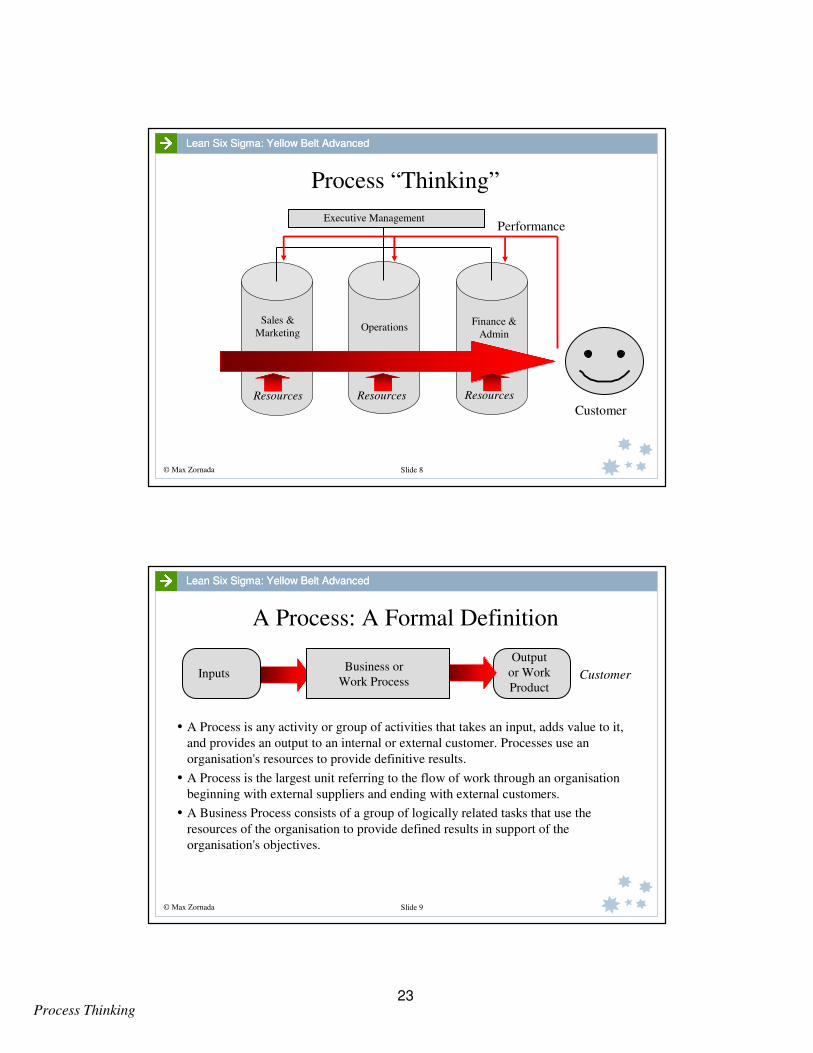
Process “Thinking”
Executive Management
Sales &
MarketingOperations
Finance &
Admin
Customer
Resources Resources Resources
Performance
© Max Zornada Slide 9
Lean Six Sigma: Yellow Belt AdvancedLean Six Sigma: Yellow Belt Advanced
A Process: A Formal Definition
InputsBusiness or
Work ProcessCustomer
• A Process is any activity or group of activities that takes an input, adds value to it,
and provides an output to an internal or external customer. Processes use an
organisation's resources to provide definitive results.
• A Process is the largest unit referring to the flow of work through an organisation
beginning with external suppliers and ending with external customers.
• A Business Process consists of a group of logically related tasks that use the
resources of the organisation to provide defined results in support of the
organisation's objectives.
Output
or Work
Product
23

Process Thinking
© Max Zornada Slide 10
Lean Six Sigma: Yellow Belt AdvancedLean Six Sigma: Yellow Belt Advanced
The Cost - Service Trade-offThe Legacy of Functional Thinking
Costs Resources Service
Increase Service
Reduce Costs Vary Resources
© Max Zornada Slide 11
Lean Six Sigma: Yellow Belt AdvancedLean Six Sigma: Yellow Belt Advanced
Increase Service while Reducing CostsThe Power of Process Thinking
Costs Resources Service
Increase Service
Reduce Costs
Leverage
Resources
24

Process Thinking
© Max Zornada Slide 12
Lean Six Sigma: Yellow Belt AdvancedLean Six Sigma: Yellow Belt Advanced
Process “Thinking” & Process ManagementHorizontal Management Processes
Executive Management
Processes
Value creation
Delivery/Service
Quality
Customer satisfaction
Efficiency
Waste Reduction
Speed
Improvement
Organisational Functional Groupings
© Max Zornada Slide 13
Lean Six Sigma: Yellow Belt AdvancedLean Six Sigma: Yellow Belt Advanced
Processes deployed through the organisational structure
Responsibility for
major end-to-end
processes
Responsibility for
major sub-processes
Responsibility for
work processes/ sub-
processes
WorkgroupWorkgroup Workgroup Workgroup Workgroup
Senior Manager
ManagerManager
25
Process Thinking
© Max Zornada Slide 14
Lean Six Sigma: Yellow Belt AdvancedLean Six Sigma: Yellow Belt Advanced
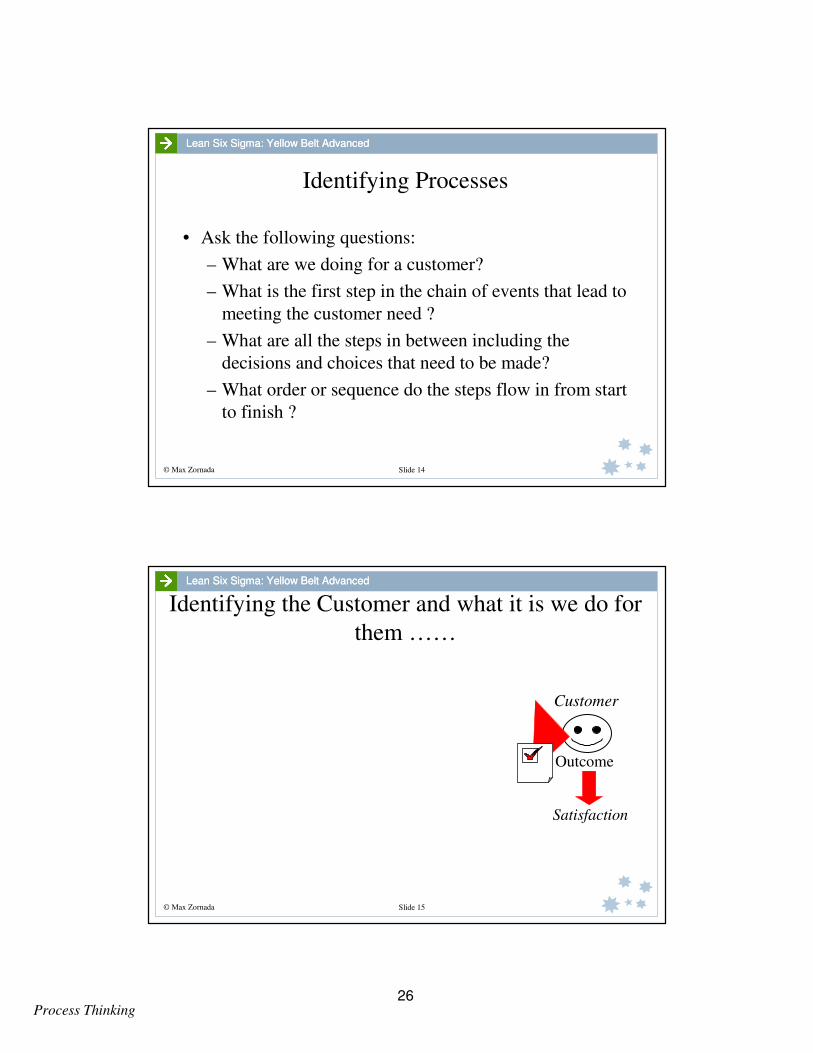
Identifying Processes
• Ask the following questions:
– What are we doing for a customer?
– What is the first step in the chain of events that lead to
meeting the customer need ?
– What are all the steps in between including the
decisions and choices that need to be made?
– What order or sequence do the steps flow in from start
to finish ?
© Max Zornada Slide 15
Lean Six Sigma: Yellow Belt AdvancedLean Six Sigma: Yellow Belt Advanced
Identifying the Customer and what it is we do for
them ……
Customer
Outcome
Satisfaction
26
Process Thinking
© Max Zornada Slide 16
Lean Six Sigma: Yellow Belt AdvancedLean Six Sigma: Yellow Belt Advanced
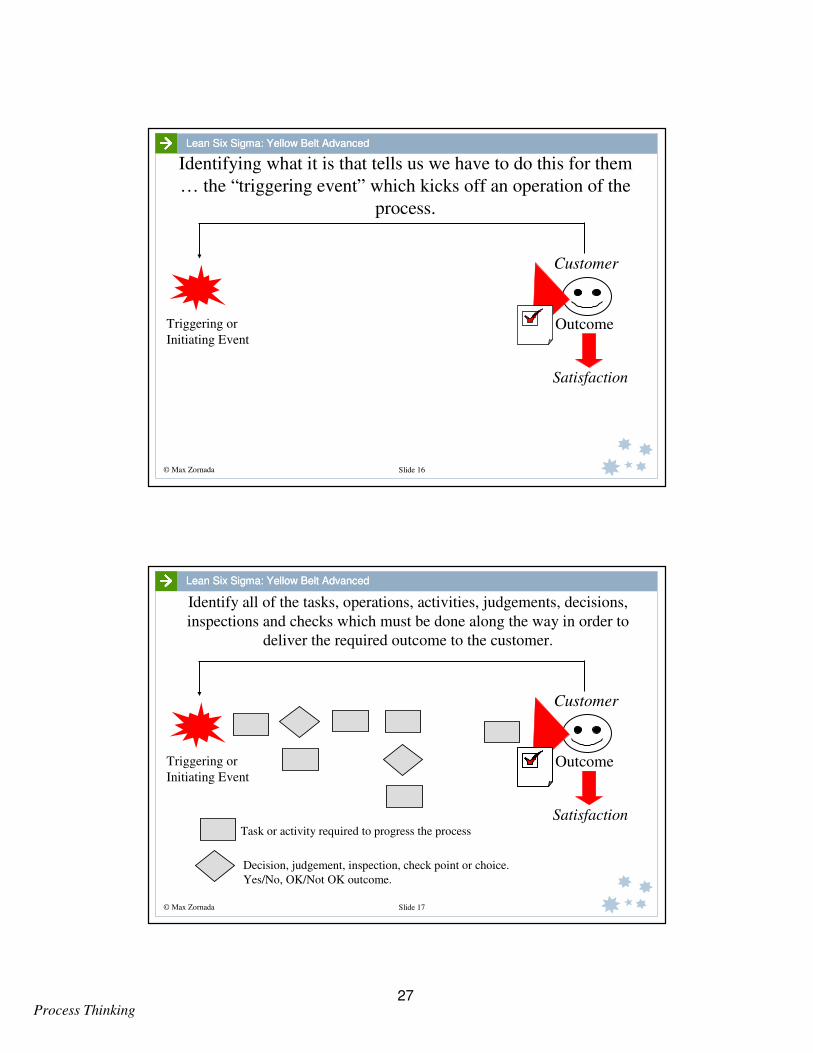
Identifying what it is that tells us we have to do this for them
… the “triggering event” which kicks off an operation of the
process.
Triggering or
Initiating Event
Customer
Outcome
Satisfaction
© Max Zornada Slide 17
Lean Six Sigma: Yellow Belt AdvancedLean Six Sigma: Yellow Belt Advanced
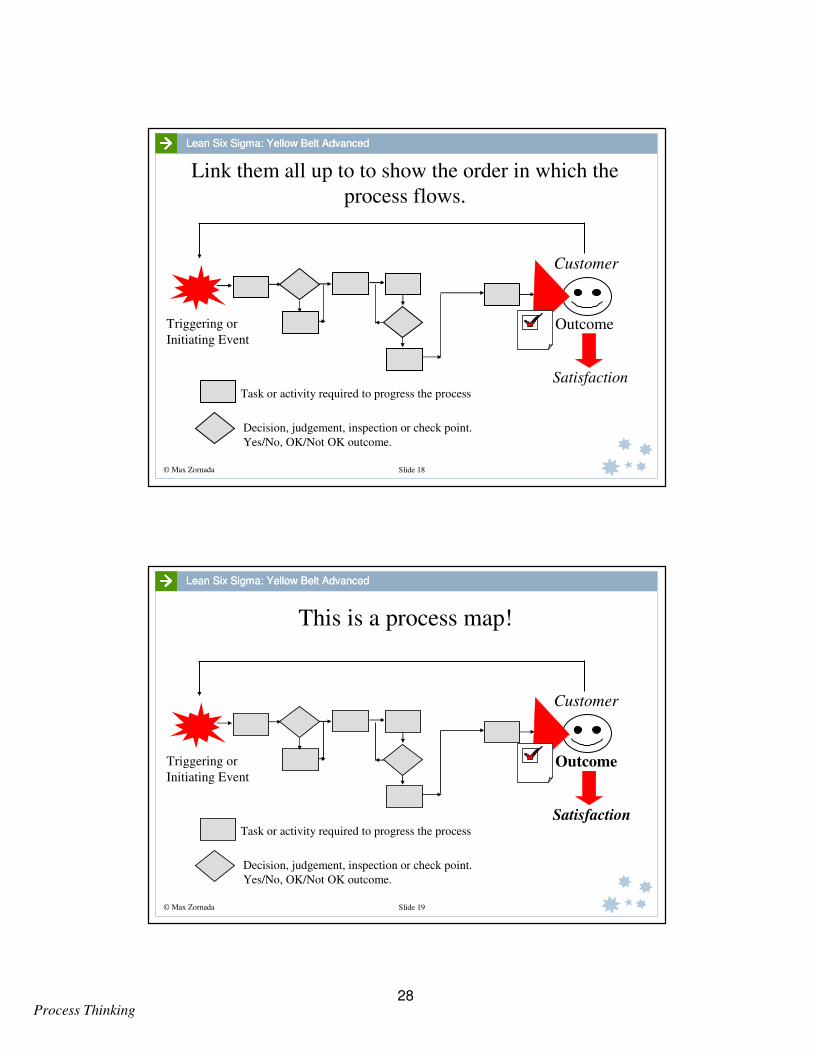
Identify all of the tasks, operations, activities, judgements, decisions,
inspections and checks which must be done along the way in order to
deliver the required outcome to the customer.
Customer
Outcome
SatisfactionTask or activity required to progress the process
Decision, judgement, inspection, check point or choice.
Yes/No, OK/Not OK outcome.
Triggering or
Initiating Event
27
Process Thinking
© Max Zornada Slide 18
Lean Six Sigma: Yellow Belt AdvancedLean Six Sigma: Yellow Belt Advanced
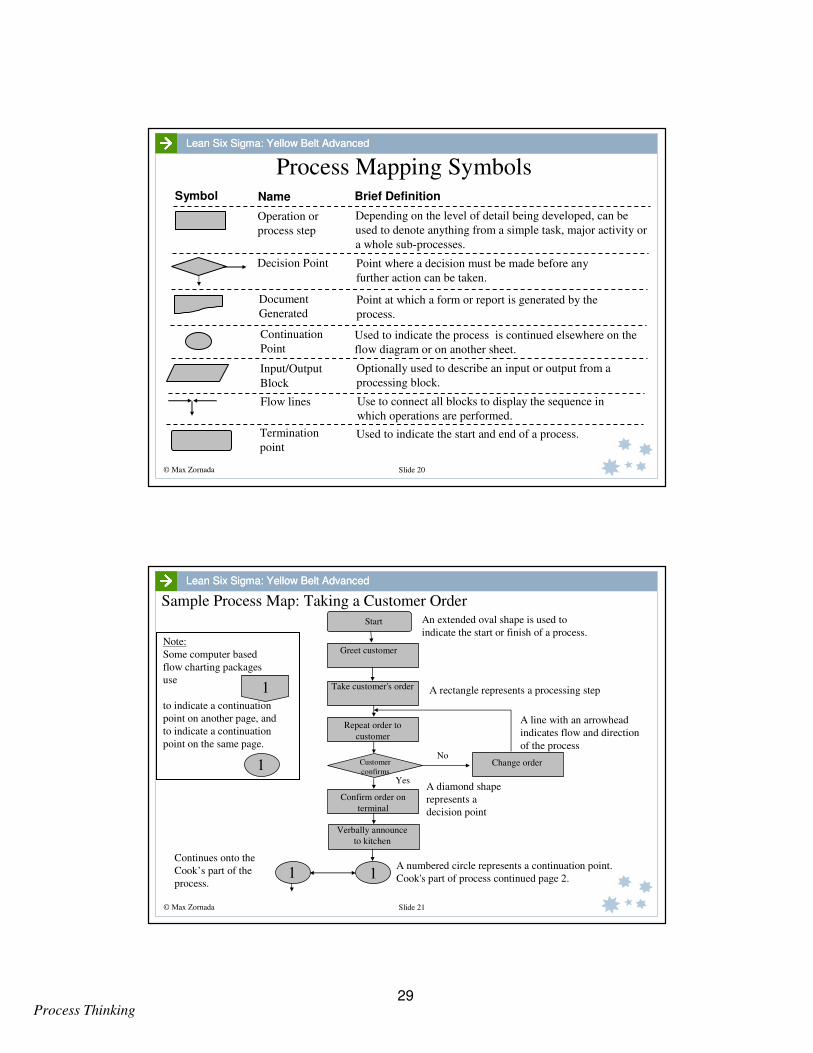
Link them all up to to show the order in which the
process flows.
Customer
Outcome
SatisfactionTask or activity required to progress the process
Decision, judgement, inspection or check point.
Yes/No, OK/Not OK outcome.
Triggering or
Initiating Event
© Max Zornada Slide 19
Lean Six Sigma: Yellow Belt AdvancedLean Six Sigma: Yellow Belt Advanced
This is a process map!
Customer
Outcome
SatisfactionTask or activity required to progress the process
Decision, judgement, inspection or check point.
Yes/No, OK/Not OK outcome.
Triggering or
Initiating Event
28
Process Thinking
© Max Zornada Slide 20
Lean Six Sigma: Yellow Belt AdvancedLean Six Sigma: Yellow Belt Advanced
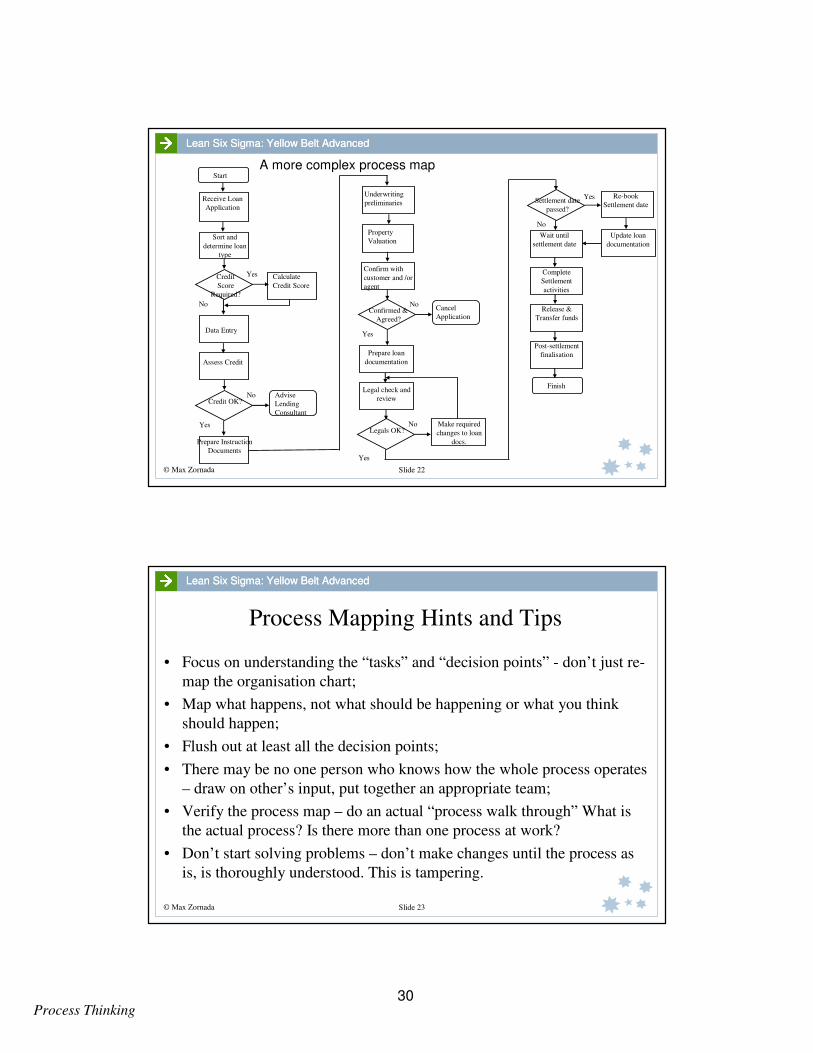
Process Mapping SymbolsSymbol Name Brief Definition
Operation or
process step
Decision Point
Document
Generated
Continuation
Point
Input/Output
Block
Flow lines
Depending on the level of detail being developed, can be
used to denote anything from a simple task, major activity or
a whole sub-processes.
Used to indicate the process is continued elsewhere on the
flow diagram or on another sheet.
Point at which a form or report is generated by the
process.
Point where a decision must be made before any
further action can be taken.
Optionally used to describe an input or output from a
processing block.
Use to connect all blocks to display the sequence in
which operations are performed.
Termination
pointUsed to indicate the start and end of a process.
© Max Zornada Slide 21
Lean Six Sigma: Yellow Belt AdvancedLean Six Sigma: Yellow Belt Advanced
Sample Process Map: Taking a Customer Order
A diamond shape
represents a
decision point
Continues onto the
Cook’s part of the
process.
1
1
Start
Change order
Yes
No
An extended oval shape is used to
indicate the start or finish of a process.
A numbered circle represents a continuation point.
Cook's part of process continued page 2.1
A rectangle represents a processing step
A line with an arrowhead
indicates flow and direction
of the process
1
Greet customer
Take customer's order
Repeat order to
customer
Customer
confirms
Confirm order on
terminal
Verbally announce
to kitchen
Note:
Some computer based
flow charting packages
use
to indicate a continuation
point on another page, and
to indicate a continuation
point on the same page.
29
Process Thinking
© Max Zornada Slide 22
Lean Six Sigma: Yellow Belt AdvancedLean Six Sigma: Yellow Belt Advanced
Sort and
determine loan
type
Calculate
Credit Score
Credit
Score
Required?
Data Entry
Yes
No
Assess Credit
Credit OK?
Prepare Instruction
Documents
No
Yes
Advise
Lending
Consultant
Receive Loan
Application
Start
Prepare loan
documentation
No
Yes
Cancel
ApplicationConfirmed &
Agreed?
Confirm with
customer and /or
agent
Underwriting
preliminaries
Property
Valuation
Legal check and
review
NoLegals OK?
Make required
changes to loan
docs.
Yes
Wait until
settlement date
Complete
Settlement
activities
Settlement date
passed?
Release &
Transfer funds
Post-settlement
finalisation
Finish
Re-book
Settlement date
Update loan
documentation
Yes
No
A more complex process map
© Max Zornada Slide 23
Lean Six Sigma: Yellow Belt AdvancedLean Six Sigma: Yellow Belt Advanced
Process Mapping Hints and Tips
• Focus on understanding the “tasks” and “decision points” - don’t just re-
map the organisation chart;
• Map what happens, not what should be happening or what you think
should happen;
• Flush out at least all the decision points;
• There may be no one person who knows how the whole process operates
– draw on other’s input, put together an appropriate team;
• Verify the process map – do an actual “process walk through” What is
the actual process? Is there more than one process at work?
• Don’t start solving problems – don’t make changes until the process as
is, is thoroughly understood. This is tampering.
30

Process Thinking
© Max Zornada Slide 24
Lean Six Sigma: Yellow Belt AdvancedLean Six Sigma: Yellow Belt Advanced
Process Definition WorksheetObjective : To specifically define the scope of the process being studied
Process Name:
The Process Starts with:
The Process Ends with:
The Process includes:
The Process excludes:
Connecting Process:
© Max Zornada Slide 25
Lean Six Sigma: Yellow Belt AdvancedLean Six Sigma: Yellow Belt Advanced
The SIPOC ModelSuppliers - Inputs - Process - Outputs - Customers
Suppliers CustomerBusiness
or Work
Process
Inputs Outputs
Supplier 1
Supplier 2
Supplier 3
Input 1
Input 2
Input 3
Process Step 1
Process Step 2
Process Step 3
Process Step 4
Process Step ...
...............
Output 1
Output 2
Output 3
Customer 1
Customer 2
Customer 3
RequirementsRequirements
MeasuresMeasuresMeasures
31
Process Thinking
© Max Zornada Slide 26
Lean Six Sigma: Yellow Belt AdvancedLean Six Sigma: Yellow Belt Advanced
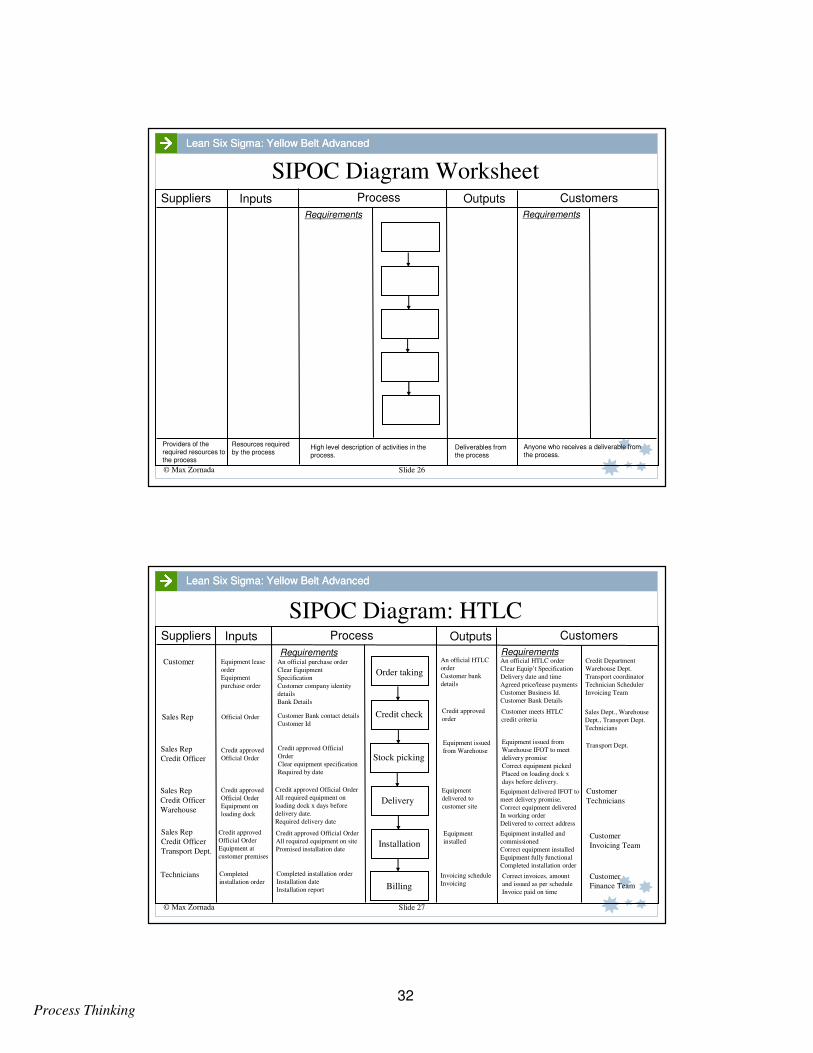
SIPOC Diagram WorksheetSuppliers Inputs
Requirements
Process Outputs Customers
Requirements
Providers of the required resources to the process
Resources required by the process
High level description of activities in the process.
Deliverables from the process
Anyone who receives a deliverable from the process.
© Max Zornada Slide 27
Lean Six Sigma: Yellow Belt AdvancedLean Six Sigma: Yellow Belt Advanced
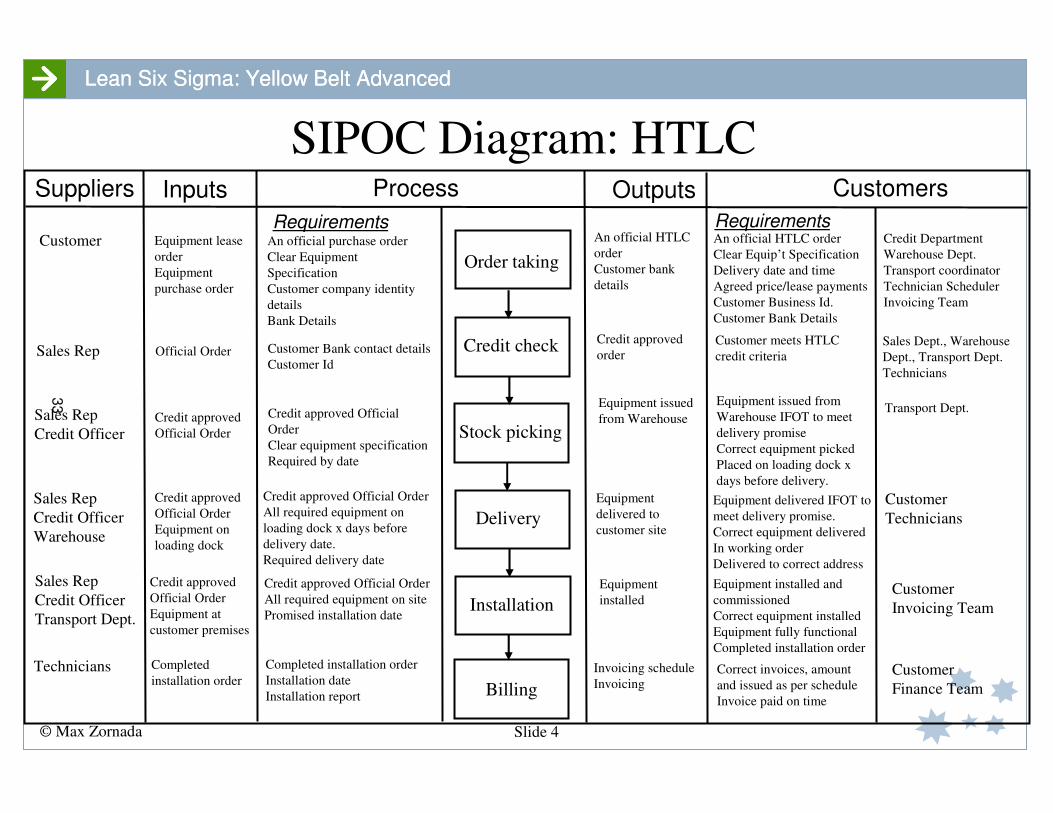
SIPOC Diagram: HTLCSuppliers Inputs
Requirements
Process Outputs Customers
Requirements
Order taking
Credit check
Stock picking
Delivery
Installation
Billing
Customer Equipment lease
order
Equipment
purchase order
An official purchase order
Clear Equipment
Specification
Customer company identity
details
Bank Details
An official HTLC
order
Customer bank
details
An official HTLC order
Clear Equip’t Specification
Delivery date and time
Agreed price/lease payments
Customer Business Id.
Customer Bank Details
Credit Department
Warehouse Dept.
Transport coordinator
Technician Scheduler
Invoicing Team
Sales Rep Official Order Customer Bank contact details
Customer Id
Credit approved
orderCustomer meets HTLC
credit criteriaSales Dept., Warehouse
Dept., Transport Dept.
Technicians
Sales Rep
Credit OfficerCredit approved
Official Order
Credit approved Official
Order
Clear equipment specification
Required by date
Equipment issued
from Warehouse
Equipment issued from
Warehouse IFOT to meet
delivery promise
Correct equipment picked
Placed on loading dock x
days before delivery.
Transport Dept.
Sales Rep
Credit Officer
Warehouse
Credit approved
Official Order
Equipment on
loading dock
Credit approved Official Order
All required equipment on
loading dock x days before
delivery date.
Required delivery date
Equipment
delivered to
customer site
Equipment delivered IFOT to
meet delivery promise.
Correct equipment delivered
In working order
Delivered to correct address
Customer
Technicians
Sales Rep
Credit Officer
Transport Dept.
Credit approved
Official Order
Equipment at
customer premises
Credit approved Official Order
All required equipment on site
Promised installation date
Equipment
installed
Equipment installed and
commissioned
Correct equipment installed
Equipment fully functional
Completed installation order
Customer
Invoicing Team
Technicians Completed
installation order
Completed installation order
Installation date
Installation report
Invoicing schedule
InvoicingCorrect invoices, amount
and issued as per schedule
Invoice paid on time
Customer
Finance Team
32
© Max Zornada Slide 4
Lean Six Sigma: Yellow Belt AdvancedLean Six Sigma: Yellow Belt Advanced
SIPOC Diagram: HTLCSuppliers Inputs
Requirements
Process Outputs Customers
Requirements
Order taking
Credit check
Stock picking
Delivery
Installation
Billing
Customer Equipment lease
order
Equipment
purchase order
An official purchase order
Clear Equipment
Specification
Customer company identity
details
Bank Details
An official HTLC
order
Customer bank
details
An official HTLC order
Clear Equip’t Specification
Delivery date and time
Agreed price/lease payments
Customer Business Id.
Customer Bank Details
Credit Department
Warehouse Dept.
Transport coordinator
Technician Scheduler
Invoicing Team
Sales Rep Official Order Customer Bank contact details
Customer Id
Credit approved
orderCustomer meets HTLC
credit criteria
Sales Dept., Warehouse
Dept., Transport Dept.
Technicians
Sales Rep
Credit OfficerCredit approved
Official Order
Credit approved Official
Order
Clear equipment specification
Required by date
Equipment issued
from Warehouse
Equipment issued from
Warehouse IFOT to meet
delivery promise
Correct equipment picked
Placed on loading dock x
days before delivery.
Transport Dept.
Sales Rep
Credit Officer
Warehouse
Credit approved
Official Order
Equipment on
loading dock
Credit approved Official Order
All required equipment on
loading dock x days before
delivery date.
Required delivery date
Equipment
delivered to
customer site
Equipment delivered IFOT to
meet delivery promise.
Correct equipment delivered
In working order
Delivered to correct address
Customer
Technicians
Sales Rep
Credit Officer
Transport Dept.
Credit approved
Official Order
Equipment at
customer premises
Credit approved Official Order
All required equipment on site
Promised installation date
Equipment
installed
Equipment installed and
commissioned
Correct equipment installed
Equipment fully functional
Completed installation order
Customer
Invoicing Team
Technicians Completed
installation order
Completed installation order
Installation date
Installation report
Invoicing schedule
InvoicingCorrect invoices, amount
and issued as per schedule
Invoice paid on time
Customer
Finance Team
33
© Max Zornada Slide 5
Lean Six Sigma: Yellow Belt AdvancedLean Six Sigma: Yellow Belt Advanced
34
Deconstructing Cost Structure
The Cost of Quality
35
Financial Services Group
Case Study - Part (A)
Financial Services Group (FSG) are a global financial
services organisation, providing back office processing and
customer support services on an outsource basis to leading
investment and funds management companies.
Their key sources of competitive advantage are low
processing costs per transaction and high levels of customer service and support.
The business consists of 3 "functional" silos - Corporate, Operations and Customer
Support reporting through to an overall CEO.
The current cost structure (annualised) is illustrated in Table 1 below.
Corporate
Policy/Procedures Group $450,000 20%
Training and Development $450,000 20%Finance & Accounting $562,500 25%
General Admin $787,500 35%Total Corporate $2,250,000 15%
Operations
Document Receipt $1,950,000 20%Processing Team $4,875,000 50%
Communications Team $2,925,000 30%Total Operations $9,750,000 65%
Customer Support
Customer Support $2,400,000 80%
Problem Resolution Team $600,000 20%Total Customer Support $3,000,000 20%
Total Costs $15,000,000
Challenge
FSG's Revenues for the next year are effectively fixed and determined by existing
contracts. Therefore, increasing profit through revenue increases is not an option.
The remaining option is to reduce costs.
Examine the cost structure above and identify any opportunities to improve
profitability through cost reduction.
Note: It is essential that operating capacity and service levels be maintained. FSG's
revenues are performance based and rely on achievement of contractually specified
service levels.
How easy (or difficult) is it to identify opportunities that meet the above objectives?
36
The Cost of Quality
© Max Zornada Slide 1
Lean Six Sigma: Yellow Belt Advanced
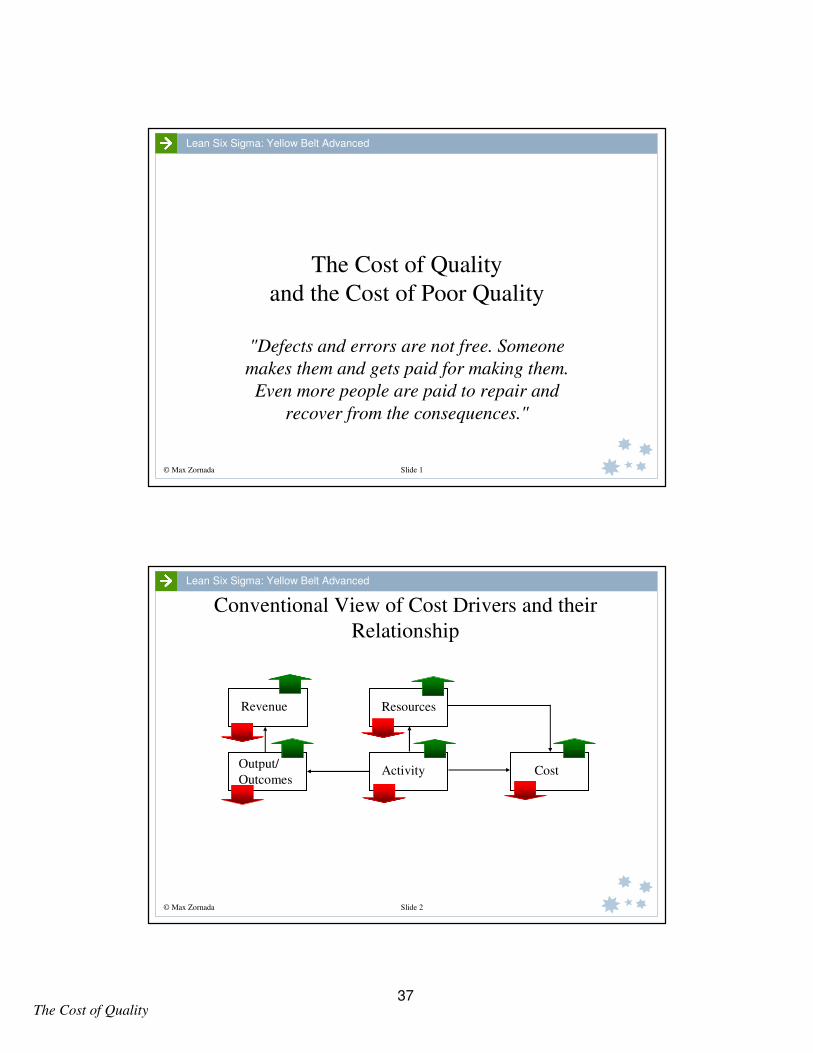
The Cost of Quality
and the Cost of Poor Quality
"Defects and errors are not free. Someone
makes them and gets paid for making them.
Even more people are paid to repair and
recover from the consequences."
© Max Zornada Slide 2
Lean Six Sigma: Yellow Belt Advanced
Conventional View of Cost Drivers and their
Relationship
Output/
OutcomesActivity Cost
ResourcesRevenue
37
The Cost of Quality
© Max Zornada Slide 3
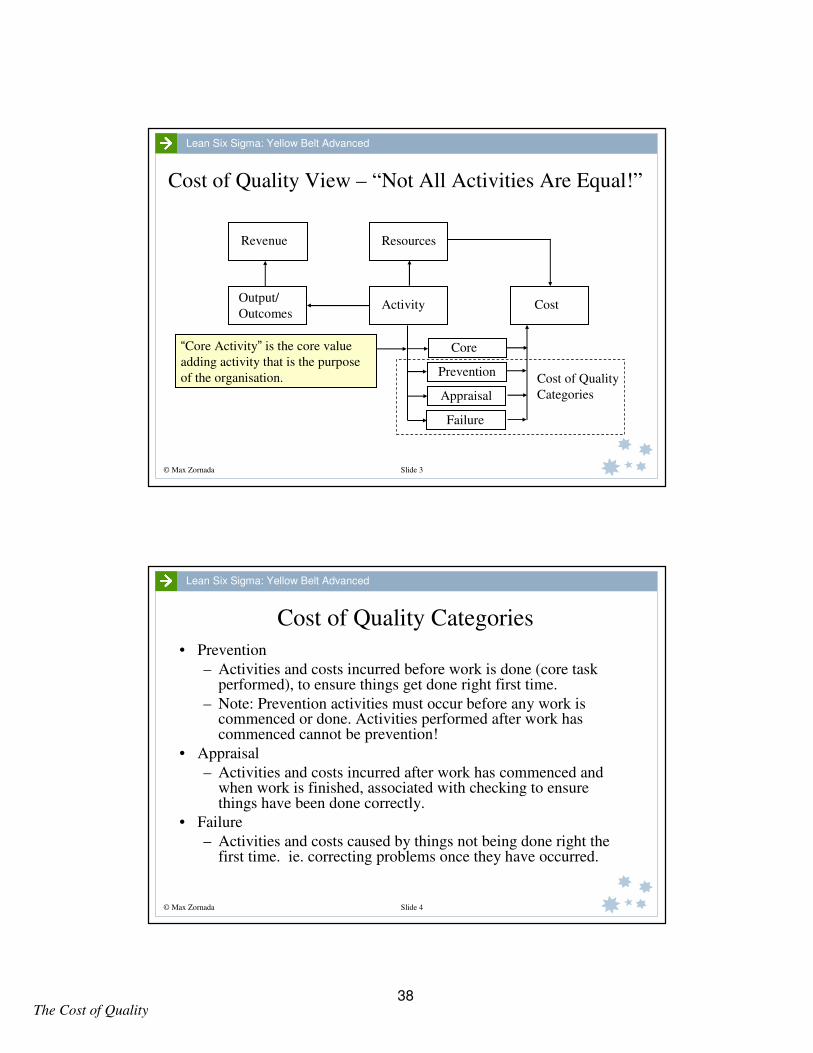
Lean Six Sigma: Yellow Belt Advanced
Cost of Quality View – “Not All Activities Are Equal!”
Output/
OutcomesActivity Cost
ResourcesRevenue
Core
Prevention
Appraisal
Failure
Cost of Quality
Categories
“Core Activity” is the core value
adding activity that is the purpose
of the organisation.
© Max Zornada Slide 4
Lean Six Sigma: Yellow Belt Advanced
Cost of Quality Categories
• Prevention
– Activities and costs incurred before work is done (core task performed), to ensure things get done right first time.
– Note: Prevention activities must occur before any work is commenced or done. Activities performed after work has commenced cannot be prevention!
• Appraisal
– Activities and costs incurred after work has commenced and when work is finished, associated with checking to ensure things have been done correctly.
• Failure
– Activities and costs caused by things not being done right the first time. ie. correcting problems once they have occurred.
38
The Cost of Quality
© Max Zornada Slide 5
Lean Six Sigma: Yellow Belt Advanced
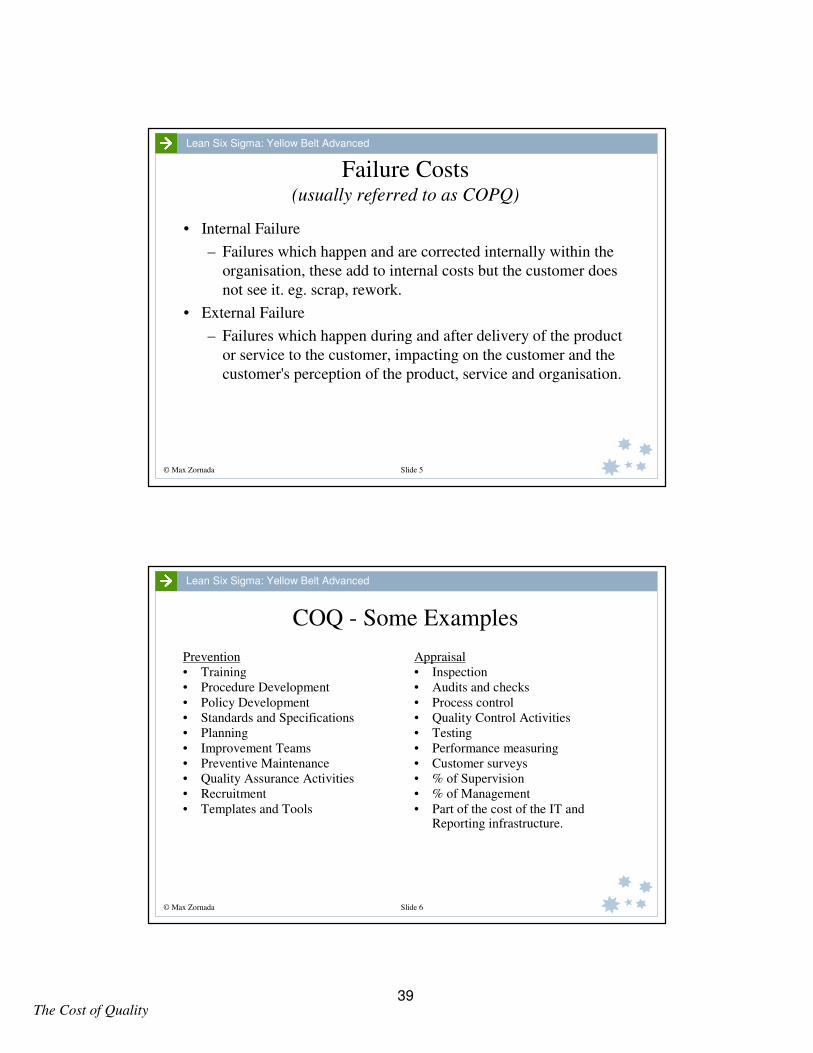
Failure Costs(usually referred to as COPQ)
• Internal Failure
– Failures which happen and are corrected internally within the
organisation, these add to internal costs but the customer does
not see it. eg. scrap, rework.
• External Failure
– Failures which happen during and after delivery of the product
or service to the customer, impacting on the customer and the
customer's perception of the product, service and organisation.
© Max Zornada Slide 6
Lean Six Sigma: Yellow Belt Advanced
COQ - Some Examples
Prevention
• Training
• Procedure Development
• Policy Development
• Standards and Specifications
• Planning
• Improvement Teams
• Preventive Maintenance
• Quality Assurance Activities
• Recruitment
• Templates and Tools
Appraisal
• Inspection
• Audits and checks
• Process control
• Quality Control Activities
• Testing
• Performance measuring
• Customer surveys
• % of Supervision
• % of Management
• Part of the cost of the IT and Reporting infrastructure.
39
The Cost of Quality
© Max Zornada Slide 7
Lean Six Sigma: Yellow Belt Advanced
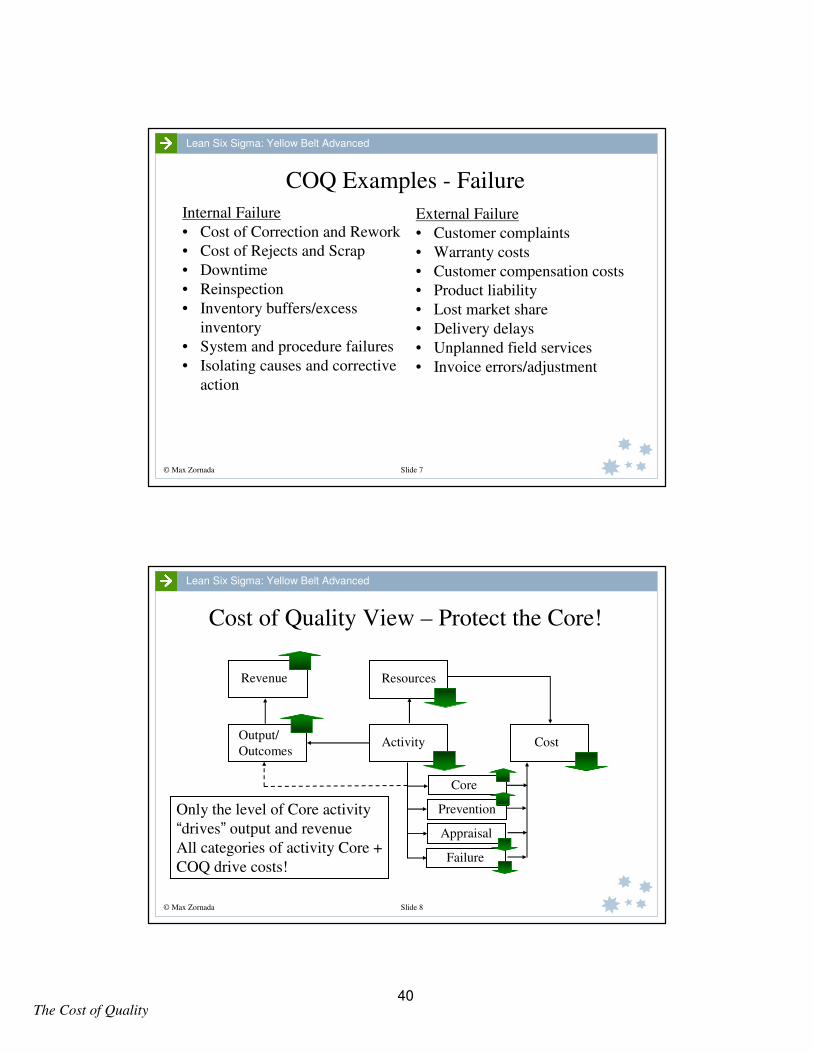
COQ Examples - Failure
Internal Failure
• Cost of Correction and Rework
• Cost of Rejects and Scrap
• Downtime
• Reinspection
• Inventory buffers/excess
inventory
• System and procedure failures
• Isolating causes and corrective
action
External Failure
• Customer complaints
• Warranty costs
• Customer compensation costs
• Product liability
• Lost market share
• Delivery delays
• Unplanned field services
• Invoice errors/adjustment
© Max Zornada Slide 8
Lean Six Sigma: Yellow Belt Advanced
Cost of Quality View – Protect the Core!
Output/
OutcomesActivity Cost
ResourcesRevenue
Core
Prevention
Appraisal
Failure
Only the level of Core activity
“drives” output and revenue
All categories of activity Core +
COQ drive costs!
40
The Cost of Quality
© Max Zornada Slide 9
Lean Six Sigma: Yellow Belt Advanced
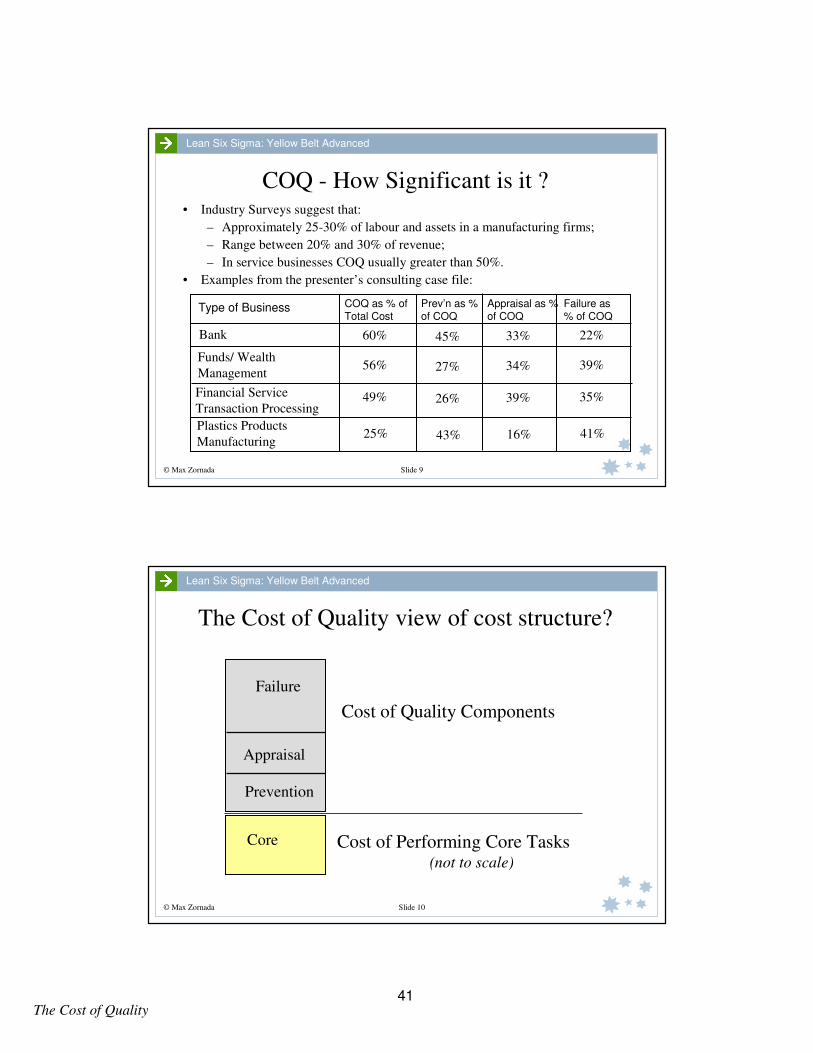
COQ - How Significant is it ?• Industry Surveys suggest that:
– Approximately 25-30% of labour and assets in a manufacturing firms;
– Range between 20% and 30% of revenue;
– In service businesses COQ usually greater than 50%.
• Examples from the presenter’s consulting case file:
Type of Business
Bank
Funds/ Wealth
Management
Financial Service
Transaction Processing
COQ as % of Total Cost
60%
Prev’n as % of COQ
Appraisal as % of COQ
Failure as % of COQ
56%
49%
45%
27%
26%
33%
34%
39%
22%
39%
35%
Plastics Products
Manufacturing25% 43% 16% 41%
© Max Zornada Slide 10
Lean Six Sigma: Yellow Belt Advanced
The Cost of Quality view of cost structure?
Failure
Appraisal
Prevention
Cost of Quality Components
Cost of Performing Core Tasks(not to scale)
Core
41
The Cost of Quality
© Max Zornada Slide 11
Lean Six Sigma: Yellow Belt Advanced
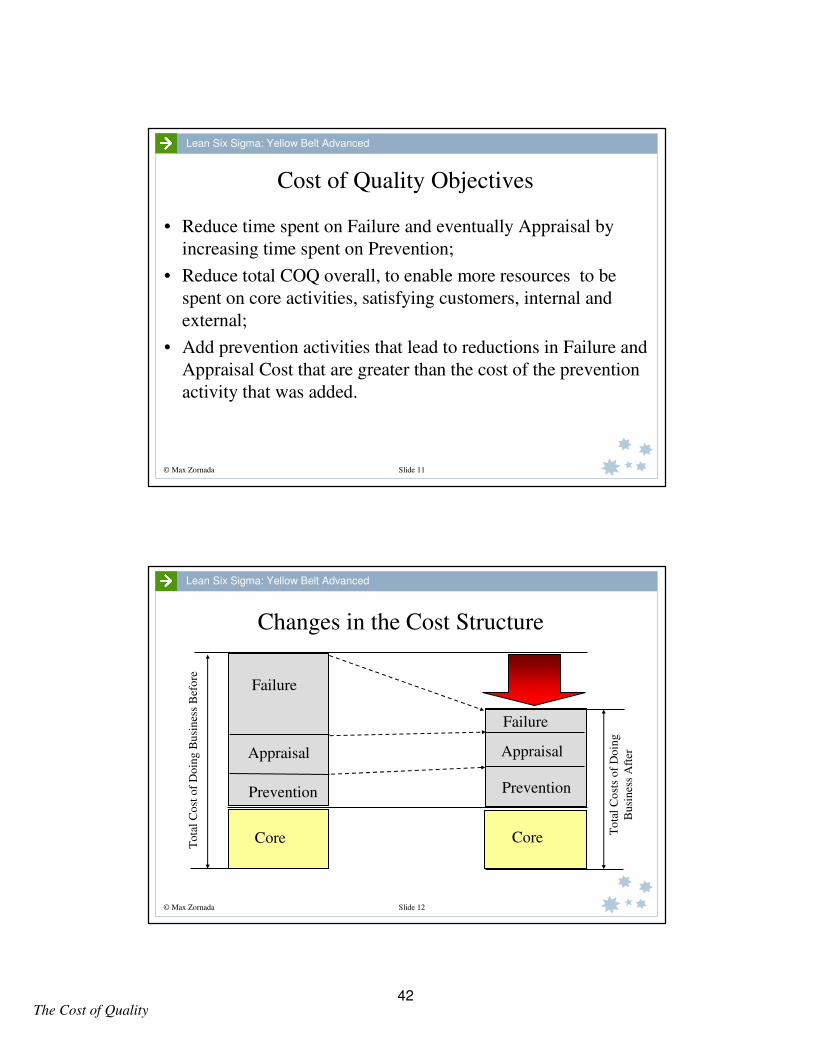
Cost of Quality Objectives
• Reduce time spent on Failure and eventually Appraisal by
increasing time spent on Prevention;
• Reduce total COQ overall, to enable more resources to be
spent on core activities, satisfying customers, internal and
external;
• Add prevention activities that lead to reductions in Failure and
Appraisal Cost that are greater than the cost of the prevention
activity that was added.
© Max Zornada Slide 12
Lean Six Sigma: Yellow Belt Advanced
Changes in the Cost Structure
Prevention
Appraisal
Failure
To
tal
Co
st o
f D
oin
g B
usi
nes
s B
efo
re
To
tal
Co
sts
of
Do
ing
Bu
sin
ess
Aft
er
Failure
Appraisal
Prevention
Core Core
42
The Cost of Quality
© Max Zornada Slide 13
Lean Six Sigma: Yellow Belt Advanced
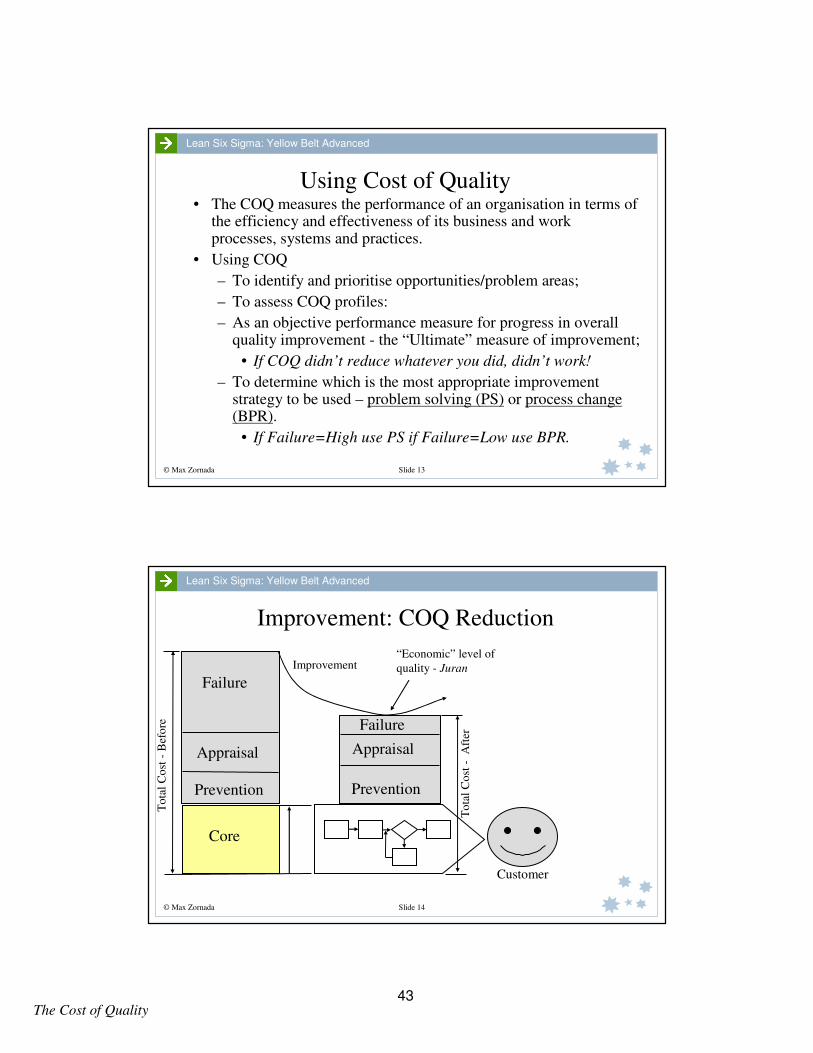
Using Cost of Quality• The COQ measures the performance of an organisation in terms of
the efficiency and effectiveness of its business and work processes, systems and practices.
• Using COQ
– To identify and prioritise opportunities/problem areas;
– To assess COQ profiles:
– As an objective performance measure for progress in overall quality improvement - the “Ultimate” measure of improvement;
• If COQ didn’t reduce whatever you did, didn’t work!
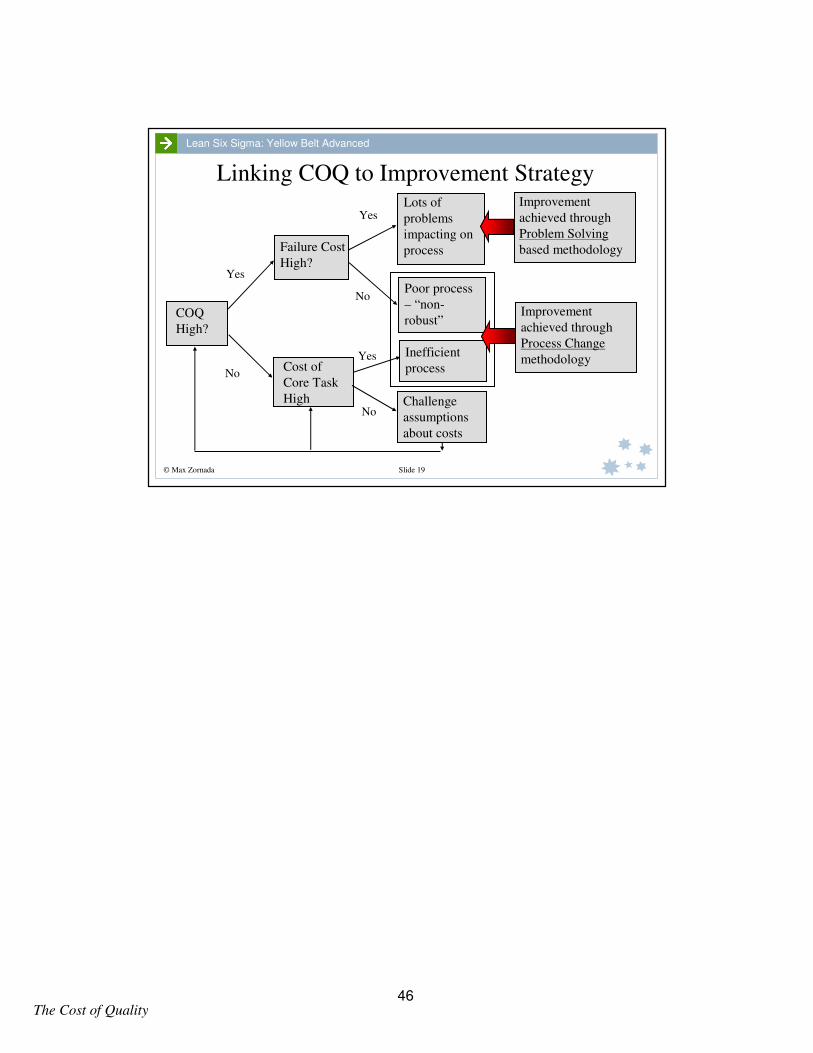
– To determine which is the most appropriate improvement strategy to be used – problem solving (PS) or process change (BPR).
• If Failure=High use PS if Failure=Low use BPR.
© Max Zornada Slide 14
Lean Six Sigma: Yellow Belt Advanced
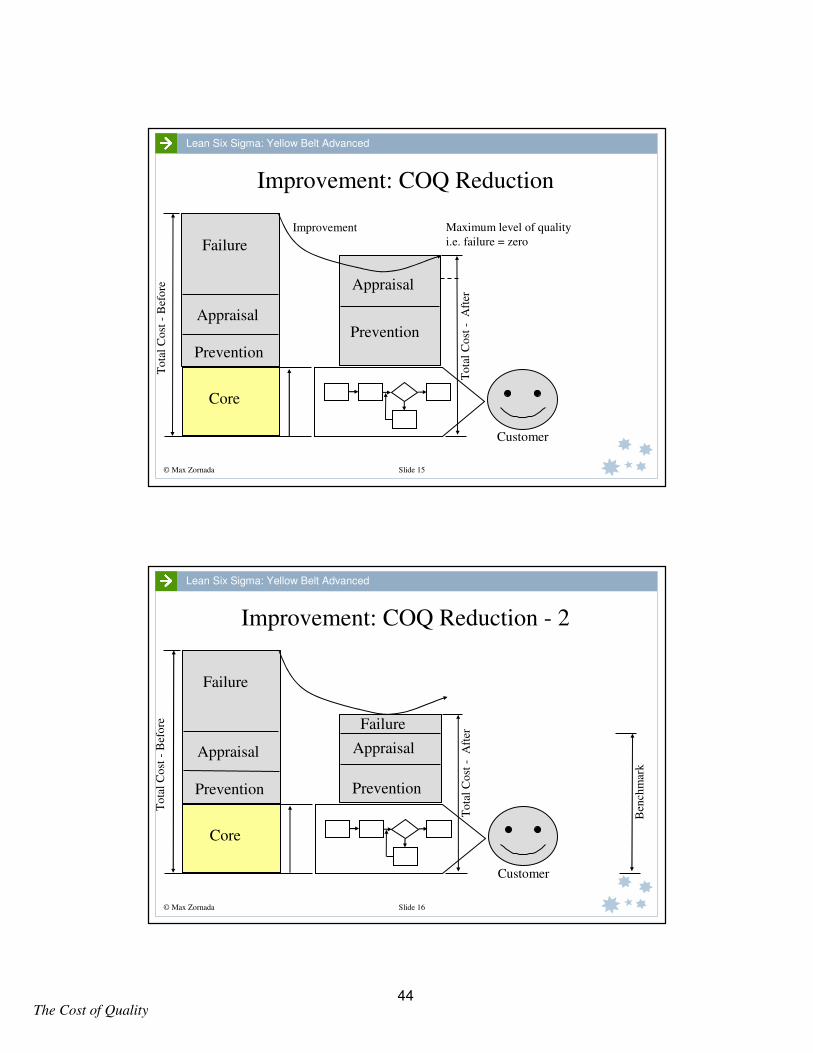
Improvement: COQ Reduction
Customer
Core
Failure
Appraisal
Prevention Prevention
Appraisal
Failure
To
tal
Co
st -
Bef
ore
Improvement
To
tal
Co
st -
Aft
er
“Economic” level of
quality - Juran
43
The Cost of Quality
© Max Zornada Slide 15
Lean Six Sigma: Yellow Belt Advanced
Improvement: COQ Reduction
Customer
Core
Failure
Appraisal
Prevention
Prevention
Appraisal
To
tal
Co
st -
Bef
ore
Improvement
To
tal
Co
st -
Aft
er
Maximum level of quality
i.e. failure = zero
© Max Zornada Slide 16
Lean Six Sigma: Yellow Belt Advanced
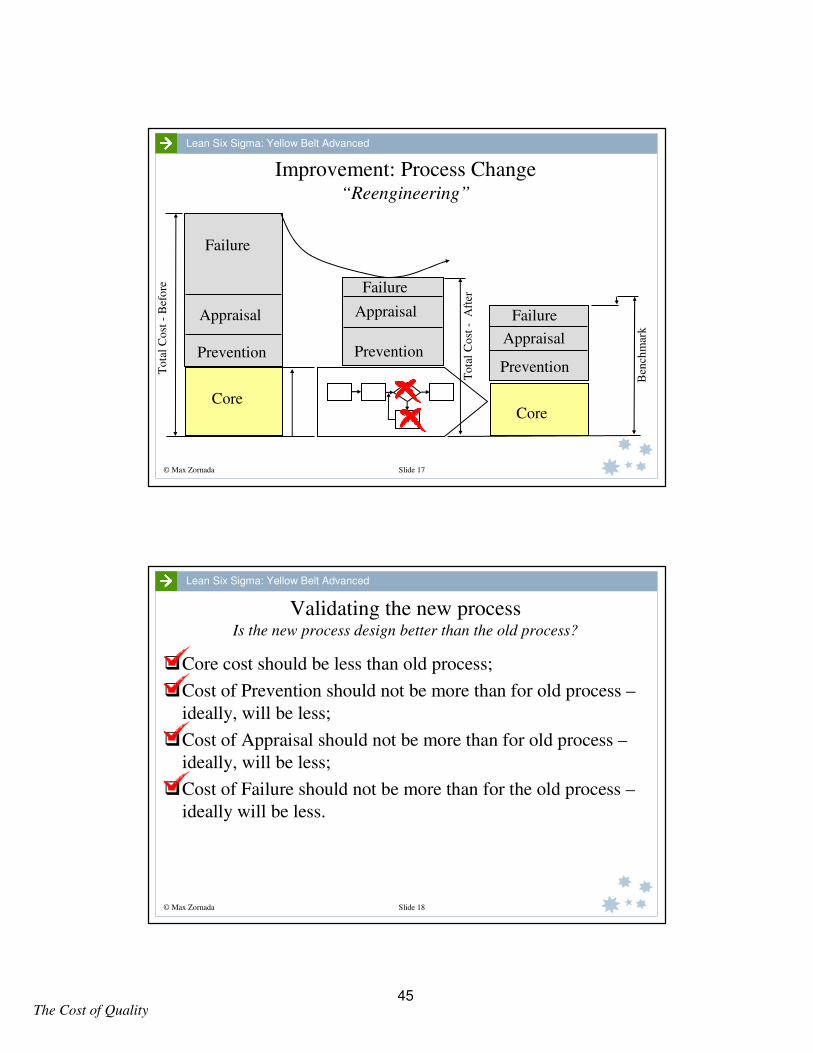
Improvement: COQ Reduction - 2
Customer
Core
Failure
Appraisal
Prevention Prevention
Appraisal
Failure
To
tal
Co
st -
Bef
ore
To
tal
Co
st -
Aft
er
Ben
chm
ark
44
The Cost of Quality
© Max Zornada Slide 17
Lean Six Sigma: Yellow Belt Advanced
Improvement: Process Change“Reengineering”
Core
Failure
Appraisal
Prevention Prevention
Appraisal
Failure
To
tal
Co
st -
Bef
ore
To
tal
Co
st -
Aft
er
Ben
chm
ark
Core
Prevention
Appraisal
Failure
© Max Zornada Slide 18
Lean Six Sigma: Yellow Belt Advanced
Validating the new processIs the new process design better than the old process?
�Core cost should be less than old process;
�Cost of Prevention should not be more than for old process –
ideally, will be less;
�Cost of Appraisal should not be more than for old process –
ideally, will be less;
�Cost of Failure should not be more than for the old process –
ideally will be less.
45
The Cost of Quality
© Max Zornada Slide 19
Lean Six Sigma: Yellow Belt Advanced
Linking COQ to Improvement Strategy
Yes
No
Yes
No
No
Yes
COQ
High?
Failure Cost
High?
Cost of
Core Task
High
Poor process
– “non-
robust”
Inefficient
process
Challenge
assumptions
about costs
Lots of
problems
impacting on
process
Improvement
achieved through
Problem Solving
based methodology
Improvement
achieved through
Process Change
methodology
46

© Max Zornada Slide 1
Lean Six Sigma: Yellow Belt Advanced
Cost of Quality Categorisation
Answering the telephone to a customer who is querying their bill.
Co-worker checking their colleagues work before completion
Carrying out a quality audit.
Reworking something that was done incorrectly.
Staff training on new procedures.
Proof reading a report before distribution.
Developing instruction manuals and procedures.
Processing an invoice for payment correctly.
Spending half the morning pacifying an irate customer.
Reprinting promotional material because the some information was stated incorrectly.
Collecting data required for the weekly management report.
Time spent in an improvement team working on an improvement project.
For each of the following activities identify whether the costs incurred should be allocated to: Core Task
(C ) Prevention (P) Appraisal (A) Internal Failure (FI) External Failure (FE)
47
The Cost of Quality
© Max Zornada Slide 1
Lean Six Sigma: Yellow Belt Advanced
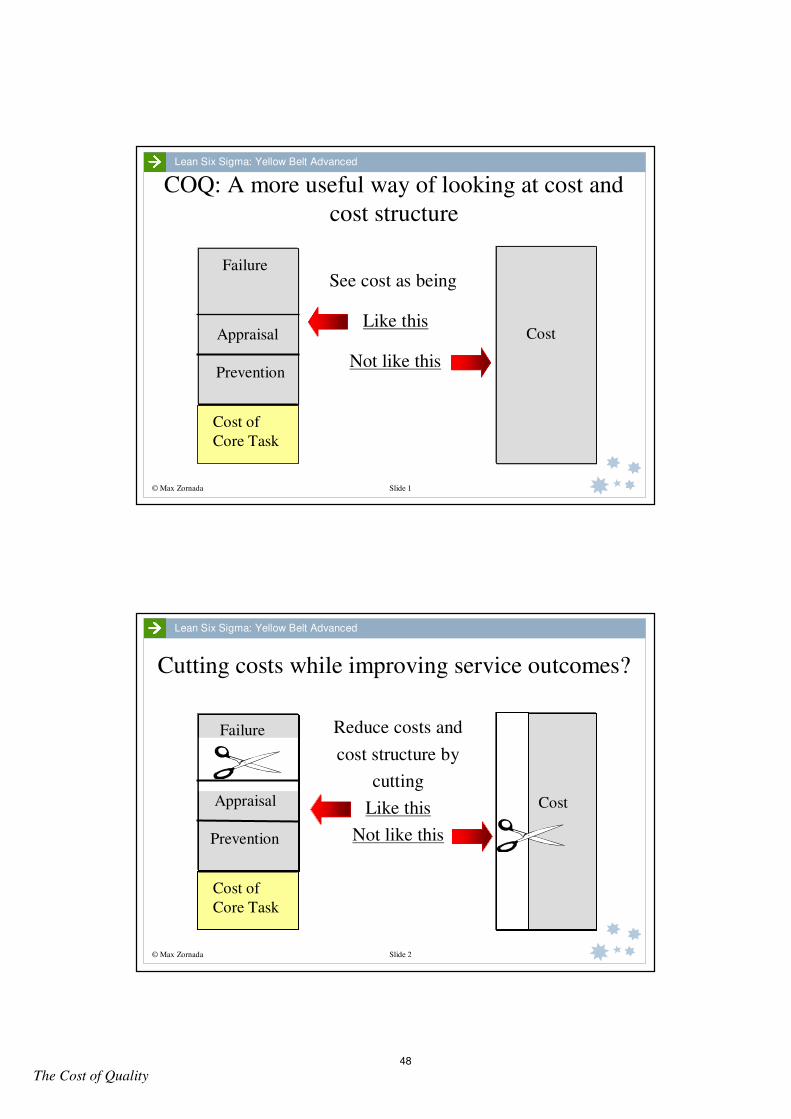
COQ: A more useful way of looking at cost and
cost structure
Cost of
Core Task
See cost as being
Like this
Not like this
Cost
Failure
Appraisal
Prevention
© Max Zornada Slide 2
Lean Six Sigma: Yellow Belt Advanced
Cutting costs while improving service outcomes?
Reduce costs and
cost structure by
cutting
Like this
Not like this
Cost of
Core Task
Cost
Failure
Appraisal
Prevention
48
The Cost of Quality
© Max Zornada Slide 3
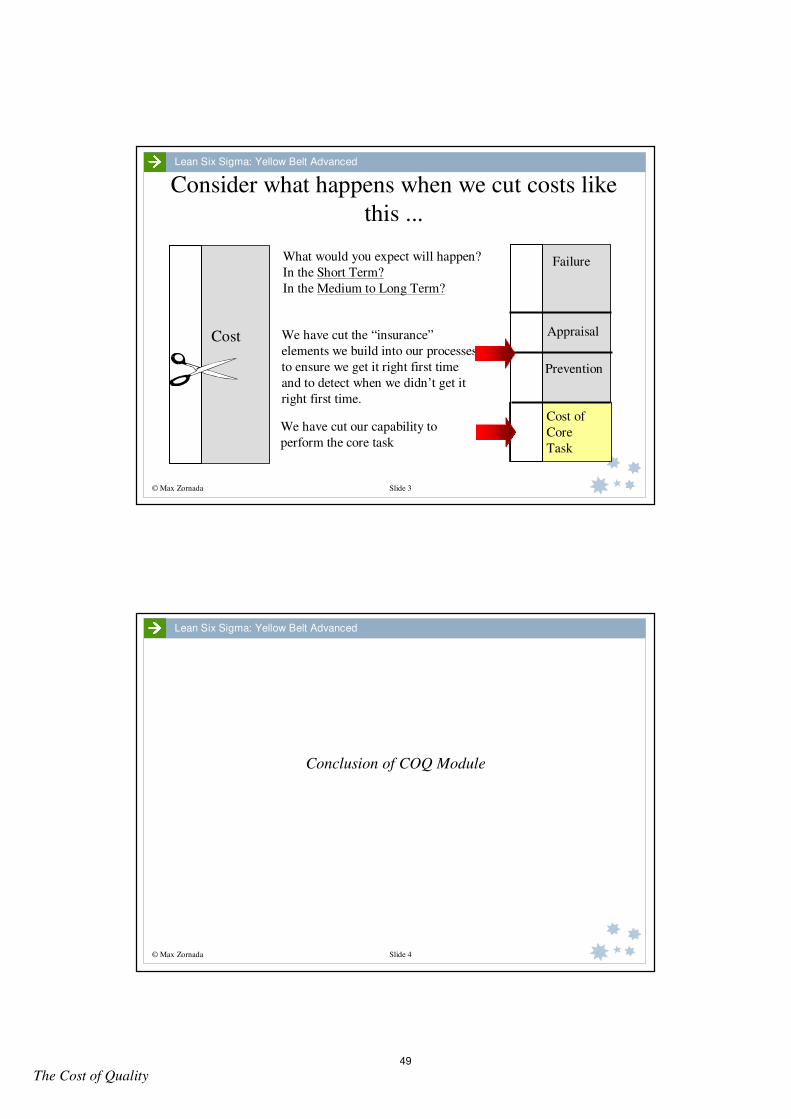
Lean Six Sigma: Yellow Belt Advanced
Consider what happens when we cut costs like
this ...
Cost
Cost of
Core
Task
Failure
Appraisal
Prevention
We have cut our capability to
perform the core task
We have cut the “insurance”
elements we build into our processes
to ensure we get it right first time
and to detect when we didn’t get it
right first time.
What would you expect will happen?
In the Short Term?
In the Medium to Long Term?
© Max Zornada Slide 4
Lean Six Sigma: Yellow Belt Advanced
Conclusion of COQ Module
49
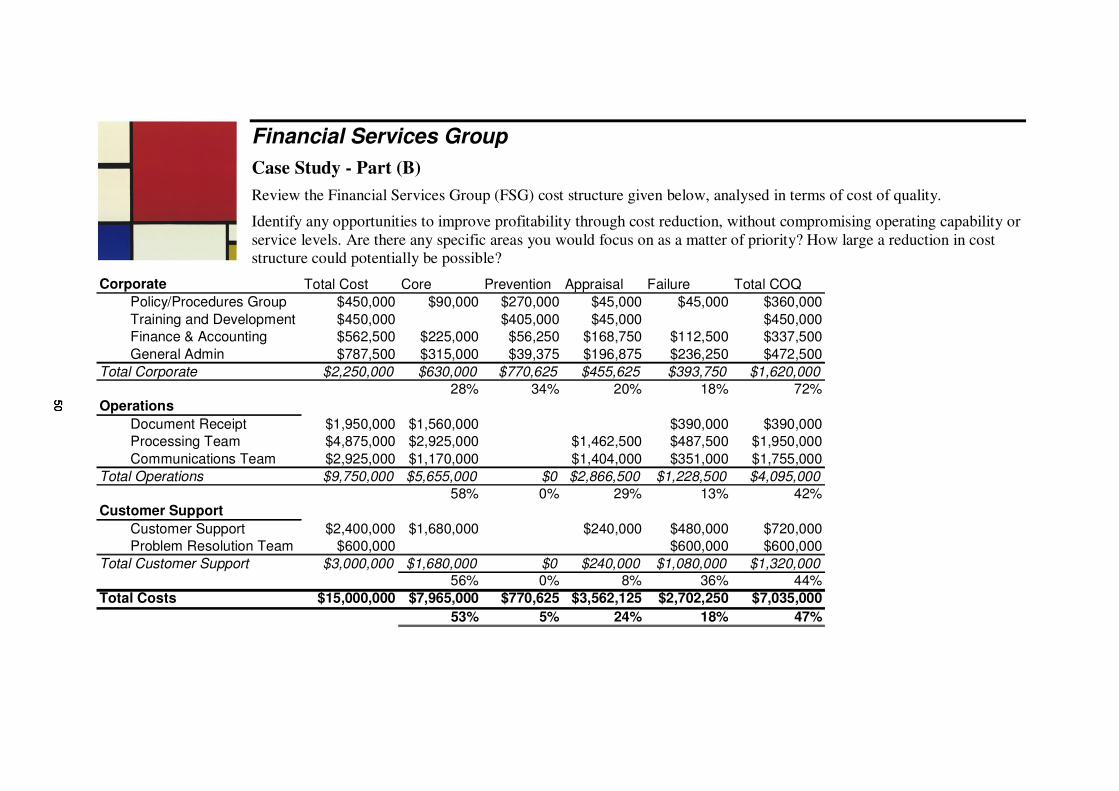
Financial Services Group
Case Study - Part (B)
Review the Financial Services Group (FSG) cost structure given below, analysed in terms of cost of quality.
Identify any opportunities to improve profitability through cost reduction, without compromising operating capability or
service levels. Are there any specific areas you would focus on as a matter of priority? How large a reduction in cost
structure could potentially be possible?
Corporate Total Cost Core Prevention Appraisal Failure Total COQ
Policy/Procedures Group $450,000 $90,000 $270,000 $45,000 $45,000 $360,000
Training and Development $450,000 $405,000 $45,000 $450,000Finance & Accounting $562,500 $225,000 $56,250 $168,750 $112,500 $337,500
General Admin $787,500 $315,000 $39,375 $196,875 $236,250 $472,500
Total Corporate $2,250,000 $630,000 $770,625 $455,625 $393,750 $1,620,00028% 34% 20% 18% 72%
Operations
Document Receipt $1,950,000 $1,560,000 $390,000 $390,000Processing Team $4,875,000 $2,925,000 $1,462,500 $487,500 $1,950,000
Communications Team $2,925,000 $1,170,000 $1,404,000 $351,000 $1,755,000
Total Operations $9,750,000 $5,655,000 $0 $2,866,500 $1,228,500 $4,095,00058% 0% 29% 13% 42%
Customer Support
Customer Support $2,400,000 $1,680,000 $240,000 $480,000 $720,000Problem Resolution Team $600,000 $600,000 $600,000
Total Customer Support $3,000,000 $1,680,000 $0 $240,000 $1,080,000 $1,320,00056% 0% 8% 36% 44%
Total Costs $15,000,000 $7,965,000 $770,625 $3,562,125 $2,702,250 $7,035,000
53% 5% 24% 18% 47%
50
50
50

Complexity
51

52
Complexity
© Max Zornada Slide 1
Lean Six Sigma: Yellow Belt Advanced
Process Complexity
© Max Zornada Slide 2
Lean Six Sigma: Yellow Belt Advanced
Complexity
• Concept first put forward by the Hewlett-Packard Company;
• Complexity is defined as being those extra process steps that
are required to deal with external errors (errors generated by
factors outside the process) and to recover from internal errors
(errors generated by the process).
• Classified all work into two categories:
– Real Work
– Complexity
53

Complexity
© Max Zornada Slide 3
Lean Six Sigma: Yellow Belt Advanced
Identifying Complexity
To identify complexity, ask the question:
"If the process were running perfectly, would this activity
be performed ?"
YES = Real Work
NO = Complexity
© Max Zornada Slide 4
Lean Six Sigma: Yellow Belt Advanced
Two Views of Work Time
Time Unavailable
for Work
Time Available
for Real Work
Time Unavailable
for Work
Complexity -
Internal Errors
Complexity -
External ErrorsTime Available
for Real Work
Conventional View
Complexity View
54
Complexity
© Max Zornada Slide 5
Lean Six Sigma: Yellow Belt Advanced
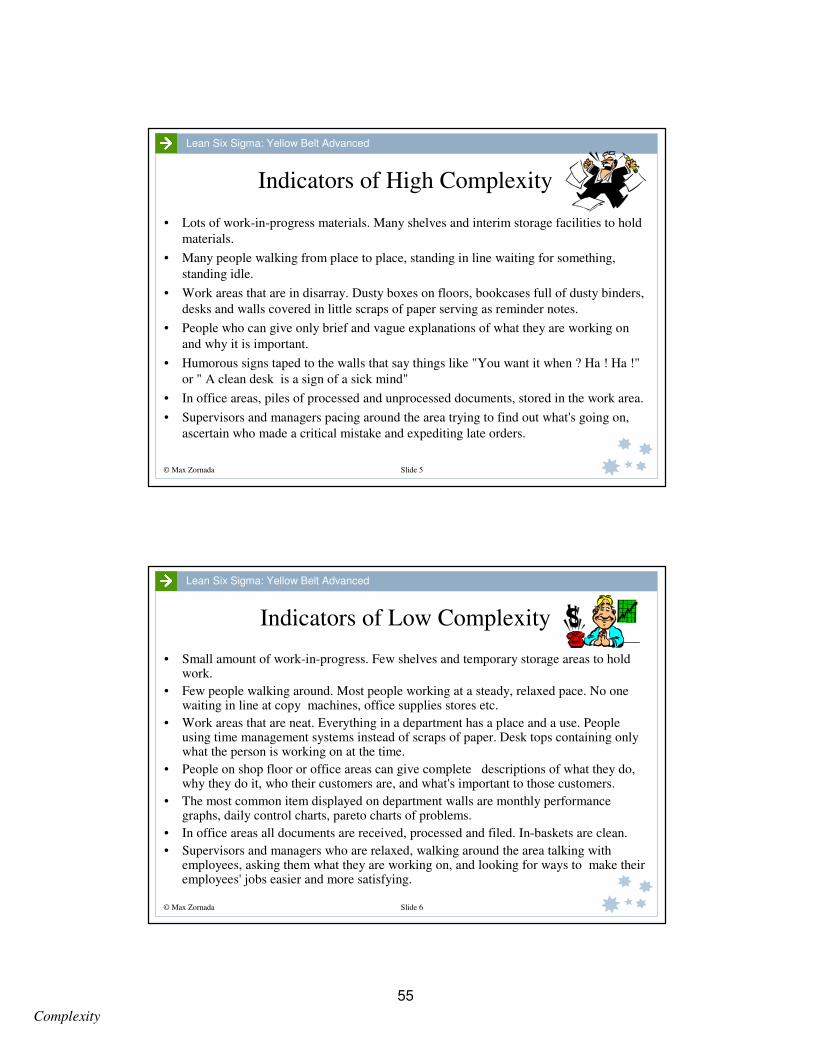
Indicators of High Complexity
• Lots of work-in-progress materials. Many shelves and interim storage facilities to hold
materials.
• Many people walking from place to place, standing in line waiting for something,
standing idle.
• Work areas that are in disarray. Dusty boxes on floors, bookcases full of dusty binders,
desks and walls covered in little scraps of paper serving as reminder notes.
• People who can give only brief and vague explanations of what they are working on
and why it is important.
• Humorous signs taped to the walls that say things like "You want it when ? Ha ! Ha !"
or " A clean desk is a sign of a sick mind"
• In office areas, piles of processed and unprocessed documents, stored in the work area.
• Supervisors and managers pacing around the area trying to find out what's going on,
ascertain who made a critical mistake and expediting late orders.
© Max Zornada Slide 6
Lean Six Sigma: Yellow Belt Advanced
Indicators of Low Complexity
• Small amount of work-in-progress. Few shelves and temporary storage areas to hold work.
• Few people walking around. Most people working at a steady, relaxed pace. No one waiting in line at copy machines, office supplies stores etc.
• Work areas that are neat. Everything in a department has a place and a use. People using time management systems instead of scraps of paper. Desk tops containing only what the person is working on at the time.
• People on shop floor or office areas can give complete descriptions of what they do, why they do it, who their customers are, and what's important to those customers.
• The most common item displayed on department walls are monthly performance graphs, daily control charts, pareto charts of problems.
• In office areas all documents are received, processed and filed. In-baskets are clean.
• Supervisors and managers who are relaxed, walking around the area talking with employees, asking them what they are working on, and looking for ways to make their employees' jobs easier and more satisfying.
55

Complexity
© Max Zornada Slide 7
Lean Six Sigma: Yellow Belt Advanced
A Simple Retail Purchasing ProcessThe “Official” Process
Select goods
from shelfRead price tag
Enter data in register
Announce TotalOffer to Pay
Make change
Wrap GoodsLeave
Customer Clerk
© Max Zornada Slide 8
Lean Six Sigma: Yellow Belt Advanced
The Real ProcessComplexity caused by Errors!
No
Yes
No
Yes
No
Yes
No
Yes
?
Etc., Etc. ...
Customer Clerk Supervisor Store person
Pick Goods from shelf
Is
Price Tag OK ?
Look up Printed list
Explain Difference
Accept ?
Exit Angry !
Goods
Damaged ?
Discuss with supervisor
Inquire if available from storeroom
Discuss situation
Bring to ClerkFetch and
Notify SupervisorApologise to Customer
Explain to Customer Available ?
Wrap etc.
56
Complexity
© Max Zornada Slide 9
Lean Six Sigma: Yellow Belt Advanced
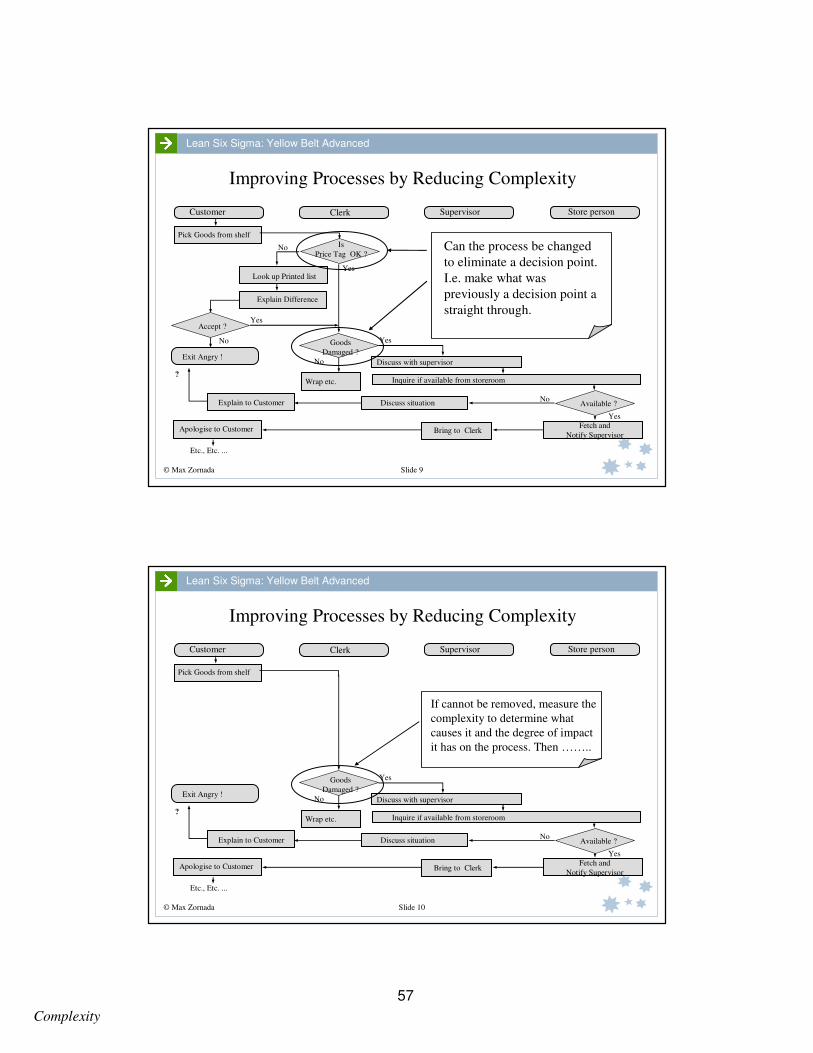
Improving Processes by Reducing Complexity
No
Yes
No
Yes
No
Yes
No
Yes
?
Etc., Etc. ...
Customer Clerk Supervisor Store person
Pick Goods from shelf
Is
Price Tag OK ?
Look up Printed list
Explain Difference
Accept ?
Exit Angry !
Goods
Damaged ?
Discuss with supervisor
Inquire if available from storeroom
Discuss situation
Bring to ClerkFetch and
Notify SupervisorApologise to Customer
Explain to Customer Available ?
Wrap etc.
Can the process be changed
to eliminate a decision point.
I.e. make what was
previously a decision point a
straight through.
© Max Zornada Slide 10
Lean Six Sigma: Yellow Belt Advanced
Improving Processes by Reducing Complexity
Yes
No
Yes
No
?
Etc., Etc. ...
Customer Clerk Supervisor Store person
Pick Goods from shelf
Exit Angry !
Goods
Damaged ?
Discuss with supervisor
Inquire if available from storeroom
Discuss situation
Bring to ClerkFetch and
Notify SupervisorApologise to Customer
Explain to Customer Available ?
Wrap etc.
If cannot be removed, measure the
complexity to determine what
causes it and the degree of impact
it has on the process. Then ……..
57
Complexity
© Max Zornada Slide 11
Lean Six Sigma: Yellow Belt Advanced
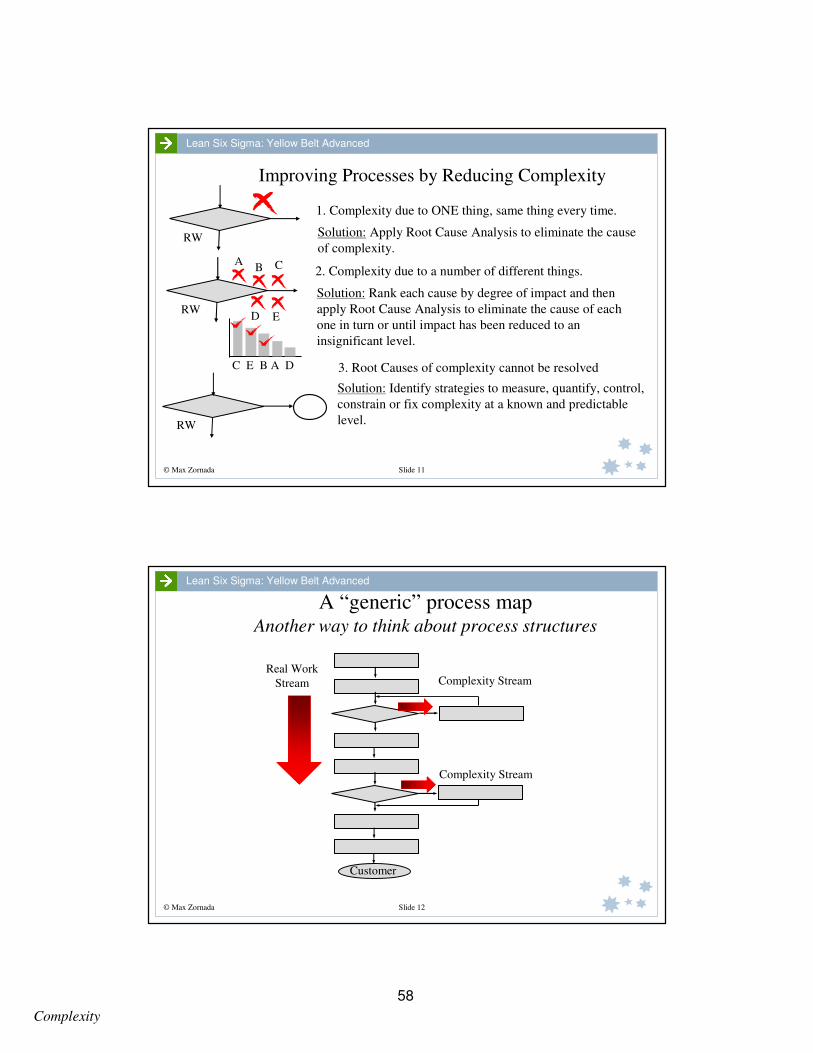
Improving Processes by Reducing Complexity
1. Complexity due to ONE thing, same thing every time.
RW Solution: Apply Root Cause Analysis to eliminate the cause
of complexity.
RW
2. Complexity due to a number of different things.
Solution: Rank each cause by degree of impact and then
apply Root Cause Analysis to eliminate the cause of each
one in turn or until impact has been reduced to an
insignificant level.
AB C
D E
RW
3. Root Causes of complexity cannot be resolved
Solution: Identify strategies to measure, quantify, control,
constrain or fix complexity at a known and predictable
level.
C E B A D
© Max Zornada Slide 12
Lean Six Sigma: Yellow Belt Advanced
A “generic” process mapAnother way to think about process structures
Customer
Real Work
Stream
Complexity Stream
Complexity Stream
58

Complexity
© Max Zornada Slide 13
Lean Six Sigma: Yellow Belt Advanced
Is there a good complexity?
Complexity and Flexibility
© Max Zornada Slide 14
Lean Six Sigma: Yellow Belt Advanced
Consider a Process Established to Deliver a
Product or a Service “A”
Customer
59

Complexity
© Max Zornada Slide 15
Lean Six Sigma: Yellow Belt Advanced
We now need to deliver a second product/service “B”
Option 1: Set up a separate process for B Option 2: Make the A process “flexible”
enough to handle both A and B
Process for A Process for B
Customer CustomerCustomer
© Max Zornada Slide 16
Lean Six Sigma: Yellow Belt Advanced
The Flexible “A” Process
Customer
Real Work
Stream
(A)
Complexity Stream (to cater for B)
Complexity Stream (to cater for B)
60
Complexity
© Max Zornada Slide 17
Lean Six Sigma: Yellow Belt Advanced
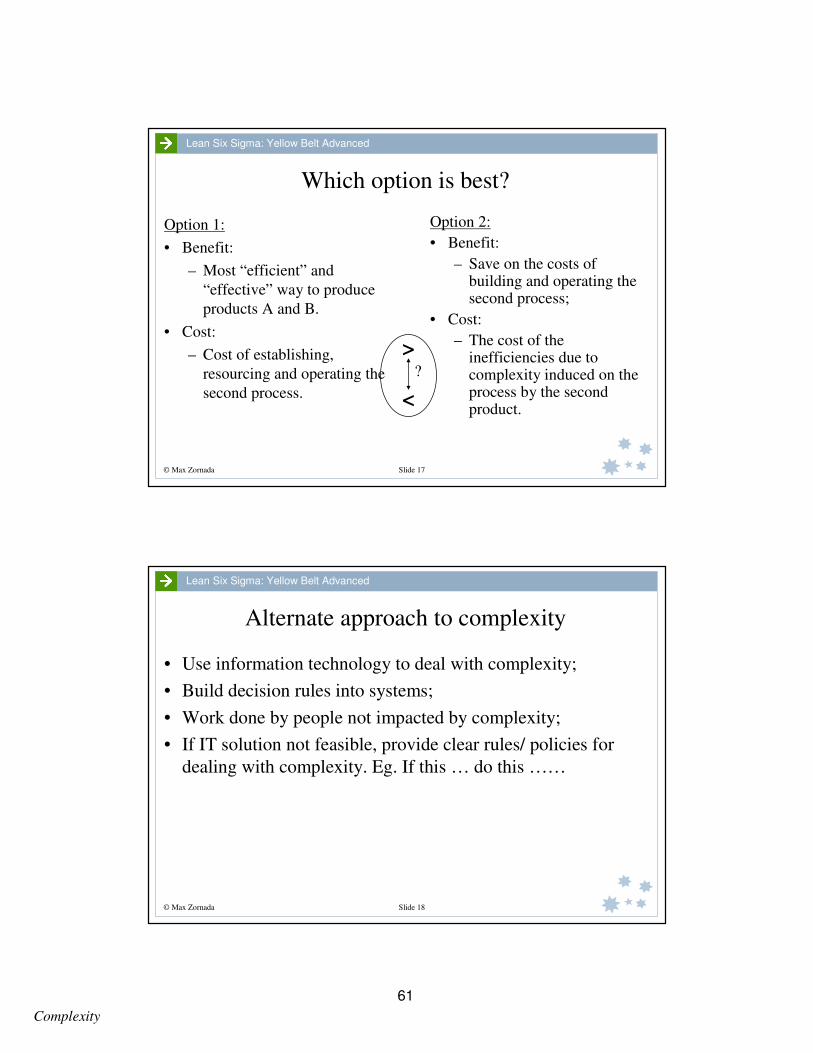
Which option is best?
Option 1:
• Benefit:
– Most “efficient” and
“effective” way to produce
products A and B.
• Cost:
– Cost of establishing,
resourcing and operating the
second process.
Option 2:
• Benefit:
– Save on the costs of building and operating the second process;
• Cost:
– The cost of the inefficiencies due to complexity induced on the process by the second product.
>
<
?
© Max Zornada Slide 18
Lean Six Sigma: Yellow Belt Advanced
Alternate approach to complexity
• Use information technology to deal with complexity;
• Build decision rules into systems;
• Work done by people not impacted by complexity;
• If IT solution not feasible, provide clear rules/ policies for
dealing with complexity. Eg. If this … do this ……
61

Complexity
© Max Zornada Slide 19
Lean Six Sigma: Yellow Belt Advanced
Process Thinking - Review of Concepts
• Function Thinking (Vertical) vs. Process Thinking (Horizontal)
• Organisation control vs Value creation and improvement issues;
• Process Mapping tool;
• The Cost Structure and the Cost of Quality (Core, Prevention, Appraisal, Failure)
• Problem Solving vs Process Change
• Complexity vs Real Work
• Identifying opportunities for improvement by focussing on complexity
© Max Zornada Slide 20
Lean Six Sigma: Yellow Belt Advanced
In Summary
Anything that can be process mapped can
be improved!
There is no activity in the known Universe
that cannot be process mapped!
62
Customer Experience, Satisfaction and
Loyalty
63

64
Customer Satisfaction
© Max Zornada Slide 1
Lean Six Sigma: Yellow Belt Advanced
Managing Customer Experience,
Satisfaction and Loyalty
© Max Zornada Slide 2
Lean Six Sigma: Yellow Belt Advanced
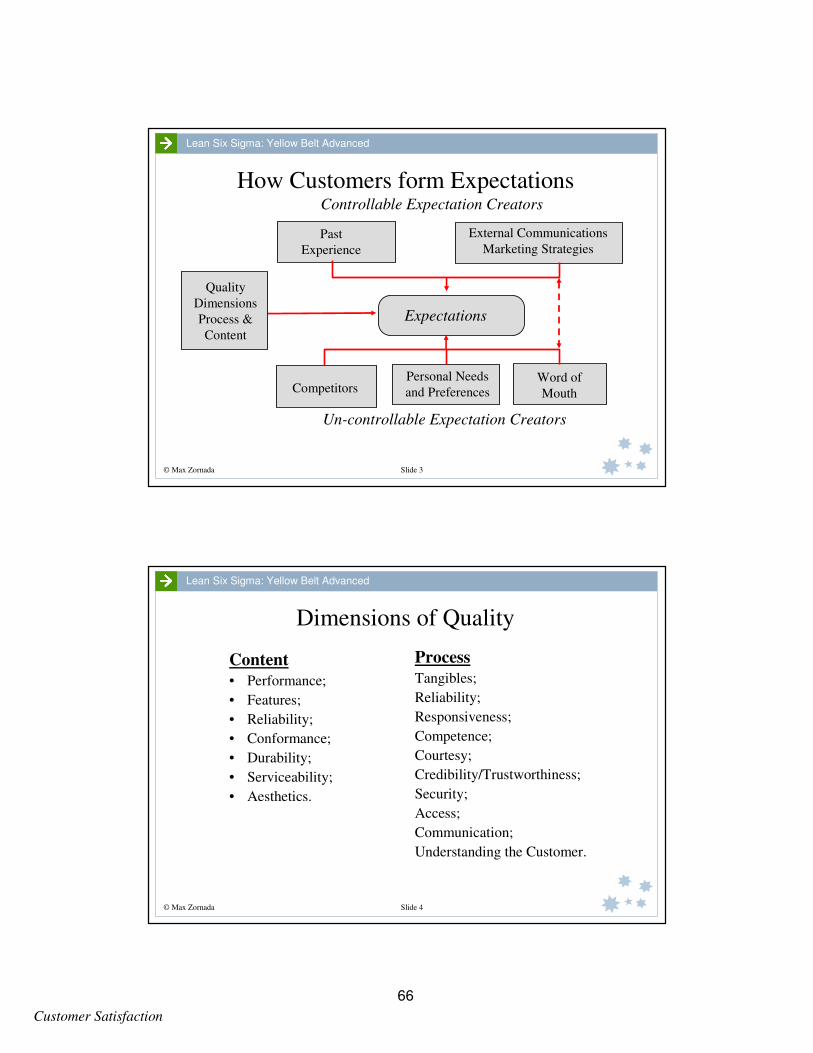
How Customers See QualityPerceived Quality (Experience) = Perceptions - Expectations
Expectations Perceptions
Customer
Content Process
What the customer gets, the actual
service or product. The "technical
dimension“ or output.
How they get it, the process by which
the service or product is delivered. The
service or “experience”.
Perceived Quality
Parasuraman, Zeithaml and Berry (1988)
65
Customer Satisfaction
© Max Zornada Slide 3
Lean Six Sigma: Yellow Belt Advanced
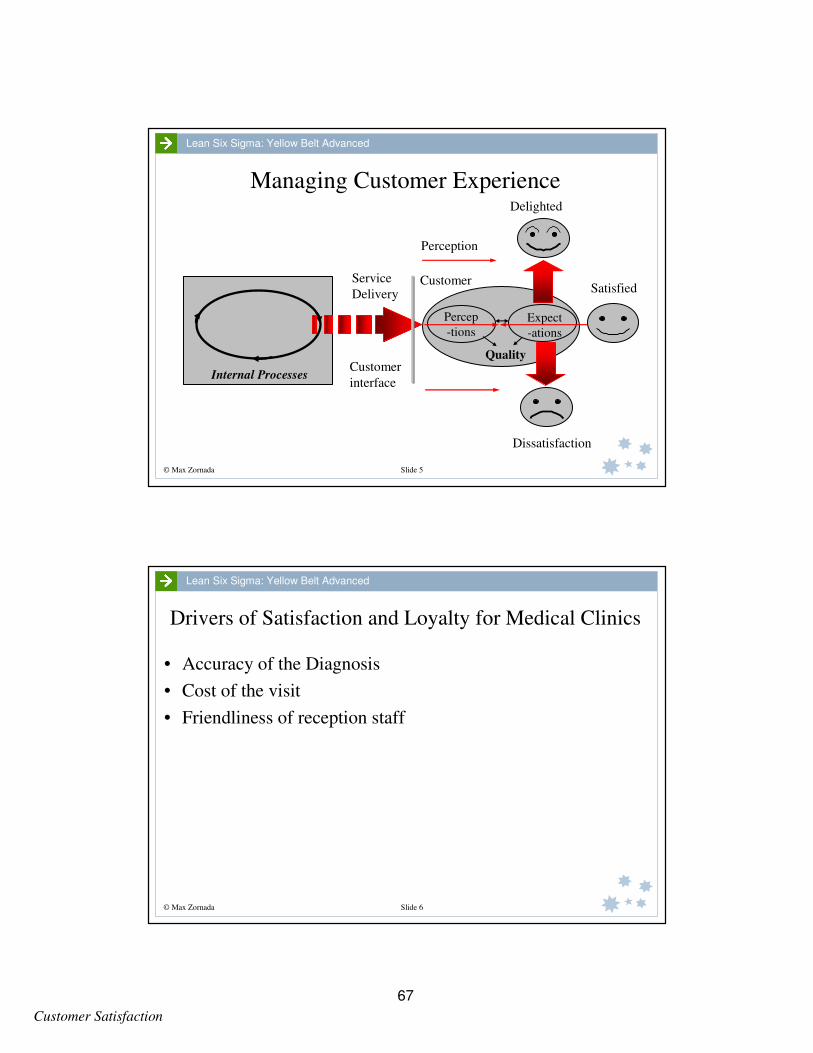
How Customers form ExpectationsControllable Expectation Creators
Un-controllable Expectation Creators
Past
Experience
External Communications
Marketing Strategies
Quality
Dimensions
Process &
Content
CompetitorsWord of
Mouth
Personal Needs
and Preferences
Expectations
© Max Zornada Slide 4
Lean Six Sigma: Yellow Belt Advanced
Dimensions of Quality
Content
• Performance;
• Features;
• Reliability;
• Conformance;
• Durability;
• Serviceability;
• Aesthetics.
Process
Tangibles;
Reliability;
Responsiveness;
Competence;
Courtesy;
Credibility/Trustworthiness;
Security;
Access;
Communication;
Understanding the Customer.
66
Customer Satisfaction
© Max Zornada Slide 5
Lean Six Sigma: Yellow Belt Advanced
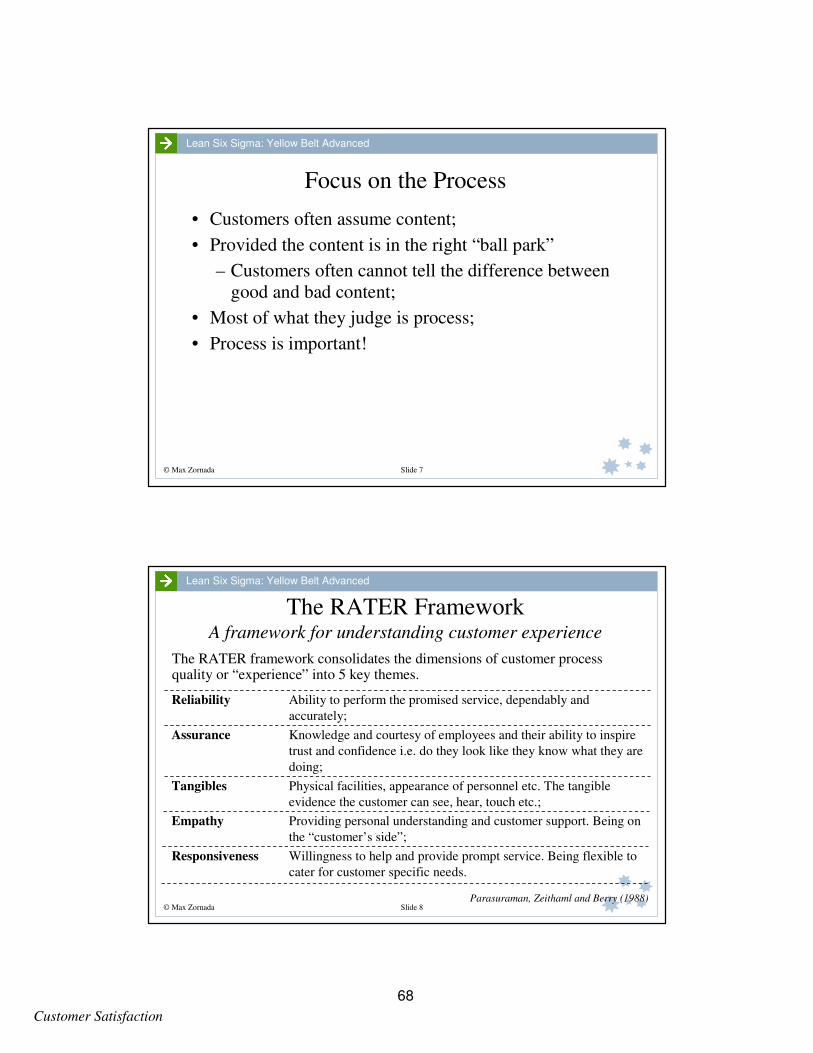
Managing Customer Experience
Percep
-tions
Expect
-ations
Quality
Customer
Internal ProcessesCustomer
interface
Service
Delivery
Perception
Dissatisfaction
Delighted
Satisfied
© Max Zornada Slide 6
Lean Six Sigma: Yellow Belt Advanced
Drivers of Satisfaction and Loyalty for Medical Clinics
• Accuracy of the Diagnosis
• Cost of the visit
• Friendliness of reception staff
67
Customer Satisfaction
© Max Zornada Slide 7
Lean Six Sigma: Yellow Belt Advanced
Focus on the Process
• Customers often assume content;
• Provided the content is in the right “ball park”
– Customers often cannot tell the difference between
good and bad content;
• Most of what they judge is process;
• Process is important!
© Max Zornada Slide 8
Lean Six Sigma: Yellow Belt Advanced
The RATER FrameworkA framework for understanding customer experience
Reliability Ability to perform the promised service, dependably and
accurately;
Assurance Knowledge and courtesy of employees and their ability to inspire
trust and confidence i.e. do they look like they know what they are
doing;
Tangibles Physical facilities, appearance of personnel etc. The tangible
evidence the customer can see, hear, touch etc.;
Empathy Providing personal understanding and customer support. Being on
the “customer’s side”;
Responsiveness Willingness to help and provide prompt service. Being flexible to
cater for customer specific needs.
Parasuraman, Zeithaml and Berry (1988)
The RATER framework consolidates the dimensions of customer process quality or “experience” into 5 key themes.
68
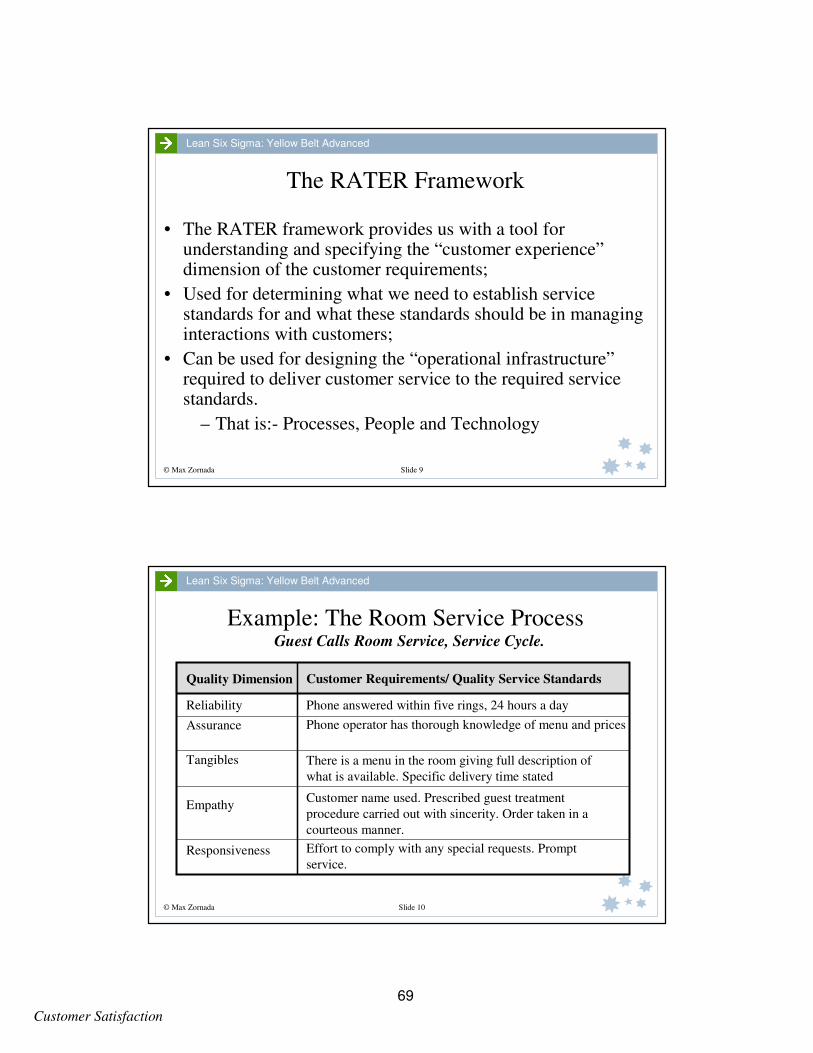
Customer Satisfaction
© Max Zornada Slide 9
Lean Six Sigma: Yellow Belt Advanced
The RATER Framework
• The RATER framework provides us with a tool for understanding and specifying the “customer experience”dimension of the customer requirements;
• Used for determining what we need to establish service standards for and what these standards should be in managing interactions with customers;
• Can be used for designing the “operational infrastructure”required to deliver customer service to the required service standards.
– That is:- Processes, People and Technology
© Max Zornada Slide 10
Lean Six Sigma: Yellow Belt Advanced
Example: The Room Service ProcessGuest Calls Room Service, Service Cycle.
Quality Dimension Customer Requirements/ Quality Service Standards
Responsiveness
Assurance
Tangibles
Empathy
Phone operator has thorough knowledge of menu and prices
There is a menu in the room giving full description of
what is available. Specific delivery time stated
Effort to comply with any special requests. Prompt
service.
Reliability Phone answered within five rings, 24 hours a day
Customer name used. Prescribed guest treatment
procedure carried out with sincerity. Order taken in a
courteous manner.
69
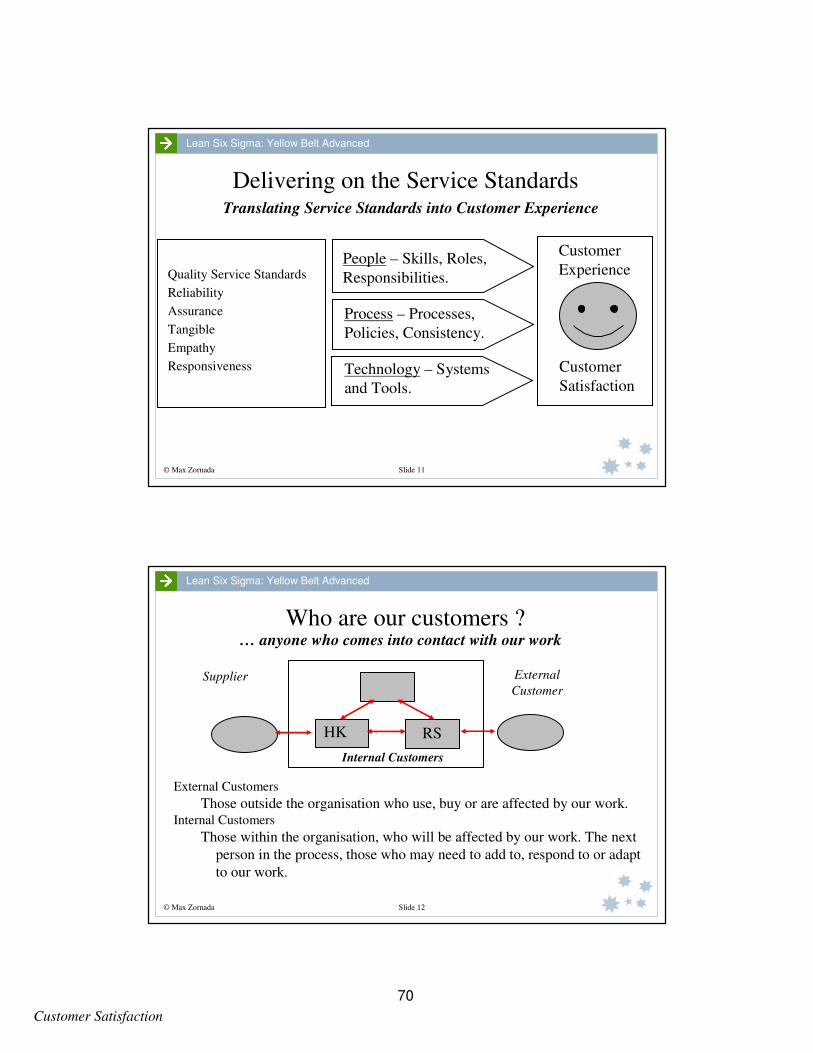
Customer Satisfaction
© Max Zornada Slide 11
Lean Six Sigma: Yellow Belt Advanced
Delivering on the Service StandardsTranslating Service Standards into Customer Experience
Quality Service Standards
Reliability
Assurance
Tangible
Empathy
Responsiveness
People – Skills, Roles,
Responsibilities.
Process – Processes,
Policies, Consistency.
Technology – Systems
and Tools.
Customer
Experience
Customer
Satisfaction
© Max Zornada Slide 12
Lean Six Sigma: Yellow Belt Advanced
Who are our customers ?
External
CustomerSupplier
Internal Customers
External Customers
Those outside the organisation who use, buy or are affected by our work.Internal Customers
Those within the organisation, who will be affected by our work. The next
person in the process, those who may need to add to, respond to or adapt
to our work.
… anyone who comes into contact with our work
RSHK
70

© Max Zornada Slide 1
Lean Six Sigma: Yellow Belt Advanced
Managing Perceptions of Quality
Service : .
Responsiveness
Assurance
Tangibles
Empathy
Reliability
Think of a customer contact point associated with a service you currently provide
to a customer(s).What experience will result in a satisfied customer?
Quality Dimension Customer Requirements/ Quality Service Standards
71

© Max Zornada Slide 2
Lean Six Sigma: Yellow Belt Advanced
72

© Max Zornada Slide 3
Lean Six Sigma: Yellow Belt Advanced
Using RATER to Design Service ProcessesWhat supporting operational infrastructure/capability will need to be provided to
consistently deliver the desired customer experience?
Responsiveness
Assurance
Tangibles
Empathy
Reliability
Quality DimensionSupporting Operational Infrastructure/Capability
People Process Technology
73

© Max Zornada Slide 4
Lean Six Sigma: Yellow Belt Advanced
74

Customer Satisfaction
© Max Zornada Slide 1
Lean Six Sigma: Yellow Belt Advanced
Impact of Customer Satisfaction on Loyalty
Typical results from loyalty studies, using a 5 point customer satisfaction rating to correlate satisfaction levels to
loyalty. Key loyalty testing questions “would you repurchase” and “would you recommend”.
Rating CategoryWould
Repurchase
Would
Recommend
Completely Satisfied 90% 96%
Somewhat Satisfied 56% 71%
Neither Satisfied Nor Dissatisfied 12% 19%
Somewhat Dissatisfied 3% 0%
Very Dissatisfied 7% 7%
© Max Zornada Slide 2
Lean Six Sigma: Yellow Belt Advanced
Understanding Customer Defection
• Dissatisfaction with existing provider;
• Expectation that another provider will satisfy them more;
• Changing life circumstances and changing needs.
75

Customer Satisfaction
© Max Zornada Slide 3
Lean Six Sigma: Yellow Belt Advanced
Managing Customer Experience
• Identify the elements of customer expectations you can control;
• Set expectation levels high enough to attract business, but accurately enough to reflect the reality of what is likely to be delivered 99.9% of the time (under-promise and over-deliver);
• Identify the elements of customer expectations you can’t control. Monitor and respond to changes;
• Identify areas where expectations are low and importance to the customer is high. Focus on improving/addressing these;
– Strategic gaps in the market that provide viable footholds.
• Customer expectations will increase with time - so should your ability to meet them. Plan for it!;
• Surprise is one way to exceed customer expectations. Promise what to expect, deliver more, sometimes surprise customers.
– e.g. “going the extra mile when it matters.
76
Process Measurement and Variation
77

78
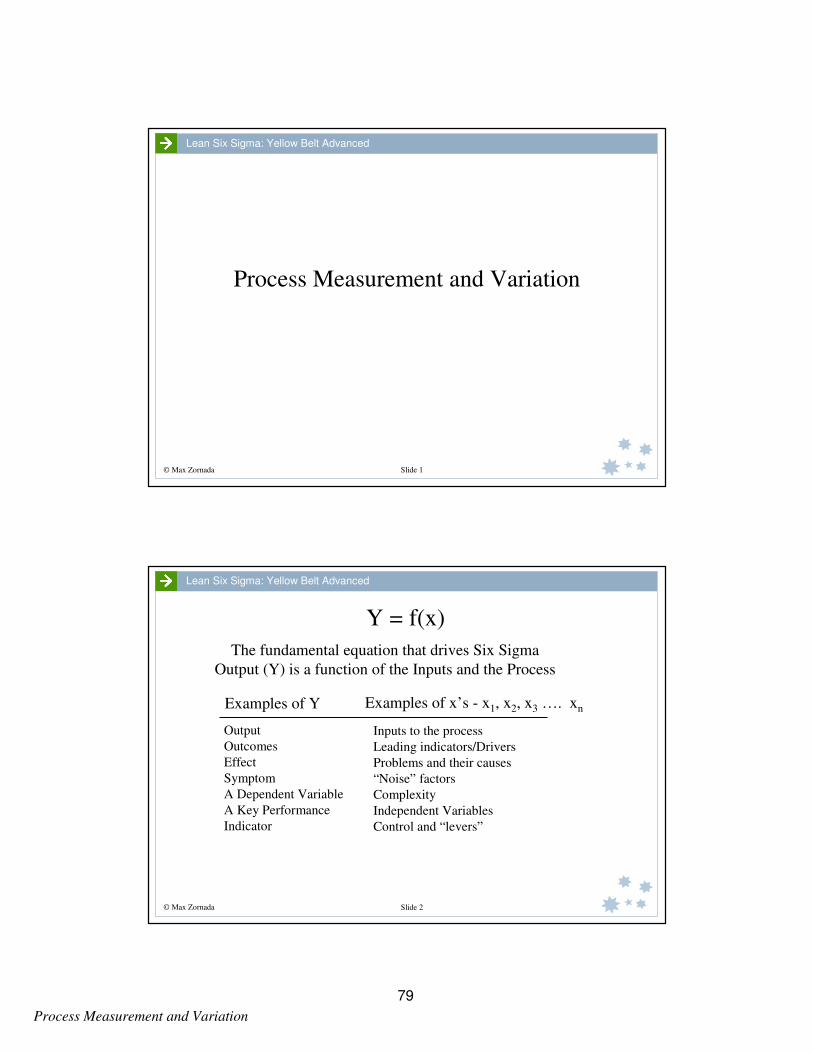
Process Measurement and Variation
© Max Zornada Slide 1
Lean Six Sigma: Yellow Belt Advanced
Process Measurement and Variation
© Max Zornada Slide 2
Lean Six Sigma: Yellow Belt Advanced
Y = f(x)
The fundamental equation that drives Six Sigma
Output (Y) is a function of the Inputs and the Process
Examples of Y
Output
Outcomes
Effect
Symptom
A Dependent Variable
A Key Performance
Indicator
Examples of x’s - x1, x2, x3 …. xn
Inputs to the process
Leading indicators/Drivers
Problems and their causes
“Noise” factors
Complexity
Independent Variables
Control and “levers”
79

Process Measurement and Variation
© Max Zornada Slide 3
Lean Six Sigma: Yellow Belt Advanced
Process Measurement: Y = f(x)
A draft “generic” template for process measurement
Customer Outcomes
Measures
•Delivery
•Quality
•Value
Internal Process
Outcomes Measures
•Time
•Cost
•Quality/Waste
Supplier Outcomes
Measures (Inputs)
•Delivery
•Quality
•Value
Process
Input Measures
Customer
Usually
the Y’s
Potential x’s found here
Leading Indicators
•Process specific issues
•Key Complexity Issues
•External to process issues
Some Y’s
also here.
Based on work by Richard Lynch and Kelvin Cross (1991)
For any process, the most appropriate measures
will be found in the following generic categories
CTP’s: Critical to the Process
CTQ’s: Critical
to the
Customer,
Market
© Max Zornada Slide 4
Lean Six Sigma: Yellow Belt Advanced
The Role of Complexity in determining measures
• Examining Complexity can help identify:
– Diagnostic measures:
• Measures that allow you to identify and quantify what is going wrong:-
– i.e.the x’s that are having a negative impact on process performance;
– “Drivers”:
• The key cause-and-effect relationships by which process performance can be
controlled or “driven”;
– i.e. the x’s that can be manipulated to give the desired Y
– Leading Indicators:
• Leading indicators, advance warning or predictors Y.
– i.e. the x’s that allow us to predict what Y will be some time later.
80
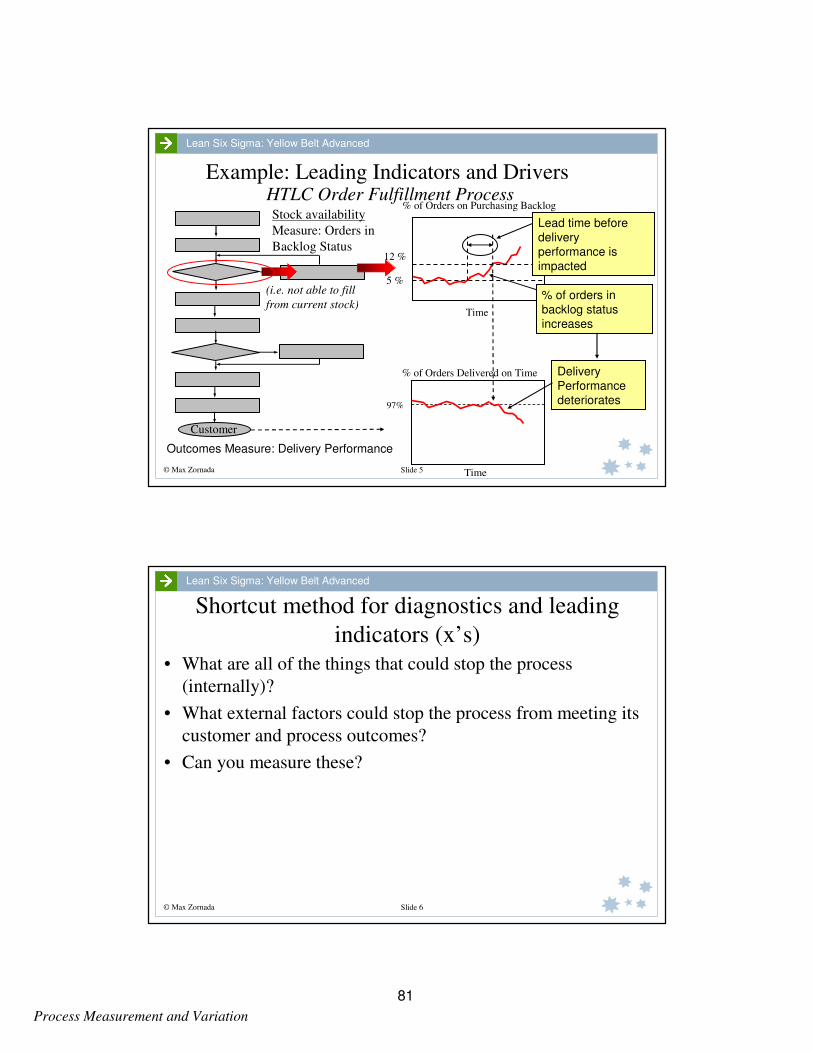
Process Measurement and Variation
© Max Zornada Slide 5
Lean Six Sigma: Yellow Belt Advanced
Example: Leading Indicators and DriversHTLC Order Fulfillment Process
Customer
Stock availability
Measure: Orders in
Backlog Status
% of Orders Delivered on Time
97%
Time
Time
% of Orders on Purchasing Backlog
5 %
12 %
Outcomes Measure: Delivery Performance
% of orders in
backlog status
increases
(i.e. not able to fill
from current stock)
Lead time before
delivery
performance is
impacted
Delivery
Performance
deteriorates
© Max Zornada Slide 6
Lean Six Sigma: Yellow Belt Advanced
Shortcut method for diagnostics and leading
indicators (x’s)
• What are all of the things that could stop the process
(internally)?
• What external factors could stop the process from meeting its
customer and process outcomes?
• Can you measure these?
81

Process Measurement and Variation
© Max Zornada Slide 7
Lean Six Sigma: Yellow Belt Advanced
Example: HTLC – From Measures to Metrics
What does Delivery
mean for this process
Generic Measure
Delivered and installed on the
date promised.
Number/% order delivered and
installed on time.
What does Quality
mean for this processCorrect equipment delivered
Complete order delivered
Equipment works
#/% incorrect deliveries#/% not delivered in full 1st time#/% service calls to repair new equip.#/% of returns for faulty equip
What does Value mean
for this processPricing meets customer
expectation
Customer satisfied with value
proposition
#/% of orders lost due to price.
Customer satisfaction
Measure Specific Metric
Similarly for Cost, Time
and Waste
Specify the
“generic measure”
What does the “generic measure”represent in specific terms for this
process.
What are some specific metrics –
things we can measure, count, collect data on, to quantify the measure?
© Max Zornada Slide 8
Lean Six Sigma: Yellow Belt Advanced
A Scalable Concept
External
Customer E
xte
r na
l S
upp
l ie r
s
But the specific measures developed will be different in each case, but
relevant to the sub-process selected.
Internal CustomerInternal Supplier
Workgroup A
SubprocessWorkgroup B
Sub-process
Customer
ProcessLeading
Indicators
SupplierCustomer
ProcessLeading
Indicators
Supplier
82

Process Measurement and Variation
© Max Zornada Slide 9
Lean Six Sigma: Yellow Belt Advanced
Processes deployed through the organisational structure
WorkgroupWorkgroup Workgroup Workgroup Workgroup
Senior Manager
ManagerManager
Responsibility for
major end-to-end
processes
Responsibility for
major sub-processes
Responsibility for
work processes/ sub-
processes
© Max Zornada Slide 10
Lean Six Sigma: Yellow Belt Advanced
Performance Measures and Organisation Structure
Warehouse Manager
Senior Manager
Logistics &
Service Manager
KPI Report
Customer Satisfaction
PI’s (Things that effect CSAT) Delivery Performance Quality of Installation
Quality of Product Order Accuracy
Senior Manager’s Y’s
Senior
Manager’s
x’s
Potential Causal Relationship
KPI Report
Delivery Performance
PI’s (Things that effect Delivery)
L&S Manager’s Y’s
Out of Stock Backlog Transport Availability
Credit Backlog Technician Availability
L & S
Manager’s
x’sPotential Causal Relationship
KPI Report
Out of Stock Backlog
PI’s (Things that effect Out of Stock)
Warehouse Manager’s Y’s
Order on Backorder
Orders for New Items
Warehouse
Manager’s
x’s
ActionsRevise and increase
level of stock holding
for an existing item if
necessary.
Add new item that is
not currently stocked
to stock holdings
Potential Causal Relationships
83

Process Measurement and Variation
© Max Zornada Slide 11
Lean Six Sigma: Yellow Belt Advanced
Performance Measures and Organisation Structure
Warehouse Manager
Senior Manager
Logistics &
Service Manager
KPI Report
Customer Satisfaction
PI’s (Things that effect CSAT) Delivery Performance Quality of Installation
Quality of Product Order Accuracy
Senior Manager’s Y’s
Senior
Manager’s
x’s
Potential Causal Relationship
KPI Report
Delivery Performance
PI’s (Things that effect Delivery)
L&S Manager’s Y’s
Out of Stock Backlog Transport Availability
Credit Backlog Technician Availability
L & S
Manager’s
x’sPotential Causal Relationship
KPI Report
Out of Stock Backlog
PI’s (Things that effect Out of Stock)
Warehouse Manager’s Y’s
Order on Backorder
Orders for New Items
Warehouse
Manager’s
x’s
ActionsRevise and increase
level of stock holding
for an existing item if
necessary.
Add new item that is
not currently stocked
to stock holdings
Potential Causal Relationships
WHY?WHY?
WHY?WHY?
WHY?WHY?
© Max Zornada Slide 12
Lean Six Sigma: Yellow Belt Advanced
Introduction to Variation and Flow Concepts
84
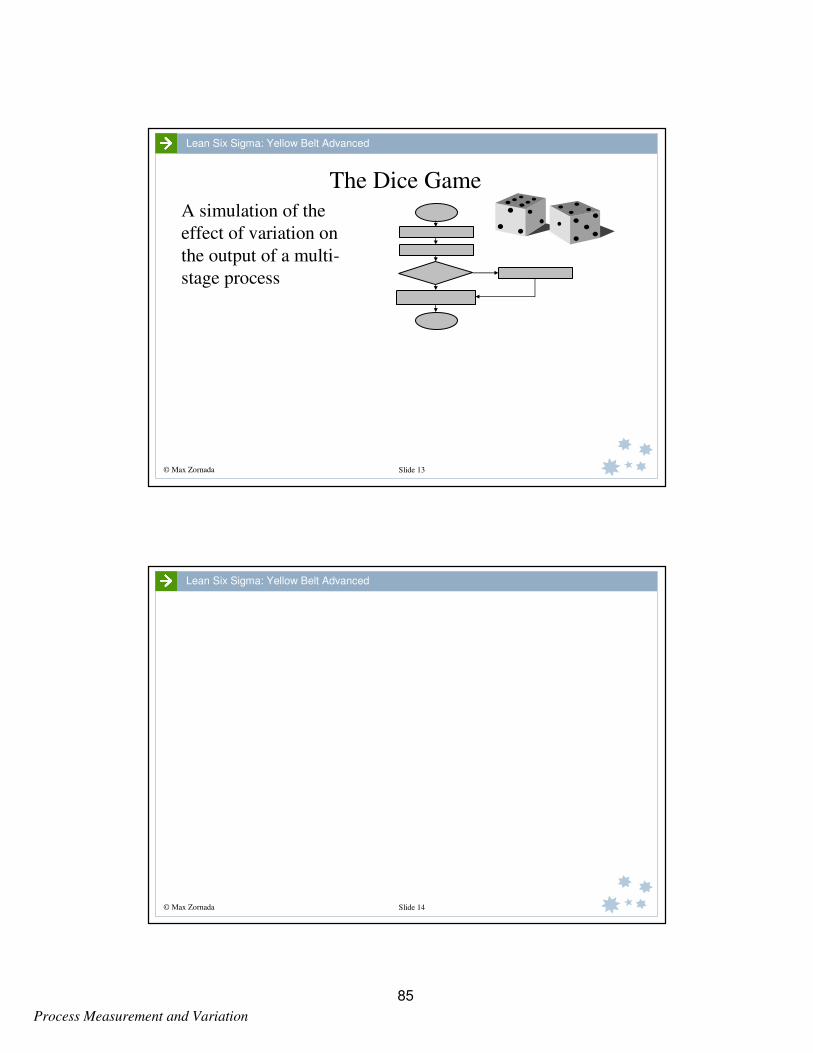
Process Measurement and Variation
© Max Zornada Slide 13
Lean Six Sigma: Yellow Belt Advanced
The Dice Game
A simulation of the
effect of variation on
the output of a multi-
stage process
© Max Zornada Slide 14
Lean Six Sigma: Yellow Belt Advanced
85

Process Measurement and Variation
© Max Zornada Slide 15
Lean Six Sigma: Yellow Belt Advanced
86
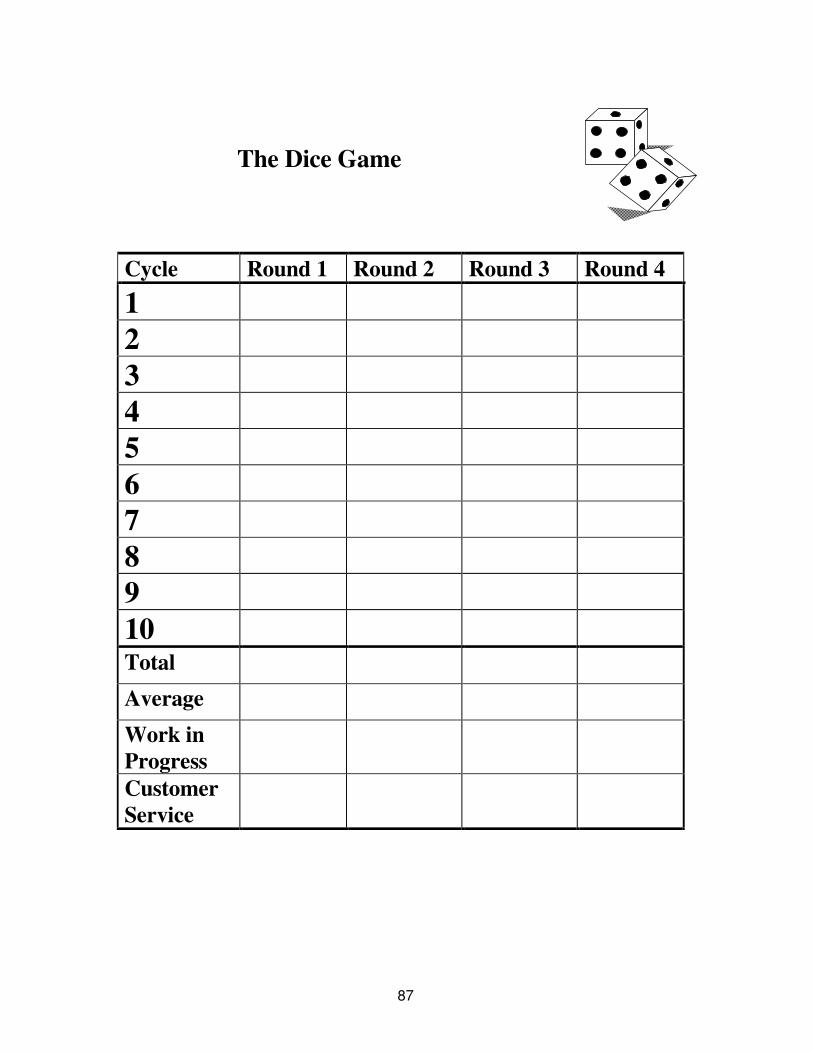
The Dice Game
Cycle Round 1 Round 2 Round 3 Round 4
1
2
3
4
5
6
7
8
9
10 Total Average Work in
Progress
Customer
Service
87

88
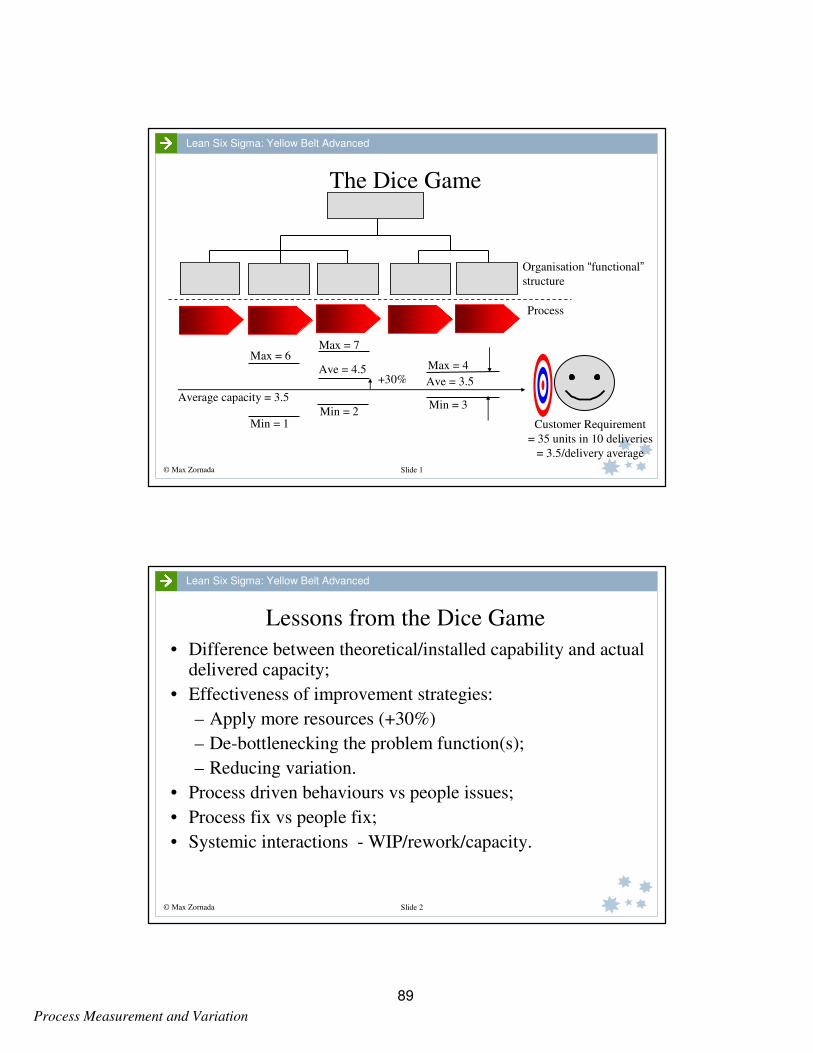
Process Measurement and Variation
© Max Zornada Slide 1
Lean Six Sigma: Yellow Belt Advanced
The Dice Game
Customer Requirement
= 35 units in 10 deliveries
= 3.5/delivery average
Organisation “functional”
structure
Process
Average capacity = 3.5
Min = 1
Max = 6
Min = 2
Max = 7
Ave = 4.5+30%
Min = 3
Max = 4
Ave = 3.5
© Max Zornada Slide 2
Lean Six Sigma: Yellow Belt Advanced
Lessons from the Dice Game
• Difference between theoretical/installed capability and actual delivered capacity;
• Effectiveness of improvement strategies:
– Apply more resources (+30%)
– De-bottlenecking the problem function(s);
– Reducing variation.
• Process driven behaviours vs people issues;
• Process fix vs people fix;
• Systemic interactions - WIP/rework/capacity.
89

Process Measurement and Variation
© Max Zornada Slide 3
Lean Six Sigma: Yellow Belt Advanced
Systemic interactions – a self-reinforcing system
Work in
progress
Pressure on
people
Errors and
failures
Rework
Capacity to
do work
© Max Zornada Slide 4
Lean Six Sigma: Yellow Belt Advanced
Some Sources of Variation
• Failures causing Rework and
Waste;
• Mistakes and Errors;
• Complexity;
• Poor in-process quality;
• Variation in inputs;
• Attempting to manage the
organisation through the functional
hierarchy vs across processes:-
– Lack of functional coordination across
processes;
– Mismatch between resourcing and
workloads and demand;
– Resource rigidity i.e. inability to move
resources across a process;
– Inappropriate response to “events”
– Etc., etc., …..
• “Lumpy”/unbalanced flows through
the process;
Problems Management
90

Process Measurement and Variation
© Max Zornada Slide 5
Lean Six Sigma: Yellow Belt Advanced
Understanding Variation
Dr. W.A. Shewhart, 1920's, found:
• All processes display variation;
• Some display controlled variation;
• Some display uncontrolled variation.
© Max Zornada Slide 6
Lean Six Sigma: Yellow Belt Advanced
Common vs Special Causes
Dr. W. Edwards Deming called this:
• Variation due to common causes. Due to the random
interaction of the many variables in the system or process.
These were purely random and are built in to the system.
People working in the system have no control over these.
They are effectively "prisoners" of the process.
• Variation due to special or assignable causes. Not a natural
part of the system. These could be traced to a specific event,
person, machine or localised condition.
91
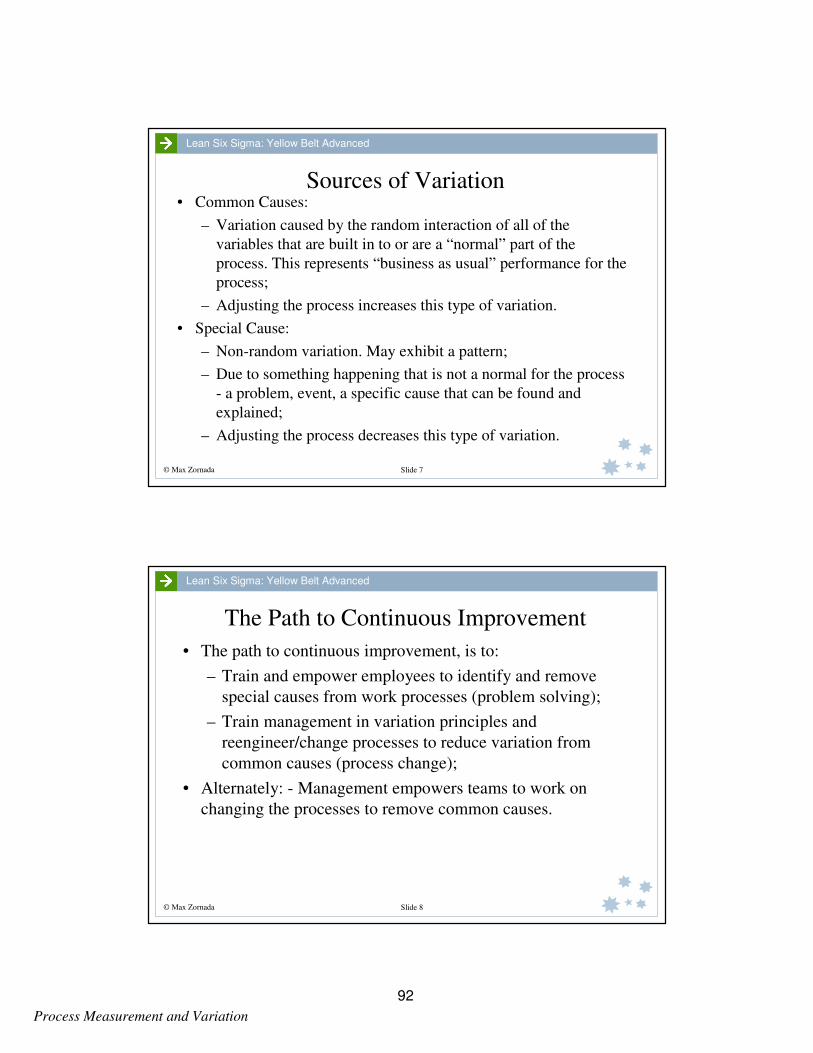
Process Measurement and Variation
© Max Zornada Slide 7
Lean Six Sigma: Yellow Belt Advanced
Sources of Variation• Common Causes:
– Variation caused by the random interaction of all of the
variables that are built in to or are a “normal” part of the
process. This represents “business as usual” performance for the
process;
– Adjusting the process increases this type of variation.
• Special Cause:
– Non-random variation. May exhibit a pattern;
– Due to something happening that is not a normal for the process
- a problem, event, a specific cause that can be found and
explained;
– Adjusting the process decreases this type of variation.
© Max Zornada Slide 8
Lean Six Sigma: Yellow Belt Advanced
The Path to Continuous Improvement
• The path to continuous improvement, is to:
– Train and empower employees to identify and remove
special causes from work processes (problem solving);
– Train management in variation principles and
reengineer/change processes to reduce variation from
common causes (process change);
• Alternately: - Management empowers teams to work on
changing the processes to remove common causes.
92
Process Measurement and Variation
© Max Zornada Slide 9
Lean Six Sigma: Yellow Belt Advanced
Understanding & Managing VariationStatistical Process Control
There is a whole “Body of Knowledge”, Tools and
Techniques derived from Shewharts work called
Statistical Process Control (SPC).
SPC provides tools and techniques for
measuring, understanding and managing
variation in processes.
SPC is outside the scope of the Yellow Belt
program.
© Max Zornada Slide 10
Lean Six Sigma: Yellow Belt Advanced
93

Process Measurement and Variation
© Max Zornada Slide 11
Lean Six Sigma: Yellow Belt Advanced
94

The DMAIC Process
Team Based Problem Solving
95

96
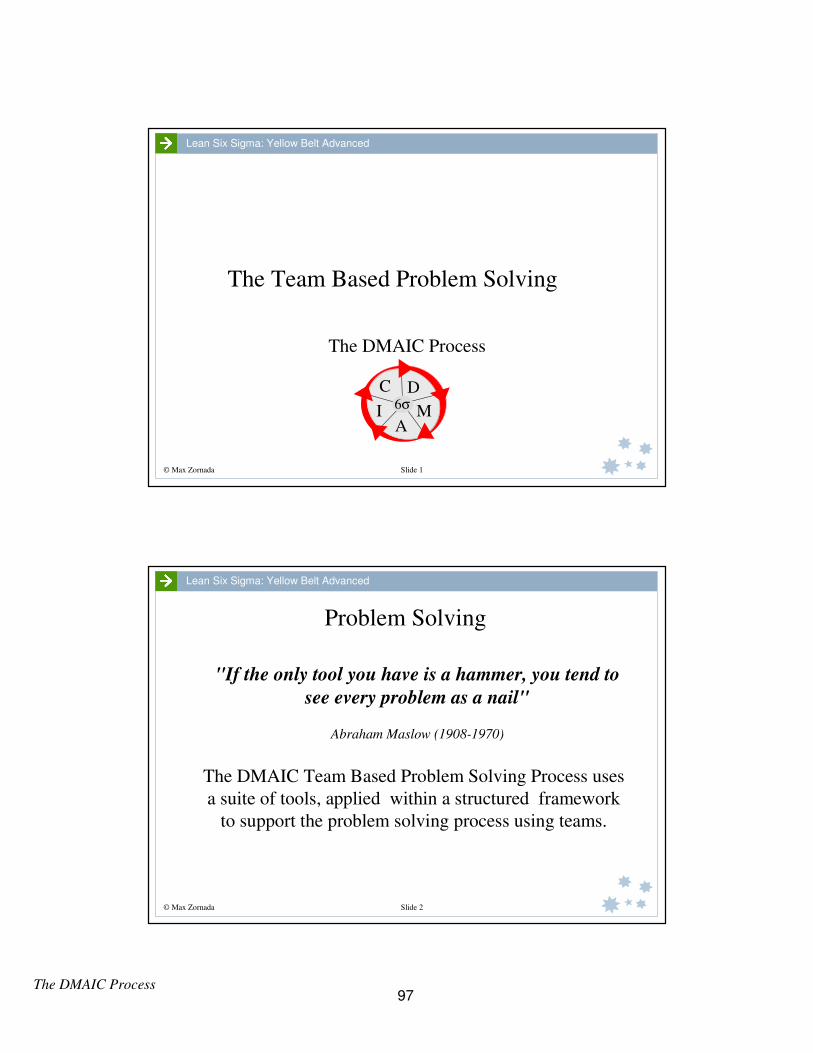
The DMAIC Process
© Max Zornada Slide 1
Lean Six Sigma: Yellow Belt Advanced
The Team Based Problem Solving
The DMAIC Process
6σ
D
MA
I
C
© Max Zornada Slide 2
Lean Six Sigma: Yellow Belt Advanced
Problem Solving
"If the only tool you have is a hammer, you tend to
see every problem as a nail"
Abraham Maslow (1908-1970)
The DMAIC Team Based Problem Solving Process uses
a suite of tools, applied within a structured framework
to support the problem solving process using teams.
97

The DMAIC Process
© Max Zornada Slide 3
Lean Six Sigma: Yellow Belt Advanced
Key Problem Solving Tools
• Process Mapping (flow charts);
• Brainstorming;
• Fishbone Diagram;
• Check Sheet;
• Pareto Chart;
• Potential Solutions Matrix.
© Max Zornada Slide 4
Lean Six Sigma: Yellow Belt Advanced
Types of Problem Solving
• Issues driven problem solving, where the focus is on solving a specific, clearly identifiable and obvious problem (or symptom). This is usually the case during the first few years of implementing a team based problem solving process where many long standing problems have been flushed out into the open;
• Process Improvement driven problem solving, where the process improvement process provides the impetus to analyse the way things are done and seek out problems to be solved.
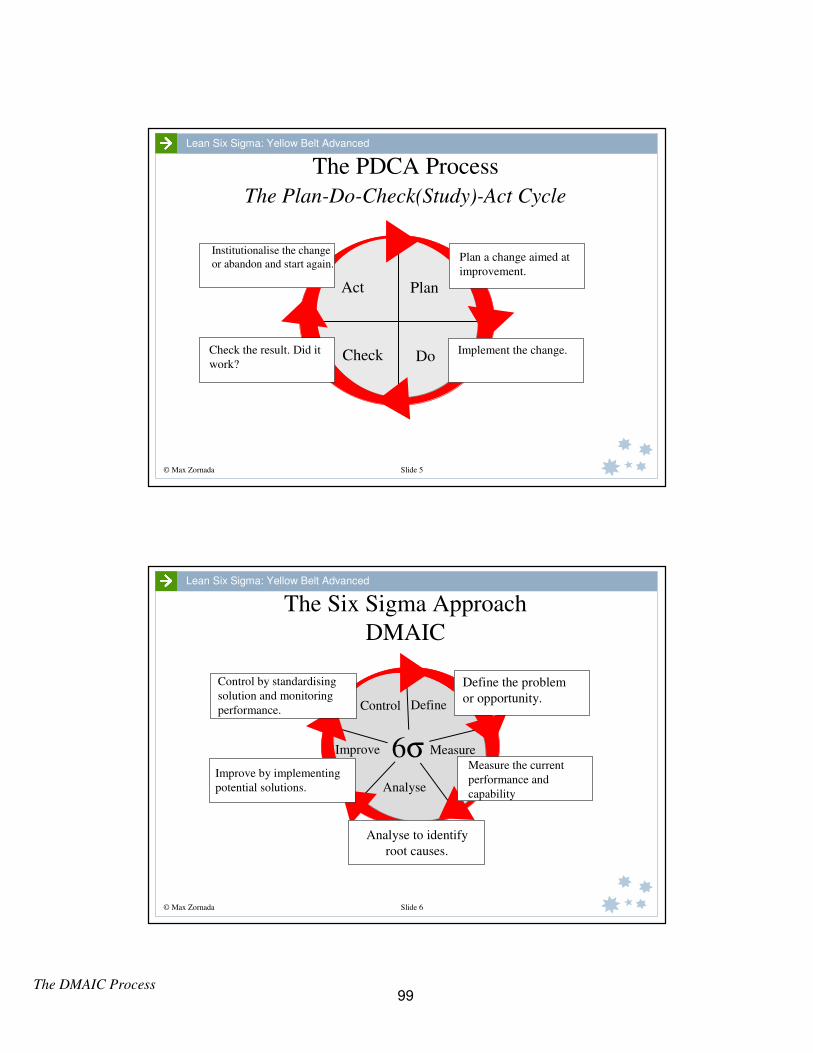
The DMAIC Process
© Max Zornada Slide 5
Lean Six Sigma: Yellow Belt Advanced
The PDCA Process
The Plan-Do-Check(Study)-Act Cycle
Plan
DoCheck
Act
Plan a change aimed at
improvement.
Implement the change.Check the result. Did it
work?
Institutionalise the change
or abandon and start again.
© Max Zornada Slide 6
Lean Six Sigma: Yellow Belt Advanced
The Six Sigma Approach
DMAIC
Define
Measure
Analyse
Improve
Control
6σ
Define the problem
or opportunity.
Measure the current
performance and
capability
Analyse to identify
root causes.
Improve by implementing
potential solutions.
Control by standardising
solution and monitoring
performance.
99
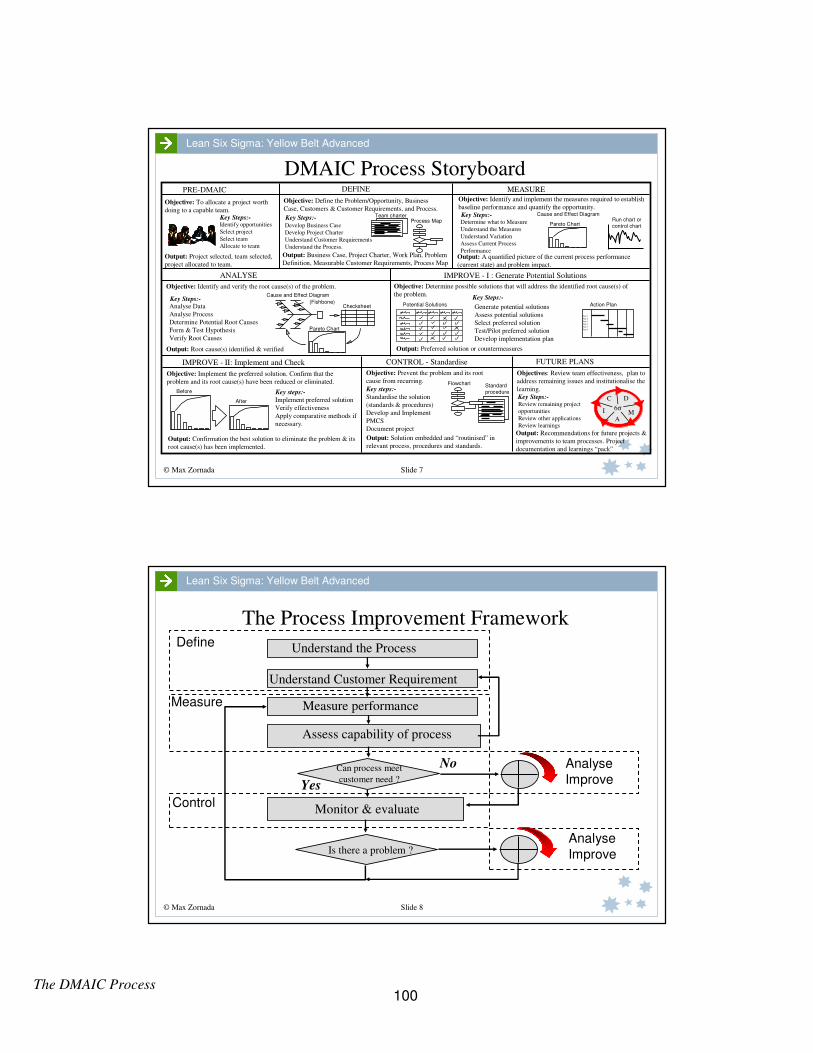
The DMAIC Process
© Max Zornada Slide 7
Lean Six Sigma: Yellow Belt Advanced
DMAIC Process Storyboard
Cause and Effect DiagramRun chart or
control chartProcess Map
Objective: Identify and implement the measures required to establish
baseline performance and quantify the opportunity.Objective: Define the Problem/Opportunity, Business
Case, Customers & Customer Requirements, and Process.Objective: To allocate a project worth
doing to a capable team.
Output: Project selected, team selected,
project allocated to team.
Develop Business Case
Develop Project Charter
Understand Customer Requirements
Understand the Process.
PRE-DMAIC DEFINE MEASURE
ANALYSE
Output: A quantified picture of the current process performance
(current state) and problem impact.
Key Steps:- Key Steps:-
IMPROVE - I : Generate Potential Solutions
Output: Business Case, Project Charter, Work Plan, Problem
Definition, Measurable Customer Requirements, Process Map
Team charter
Objective: Identify and verify the root cause(s) of the problem.
Objective: Implement the preferred solution. Confirm that the
problem and its root cause(s) have been reduced or eliminated.
Implement preferred solution
Verify effectiveness
Apply comparative methods if
necessary.
Objective: Prevent the problem and its root
cause from recurring.
Standardise the solution
(standards & procedures)
Develop and Implement
PMCS
Document project
Analyse Data
Analyse Process
Determine Potential Root Causes
Form & Test Hypothesis
Verify Root Causes
Key Steps:-
Objective: Determine possible solutions that will address the identified root cause(s) of
the problem.
Generate potential solutions
Assess potential solutions
Select preferred solution
Test/Pilot preferred solution
Develop implementation plan
Before
After
Key steps:-
Flowchart Standard
procedure
Output: Solution embedded and “routinised” in
relevant process, procedures and standards.
Key steps:-
Objectives: Review team effectiveness, plan to
address remaining issues and institutionalise the
learning.
Output: Recommendations for future projects &
improvements to team processes. Project
documentation and learnings “pack”
IMPROVE - II: Implement and Check
Review remaining project
opportunities
Review other applications
Review learnings
C D
MA
I 6σ
CONTROL - Standardise FUTURE PLANS
Output: Root cause(s) identified & verified
Cause and Effect Diagram
(Fishbone)Checksheet
Pareto Chart
Output: Preferred solution or countermeasures
Key Steps:-
Output: Confirmation the best solution to eliminate the problem & its
root cause(s) has been implemented.
Potential Solutions
Key Steps:-
Action Plan
Step 1
Step 2
Step 3
Step 4
Step 5
Step 6
Identify opportunities
Select project
Select team
Allocate to team
Key Steps:-Determine what to Measure
Understand the Measures
Understand Variation
Assess Current Process
Performance
Pareto Chart
© Max Zornada Slide 8
Lean Six Sigma: Yellow Belt Advanced
The Process Improvement FrameworkDefine
Measure
Control
Analyse
Improve
Analyse
Improve
Yes
No
Understand the Process
Understand Customer Requirement
Measure performance
Assess capability of process
Monitor & evaluate
Can process meet
customer need ?
Is there a problem ?
100
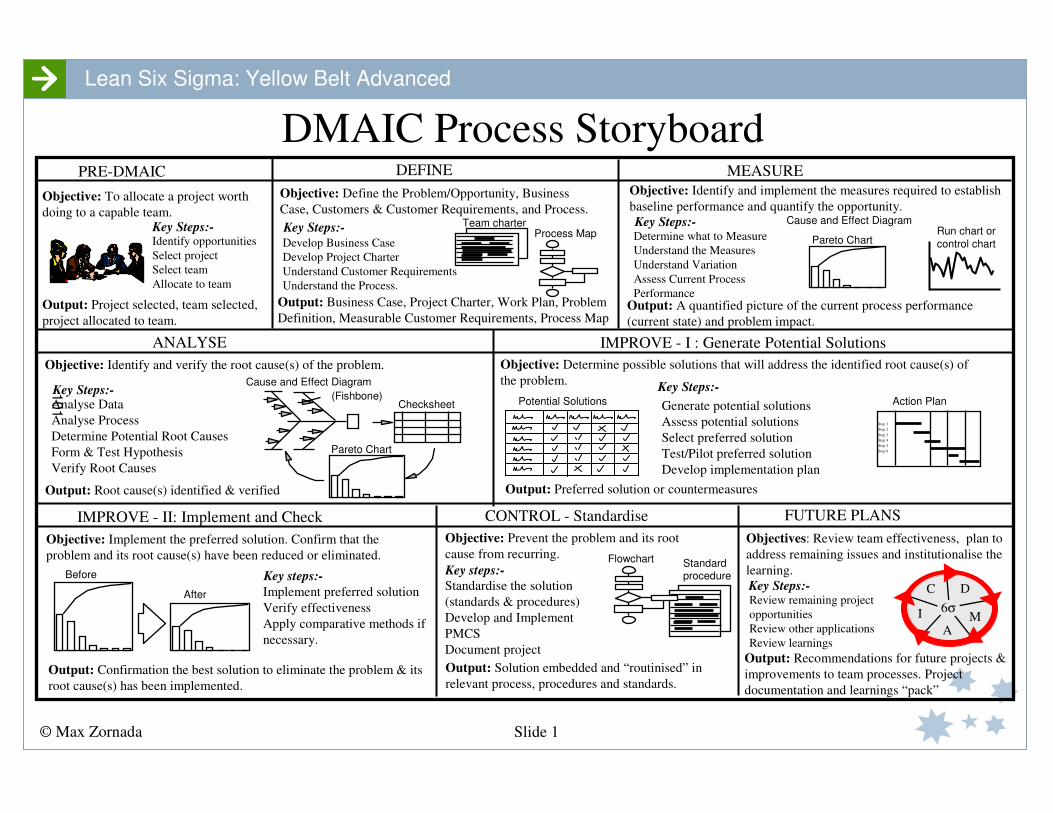
© Max Zornada Slide 1
Lean Six Sigma: Yellow Belt Advanced
DMAIC Process Storyboard
Cause and Effect DiagramRun chart or
control chartProcess Map
Objective: Identify and implement the measures required to establish
baseline performance and quantify the opportunity.Objective: Define the Problem/Opportunity, Business
Case, Customers & Customer Requirements, and Process.Objective: To allocate a project worth
doing to a capable team.
Output: Project selected, team selected,
project allocated to team.
Develop Business Case
Develop Project Charter
Understand Customer Requirements
Understand the Process.
PRE-DMAIC DEFINE MEASURE
ANALYSE
Output: A quantified picture of the current process performance
(current state) and problem impact.
Key Steps:- Key Steps:-
IMPROVE - I : Generate Potential Solutions
Output: Business Case, Project Charter, Work Plan, Problem
Definition, Measurable Customer Requirements, Process Map
Team charter
Objective: Identify and verify the root cause(s) of the problem.
Objective: Implement the preferred solution. Confirm that the
problem and its root cause(s) have been reduced or eliminated.
Implement preferred solution
Verify effectiveness
Apply comparative methods if
necessary.
Objective: Prevent the problem and its root
cause from recurring.
Standardise the solution
(standards & procedures)
Develop and Implement
PMCS
Document project
Analyse Data
Analyse Process
Determine Potential Root Causes
Form & Test Hypothesis
Verify Root Causes
Key Steps:-
Objective: Determine possible solutions that will address the identified root cause(s) of
the problem.
Generate potential solutions
Assess potential solutions
Select preferred solution
Test/Pilot preferred solution
Develop implementation plan
Before
After
Key steps:-
Flowchart Standard procedure
Output: Solution embedded and “routinised” in
relevant process, procedures and standards.
Key steps:-
Objectives: Review team effectiveness, plan to
address remaining issues and institutionalise the
learning.
Output: Recommendations for future projects &
improvements to team processes. Project
documentation and learnings “pack”
IMPROVE - II: Implement and Check
Review remaining project
opportunities
Review other applications
Review learnings
C D
MA
I 6σ
CONTROL - Standardise FUTURE PLANS
Output: Root cause(s) identified & verified
Cause and Effect Diagram
(Fishbone)Checksheet
Pareto Chart
Output: Preferred solution or countermeasures
Key Steps:-
Output: Confirmation the best solution to eliminate the problem & its
root cause(s) has been implemented.
Potential Solutions
Key Steps:-
Action Plan
Step 1
Step 2
Step 3
Step 4
Step 5
Step 6
Identify opportunities
Select project
Select team
Allocate to team
Key Steps:-Determine what to Measure
Understand the Measures
Understand Variation
Assess Current Process
Performance
Pareto Chart
101
© Max Zornada Slide 2
Lean Six Sigma: Yellow Belt Advanced
102
Case Study South Eastern Food Packagers
103

South Eastern Food Packagers
104
South Eastern Food Packagers
Case Study South Eastern Food Packagers
Case Q05041/1.4
Background
South Eastern Food Packagers (SEFP)* are a division of a large food processing and distribution organisation. They operate a processed food packaging and palletising facility in the South Eastern Region.
“Bulk Packs” of packaged food products such as dried fruits, nuts etc. are received from other divisions or external suppliers. SEFP pack these into boxes or bags which are then palletised for distribution to customers. Their main customers are supermarket chains and food wholesalers.
SEFP packs and ships product to a schedule compiled from customer orders reflecting their required-by dates. If these dates are not met there is the risk of stockouts in their customers’ supply chains. The products packed by SEFP have varying shelf-lives and they are required to ship products such that at least two thirds of the time until the use-by date is available to
their customers.
Costs competitiveness is also critical, most of the products packaged by SEPF are low value products and so the packaging and distribution component can be significant.
Problems with the Cardboard Box Packing Process
A major part of SEFP’s operations was the cardboard box packing process. The growth in overall volumes and range of products packed had led to a gradual increase in packaging
costs.
SEFP recovered such increases by way of an annual contract price review with all customers. Although customers usually complained about any price increases, the incremental annual increases had always been accepted by customers as one of the realities of business.
As the end of the current budget year loomed, SEFP’s management were reviewing their costs to determine pricing for the forthcoming year. This internal price setting process was
disrupted by the receipt of a “formal” letter from one of their key customers specifying a target price, which if not met would lead to non-renewal of their contract.
* This case was prepared by Max Zornada as the basis for class discussion rather than to illustrate either
effective or ineffective handling of an administrative situation. Copyright © Henley Management Group Pty
Ltd, 2011
The objective of the case is to provide participants with a feel of what it is like to be a member of a Six
Sigma team, using the DMAIC process to solve an operational problem and to give team members some
exposure and practice at using key problem solving/improvement tools and techniques.
105

South Eastern Food Packagers
A second major customer had also advised SEFP through their Account Manager, that they would not be accepting further price increases this year, and unless a 10% price reduction could be delivered by next year’s price review, they would also not renew their contract and bring their packaging back inhouse.
Together, these two customers represented more than 50% of SEFP’s business. SEFP management suspected that at their current pricing levels, they would be unable to attract new customers to replace these if they were lost.
The cost of packaging had clearly become a customer priority.
In the short-term, SEFP would need to price to meet their customer’s requirements. However, given their current costs, this would not be sustainable in the long-term. The pricing structure offered to their customers would need to be supported by real internal reduction in box packaging costs, through improvements to the process.
Competitor benchmarking and customer feedback suggested that if a target Packaging Cost or $2.75 per box could be achieved, SEFP would meet both customers’ price objectives and
their own profit objectives.
Unfortunately, the actual cost of packaging currently stood at $3.09/box. (See Table 1, below).
A preliminary review of SEFP's Operational Statistics (See Table 1) reinforced the belief that waste reduction offered a major opportunity for improvement. Management believed that the cost of waste could be halved in the short to medium term, and reduced even more in the longer term.
Description Amount
Boxes packed/shipped per day 8,626
Cost of Contents $22.00
Distribution Costs $2.43
Packaging Costs $3.09
Delivered cost per box $27.52
Labour Costs $2,344,000
Operations Materials $1,200,000
Maintenance Materials $672,000
Energy and Utilities $400,000
Other Costs $100,000
Waste $1,629,835
General and Administration $150,000
Total Cost $6,495,835
Table 1: SEFP Operational Statistics (Note: Facility Operates 244 days/year)
106
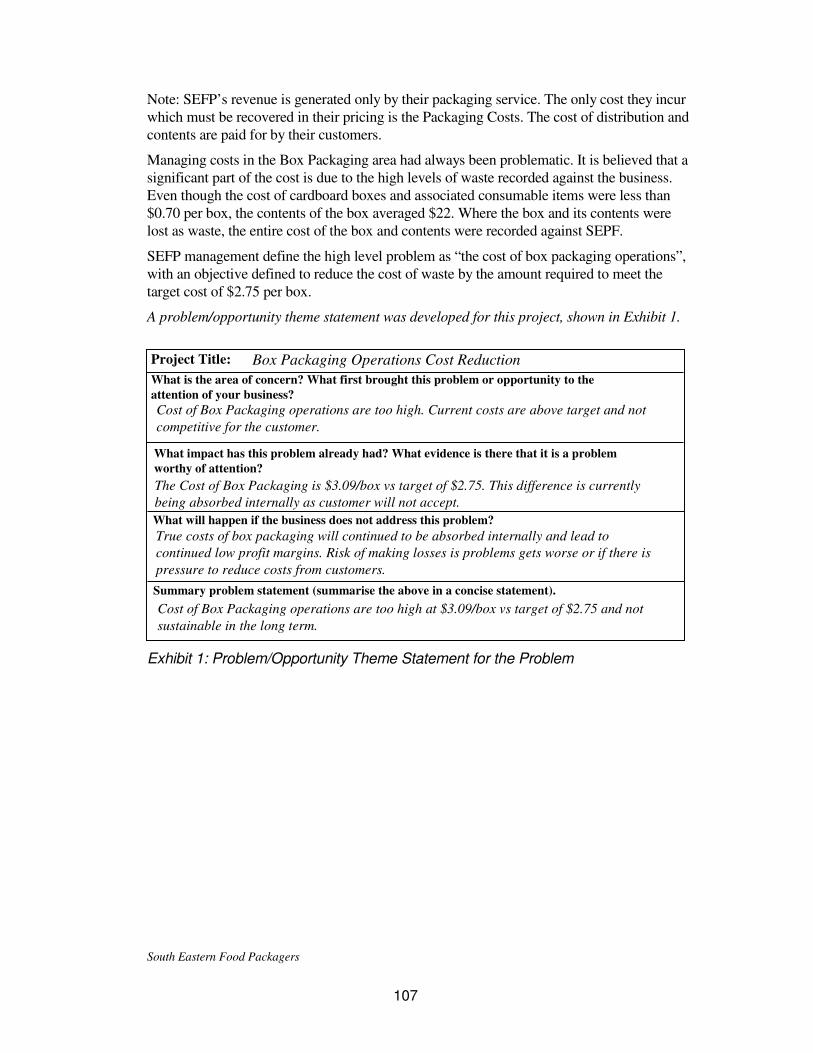
South Eastern Food Packagers
Note: SEFP’s revenue is generated only by their packaging service. The only cost they incur which must be recovered in their pricing is the Packaging Costs. The cost of distribution and contents are paid for by their customers.
Managing costs in the Box Packaging area had always been problematic. It is believed that a significant part of the cost is due to the high levels of waste recorded against the business. Even though the cost of cardboard boxes and associated consumable items were less than $0.70 per box, the contents of the box averaged $22. Where the box and its contents were lost as waste, the entire cost of the box and contents were recorded against SEPF.
SEFP management define the high level problem as “the cost of box packaging operations”, with an objective defined to reduce the cost of waste by the amount required to meet the target cost of $2.75 per box.
A problem/opportunity theme statement was developed for this project, shown in Exhibit 1.
Exhibit 1: Problem/Opportunity Theme Statement for the Problem
What is the area of concern? What first brought this problem or opportunity to the
attention of your business?
Summary problem statement (summarise the above in a concise statement).
Project Title: Box Packaging Operations Cost Reduction
Cost of Box Packaging operations are too high. Current costs are above target and not
competitive for the customer.
The Cost of Box Packaging is $3.09/box vs target of $2.75. This difference is currently
being absorbed internally as customer will not accept.
Cost of Box Packaging operations are too high at $3.09/box vs target of $2.75 and not
sustainable in the long term.
What will happen if the business does not address this problem?
True costs of box packaging will continued to be absorbed internally and lead to
continued low profit margins. Risk of making losses is problems gets worse or if there is
pressure to reduce costs from customers.
What impact has this problem already had? What evidence is there that it is a problem
worthy of attention?
107
South Eastern Food Packagers
The Improvement Team
An improvement team was formed to look at ways of reducing the cost of waste.
The team members included:
• The Packaging Area Manager (Team Leader)
• A Senior Marketing Officer, who is usually responsible for dealing with customers who return boxes and arranging credits to their accounts;
• The Quality Control Officer
• Two packaging line Operators;
• The packaging line Supervisor;
• A member of the Operational Excellence Support team to mentor and coach the team.
The Define Stage
The Business Case and Project Charter
At their first meeting, the team reviewed the initial problem theme statement and the operational data. They developed a formal Project Charter for the project, which included formalising the problem statement, problem objective and business case statement for the project.
They confirmed that the cost of waste was a significant and actionable cost – currently
standing at 25% of total costs. A 44% reduction on this initial baseline would allow them to achieve the target $2.75 per box.
The Project Charter for this project is shown in Exhibit 2.
108
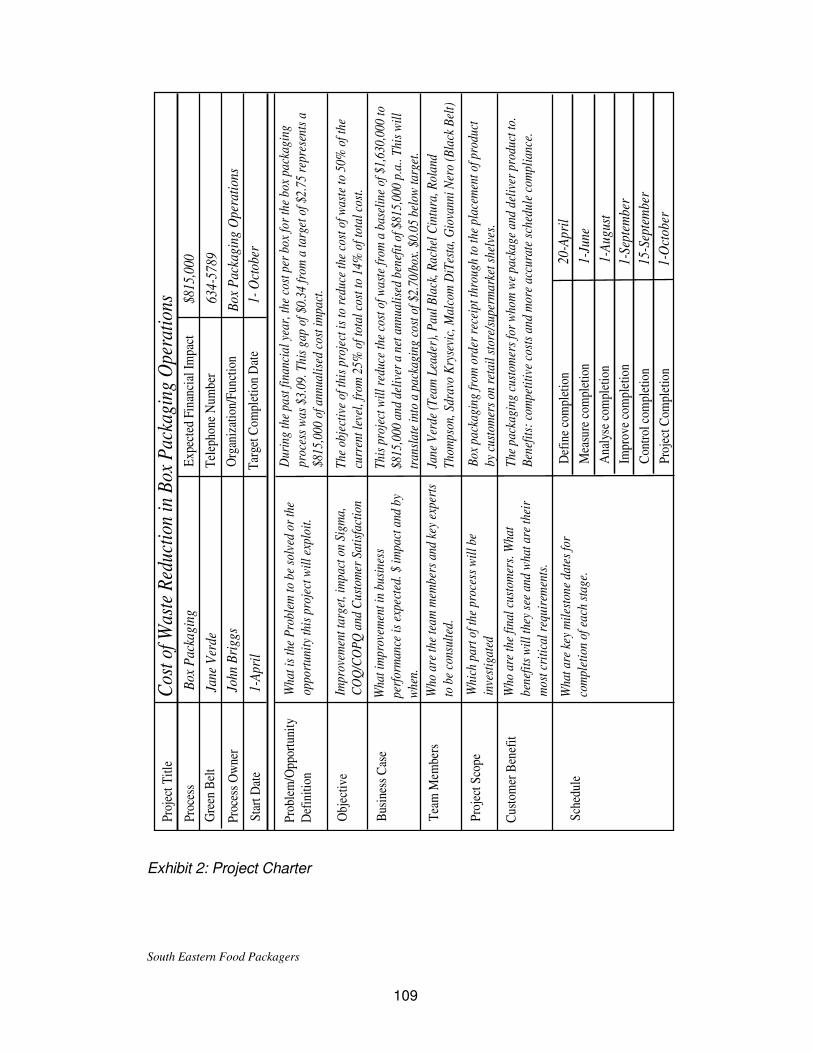
South Eastern Food Packagers
Exhibit 2: Project Charter
Pro
cess
Gre
en B
elt
Pro
cess
Ow
ner
Sta
rt D
ate
Pro
ject
Tit
le
Obj
ecti
ve
Pro
blem
/Opp
ortu
nity
Def
init
ion
Bus
ines
s C
ase
Tea
m M
embe
rs
Cus
tom
er B
enef
it
Sch
edul
e
Wha
t is
the
Pro
blem
to b
e so
lved
or
the
oppo
rtun
ity
this
pro
ject
wil
l exp
loit
.
Pro
ject
Sco
pe
Impr
ovem
ent t
arge
t, im
pact
on
Sigm
a,
CO
Q/C
OP
Q a
nd C
usto
mer
Sat
isfa
ctio
n
Wha
t im
prov
emen
t in
busi
ness
perf
orm
ance
is e
xpec
ted.
$ im
pact
and
by
whe
n.
Who
are
the
team
mem
bers
and
key
exp
erts
to b
e co
nsul
ted.
Whi
ch p
art o
f the
pro
cess
wil
l be
inve
stig
ated
Who
are
the
fina
l cu
stom
ers.
Wha
t
bene
fits
wil
l the
y se
e an
d w
hat a
re th
eir
mos
t cri
tica
l req
uire
men
ts.
Wha
t are
key
mil
esto
ne d
ates
for
com
plet
ion
of e
ach
stag
e.
Jane
Ver
de
John
Bri
ggs
1-A
pril
Box
Pac
kagi
ngE
xpec
ted
Fin
anci
al I
mpa
ct
Tel
epho
ne N
umbe
r
Org
aniz
atio
n/F
unct
ion
Tar
get C
ompl
etio
n D
ate
The
obj
ecti
ve o
f thi
s pr
ojec
t is
to r
educ
e th
e co
st o
f was
te to
50%
of t
he
curr
ent l
evel
, fro
m 2
5% o
f tot
al c
ost t
o 14
% o
f tot
al c
ost.
634-
5789
Box
Pac
kagi
ng O
pera
tion
s
1-O
ctob
er
$815
,000
Jane
Ver
de (
Tea
m L
eade
r), P
aul B
lack
, Rac
hel C
intu
ra, R
olan
d
Tho
mps
on, S
drav
oK
ryse
vic,
Mal
com
DiT
esta
, Gio
vann
i Ner
o (B
lack
Bel
t)
Box
pac
kagi
ng fr
om o
rder
rec
eipt
thro
ugh
to th
e pl
acem
ent o
f pro
duct
by c
usto
mer
s on
ret
ail s
tore
/sup
erm
arke
t she
lves
.
20-A
pril
Thi
s pr
ojec
t wil
l red
uce
the
cost
of w
aste
from
a b
asel
ine
of $
1,63
0,00
0 to
$815
,000
and
del
iver
a n
et a
nnua
lise
dbe
nefi
t of $
815,
000
p.a.
. Thi
s w
ill
tran
slat
e in
to a
pac
kagi
ng c
ost o
f $2.
70/b
ox. $
0.05
bel
ow ta
rget
.
The
pac
kagi
ng c
usto
mer
s fo
r w
hom
we
pack
age
and
deli
ver
prod
uct t
o.
Ben
efit
s: c
ompe
titi
ve c
osts
and
mor
e ac
cura
te s
ched
ule
com
plia
nce.
1-Ju
ne
1-A
ugus
t
1-Se
ptem
ber
15-S
epte
mbe
r
1-O
ctob
er
Def
ine
com
plet
ion
Mea
sure
com
plet
ion
Ana
lyse
com
plet
ion
Impr
ove
com
plet
ion
Con
trol
com
plet
ion
Pro
ject
Com
plet
ion
Cos
t of W
aste
Red
ucti
on in
Box
Pac
kagi
ng O
pera
tion
s
Dur
ing
the
past
fina
ncia
l yea
r, th
e co
st p
er b
ox fo
r th
e bo
x pa
ckag
ing
proc
ess
was
$3.
09. T
his
gap
of $
0.34
from
a ta
rget
of $
2.75
rep
rese
nts
a
$815
,000
of a
nnua
lise
dco
st im
pact
.
109
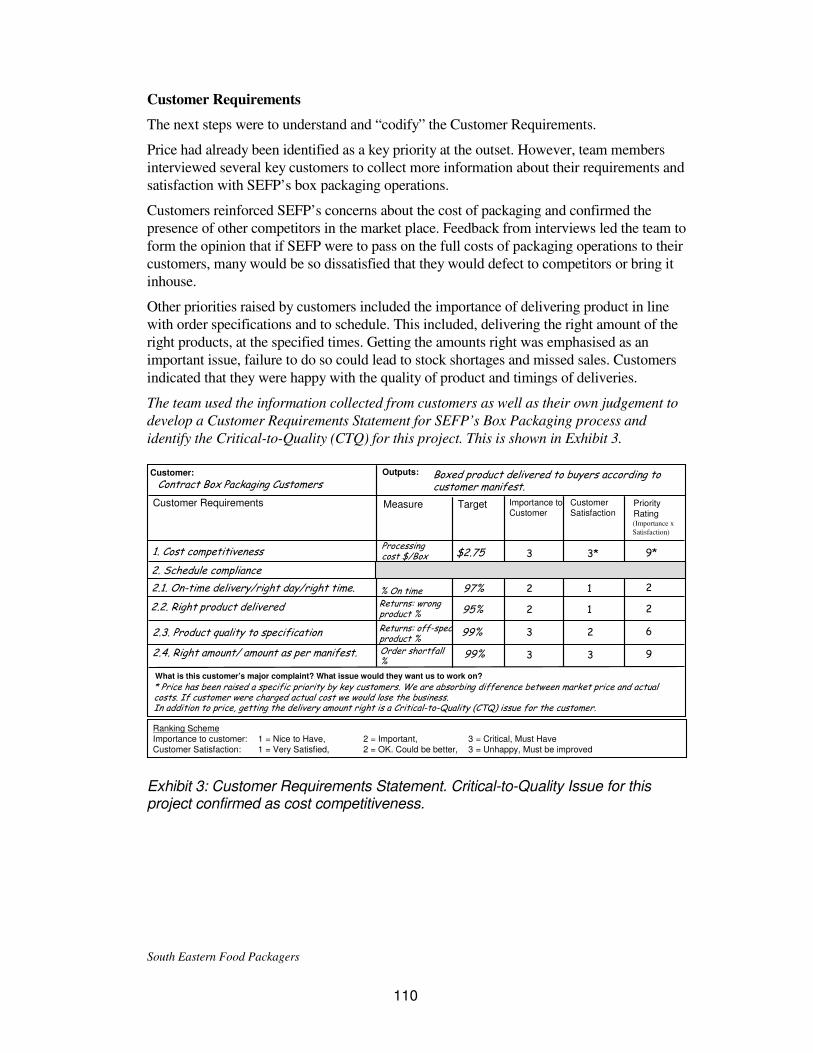
South Eastern Food Packagers
Customer Requirements
The next steps were to understand and “codify” the Customer Requirements.
Price had already been identified as a key priority at the outset. However, team members interviewed several key customers to collect more information about their requirements and satisfaction with SEFP’s box packaging operations.
Customers reinforced SEFP’s concerns about the cost of packaging and confirmed the presence of other competitors in the market place. Feedback from interviews led the team to
form the opinion that if SEFP were to pass on the full costs of packaging operations to their customers, many would be so dissatisfied that they would defect to competitors or bring it inhouse.
Other priorities raised by customers included the importance of delivering product in line with order specifications and to schedule. This included, delivering the right amount of the right products, at the specified times. Getting the amounts right was emphasised as an important issue, failure to do so could lead to stock shortages and missed sales. Customers
indicated that they were happy with the quality of product and timings of deliveries.
The team used the information collected from customers as well as their own judgement to
develop a Customer Requirements Statement for SEFP’s Box Packaging process and
identify the Critical-to-Quality (CTQ) for this project. This is shown in Exhibit 3.
Exhibit 3: Customer Requirements Statement. Critical-to-Quality Issue for this project confirmed as cost competitiveness.
What is this customer’s major complaint? What issue would they want us to work on?
Customer Requirements
1. Cost competitiveness
Contract Box Packaging Customers
2. Schedule compliance
2.1. On-time delivery/right day/right time.
2.2. Right product delivered
2.3. Product quality to specification
2.4. Right amount/ amount as per manifest.
Ranking SchemeImportance to customer: 1 = Nice to Have, 2 = Important, 3 = Critical, Must HaveCustomer Satisfaction: 1 = Very Satisfied, 2 = OK. Could be better, 3 = Unhappy, Must be improved
* Price has been raised a specific priority by key customers. We are absorbing difference between market price and actual costs. If customer were charged actual cost we would lose the business.In addition to price, getting the delivery amount right is a Critical-to-Quality (CTQ) issue for the customer.
3 3* 9*
2 1 2
2 1 2
3 2 6
$2.75
97%
95%
99%
99% 3 3 9
Outputs: Customer:
Measure Importance to Customer
Customer Satisfaction
Boxed product delivered to buyers according to customer manifest.
(Importance x
Satisfaction)
Target
Processing cost $/Box
Returns: wrong product %
Returns: off-spec product %
PriorityRating
% On time
Order shortfall %
110

South Eastern Food Packagers
Understanding the Process
The next stage was to understand the process that was at the core of the improvement opportunity.
The team members spent a week familiarising themselves with the way the cardboard packing processes worked. A write up of the key steps in the process is given in Exhibit 4.a.
A schematic representation of the overall supply chain is given in Exhibit 4.b.
A copy of the process map is shown in Exhibit 4.c.
Question
From the map of the process, what data would you collect in order to assess the overall
performance of the process and quantify the extent of any problems? i.e. diagnostic
measures?
111

South Eastern Food Packagers
Exhibit 4.a. The Cardboard Box Packaging Process
The process started with the receipt of a customer order. The scheduler consolidated all orders received to produce a daily schedule. This determined the contents and configuration of product "bulk packs" required at the Filling Stations. There were three filling stations, which provided greater flexibility in the range of products that could be packed at the same time - this also simplified scheduling and bulk pack replenishment.
On the shop-floor, bulk packs were loaded onto the Filler Stations and cardboard “flats” pre-cut and pre-printed with the appropriate branding and artwork was loaded into the Flat-Feeder all as specified on the schedule. The Flat-Feeder automatically fed “flats” into the Box Folding Machine as required. The Box Folder folded the bottom and sides, leaving the top open. Occasionally, a box became jammed and was damaged before it was fully folded. In such cases, the operator manually stopped and cleared the machine, then restarted the process.
The formed box moved along to the Filler Stations, where the contents - small pre-wrapped packs, dropped down a chute into the box. The chute was weight activated, ensuring the contents of each box met the box weight specifications. Depending on requirements, a box might be completely filled by one filler or move along receiving partial loads from the different fillers to make up a "variety box".
The box moved to the automatic Weighing station. Under-weight boxes triggered an alarm and were manually removed from the line. (Both the contents and the box were recycled back into the process). Overweight boxes had product manually removed from them by the operator until the correct weight was reached. The box next moved to the Lid Seal & Close station, where the top of the box was closed and sealed.
Boxes moved out from Lid Seal & Close along a short conveyor and into a chute which aligned the box’s orientation as it went into the Print station, where two inkjet printers printed the bar code and date stamp on the box.
Boxes then moved to the Palletising station where they were automatically stacked, palletised and shrink wrapped. The pallets were then moved either into a temporary storage area to await loading onto outgoing trucks or loaded directly onto trucks. Most pallets were dispatched within a few hours of palletising. All of the steps up to truck loading were linked by short conveyor belt runs.
The company’s trucks delivered the pallets to the various customer warehouses, where they were unloaded by customer warehouse staff. Customer staff received and checked pallets. If the load was incorrect it was placed back onto the truck and returned.
If the load verified OK, the pallet was unpacked (de-palletised) and the receipt of the individual boxes recorded. Boxes not conforming to the customer’s specification, damaged or which could otherwise not be received were rejected and sent back to SEFP on the next truck.
Received boxes were placed into the warehouse until required, where they would be issued to retail.
When a box of product was issued, customer staff opened it and checked the contents. If the contents were OK, the box was taken and the contents placed in the Supermarket/Store, if not OK, the box was returned to SEFP for refund.
112

South Eastern Food Packagers
Exhibit 4.b. Schematic Diagram of overall Supply Chain for SEFP Cardboard Box Packaging
Exhibit 4.c. Process Map of SEFP Cardboard Box Packaging Process
Box flats
Flat feeder Box folder
Filler Stations
1 2 3
WeighingStation
Lid Seal
& Close
PrintStation
Palletising
TruckLoading &
Dispatch
Transport tocustomers
Receive palletsDe-palletise &receive boxes
Place inWarehouse
stock
Issue to
retail asrequired
Unpack& place
on shelf
Product Bulk Packs
Retail
Bulk Pack
Replenishment
Customerplaces order
Scheduling
Schedule
Start
Load flat into Flat Feeder
Box Folding
Box Jam?
Box Filling
Underweight?
Overweight?
Lid sealing and close
Customer Receive Pallets
Remove Excess
Remove & Recycle
Stop and Clear
Restart the ProcessPallet OK?
Unpack & receive boxes
Boxes OK?
Place in Warehouse
Unpack Box when required
Contents OK?
Place on shelf for sale
End
Return to SEFP
Return to SEFP
Return to SEFP
Yes
Yes
Yes
Yes
Yes
Yes
No
No
No
No
No
No
Printing Bar Code & Date
Palletise
Truck Loading and Dispatch
Receive Customer Order
Consolidate & Schedule Orders
Load/configure bulk packs
113
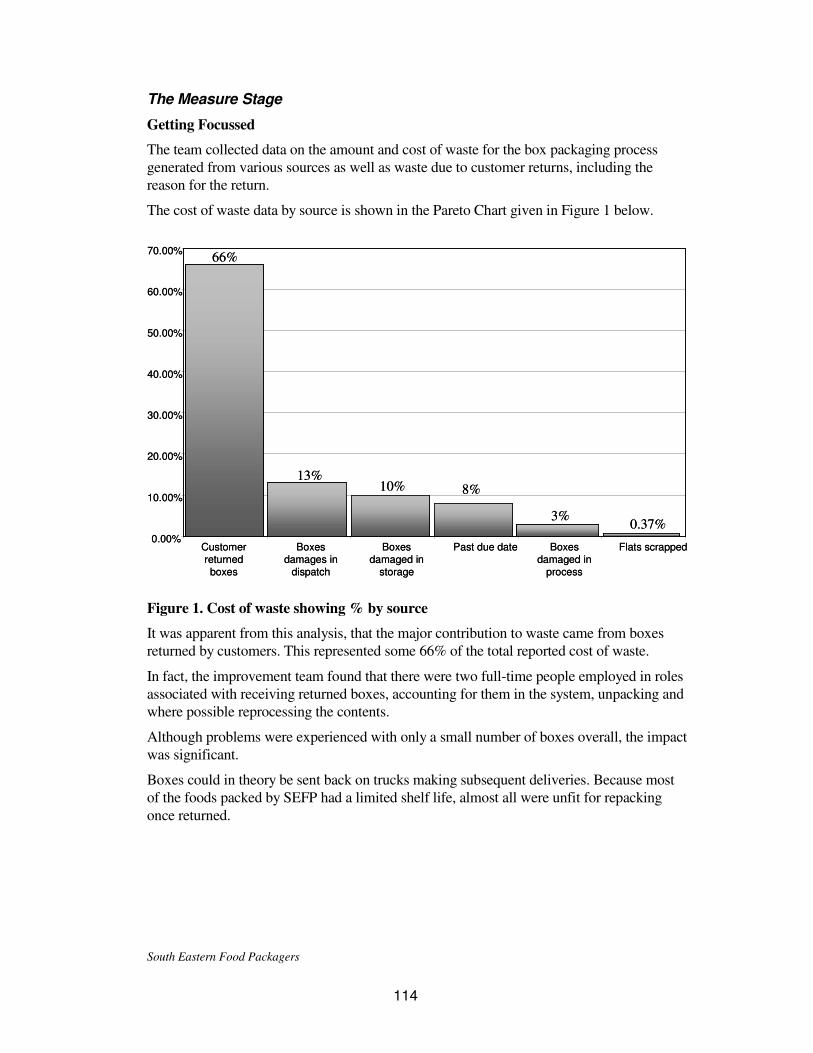
South Eastern Food Packagers
The Measure Stage
Getting Focussed
The team collected data on the amount and cost of waste for the box packaging process generated from various sources as well as waste due to customer returns, including the reason for the return.
The cost of waste data by source is shown in the Pareto Chart given in Figure 1 below.
Figure 1. Cost of waste showing % by source
It was apparent from this analysis, that the major contribution to waste came from boxes returned by customers. This represented some 66% of the total reported cost of waste.
In fact, the improvement team found that there were two full-time people employed in roles associated with receiving returned boxes, accounting for them in the system, unpacking and where possible reprocessing the contents.
Although problems were experienced with only a small number of boxes overall, the impact was significant.
Boxes could in theory be sent back on trucks making subsequent deliveries. Because most of the foods packed by SEFP had a limited shelf life, almost all were unfit for repacking
once returned.
0.00%
10.00%
20.00%
30.00%
40.00%
50.00%
60.00%
70.00%
Customer returned boxes
Boxes damages in
dispatch
Boxes damaged in
storage
Past due date Boxes damaged in
process
Flats scrapped
66%
13%10% 8%
3%0.37%
0.00%
10.00%
20.00%
30.00%
40.00%
50.00%
60.00%
70.00%
Customer returned boxes
Boxes damages in
dispatch
Boxes damaged in
storage
Past due date Boxes damaged in
process
Flats scrapped
66%
13%10% 8%
3%0.37%
114

South Eastern Food Packagers
The Analyse Stage
Drilling Down to the Details
The team conducted a specific data collection exercise to determine the causes of box returns. A representative sample of boxes returned during a typical shift was logged. Information about the specific defect and value of contents were recorded for each box.
A log of the data collected is given in Exhibit 5.
Exercises:
Assume your are one of the members of the improvement team.
1. Use the check sheet developed by the team, given in Exhibit 6 to analyse the data. Use
the categories suggested plus any others that may be necessary to describe the data.
2. Calculate the number of occurrences and the costs of each category of defect.
3. Draw a Pareto Chart for the number of occurrences of each category of defect identified.
4. Draw a Pareto Chart for the costs associated with each category of defect identified.
5. Using the information developed above which problem offers the greatest potential for
improvement and should be investigated further.
You may use the sheets given in Exhibits 7.a. and 7.b. to draw your Pareto Charts.
115
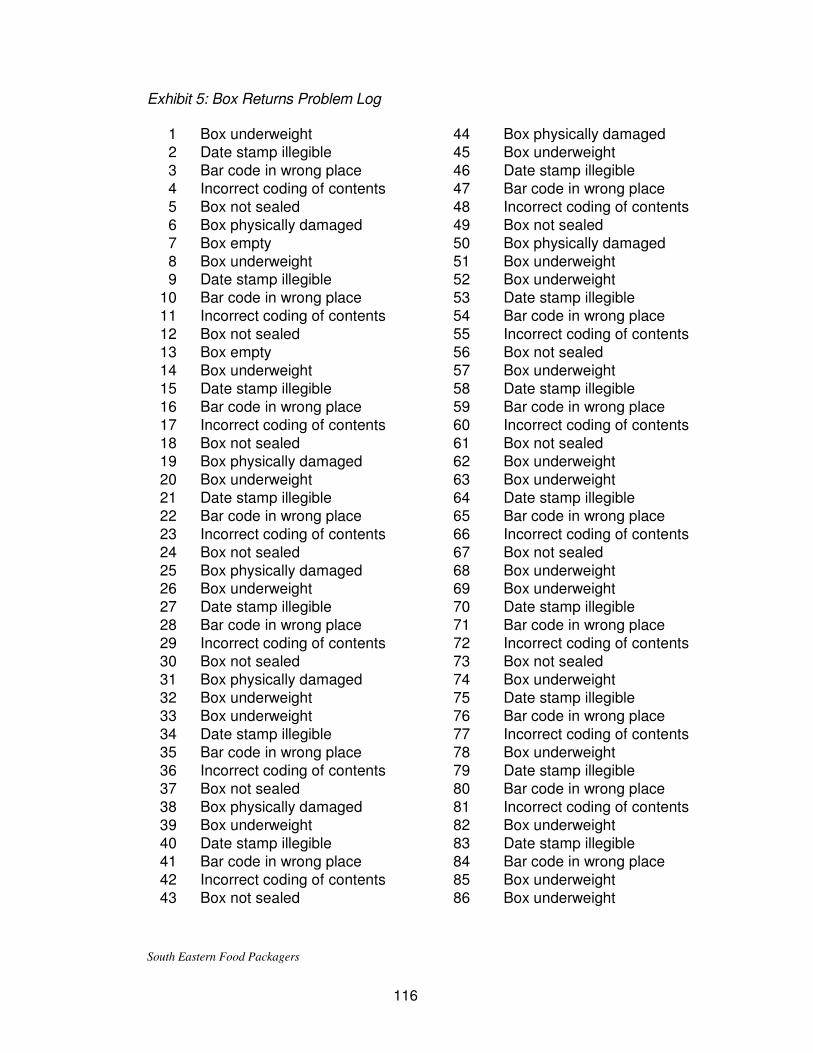
South Eastern Food Packagers
Exhibit 5: Box Returns Problem Log
1 Box underweight 44 Box physically damaged 2 Date stamp illegible 45 Box underweight 3 Bar code in wrong place 46 Date stamp illegible 4 Incorrect coding of contents 47 Bar code in wrong place 5 Box not sealed 48 Incorrect coding of contents 6 Box physically damaged 49 Box not sealed 7 Box empty 50 Box physically damaged 8 Box underweight 51 Box underweight 9 Date stamp illegible 52 Box underweight
10 Bar code in wrong place 53 Date stamp illegible 11 Incorrect coding of contents 54 Bar code in wrong place 12 Box not sealed 55 Incorrect coding of contents 13 Box empty 56 Box not sealed 14 Box underweight 57 Box underweight 15 Date stamp illegible 58 Date stamp illegible 16 Bar code in wrong place 59 Bar code in wrong place 17 Incorrect coding of contents 60 Incorrect coding of contents 18 Box not sealed 61 Box not sealed 19 Box physically damaged 62 Box underweight 20 Box underweight 63 Box underweight 21 Date stamp illegible 64 Date stamp illegible 22 Bar code in wrong place 65 Bar code in wrong place 23 Incorrect coding of contents 66 Incorrect coding of contents 24 Box not sealed 67 Box not sealed 25 Box physically damaged 68 Box underweight 26 Box underweight 69 Box underweight 27 Date stamp illegible 70 Date stamp illegible 28 Bar code in wrong place 71 Bar code in wrong place 29 Incorrect coding of contents 72 Incorrect coding of contents 30 Box not sealed 73 Box not sealed 31 Box physically damaged 74 Box underweight 32 Box underweight 75 Date stamp illegible 33 Box underweight 76 Bar code in wrong place 34 Date stamp illegible 77 Incorrect coding of contents 35 Bar code in wrong place 78 Box underweight 36 Incorrect coding of contents 79 Date stamp illegible 37 Box not sealed 80 Bar code in wrong place 38 Box physically damaged 81 Incorrect coding of contents 39 Box underweight 82 Box underweight 40 Date stamp illegible 83 Date stamp illegible 41 Bar code in wrong place 84 Bar code in wrong place 42 Incorrect coding of contents 85 Box underweight 43 Box not sealed 86 Box underweight
116
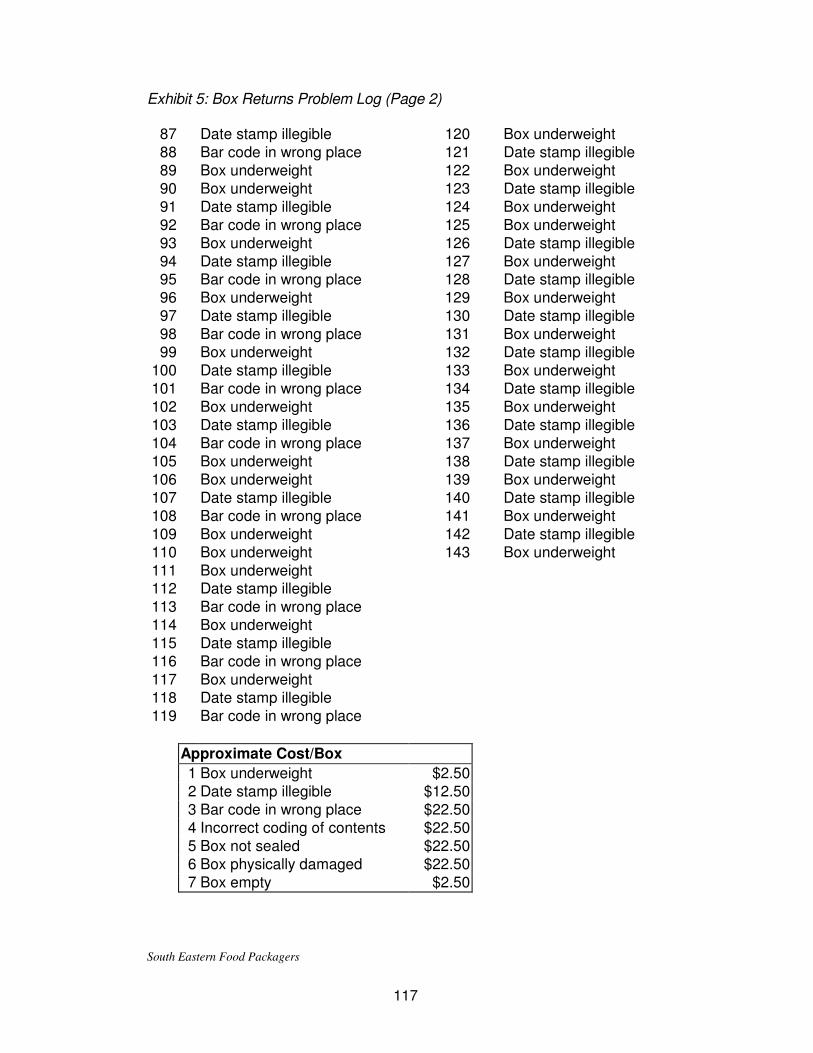
South Eastern Food Packagers
Exhibit 5: Box Returns Problem Log (Page 2)
87 Date stamp illegible 120 Box underweight 88 Bar code in wrong place 121 Date stamp illegible 89 Box underweight 122 Box underweight 90 Box underweight 123 Date stamp illegible 91 Date stamp illegible 124 Box underweight 92 Bar code in wrong place 125 Box underweight 93 Box underweight 126 Date stamp illegible 94 Date stamp illegible 127 Box underweight 95 Bar code in wrong place 128 Date stamp illegible 96 Box underweight 129 Box underweight 97 Date stamp illegible 130 Date stamp illegible 98 Bar code in wrong place 131 Box underweight 99 Box underweight 132 Date stamp illegible
100 Date stamp illegible 133 Box underweight 101 Bar code in wrong place 134 Date stamp illegible 102 Box underweight 135 Box underweight 103 Date stamp illegible 136 Date stamp illegible 104 Bar code in wrong place 137 Box underweight 105 Box underweight 138 Date stamp illegible 106 Box underweight 139 Box underweight 107 Date stamp illegible 140 Date stamp illegible 108 Bar code in wrong place 141 Box underweight 109 Box underweight 142 Date stamp illegible 110 Box underweight 143 Box underweight 111 Box underweight 112 Date stamp illegible 113 Bar code in wrong place 114 Box underweight 115 Date stamp illegible 116 Bar code in wrong place 117 Box underweight 118 Date stamp illegible 119 Bar code in wrong place
Approximate Cost/Box
1 Box underweight $2.50 2 Date stamp illegible $12.50 3 Bar code in wrong place $22.50 4 Incorrect coding of contents $22.50 5 Box not sealed $22.50 6 Box physically damaged $22.50 7 Box empty $2.50
117

South Eastern Food Packagers
Exhibit 6: Check Sheet for Analysing Box Return Data
Reason Code Tally Frequency $ Value
1 Incorrect coding of contents
2 Date Stamp Illegible
3 Box not sealed
4 Box Underweight
5 Box physical damage
6 Bar Code in wrong place
7 Box Empty
Total
118

South Eastern Food Packagers
Exhibit 7.a. Pareto Chart for Number of Boxes by Cause
119

South Eastern Food Packagers
Exhibit 7.b. Pareto Chart for Cost
120
South Eastern Food Packagers
Further Investigation
The team selected the “Bar Code in Wrong Place” cause to investigate further. This had been identified as the “Pareto” cause of the cost of box returns.
However, it was not an actionable cause and therefore not a root cause. The cause of the bar code being in the wrong place would require further investigation before corrective action could be taken.
The problem was formally redefined as “Bar Code in Wrong Place”
The team decided to use a fishbone diagram to brainstorm the likely causes of the bar code being in the wrong place.
Exercise:
From your own experience and the information given in the role sheet you
have been asked to read, use the space below to record some of the things
you think could be possible causes that could contribute to the bar code
being in the wrong place.
121

South Eastern Food Packagers
Role Sheet A: The Operator’s Perspective You are a Box Packaging Line Operator and member of the Box Packaging Operations, Improvement Team which has been asked to look at reducing waste. Analysis of the causes of this problem has revealed that “bar code in wrong place” is one of the Pareto causes of boxes returned as defective, which in turn accounts for the majority of waste in this area.
You have been asked to contribute to a brainstorming session to identify the causes of “bar code in wrong place”. From your experience working in this area, you have noted that often the box is not in the right position relative to the print heads - the bar code and date code print heads, when they fire. The boxes move through rapidly and the whole print operation happens very quickly.
Often the boxes slip on the rubber conveyor belt as they approach the print station. The mechanical trigger lever, which sets the timing of the print heads relative to when each box trips it often sticks. While the box passing by usually pushes it over and still triggers the printer, the force required to “unstick” the lever often causes the box to slip a bit and the timing of the printer ends up being just a little ahead of the box. When the print heads fire, they get the printing in the wrong place or miss the box altogether.
The same problem with timing happened when the box approached the printer sitting slightly askew on the belt. The leading edge triggered the printer earlier than required. Even though the box straightened as it entered the printer station the bar code and date ended up being printed well ahead of where required on the box or missed the box completely. Several years ago you had suggested to your supervisor to move the chute which straightens the boxes ahead of the trigger lever, but nothing had been done about it. That supervisor had since left and the matter had not been taken further.
You often did your best to keep the lever loose by wiggling it with your fingers, but the boxes moved through too fast to do much good. Maybe the maintenance people should oil it more often or something.
122
South Eastern Food Packagers
Role Sheet B: The Supervisor’s Perspective You are a Supervisor on the Box Packaging Line and member of the Box Packaging Operations, Improvement Team which has been asked to look at reducing waste. Analysis of the causes of this problem has revealed that “bar code in wrong place” is one of the Pareto causes of boxes returned as defective, which in turn accounts for the majority of waste in this area.
You have been asked to contribute to a brainstorming session to identify the causes of “bar code in wrong place”. From your experience working in this area, you have noted that the operators often play with the lever which sets the timing for the print heads. They do this when the box is no where near in position. When the print heads fire they get the bar code and the date all over the boxes in different
places, depending on when the operator triggered the lever. You have warned the operators about doing this on many occasions, but it just didn’t seem to sink in. After all, most of these operators weren’t hired for their brains. If only they would stop playing with the lever, the bar code would always print in the same place. Maybe if the operators were told not to touch the print trigger lever during their initial orientation training on the line, you wouldn’t have to waste so much of your time telling
them. The design of the machine could also be improved, surely the lever could have been put somewhere else where no-one can touch it or even use a light beam to set the timing. The other thing you weren’t sure about was maintenance. They never seemed to be doing their preventive maintenance routines on time. You were sure that some of the problems were often due to faults in the print heads such as clogged jets, lack of ink to the heads or even the heads coming loose from the frame due to all the vibration.
Even when maintenance did come to look at the heads or investigate any problems, they never seemed to get it right or tell anyone anything.
123
South Eastern Food Packagers
Role Sheet C: The Manager’s Perspective You are the Box Packaging Area Manager and member of the Box Packaging Operations, Improvement Team which has been asked to look at reducing waste. Analysis of the causes of this problem has revealed that “bar code in wrong place” is one of the Pareto causes of boxes returned as defective, which in turn accounts for the majority of waste in this area.
You have been asked to contribute to a brainstorming session to identify the causes of “bar code in wrong place”. From your experience working in this area, you have wondered about how the print station was being operated by the operators. Replacing the ink feedbottle, aligning the print heads to the boxes, setting up the ink flow rate to the heads and keeping the heads clean, were all standard operating tasks, yet each operator had their own way of doing it.
You were sure that sometimes the printing smudged because there was too much ink going to the heads, in other cases the heads were aligned incorrectly for the size of box being packed. You were disappointed that the supervisor had not yet written a standard procedure for doing this. The boxes themselves could also be a problem, slight differences in their sizes, which came about due to lack of consistency in the size of the “flats”, could cause boxes to get caught up in the print station and sit incorrectly when being printed. Some of the boxes
using the shinier cardboard also tended to slip on the belts more often than the others.
124

South Eastern Food Packagers
Exhibit 8. Fishbone Diagram Proforma
People Procedures
Equipment/Systems
Materials/Environment
Bar codewrong place
125

South Eastern Food Packagers
Collecting Even More Data
When the fishbone analysis had been completed, the team used the multivoting technique to identify the most likely of the causes and a check sheet was developed for these.
Given that most of these causes were not readily noticeable on a day-to-day basis, the two packaging operators on the team agreed to keep a detailed check on these causes during a full day’s production shift.
The packaging line supervisor, also a team member consolidated the results and developed
the Pareto Chart given in Exhibit 9.
Question:
Which cause would you select to address further?
What would be your next step?
Exhibit 9. Pareto Chart of Causes of Bar Code Wrong Place
10
20
30
40
5044
27
15
9
5 2
1 2 3 4 5 6
Cause Codes1. Trip lever sticking
2. Box askew on belt
3. Operator accidental
lever trip
4. Box misfeed
5. Print head loose6. Other
126

South Eastern Food Packagers
This Page Intentionally Left Blank
127
South Eastern Food Packagers
The Improve Stage The team members brainstormed ideas to address the problem of synchronising the printer with the box's actual position and developed a potential solutions matrix to rank the ideas. The idea finally selected for implementation was to replace the mechanical lever with a light beam triggered print head located at the print head (just ahead of it) and triggered by the leading edge of the box after it had been straightened by the feed chute.
This modification to the unit cost just over $ 2,000 to implement, including the labour cost of the maintenance technician who did the installation.
Implementing the Preferred Solution and Checking that it Worked! Data on customer returns continued to be reported. At the recommendation of the team it was now reported by each of the categories they had identified during their analysis, rather than just an aggregate figure, as had been the past practice.
After 3 months, the team concluded:
• Only a single batch of 25 boxes had been returned for the “bar code in wrong place” cause. Further investigation revealed that this had been due to a temporary fault with the customer’s equipment and not due to the bar code actually being in the wrong place;
• An added bonus had been reduction in “Date stamp illegible” to less than 25% its former level. The date stamp, printed by a separate printer at the same print station was found to be affected by the same problem that caused the “bar code in wrong place”. When the timing was upset for the print station by the box being askew or slipping, the date often ended up being printed over sections of the box “artwork” which made it illegible or it missed the box completely.
The Control Stage The light beam print trigger was adopted as a standard for print station design within the company. Performance measures on box returns were left in place as a Key Performance Indicator (KPI) for the Cardboard Box Operations group and monitored weekly.
128

The DMAIC Process
© Max Zornada Slide 1
Lean Six Sigma: Yellow Belt Advanced
South Eastern Food Packagers
Team Based Problem Solving
Case Study
© Max Zornada Slide 2
Lean Six Sigma: Yellow Belt Advanced
DMAIC Process Storyboard
Cause and Effect DiagramRun chart or
control chartProcess Map
Objective: Identify and implement the measures required to establish
baseline performance and quantify the opportunity.Objective: Define the Problem/Opportunity, Business
Case, Customers & Customer Requirements, and Process.Objective: To allocate a project worth
doing to a capable team.
Output: Project selected, team selected,
project allocated to team.
Develop Business Case
Develop Project Charter
Understand Customer Requirements
Understand the Process.
PRE-DMAIC DEFINE MEASURE
ANALYSE
Output: A quantified picture of the current process performance
(current state) and problem impact.
Key Steps:- Key Steps:-
IMPROVE - I : Generate Potential Solutions
Output: Business Case, Project Charter, Work Plan, Problem
Definition, Measurable Customer Requirements, Process Map
Team charter
Objective: Identify and verify the root cause(s) of the problem.
Objective: Implement the preferred solution. Confirm that the
problem and its root cause(s) have been reduced or eliminated.
Implement preferred solution
Verify effectiveness
Apply comparative methods if
necessary.
Objective: Prevent the problem and its root
cause from recurring.
Standardise the solution
(standards & procedures)
Develop and Implement
PMCS
Document project
Analyse Data
Analyse Process
Determine Potential Root Causes
Form & Test Hypothesis
Verify Root Causes
Key Steps:-
Objective: Determine possible solutions that will address the identified root cause(s) of
the problem.
Generate potential solutions
Assess potential solutions
Select preferred solution
Test/Pilot preferred solution
Develop implementation plan
Before
After
Key steps:-
Flowchart Standard
procedure
Output: Solution embedded and “routinised” in
relevant process, procedures and standards.
Key steps:-
Objectives: Review team effectiveness, plan to
address remaining issues and institutionalise the
learning.
Output: Recommendations for future projects &
improvements to team processes. Project
documentation and learnings “pack”
IMPROVE - II: Implement and Check
Review remaining project
opportunities
Review other applications
Review learnings
C D
MA
I 6σ
CONTROL - Standardise FUTURE PLANS
Output: Root cause(s) identified & verified
Cause and Effect Diagram
(Fishbone)Checksheet
Pareto Chart
Output: Preferred solution or countermeasures
Key Steps:-
Output: Confirmation the best solution to eliminate the problem & its
root cause(s) has been implemented.
Potential Solutions
Key Steps:-
Action Plan
Step 1
Step 2
Step 3
Step 4
Step 5
Step 6
Identify opportunities
Select project
Select team
Allocate to team
Key Steps:-Determine what to Measure
Understand the Measures
Understand Variation
Assess Current Process
Performance
Pareto Chart
129
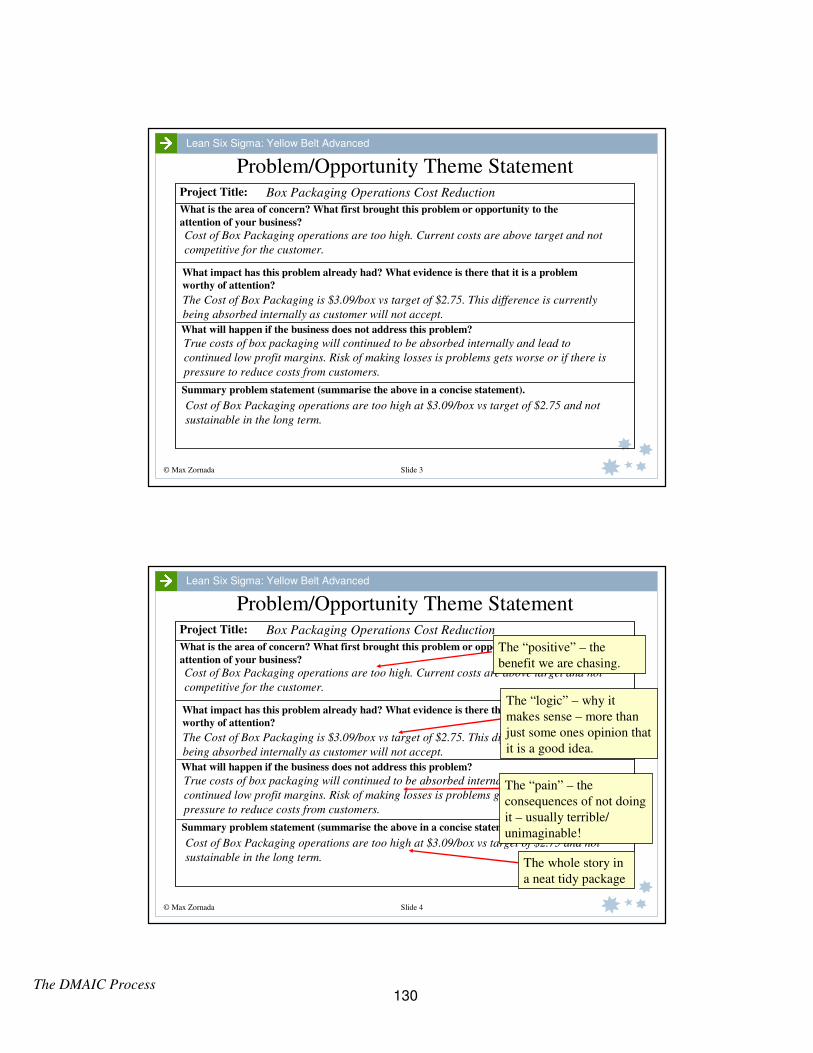
The DMAIC Process
© Max Zornada Slide 3
Lean Six Sigma: Yellow Belt Advanced
Problem/Opportunity Theme Statement
What is the area of concern? What first brought this problem or opportunity to the
attention of your business?
Summary problem statement (summarise the above in a concise statement).
Project Title: Box Packaging Operations Cost Reduction
Cost of Box Packaging operations are too high. Current costs are above target and not
competitive for the customer.
The Cost of Box Packaging is $3.09/box vs target of $2.75. This difference is currently
being absorbed internally as customer will not accept.
Cost of Box Packaging operations are too high at $3.09/box vs target of $2.75 and not
sustainable in the long term.
What will happen if the business does not address this problem?
True costs of box packaging will continued to be absorbed internally and lead to
continued low profit margins. Risk of making losses is problems gets worse or if there is
pressure to reduce costs from customers.
What impact has this problem already had? What evidence is there that it is a problem
worthy of attention?
© Max Zornada Slide 4
Lean Six Sigma: Yellow Belt Advanced
Problem/Opportunity Theme Statement
What is the area of concern? What first brought this problem or opportunity to the
attention of your business?
Summary problem statement (summarise the above in a concise statement).
Project Title: Box Packaging Operations Cost Reduction
Cost of Box Packaging operations are too high. Current costs are above target and not
competitive for the customer.
The Cost of Box Packaging is $3.09/box vs target of $2.75. This difference is currently
being absorbed internally as customer will not accept.
Cost of Box Packaging operations are too high at $3.09/box vs target of $2.75 and not
sustainable in the long term.
What will happen if the business does not address this problem?
True costs of box packaging will continued to be absorbed internally and lead to
continued low profit margins. Risk of making losses is problems gets worse or if there is
pressure to reduce costs from customers.
What impact has this problem already had? What evidence is there that it is a problem
worthy of attention?
The “positive” – the
benefit we are chasing.
The “logic” – why it
makes sense – more than
just some ones opinion that
it is a good idea.
The “pain” – the
consequences of not doing
it – usually terrible/
unimaginable!
The whole story in
a neat tidy package
130
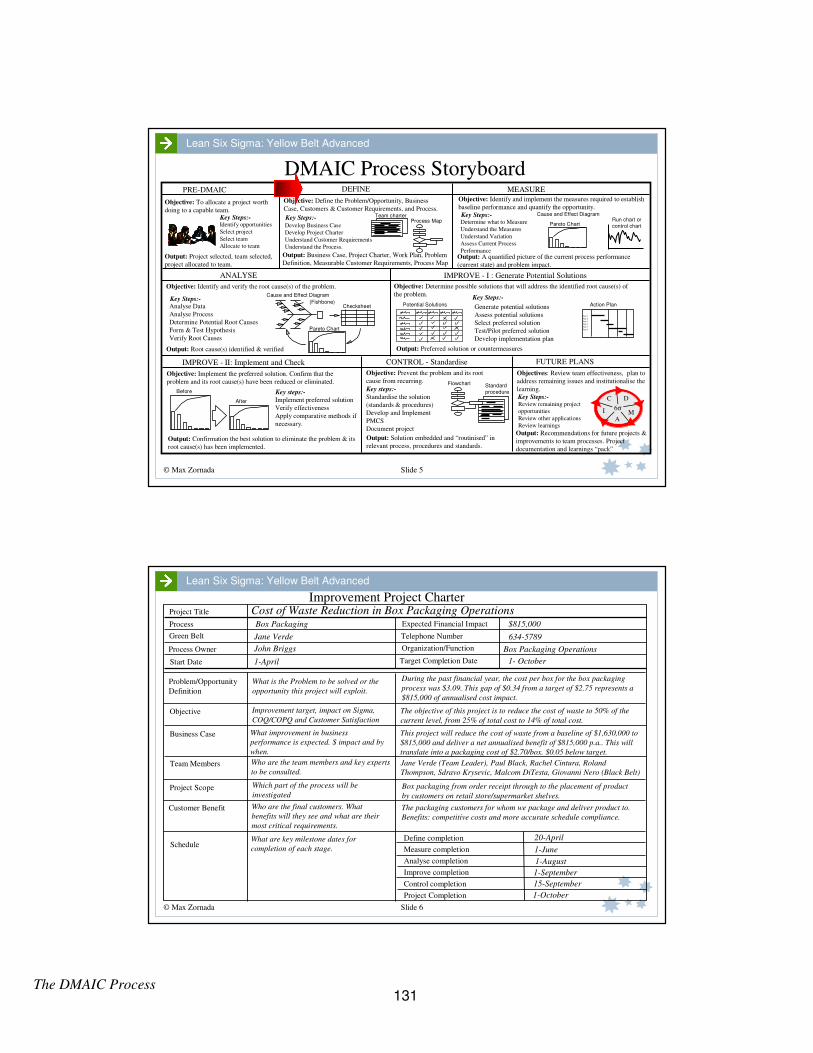
The DMAIC Process
© Max Zornada Slide 5
Lean Six Sigma: Yellow Belt Advanced
DMAIC Process Storyboard
Cause and Effect DiagramRun chart or
control chartProcess Map
Objective: Identify and implement the measures required to establish
baseline performance and quantify the opportunity.Objective: Define the Problem/Opportunity, Business
Case, Customers & Customer Requirements, and Process.Objective: To allocate a project worth
doing to a capable team.
Output: Project selected, team selected,
project allocated to team.
Develop Business Case
Develop Project Charter
Understand Customer Requirements
Understand the Process.
PRE-DMAIC DEFINE MEASURE
ANALYSE
Output: A quantified picture of the current process performance
(current state) and problem impact.
Key Steps:- Key Steps:-
IMPROVE - I : Generate Potential Solutions
Output: Business Case, Project Charter, Work Plan, Problem
Definition, Measurable Customer Requirements, Process Map
Team charter
Objective: Identify and verify the root cause(s) of the problem.
Objective: Implement the preferred solution. Confirm that the
problem and its root cause(s) have been reduced or eliminated.
Implement preferred solution
Verify effectiveness
Apply comparative methods if
necessary.
Objective: Prevent the problem and its root
cause from recurring.
Standardise the solution
(standards & procedures)
Develop and Implement
PMCS
Document project
Analyse Data
Analyse Process
Determine Potential Root Causes
Form & Test Hypothesis
Verify Root Causes
Key Steps:-
Objective: Determine possible solutions that will address the identified root cause(s) of
the problem.
Generate potential solutions
Assess potential solutions
Select preferred solution
Test/Pilot preferred solution
Develop implementation plan
Before
After
Key steps:-
Flowchart Standard
procedure
Output: Solution embedded and “routinised” in
relevant process, procedures and standards.
Key steps:-
Objectives: Review team effectiveness, plan to
address remaining issues and institutionalise the
learning.
Output: Recommendations for future projects &
improvements to team processes. Project
documentation and learnings “pack”
IMPROVE - II: Implement and Check
Review remaining project
opportunities
Review other applications
Review learnings
C D
MA
I 6σ
CONTROL - Standardise FUTURE PLANS
Output: Root cause(s) identified & verified
Cause and Effect Diagram
(Fishbone)Checksheet
Pareto Chart
Output: Preferred solution or countermeasures
Key Steps:-
Output: Confirmation the best solution to eliminate the problem & its
root cause(s) has been implemented.
Potential Solutions
Key Steps:-
Action Plan
Step 1
Step 2
Step 3
Step 4
Step 5
Step 6
Identify opportunities
Select project
Select team
Allocate to team
Key Steps:-Determine what to Measure
Understand the Measures
Understand Variation
Assess Current Process
Performance
Pareto Chart
© Max Zornada Slide 6
Lean Six Sigma: Yellow Belt Advanced
Process
Green Belt
Process Owner
Start Date
Project Title
Objective
Problem/Opportunity
Definition
Business Case
Team Members
Customer Benefit
Schedule
What is the Problem to be solved or the
opportunity this project will exploit.
Project Scope
Improvement target, impact on Sigma,
COQ/COPQ and Customer Satisfaction
What improvement in business
performance is expected. $ impact and by
when.
Who are the team members and key experts
to be consulted.
Which part of the process will be
investigated
Who are the final customers. What
benefits will they see and what are their
most critical requirements.
What are key milestone dates for
completion of each stage.
Jane Verde
John Briggs
1-April
Box Packaging Expected Financial Impact
Telephone Number
Organization/Function
Target Completion Date
The objective of this project is to reduce the cost of waste to 50% of the
current level, from 25% of total cost to 14% of total cost.
634-5789
Box Packaging Operations
1- October
$815,000
Jane Verde (Team Leader), Paul Black, Rachel Cintura, Roland
Thompson, Sdravo Krysevic, Malcom DiTesta, Giovanni Nero (Black Belt)
Box packaging from order receipt through to the placement of product
by customers on retail store/supermarket shelves.
20-April
This project will reduce the cost of waste from a baseline of $1,630,000 to
$815,000 and deliver a net annualised benefit of $815,000 p.a.. This will
translate into a packaging cost of $2.70/box. $0.05 below target.
The packaging customers for whom we package and deliver product to.
Benefits: competitive costs and more accurate schedule compliance.
1-June
1-August
1-September
15-September
1-October
Define completion
Measure completion
Analyse completion
Improve completion
Control completion
Project Completion
Cost of Waste Reduction in Box Packaging OperationsImprovement Project Charter
During the past financial year, the cost per box for the box packaging
process was $3.09. This gap of $0.34 from a target of $2.75 represents a
$815,000 of annualised cost impact.
131
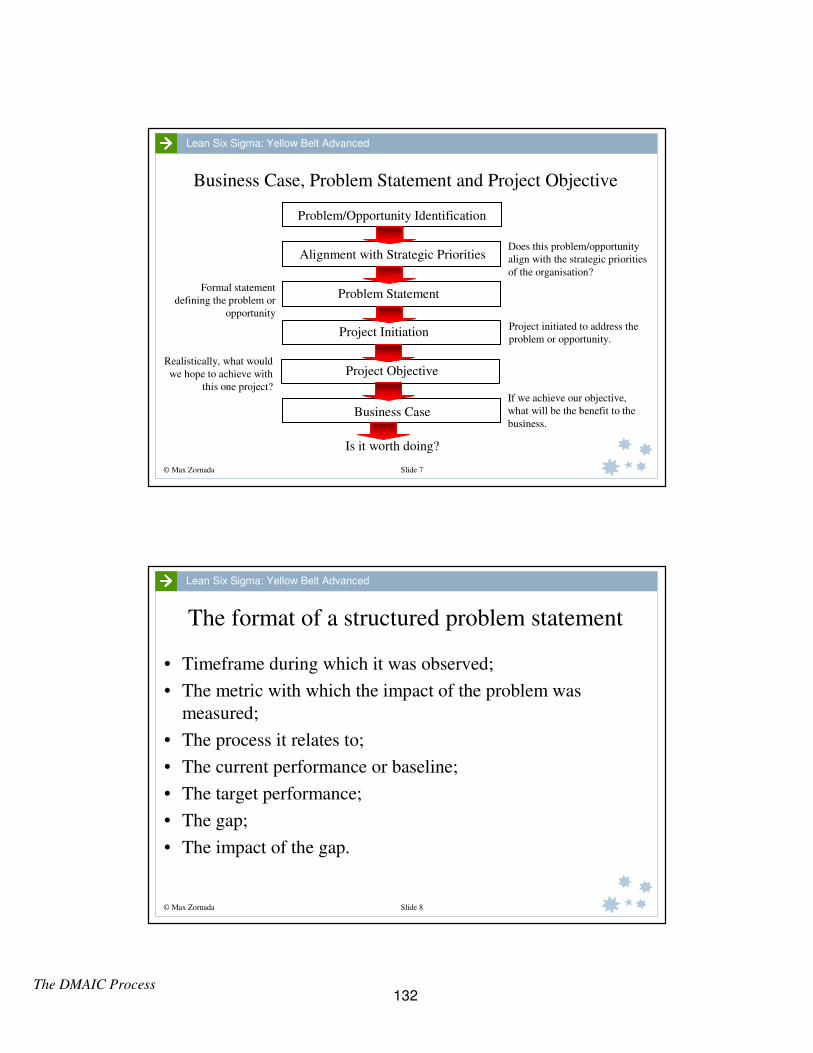
The DMAIC Process
© Max Zornada Slide 7
Lean Six Sigma: Yellow Belt Advanced
Business Case, Problem Statement and Project Objective
Problem/Opportunity Identification
Alignment with Strategic Priorities
Problem Statement
Project Objective
Project Initiation
Business Case
Does this problem/opportunity
align with the strategic priorities
of the organisation?
Formal statement
defining the problem or
opportunity
Project initiated to address the
problem or opportunity.
Realistically, what would
we hope to achieve with
this one project?If we achieve our objective,
what will be the benefit to the
business.
Is it worth doing?
© Max Zornada Slide 8
Lean Six Sigma: Yellow Belt Advanced
The format of a structured problem statement
• Timeframe during which it was observed;
• The metric with which the impact of the problem was
measured;
• The process it relates to;
• The current performance or baseline;
• The target performance;
• The gap;
• The impact of the gap.
132
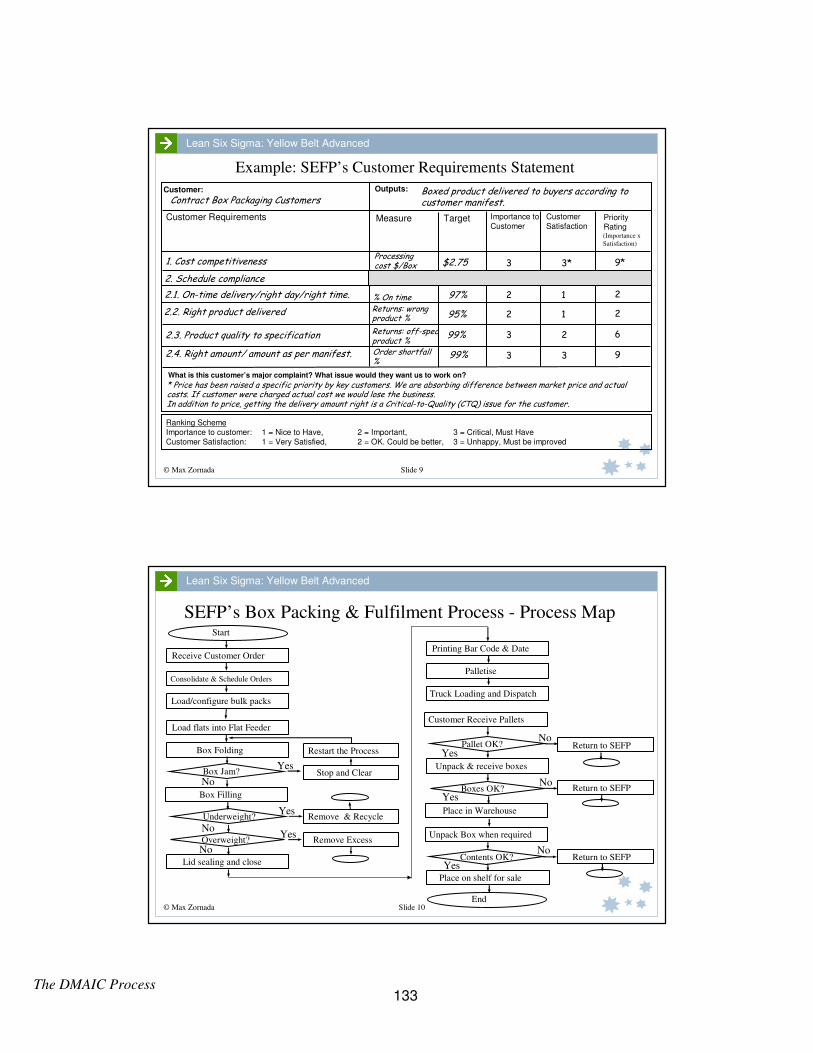
The DMAIC Process
© Max Zornada Slide 9
Lean Six Sigma: Yellow Belt Advanced
Example: SEFP’s Customer Requirements Statement
What is this customer’s major complaint? What issue would they want us to work on?
Customer Requirements
1. Cost competitiveness
Contract Box Packaging Customers
2. Schedule compliance
2.1. On-time delivery/right day/right time.
2.2. Right product delivered
2.3. Product quality to specification
2.4. Right amount/ amount as per manifest.
Ranking Scheme
Importance to customer: 1 = Nice to Have, 2 = Important, 3 = Critical, Must Have
Customer Satisfaction: 1 = Very Satisfied, 2 = OK. Could be better, 3 = Unhappy, Must be improved
* Price has been raised a specific priority by key customers. We are absorbing difference between market price and actual costs. If customer were charged actual cost we would lose the business.In addition to price, getting the delivery amount right is a Critical-to-Quality (CTQ) issue for the customer.
3 3* 9*
2 1 2
2 1 2
3 2 6
$2.75
97%
95%
99%
99% 3 3 9
Outputs: Customer:
Measure Importance to
Customer
Customer
Satisfaction
Boxed product delivered to buyers according to customer manifest.
(Importance x
Satisfaction)
Target
Processing cost $/Box
Returns: wrong product %
Returns: off-spec product %
PriorityRating
% On time
Order shortfall %
© Max Zornada Slide 10
Lean Six Sigma: Yellow Belt Advanced
SEFP’s Box Packing & Fulfilment Process - Process MapStart
Load flats into Flat Feeder
Box Folding
Box Jam?
Box Filling
Underweight?
Overweight?
Lid sealing and close
Customer Receive Pallets
Remove Excess
Remove & Recycle
Stop and Clear
Restart the ProcessPallet OK?
Unpack & receive boxes
Boxes OK?
Place in Warehouse
Unpack Box when required
Contents OK?
Place on shelf for sale
End
Return to SEFP
Return to SEFP
Return to SEFP
Yes
Yes
Yes
Yes
Yes
Yes
No
No
No
No
No
No
Printing Bar Code & Date
Palletise
Truck Loading and Dispatch
Receive Customer Order
Consolidate & Schedule Orders
Load/configure bulk packs
133

The DMAIC Process
© Max Zornada Slide 11
Lean Six Sigma: Yellow Belt Advanced
SEFP’s Box Packing & Fulfilment Process - Process MapStart
Load flats into Flat Feeder
Box Folding
Box Jam?
Box Filling
Underweight?
Overweight?
Lid sealing and close
Customer Receive Pallets
Remove Excess
Remove & Recycle
Stop and Clear
Restart the ProcessPallet OK?
Unpack & receive boxes
Boxes OK?
Place in Warehouse
Unpack Box when required
Contents OK?
Place on shelf for sale
End
Return to SEFP
Return to SEFP
Return to SEFP
Yes
Yes
Yes
Yes
Yes
Yes
No
No
No
No
No
No
Printing Bar Code & Date
Palletise
Truck Loading and Dispatch
Receive Customer Order
Consolidate & Schedule Orders
Load/configure bulk packs
© Max Zornada Slide 12
Lean Six Sigma: Yellow Belt Advanced
DMAIC Process Storyboard
Cause and Effect DiagramRun chart or
control chartProcess Map
Objective: Identify and implement the measures required to establish
baseline performance and quantify the opportunity.Objective: Define the Problem/Opportunity, Business
Case, Customers & Customer Requirements, and Process.Objective: To allocate a project worth
doing to a capable team.
Output: Project selected, team selected,
project allocated to team.
Develop Business Case
Develop Project Charter
Understand Customer Requirements
Understand the Process.
PRE-DMAIC DEFINE MEASURE
ANALYSE
Output: A quantified picture of the current process performance
(current state) and problem impact.
Key Steps:- Key Steps:-
IMPROVE - I : Generate Potential Solutions
Output: Business Case, Project Charter, Work Plan, Problem
Definition, Measurable Customer Requirements, Process Map
Team charter
Objective: Identify and verify the root cause(s) of the problem.
Objective: Implement the preferred solution. Confirm that the
problem and its root cause(s) have been reduced or eliminated.
Implement preferred solution
Verify effectiveness
Apply comparative methods if
necessary.
Objective: Prevent the problem and its root
cause from recurring.
Standardise the solution
(standards & procedures)
Develop and Implement
PMCS
Document project
Analyse Data
Analyse Process
Determine Potential Root Causes
Form & Test Hypothesis
Verify Root Causes
Key Steps:-
Objective: Determine possible solutions that will address the identified root cause(s) of
the problem.
Generate potential solutions
Assess potential solutions
Select preferred solution
Test/Pilot preferred solution
Develop implementation plan
Before
After
Key steps:-
Flowchart Standard
procedure
Output: Solution embedded and “routinised” in
relevant process, procedures and standards.
Key steps:-
Objectives: Review team effectiveness, plan to
address remaining issues and institutionalise the
learning.
Output: Recommendations for future projects &
improvements to team processes. Project
documentation and learnings “pack”
IMPROVE - II: Implement and Check
Review remaining project
opportunities
Review other applications
Review learnings
C D
MA
I 6σ
CONTROL - Standardise FUTURE PLANS
Output: Root cause(s) identified & verified
Cause and Effect Diagram
(Fishbone)Checksheet
Pareto Chart
Output: Preferred solution or countermeasures
Key Steps:-
Output: Confirmation the best solution to eliminate the problem & its
root cause(s) has been implemented.
Potential Solutions
Key Steps:-
Action Plan
Step 1
Step 2
Step 3
Step 4
Step 5
Step 6
Identify opportunities
Select project
Select team
Allocate to team
Key Steps:-Determine what to Measure
Understand the Measures
Understand Variation
Assess Current Process
Performance
Pareto Chart
134
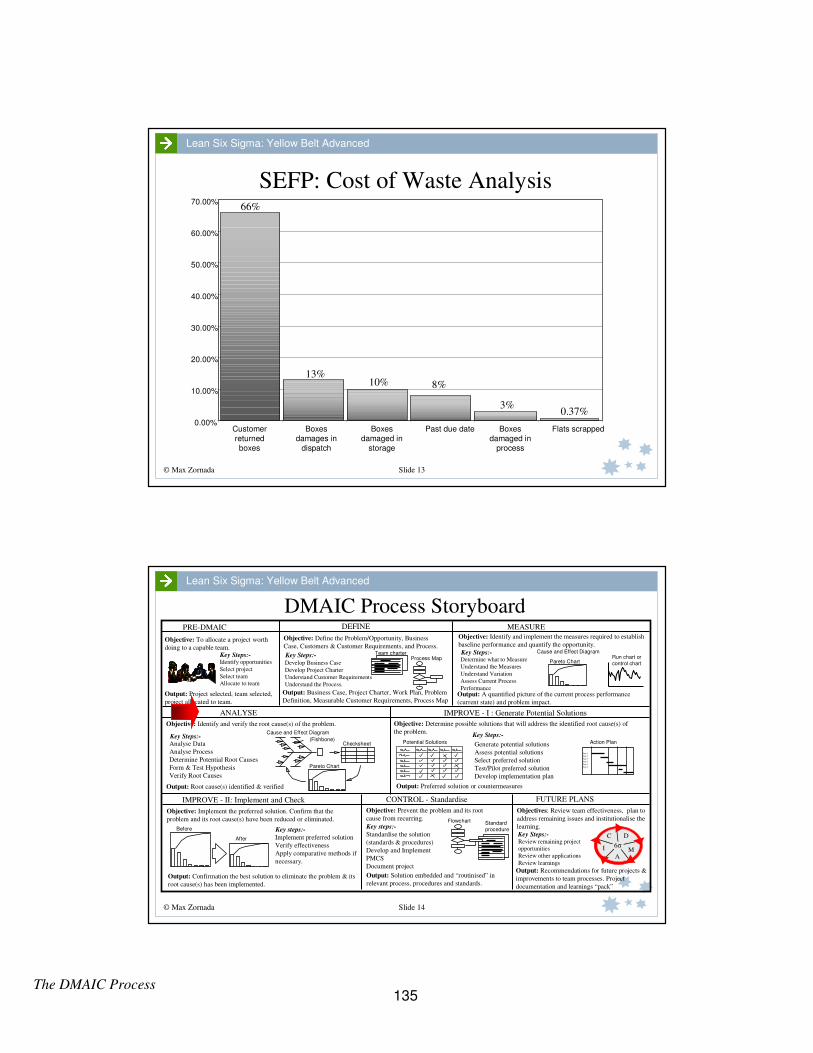
The DMAIC Process
© Max Zornada Slide 13
Lean Six Sigma: Yellow Belt Advanced
SEFP: Cost of Waste Analysis
0.00%
10.00%
20.00%
30.00%
40.00%
50.00%
60.00%
70.00%
Customer
returned
boxes
Boxes
damages in
dispatch
Boxes
damaged in
storage
Past due date Boxes
damaged in
process
Flats scrapped
66%
13%10% 8%
3%0.37%
© Max Zornada Slide 14
Lean Six Sigma: Yellow Belt Advanced
DMAIC Process Storyboard
Cause and Effect DiagramRun chart or
control chartProcess Map
Objective: Identify and implement the measures required to establish
baseline performance and quantify the opportunity.Objective: Define the Problem/Opportunity, Business
Case, Customers & Customer Requirements, and Process.Objective: To allocate a project worth
doing to a capable team.
Output: Project selected, team selected,
project allocated to team.
Develop Business Case
Develop Project Charter
Understand Customer Requirements
Understand the Process.
PRE-DMAIC DEFINE MEASURE
ANALYSE
Output: A quantified picture of the current process performance
(current state) and problem impact.
Key Steps:- Key Steps:-
IMPROVE - I : Generate Potential Solutions
Output: Business Case, Project Charter, Work Plan, Problem
Definition, Measurable Customer Requirements, Process Map
Team charter
Objective: Identify and verify the root cause(s) of the problem.
Objective: Implement the preferred solution. Confirm that the
problem and its root cause(s) have been reduced or eliminated.
Implement preferred solution
Verify effectiveness
Apply comparative methods if
necessary.
Objective: Prevent the problem and its root
cause from recurring.
Standardise the solution
(standards & procedures)
Develop and Implement
PMCS
Document project
Analyse Data
Analyse Process
Determine Potential Root Causes
Form & Test Hypothesis
Verify Root Causes
Key Steps:-
Objective: Determine possible solutions that will address the identified root cause(s) of
the problem.
Generate potential solutions
Assess potential solutions
Select preferred solution
Test/Pilot preferred solution
Develop implementation plan
Before
After
Key steps:-
Flowchart Standard
procedure
Output: Solution embedded and “routinised” in
relevant process, procedures and standards.
Key steps:-
Objectives: Review team effectiveness, plan to
address remaining issues and institutionalise the
learning.
Output: Recommendations for future projects &
improvements to team processes. Project
documentation and learnings “pack”
IMPROVE - II: Implement and Check
Review remaining project
opportunities
Review other applications
Review learnings
C D
MA
I 6σ
CONTROL - Standardise FUTURE PLANS
Output: Root cause(s) identified & verified
Cause and Effect Diagram
(Fishbone)Checksheet
Pareto Chart
Output: Preferred solution or countermeasures
Key Steps:-
Output: Confirmation the best solution to eliminate the problem & its
root cause(s) has been implemented.
Potential Solutions
Key Steps:-
Action Plan
Step 1
Step 2
Step 3
Step 4
Step 5
Step 6
Identify opportunities
Select project
Select team
Allocate to team
Key Steps:-Determine what to Measure
Understand the Measures
Understand Variation
Assess Current Process
Performance
Pareto Chart
135
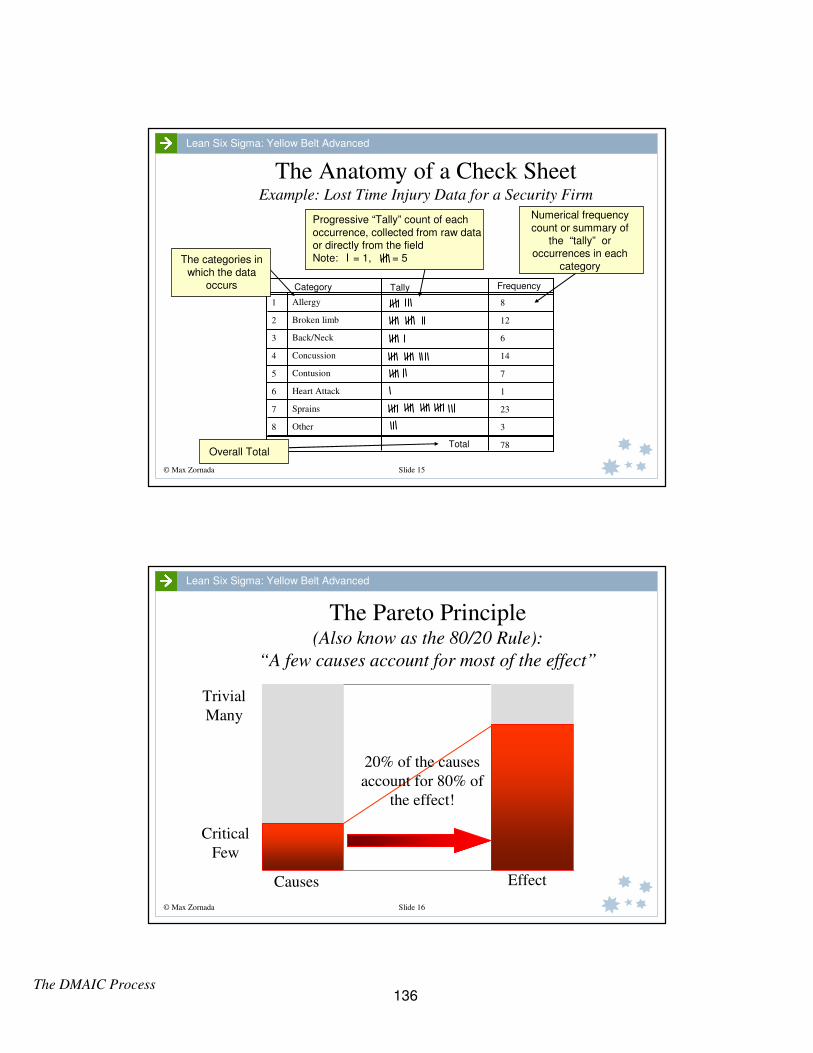
The DMAIC Process
© Max Zornada Slide 15
Lean Six Sigma: Yellow Belt Advanced
The Anatomy of a Check SheetExample: Lost Time Injury Data for a Security Firm
Category Tally Frequency
Total
Allergy
Broken limb
Back/Neck
Concussion
Contusion
Heart Attack
Sprains
Other
1
2
3
4
5
6
7
8
8
12
6
14
7
1
23
3
78
The categories in
which the data occurs
Progressive “Tally” count of each
occurrence, collected from raw data or directly from the fieldNote: = 1, = 5
Numerical frequency
count or summary of the “tally” or
occurrences in each category
Overall Total
© Max Zornada Slide 16
Lean Six Sigma: Yellow Belt Advanced
The Pareto Principle(Also know as the 80/20 Rule):
“A few causes account for most of the effect”
Causes Effect
20% of the causes
account for 80% of
the effect!
Critical
Few
Trivial
Many
136
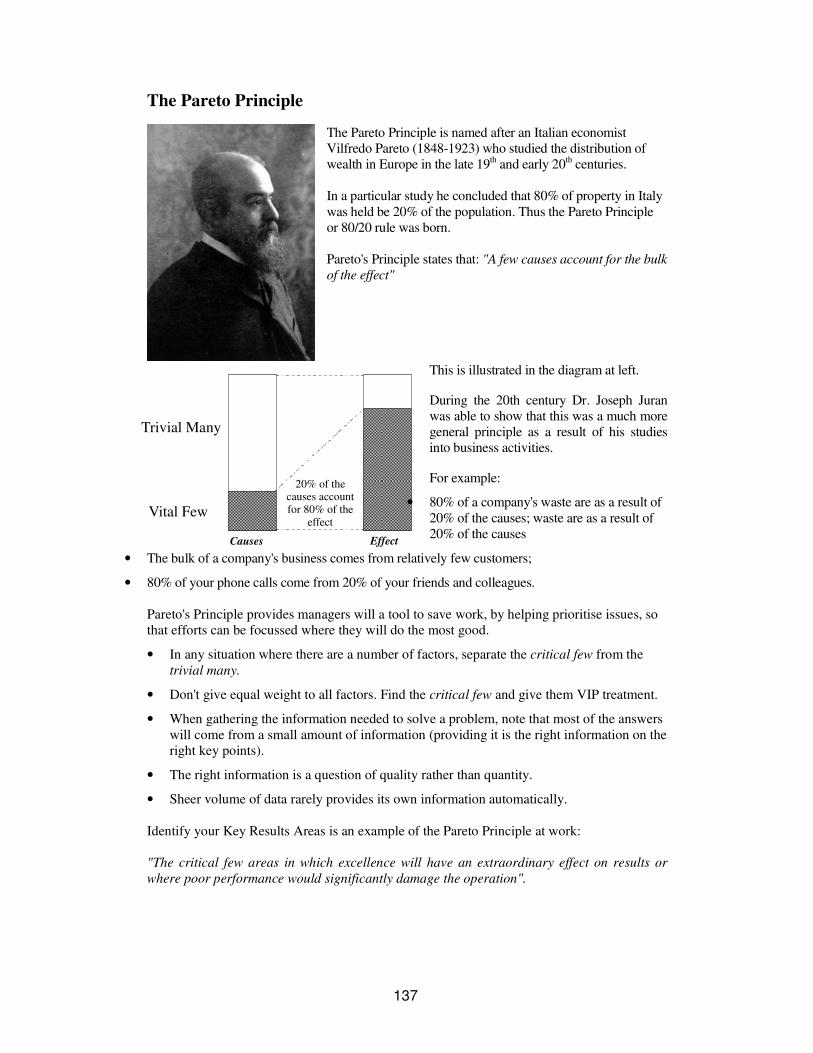
20% of the causes account for 80% of the
effect
Causes Effect
Vital Few
Trivial Many
The Pareto Principle
The Pareto Principle is named after an Italian economist
Vilfredo Pareto (1848-1923) who studied the distribution of
wealth in Europe in the late 19th and early 20th centuries.
In a particular study he concluded that 80% of property in Italy
was held be 20% of the population. Thus the Pareto Principle
or 80/20 rule was born.
Pareto's Principle states that: "A few causes account for the bulk
of the effect"
This is illustrated in the diagram at left.
During the 20th century Dr. Joseph Juran
was able to show that this was a much more
general principle as a result of his studies
into business activities.
For example:
• 80% of a company's waste are as a result of
20% of the causes; waste are as a result of
20% of the causes
• The bulk of a company's business comes from relatively few customers;
• 80% of your phone calls come from 20% of your friends and colleagues.
Pareto's Principle provides managers will a tool to save work, by helping prioritise issues, so
that efforts can be focussed where they will do the most good.
• In any situation where there are a number of factors, separate the critical few from the
trivial many.
• Don't give equal weight to all factors. Find the critical few and give them VIP treatment.
• When gathering the information needed to solve a problem, note that most of the answers
will come from a small amount of information (providing it is the right information on the
right key points).
• The right information is a question of quality rather than quantity.
• Sheer volume of data rarely provides its own information automatically.
Identify your Key Results Areas is an example of the Pareto Principle at work:
"The critical few areas in which excellence will have an extraordinary effect on results or
where poor performance would significantly damage the operation".
137

138
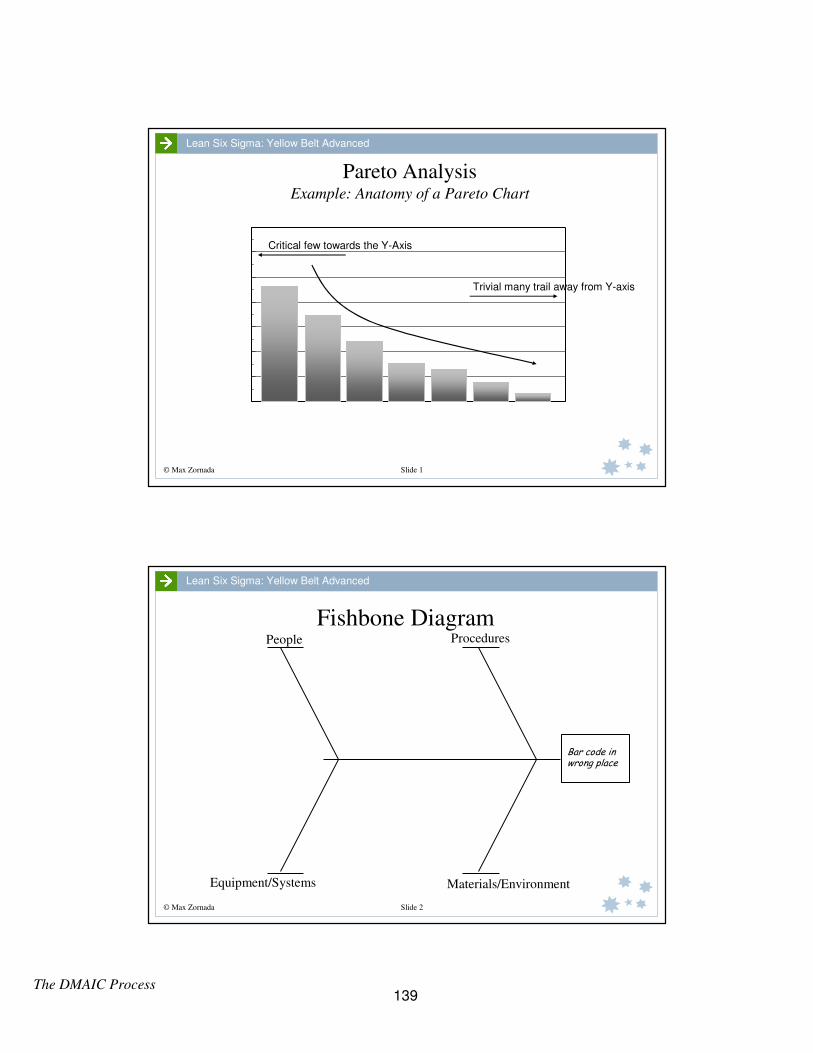
The DMAIC Process
© Max Zornada Slide 1
Lean Six Sigma: Yellow Belt Advanced
Pareto AnalysisExample: Anatomy of a Pareto Chart
Critical few towards the Y-Axis
Trivial many trail away from Y-axis
© Max Zornada Slide 2
Lean Six Sigma: Yellow Belt Advanced
Fishbone DiagramPeople Procedures
Equipment/Systems Materials/Environment
Bar code in wrong place
139
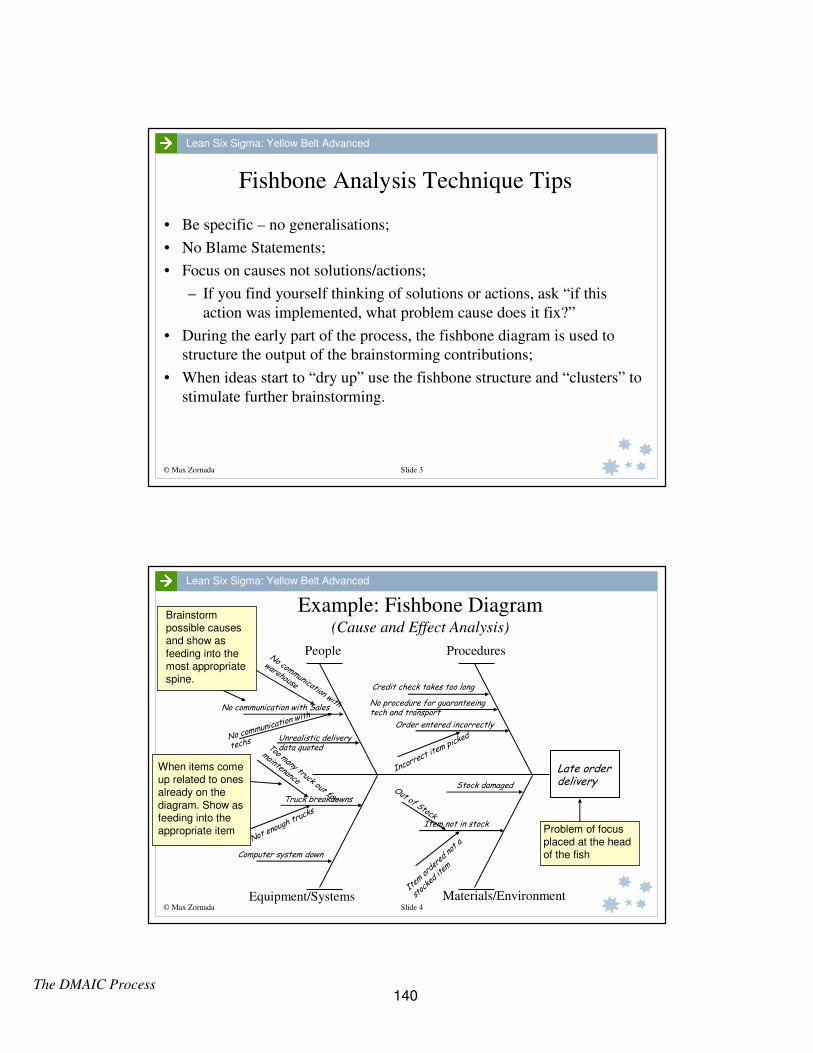
The DMAIC Process
© Max Zornada Slide 3
Lean Six Sigma: Yellow Belt Advanced
Fishbone Analysis Technique Tips
• Be specific – no generalisations;
• No Blame Statements;
• Focus on causes not solutions/actions;
– If you find yourself thinking of solutions or actions, ask “if this
action was implemented, what problem cause does it fix?”
• During the early part of the process, the fishbone diagram is used to
structure the output of the brainstorming contributions;
• When ideas start to “dry up” use the fishbone structure and “clusters” to
stimulate further brainstorming.
© Max Zornada Slide 4
Lean Six Sigma: Yellow Belt Advanced
Example: Fishbone Diagram(Cause and Effect Analysis)
People Procedures
Equipment/Systems Materials/Environment
Late order delivery
Item not in stock
Out of Stock
Item
orde
red
not a
stoc
ked
item
Credit check takes too long
No procedure for guaranteeing tech and transport
Truck breakdowns
Too many truck out for
maintenance
Computer system down
Stock damaged
Order entered incorrectly
Not enough trucks
Incorrect it
em picked
No communication with Sales
No communication with
techs Unrealistic delivery data quoted
No communication with
warehouse
Brainstorm possible causes and show as
feeding into the most appropriate spine.
When items come up related to ones already on the
diagram. Show as feeding into the appropriate item Problem of focus
placed at the head of the fish
140
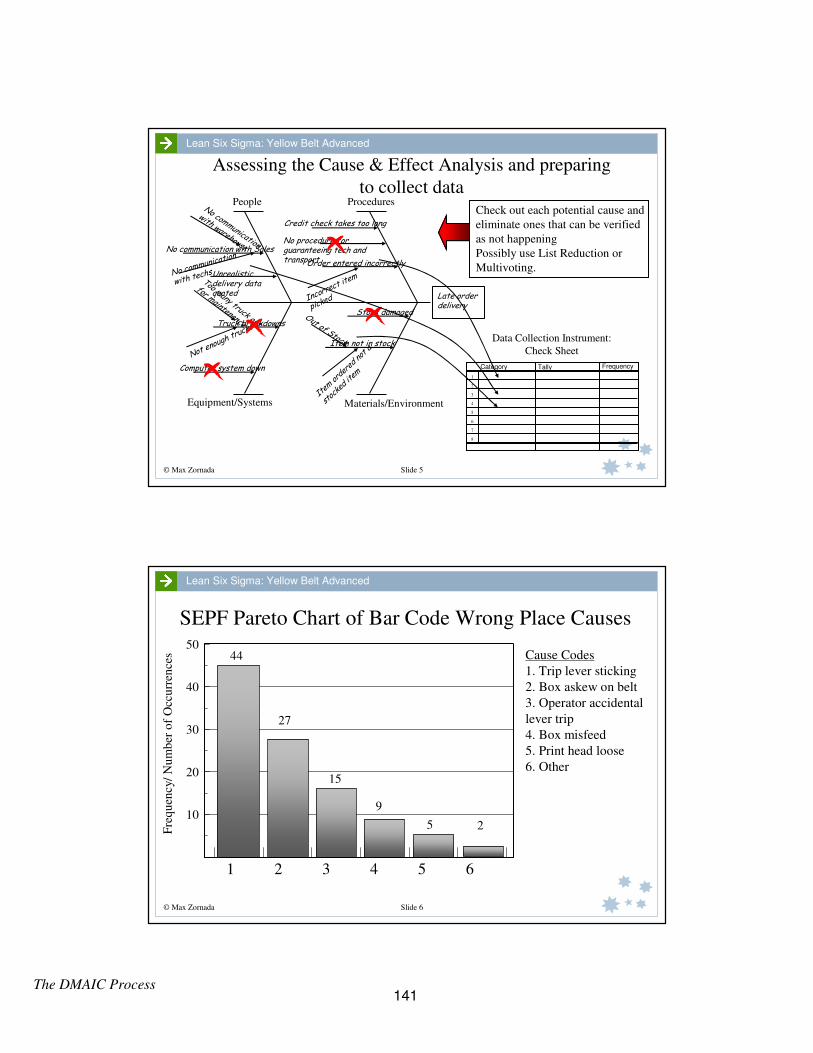
The DMAIC Process
© Max Zornada Slide 5
Lean Six Sigma: Yellow Belt Advanced
Assessing the Cause & Effect Analysis and preparing
to collect dataPeople Procedures
Equipment/Systems Materials/Environment
Late order delivery
Item not in stock
Out of Stock
Item
orde
red
not a
stoc
ked
item
Credit check takes too long
No procedure for guaranteeing tech and transport
Truck breakdowns
Too many truck out
for maintenance
Computer system down
Stock damaged
Order entered incorrectly
Not enough trucks
Incorrect it
em
picked
No communication with Sales
No communication
with techsUnrealistic delivery data quoted
No communication
with warehouse
Category Tally Frequency
1
2
3
4
5
6
7
8
Data Collection Instrument:
Check Sheet
Check out each potential cause and
eliminate ones that can be verified
as not happening
Possibly use List Reduction or
Multivoting.
© Max Zornada Slide 6
Lean Six Sigma: Yellow Belt Advanced
SEPF Pareto Chart of Bar Code Wrong Place Causes
10
20
Fre
qu
ency/
Nu
mb
er o
f O
ccu
rren
ces
30
40
5044
27
15
9
5 2
1 2 3 4 5 6
Cause Codes
1. Trip lever sticking
2. Box askew on belt
3. Operator accidental
lever trip
4. Box misfeed
5. Print head loose
6. Other
141

The DMAIC Process
© Max Zornada Slide 7
Lean Six Sigma: Yellow Belt Advanced
DMAIC Process Storyboard
Cause and Effect DiagramRun chart or
control chartProcess Map
Objective: Identify and implement the measures required to establish
baseline performance and quantify the opportunity.Objective: Define the Problem/Opportunity, Business
Case, Customers & Customer Requirements, and Process.Objective: To allocate a project worth
doing to a capable team.
Output: Project selected, team selected,
project allocated to team.
Develop Business Case
Develop Project Charter
Understand Customer Requirements
Understand the Process.
PRE-DMAIC DEFINE MEASURE
ANALYSE
Output: A quantified picture of the current process performance
(current state) and problem impact.
Key Steps:- Key Steps:-
IMPROVE - I : Generate Potential Solutions
Output: Business Case, Project Charter, Work Plan, Problem
Definition, Measurable Customer Requirements, Process Map
Team charter
Objective: Identify and verify the root cause(s) of the problem.
Objective: Implement the preferred solution. Confirm that the
problem and its root cause(s) have been reduced or eliminated.
Implement preferred solution
Verify effectiveness
Apply comparative methods if
necessary.
Objective: Prevent the problem and its root
cause from recurring.
Standardise the solution
(standards & procedures)
Develop and Implement
PMCS
Document project
Analyse Data
Analyse Process
Determine Potential Root Causes
Form & Test Hypothesis
Verify Root Causes
Key Steps:-
Objective: Determine possible solutions that will address the identified root cause(s) of
the problem.
Generate potential solutions
Assess potential solutions
Select preferred solution
Test/Pilot preferred solution
Develop implementation plan
Before
After
Key steps:-
Flowchart Standard
procedure
Output: Solution embedded and “routinised” in
relevant process, procedures and standards.
Key steps:-
Objectives: Review team effectiveness, plan to
address remaining issues and institutionalise the
learning.
Output: Recommendations for future projects &
improvements to team processes. Project
documentation and learnings “pack”
IMPROVE - II: Implement and Check
Review remaining project
opportunities
Review other applications
Review learnings
C D
MA
I 6σ
CONTROL - Standardise FUTURE PLANS
Output: Root cause(s) identified & verified
Cause and Effect Diagram
(Fishbone)Checksheet
Pareto Chart
Output: Preferred solution or countermeasures
Key Steps:-
Output: Confirmation the best solution to eliminate the problem & its
root cause(s) has been implemented.
Potential Solutions
Key Steps:-
Action Plan
Step 1
Step 2
Step 3
Step 4
Step 5
Step 6
Identify opportunities
Select project
Select team
Allocate to team
Key Steps:-Determine what to Measure
Understand the Measures
Understand Variation
Assess Current Process
Performance
Pareto Chart
© Max Zornada Slide 8
Lean Six Sigma: Yellow Belt Advanced
Potential Solutions Matrix
Potential SolutionsCost Ranking
Ease of Implementation
% of problem it fixes
Overall Ranking
Scale: 0 = None, 1 = Low, 3 = Moderate, 9 = Strong
142
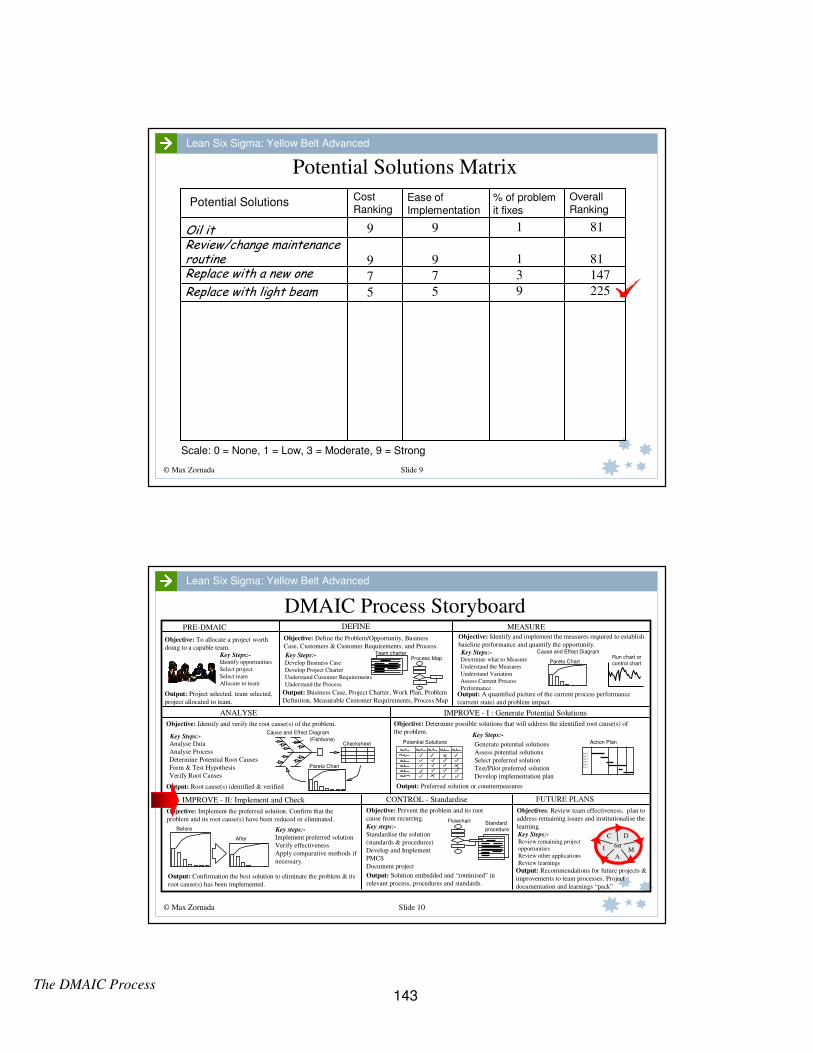
The DMAIC Process
© Max Zornada Slide 9
Lean Six Sigma: Yellow Belt Advanced
Potential Solutions Matrix
Potential SolutionsCost Ranking
Ease of
Implementation
% of problem
it fixes
Overall Ranking
Oil itReview/change maintenance routineReplace with a new one
Replace with light beam
9
9
7
5
9
9
7
5
1
1
3
9
81
81
147
225
Scale: 0 = None, 1 = Low, 3 = Moderate, 9 = Strong
© Max Zornada Slide 10
Lean Six Sigma: Yellow Belt Advanced
DMAIC Process Storyboard
Cause and Effect DiagramRun chart or
control chartProcess Map
Objective: Identify and implement the measures required to establish
baseline performance and quantify the opportunity.Objective: Define the Problem/Opportunity, Business
Case, Customers & Customer Requirements, and Process.Objective: To allocate a project worth
doing to a capable team.
Output: Project selected, team selected,
project allocated to team.
Develop Business Case
Develop Project Charter
Understand Customer Requirements
Understand the Process.
PRE-DMAIC DEFINE MEASURE
ANALYSE
Output: A quantified picture of the current process performance
(current state) and problem impact.
Key Steps:- Key Steps:-
IMPROVE - I : Generate Potential Solutions
Output: Business Case, Project Charter, Work Plan, Problem
Definition, Measurable Customer Requirements, Process Map
Team charter
Objective: Identify and verify the root cause(s) of the problem.
Objective: Implement the preferred solution. Confirm that the
problem and its root cause(s) have been reduced or eliminated.
Implement preferred solution
Verify effectiveness
Apply comparative methods if
necessary.
Objective: Prevent the problem and its root
cause from recurring.
Standardise the solution
(standards & procedures)
Develop and Implement
PMCS
Document project
Analyse Data
Analyse Process
Determine Potential Root Causes
Form & Test Hypothesis
Verify Root Causes
Key Steps:-
Objective: Determine possible solutions that will address the identified root cause(s) of
the problem.
Generate potential solutions
Assess potential solutions
Select preferred solution
Test/Pilot preferred solution
Develop implementation plan
Before
After
Key steps:-
Flowchart Standard
procedure
Output: Solution embedded and “routinised” in
relevant process, procedures and standards.
Key steps:-
Objectives: Review team effectiveness, plan to
address remaining issues and institutionalise the
learning.
Output: Recommendations for future projects &
improvements to team processes. Project
documentation and learnings “pack”
IMPROVE - II: Implement and Check
Review remaining project
opportunities
Review other applications
Review learnings
C D
MA
I 6σ
CONTROL - Standardise FUTURE PLANS
Output: Root cause(s) identified & verified
Cause and Effect Diagram
(Fishbone)Checksheet
Pareto Chart
Output: Preferred solution or countermeasures
Key Steps:-
Output: Confirmation the best solution to eliminate the problem & its
root cause(s) has been implemented.
Potential Solutions
Key Steps:-
Action Plan
Step 1
Step 2
Step 3
Step 4
Step 5
Step 6
Identify opportunities
Select project
Select team
Allocate to team
Key Steps:-Determine what to Measure
Understand the Measures
Understand Variation
Assess Current Process
Performance
Pareto Chart
143

The DMAIC Process
© Max Zornada Slide 11
Lean Six Sigma: Yellow Belt Advanced
Improve: Implement and Check
• Implement preferred solution;
• Verify effectiveness by checking current performance against
original baselines;
• Apply statistical comparative methods if necessary.
Before Pareto Chart After Pareto Chart
© Max Zornada Slide 12
Lean Six Sigma: Yellow Belt Advanced
DMAIC Process Storyboard
Cause and Effect DiagramRun chart or
control chartProcess Map
Objective: Identify and implement the measures required to establish
baseline performance and quantify the opportunity.Objective: Define the Problem/Opportunity, Business
Case, Customers & Customer Requirements, and Process.Objective: To allocate a project worth
doing to a capable team.
Output: Project selected, team selected,
project allocated to team.
Develop Business Case
Develop Project Charter
Understand Customer Requirements
Understand the Process.
PRE-DMAIC DEFINE MEASURE
ANALYSE
Output: A quantified picture of the current process performance
(current state) and problem impact.
Key Steps:- Key Steps:-
IMPROVE - I : Generate Potential Solutions
Output: Business Case, Project Charter, Work Plan, Problem
Definition, Measurable Customer Requirements, Process Map
Team charter
Objective: Identify and verify the root cause(s) of the problem.
Objective: Implement the preferred solution. Confirm that the
problem and its root cause(s) have been reduced or eliminated.
Implement preferred solution
Verify effectiveness
Apply comparative methods if
necessary.
Objective: Prevent the problem and its root
cause from recurring.
Standardise the solution
(standards & procedures)
Develop and Implement
PMCS
Document project
Analyse Data
Analyse Process
Determine Potential Root Causes
Form & Test Hypothesis
Verify Root Causes
Key Steps:-
Objective: Determine possible solutions that will address the identified root cause(s) of
the problem.
Generate potential solutions
Assess potential solutions
Select preferred solution
Test/Pilot preferred solution
Develop implementation plan
Before
After
Key steps:-
Flowchart Standard
procedure
Output: Solution embedded and “routinised” in
relevant process, procedures and standards.
Key steps:-
Objectives: Review team effectiveness, plan to
address remaining issues and institutionalise the
learning.
Output: Recommendations for future projects &
improvements to team processes. Project
documentation and learnings “pack”
IMPROVE - II: Implement and Check
Review remaining project
opportunities
Review other applications
Review learnings
C D
MA
I 6σ
CONTROL - Standardise FUTURE PLANS
Output: Root cause(s) identified & verified
Cause and Effect Diagram
(Fishbone)Checksheet
Pareto Chart
Output: Preferred solution or countermeasures
Key Steps:-
Output: Confirmation the best solution to eliminate the problem & its
root cause(s) has been implemented.
Potential Solutions
Key Steps:-
Action Plan
Step 1
Step 2
Step 3
Step 4
Step 5
Step 6
Identify opportunities
Select project
Select team
Allocate to team
Key Steps:-Determine what to Measure
Understand the Measures
Understand Variation
Assess Current Process
Performance
Pareto Chart
144
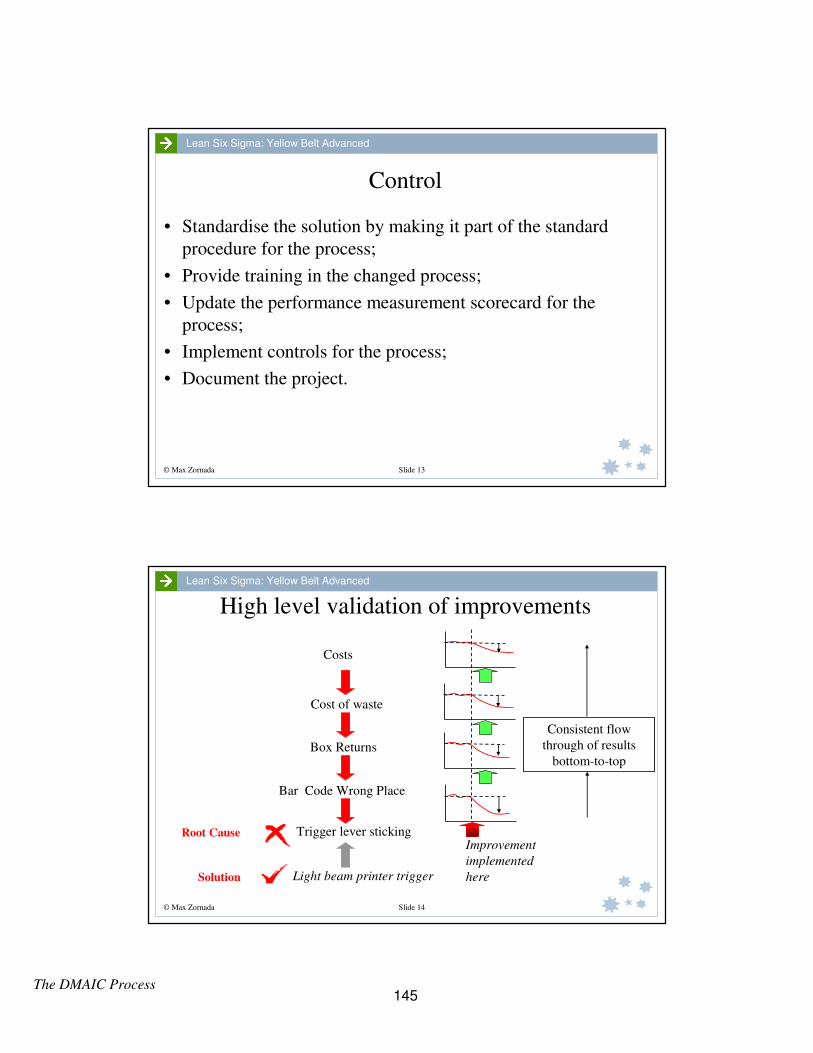
The DMAIC Process
© Max Zornada Slide 13
Lean Six Sigma: Yellow Belt Advanced
Control
• Standardise the solution by making it part of the standard
procedure for the process;
• Provide training in the changed process;
• Update the performance measurement scorecard for the
process;
• Implement controls for the process;
• Document the project.
© Max Zornada Slide 14
Lean Six Sigma: Yellow Belt Advanced
High level validation of improvements
Costs
Cost of waste
Box Returns
Bar Code Wrong Place
Trigger lever sticking
Light beam printer trigger
Root Cause
Solution
Improvement
implemented
here
Consistent flow
through of results
bottom-to-top
145

The DMAIC Process
© Max Zornada Slide 15
Lean Six Sigma: Yellow Belt Advanced
DMAIC Process Storyboard
Cause and Effect DiagramRun chart or
control chartProcess Map
Objective: Identify and implement the measures required to establish
baseline performance and quantify the opportunity.Objective: Define the Problem/Opportunity, Business
Case, Customers & Customer Requirements, and Process.Objective: To allocate a project worth
doing to a capable team.
Output: Project selected, team selected,
project allocated to team.
Develop Business Case
Develop Project Charter
Understand Customer Requirements
Understand the Process.
PRE-DMAIC DEFINE MEASURE
ANALYSE
Output: A quantified picture of the current process performance
(current state) and problem impact.
Key Steps:- Key Steps:-
IMPROVE - I : Generate Potential Solutions
Output: Business Case, Project Charter, Work Plan, Problem
Definition, Measurable Customer Requirements, Process Map
Team charter
Objective: Identify and verify the root cause(s) of the problem.
Objective: Implement the preferred solution. Confirm that the
problem and its root cause(s) have been reduced or eliminated.
Implement preferred solution
Verify effectiveness
Apply comparative methods if
necessary.
Objective: Prevent the problem and its root
cause from recurring.
Standardise the solution
(standards & procedures)
Develop and Implement
PMCS
Document project
Analyse Data
Analyse Process
Determine Potential Root Causes
Form & Test Hypothesis
Verify Root Causes
Key Steps:-
Objective: Determine possible solutions that will address the identified root cause(s) of
the problem.
Generate potential solutions
Assess potential solutions
Select preferred solution
Test/Pilot preferred solution
Develop implementation plan
Before
After
Key steps:-
Flowchart Standard
procedure
Output: Solution embedded and “routinised” in
relevant process, procedures and standards.
Key steps:-
Objectives: Review team effectiveness, plan to
address remaining issues and institutionalise the
learning.
Output: Recommendations for future projects &
improvements to team processes. Project
documentation and learnings “pack”
IMPROVE - II: Implement and Check
Review remaining project
opportunities
Review other applications
Review learnings
C D
MA
I 6σ
CONTROL - Standardise FUTURE PLANS
Output: Root cause(s) identified & verified
Cause and Effect Diagram
(Fishbone)Checksheet
Pareto Chart
Output: Preferred solution or countermeasures
Key Steps:-
Output: Confirmation the best solution to eliminate the problem & its
root cause(s) has been implemented.
Potential Solutions
Key Steps:-
Action Plan
Step 1
Step 2
Step 3
Step 4
Step 5
Step 6
Identify opportunities
Select project
Select team
Allocate to team
Key Steps:-Determine what to Measure
Understand the Measures
Understand Variation
Assess Current Process
Performance
Pareto Chart
© Max Zornada Slide 16
Lean Six Sigma: Yellow Belt Advanced
Future Plans
• Review the previous non-pareto causes to see which ones
have upgraded themselves and assess whether these are worth
going after;
• Review any obvious opportunities to apply the solution in
other areas;
• Communicate the solution to other parts of the organisation
where it may also apply;
• Review and document lessons learnt and institutionalise the
learning.
146
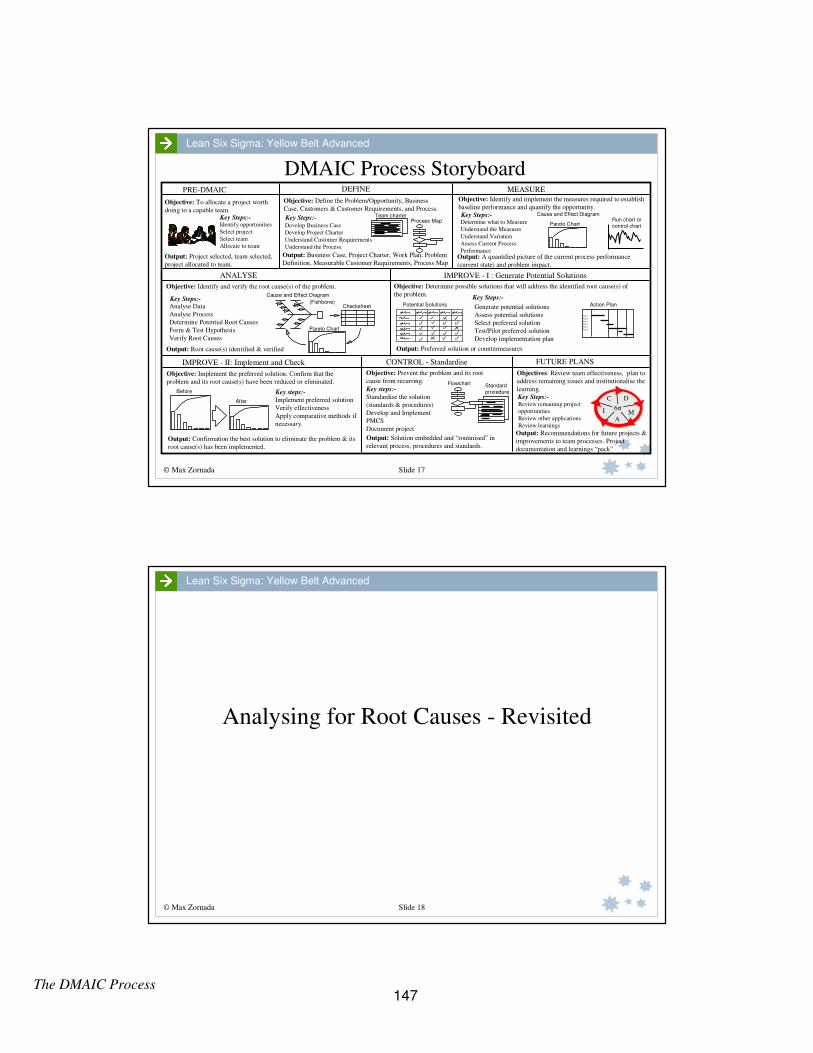
The DMAIC Process
© Max Zornada Slide 17
Lean Six Sigma: Yellow Belt Advanced
DMAIC Process Storyboard
Cause and Effect DiagramRun chart or
control chartProcess Map
Objective: Identify and implement the measures required to establish
baseline performance and quantify the opportunity.Objective: Define the Problem/Opportunity, Business
Case, Customers & Customer Requirements, and Process.Objective: To allocate a project worth
doing to a capable team.
Output: Project selected, team selected,
project allocated to team.
Develop Business Case
Develop Project Charter
Understand Customer Requirements
Understand the Process.
PRE-DMAIC DEFINE MEASURE
ANALYSE
Output: A quantified picture of the current process performance
(current state) and problem impact.
Key Steps:- Key Steps:-
IMPROVE - I : Generate Potential Solutions
Output: Business Case, Project Charter, Work Plan, Problem
Definition, Measurable Customer Requirements, Process Map
Team charter
Objective: Identify and verify the root cause(s) of the problem.
Objective: Implement the preferred solution. Confirm that the
problem and its root cause(s) have been reduced or eliminated.
Implement preferred solution
Verify effectiveness
Apply comparative methods if
necessary.
Objective: Prevent the problem and its root
cause from recurring.
Standardise the solution
(standards & procedures)
Develop and Implement
PMCS
Document project
Analyse Data
Analyse Process
Determine Potential Root Causes
Form & Test Hypothesis
Verify Root Causes
Key Steps:-
Objective: Determine possible solutions that will address the identified root cause(s) of
the problem.
Generate potential solutions
Assess potential solutions
Select preferred solution
Test/Pilot preferred solution
Develop implementation plan
Before
After
Key steps:-
Flowchart Standard
procedure
Output: Solution embedded and “routinised” in
relevant process, procedures and standards.
Key steps:-
Objectives: Review team effectiveness, plan to
address remaining issues and institutionalise the
learning.
Output: Recommendations for future projects &
improvements to team processes. Project
documentation and learnings “pack”
IMPROVE - II: Implement and Check
Review remaining project
opportunities
Review other applications
Review learnings
C D
MA
I 6σ
CONTROL - Standardise FUTURE PLANS
Output: Root cause(s) identified & verified
Cause and Effect Diagram
(Fishbone)Checksheet
Pareto Chart
Output: Preferred solution or countermeasures
Key Steps:-
Output: Confirmation the best solution to eliminate the problem & its
root cause(s) has been implemented.
Potential Solutions
Key Steps:-
Action Plan
Step 1
Step 2
Step 3
Step 4
Step 5
Step 6
Identify opportunities
Select project
Select team
Allocate to team
Key Steps:-Determine what to Measure
Understand the Measures
Understand Variation
Assess Current Process
Performance
Pareto Chart
© Max Zornada Slide 18
Lean Six Sigma: Yellow Belt Advanced
Analysing for Root Causes - Revisited
147
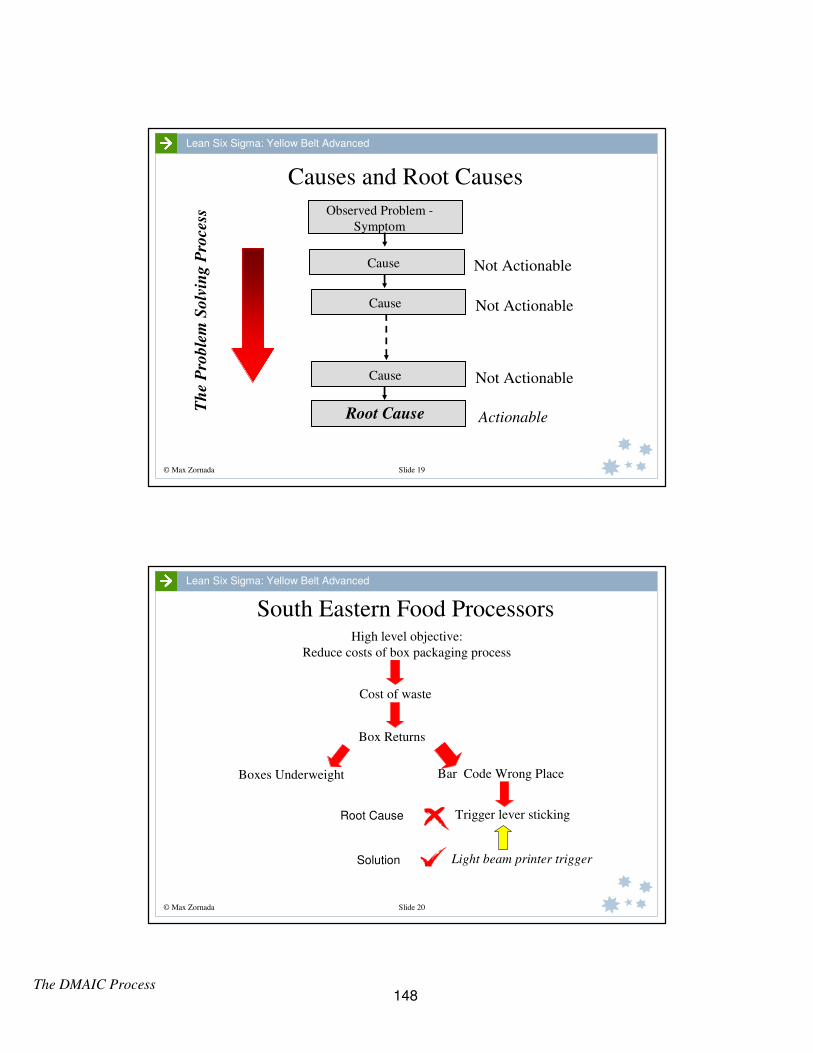
The DMAIC Process
© Max Zornada Slide 19
Lean Six Sigma: Yellow Belt Advanced
Causes and Root CausesT
he
Pro
ble
m S
olv
ing P
roce
ss
Not Actionable
Not Actionable
Not Actionable
Actionable
Cause
Cause
Cause
Root Cause
Observed Problem -
Symptom
© Max Zornada Slide 20
Lean Six Sigma: Yellow Belt Advanced
South Eastern Food ProcessorsHigh level objective:
Reduce costs of box packaging process
Cost of waste
Box Returns
Boxes Underweight Bar Code Wrong Place
Trigger lever sticking
Light beam printer trigger
Root Cause
Solution
148
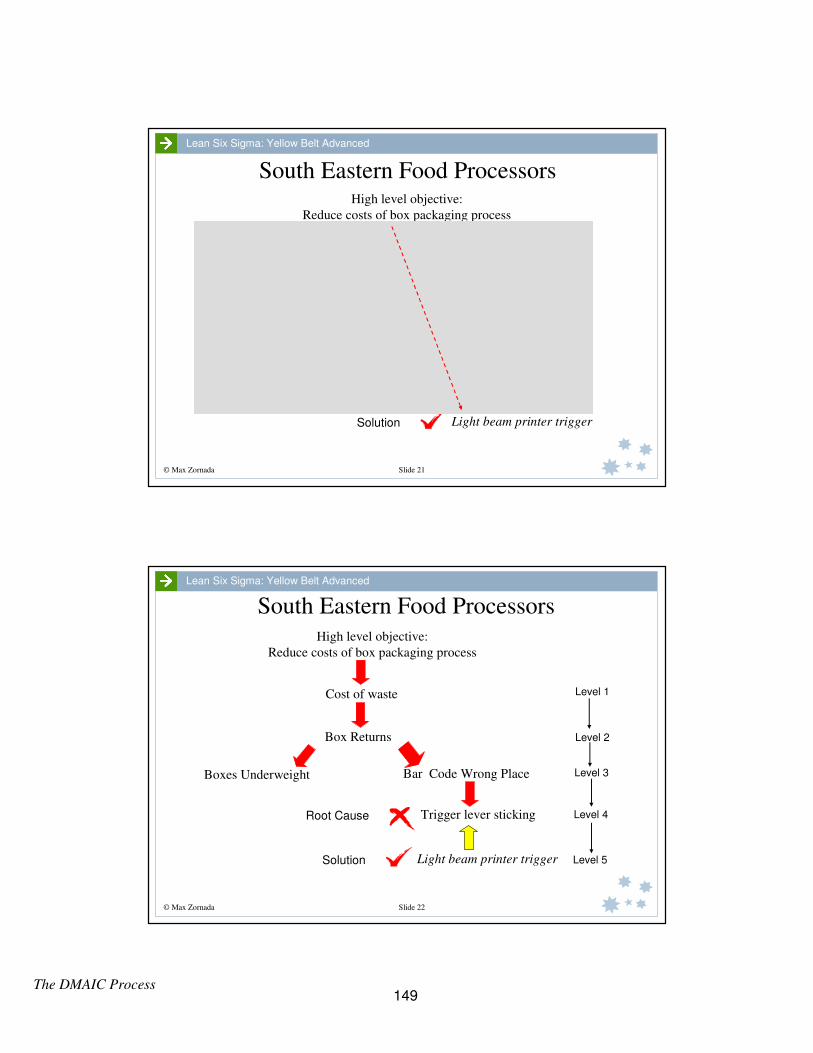
The DMAIC Process
© Max Zornada Slide 21
Lean Six Sigma: Yellow Belt Advanced
South Eastern Food ProcessorsHigh level objective:
Reduce costs of box packaging process
Cost of waste
Box Returns
Boxes Underweight Bar Code Wrong Place
Trigger lever sticking
Light beam printer trigger
Root Cause
Solution
© Max Zornada Slide 22
Lean Six Sigma: Yellow Belt Advanced
South Eastern Food Processors
High level objective:
Reduce costs of box packaging process
Cost of waste
Box Returns
Boxes Underweight Bar Code Wrong Place
Trigger lever sticking
Light beam printer trigger
Root Cause
Solution
Level 1
Level 2
Level 3
Level 4
Level 5
149

The DMAIC Process
© Max Zornada Slide 23
Lean Six Sigma: Yellow Belt Advanced
No
Yes
Analysing for Root Causes
• Brainstorm possible causes. Fishbone
Diagram (Cause and Effect Analysis).
• Collect Data. Outcomes of Fishbone used
to design Check sheet or other appropriate
data gathering proforma.
• Analyse Data using Pareto chart,
determine most likely cause.
• If cause not actionable, redefine problem
to determine causes of this cause.
Is cause
actionable?
Define the problem
© Max Zornada Slide 24
Lean Six Sigma: Yellow Belt Advanced
Flushing out root causes vs reacting to symptoms
Apply problem solving process
YES
YES
NO
NO
Problem Solved
Observed symptom - "The Problem"
Is cause actionable ?Not a root cause
Does action(s) fix
problem ?
Cause found
Not the right cause
150
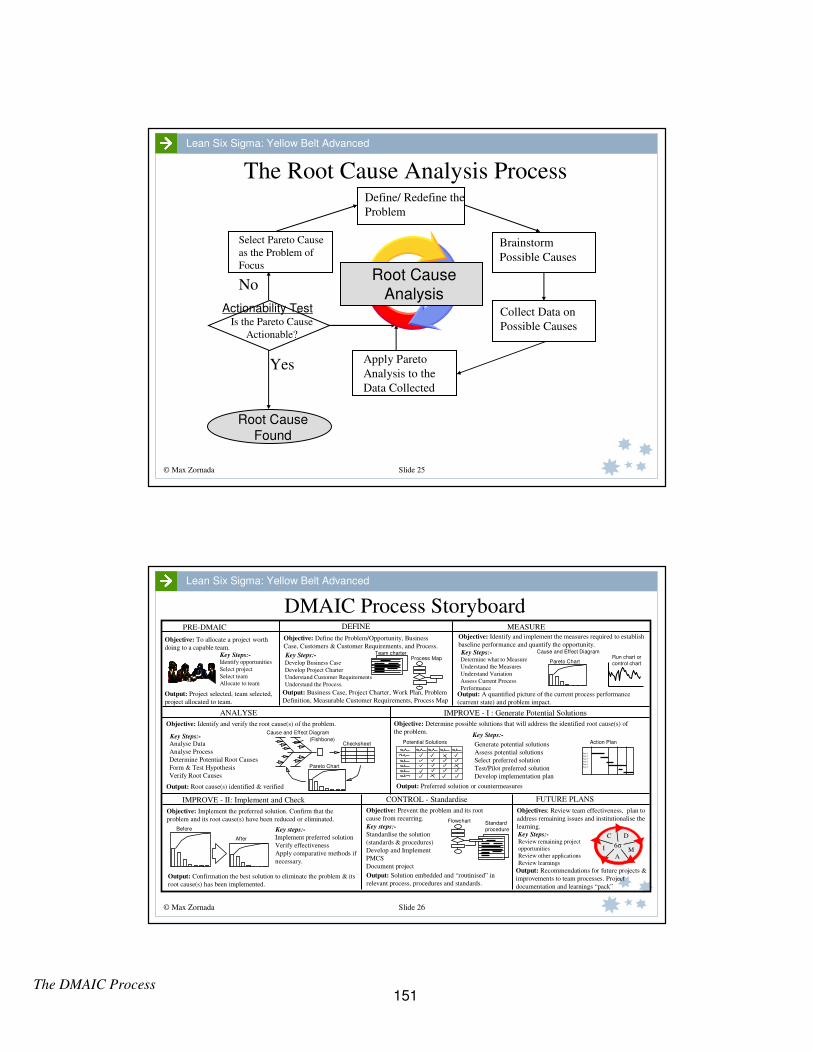
The DMAIC Process
© Max Zornada Slide 25
Lean Six Sigma: Yellow Belt Advanced
The Root Cause Analysis ProcessDefine/ Redefine the
Problem
Brainstorm
Possible Causes
Select Pareto Cause
as the Problem of
Focus
Collect Data on
Possible CausesIs the Pareto Cause
Actionable?
Apply Pareto
Analysis to the
Data Collected
Root Cause
Analysis
Root Cause
Found
Actionability Test
Yes
No
© Max Zornada Slide 26
Lean Six Sigma: Yellow Belt Advanced
DMAIC Process Storyboard
Cause and Effect DiagramRun chart or
control chartProcess Map
Objective: Identify and implement the measures required to establish
baseline performance and quantify the opportunity.Objective: Define the Problem/Opportunity, Business
Case, Customers & Customer Requirements, and Process.Objective: To allocate a project worth
doing to a capable team.
Output: Project selected, team selected,
project allocated to team.
Develop Business Case
Develop Project Charter
Understand Customer Requirements
Understand the Process.
PRE-DMAIC DEFINE MEASURE
ANALYSE
Output: A quantified picture of the current process performance
(current state) and problem impact.
Key Steps:- Key Steps:-
IMPROVE - I : Generate Potential Solutions
Output: Business Case, Project Charter, Work Plan, Problem
Definition, Measurable Customer Requirements, Process Map
Team charter
Objective: Identify and verify the root cause(s) of the problem.
Objective: Implement the preferred solution. Confirm that the
problem and its root cause(s) have been reduced or eliminated.
Implement preferred solution
Verify effectiveness
Apply comparative methods if
necessary.
Objective: Prevent the problem and its root
cause from recurring.
Standardise the solution
(standards & procedures)
Develop and Implement
PMCS
Document project
Analyse Data
Analyse Process
Determine Potential Root Causes
Form & Test Hypothesis
Verify Root Causes
Key Steps:-
Objective: Determine possible solutions that will address the identified root cause(s) of
the problem.
Generate potential solutions
Assess potential solutions
Select preferred solution
Test/Pilot preferred solution
Develop implementation plan
Before
After
Key steps:-
Flowchart Standard
procedure
Output: Solution embedded and “routinised” in
relevant process, procedures and standards.
Key steps:-
Objectives: Review team effectiveness, plan to
address remaining issues and institutionalise the
learning.
Output: Recommendations for future projects &
improvements to team processes. Project
documentation and learnings “pack”
IMPROVE - II: Implement and Check
Review remaining project
opportunities
Review other applications
Review learnings
C D
MA
I 6σ
CONTROL - Standardise FUTURE PLANS
Output: Root cause(s) identified & verified
Cause and Effect Diagram
(Fishbone)Checksheet
Pareto Chart
Output: Preferred solution or countermeasures
Key Steps:-
Output: Confirmation the best solution to eliminate the problem & its
root cause(s) has been implemented.
Potential Solutions
Key Steps:-
Action Plan
Step 1
Step 2
Step 3
Step 4
Step 5
Step 6
Identify opportunities
Select project
Select team
Allocate to team
Key Steps:-Determine what to Measure
Understand the Measures
Understand Variation
Assess Current Process
Performance
Pareto Chart
151
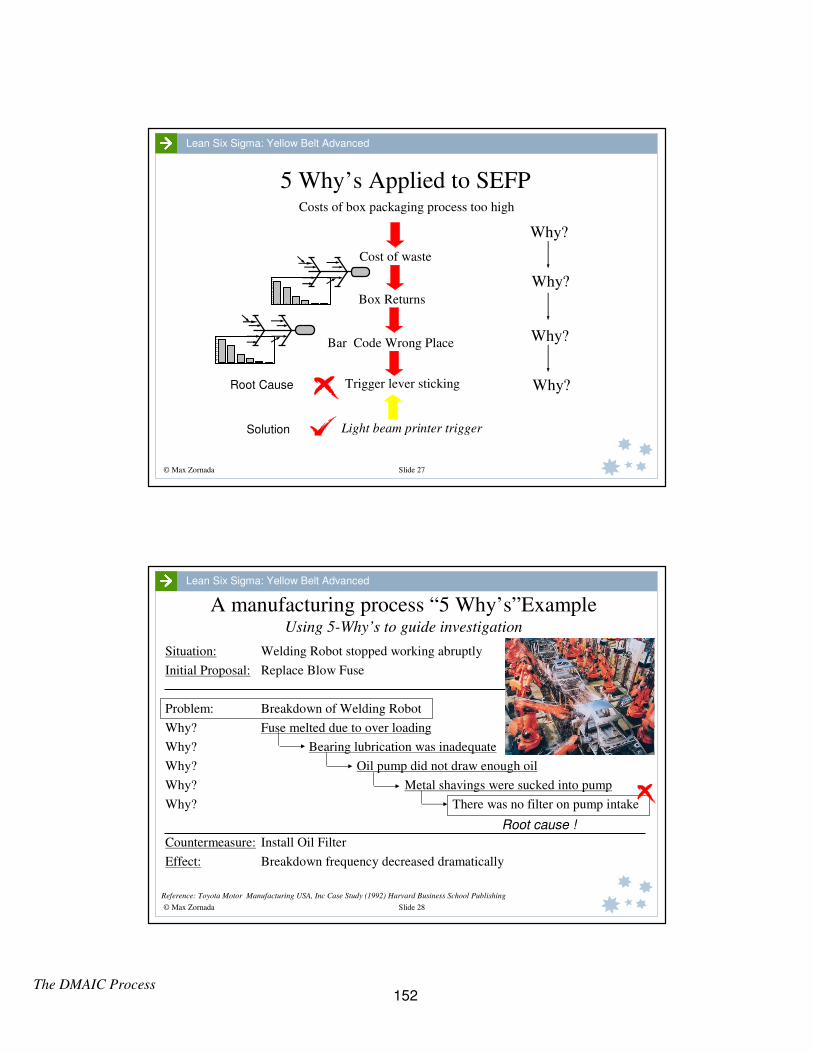
The DMAIC Process
© Max Zornada Slide 27
Lean Six Sigma: Yellow Belt Advanced
5 Why’s Applied to SEFPCosts of box packaging process too high
Cost of waste
Box Returns
Bar Code Wrong Place
Trigger lever sticking
Light beam printer trigger
Root Cause
Solution
Why?
Why?
Why?
Why?
© Max Zornada Slide 28
Lean Six Sigma: Yellow Belt Advanced
A manufacturing process “5 Why’s”ExampleUsing 5-Why’s to guide investigation
Situation: Welding Robot stopped working abruptly
Initial Proposal: Replace Blow Fuse
Problem: Breakdown of Welding Robot
Why? Fuse melted due to over loading
Why? Bearing lubrication was inadequate
Why? Oil pump did not draw enough oil
Why? Metal shavings were sucked into pump
Why? There was no filter on pump intake
Countermeasure: Install Oil Filter
Effect: Breakdown frequency decreased dramatically
Root cause !
Reference: Toyota Motor Manufacturing USA, Inc Case Study (1992) Harvard Business School Publishing
152
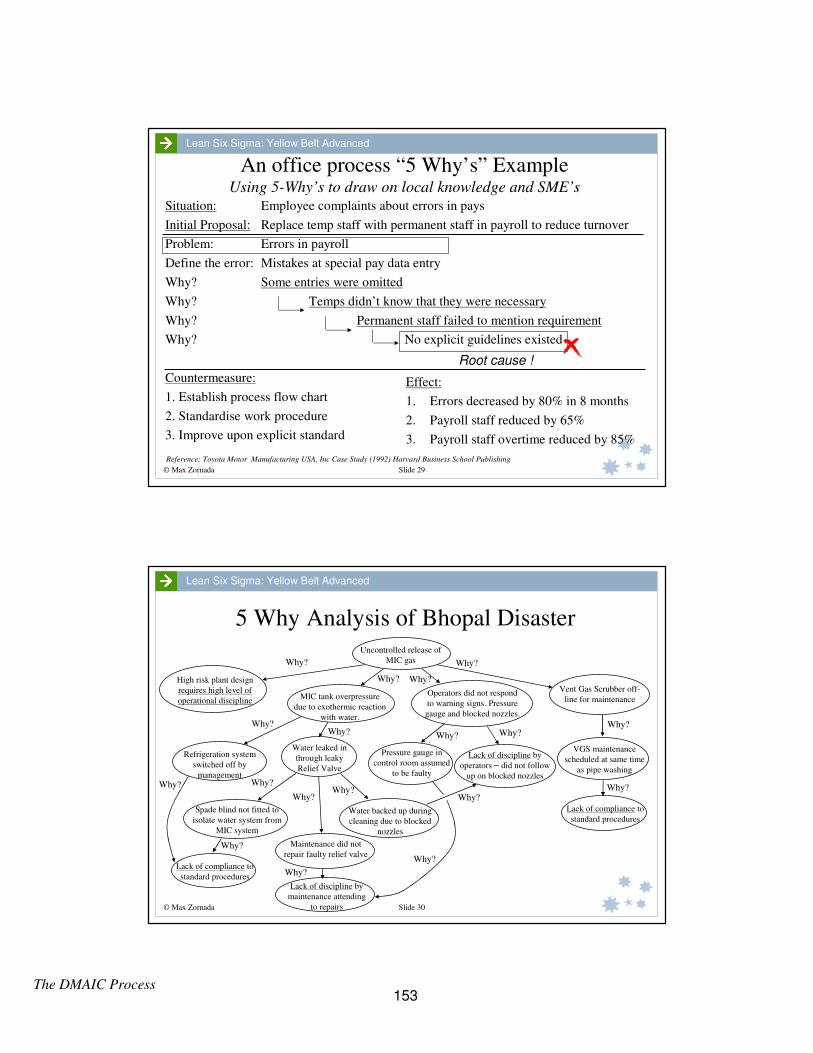
The DMAIC Process
© Max Zornada Slide 29
Lean Six Sigma: Yellow Belt Advanced
An office process “5 Why’s” ExampleUsing 5-Why’s to draw on local knowledge and SME’s
Situation: Employee complaints about errors in pays
Initial Proposal: Replace temp staff with permanent staff in payroll to reduce turnover
Problem: Errors in payroll
Define the error: Mistakes at special pay data entry
Why? Some entries were omitted
Why? Temps didn’t know that they were necessary
Why? Permanent staff failed to mention requirement
Why? No explicit guidelines existed
Countermeasure:
1. Establish process flow chart
2. Standardise work procedure
3. Improve upon explicit standard
Root cause !
Effect:
1. Errors decreased by 80% in 8 months
2. Payroll staff reduced by 65%
3. Payroll staff overtime reduced by 85%
Reference: Toyota Motor Manufacturing USA, Inc Case Study (1992) Harvard Business School Publishing
© Max Zornada Slide 30
Lean Six Sigma: Yellow Belt Advanced
5 Why Analysis of Bhopal Disaster
Uncontrolled release of
MIC gas
High risk plant design
requires high level of
operational disciplineMIC tank overpressure
due to exothermic reaction
with water.
Operators did not respond
to warning signs. Pressure
gauge and blocked nozzles.
Vent Gas Scrubber off-
line for maintenance
Refrigeration system
switched off by
management
Water leaked in
through leaky
Relief Valve
VGS maintenance
scheduled at same time
as pipe washing
Lack of compliance to
standard procedures
Lack of discipline by
operators – did not follow
up on blocked nozzles
Spade blind not fitted to
isolate water system from
MIC system
Maintenance did not
repair faulty relief valve
Pressure gauge in
control room assumed
to be faulty
Water backed up during
cleaning due to blocked
nozzles
Lack of compliance to
standard proceduresLack of discipline by
maintenance attending
to repairs
Why?
Why?
Why?
Why?Why?
Why?
Why? Why?
Why?
Why?
Why?
Why?Why?
Why?
Why?
Why?
Why?
Why?
153

The DMAIC Process
© Max Zornada Slide 31
Lean Six Sigma: Yellow Belt Advanced
Seek problem causes that are solvable
• Seek to find causes that are in direct control of the problem
solver;
• Do not find fault with people, suppliers or customers,
– “5 why’s” not “5 who’s”
– “Root cause” not “root blame”
• Do not accept causes as “the way it is”
• Do not pursue “dead ends”.
154
The DMADV Process
Process Change/Reengineering
155

156
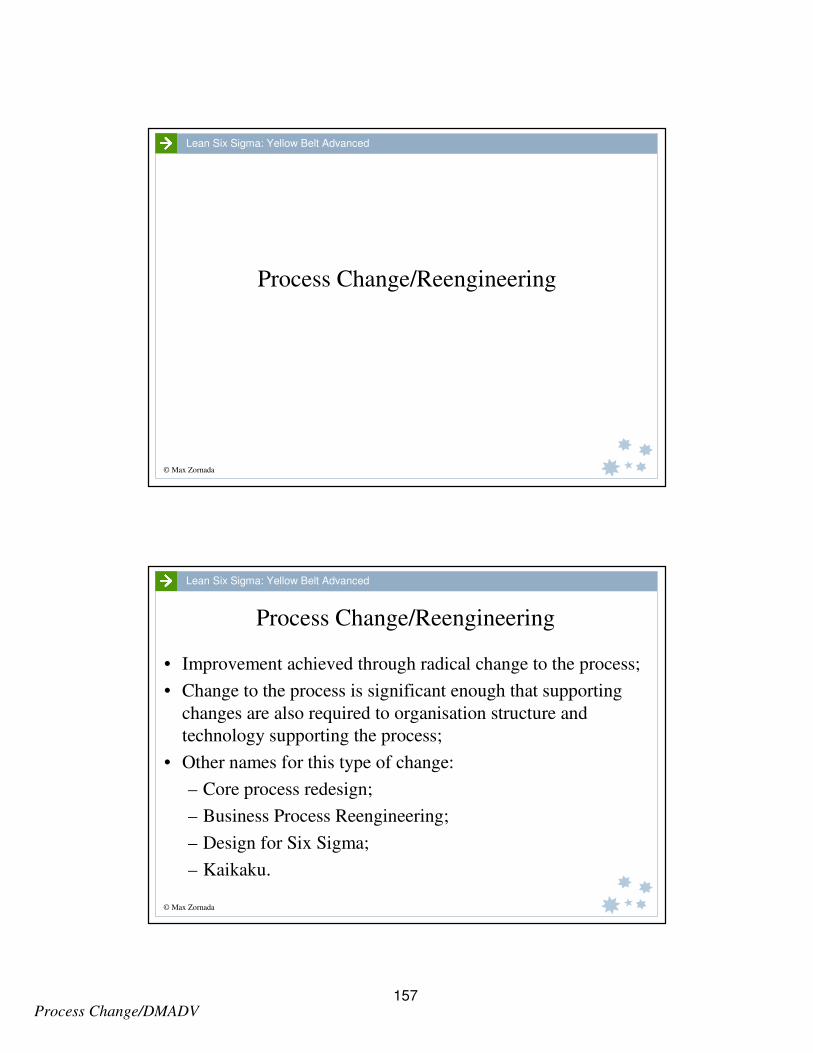
Process Change/DMADV
© Max Zornada
Lean Six Sigma: Yellow Belt Advanced
Process Change/Reengineering
© Max Zornada
Lean Six Sigma: Yellow Belt Advanced
Process Change/Reengineering
• Improvement achieved through radical change to the process;
• Change to the process is significant enough that supporting
changes are also required to organisation structure and
technology supporting the process;
• Other names for this type of change:
– Core process redesign;
– Business Process Reengineering;
– Design for Six Sigma;
– Kaikaku.
157

Process Change/DMADV
© Max Zornada
Lean Six Sigma: Yellow Belt Advanced
The Lean Six Sigma Approach to Process
Redesign - DMADV
Define
Measure
Analyse
Design
Validate
6σ
Define customer requirements
and goals for the process,
product or service.
Measure and match
performance to customer
requirements.
Analyze and assess the
design for the process,
product or service.
Design and implement the array
of new processes required for the
new process, product or service.
Validate results and
maintain performance.
158
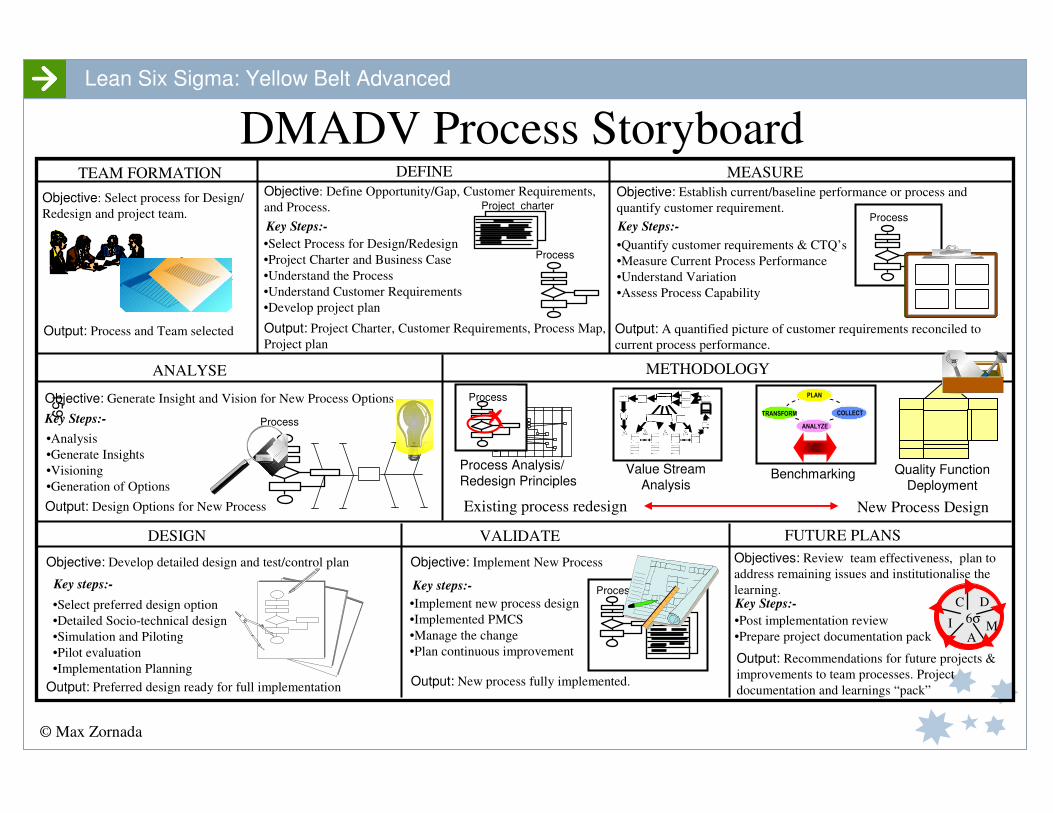
© Max Zornada
Lean Six Sigma: Yellow Belt Advanced
Process
Objective: Establish current/baseline performance or process and
quantify customer requirement.
Objective: Define Opportunity/Gap, Customer Requirements,
and Process.Objective: Select process for Design/
Redesign and project team.
Output: Process and Team selected
TEAM FORMATION DEFINE MEASURE
ANALYSE
Output: A quantified picture of customer requirements reconciled to
current process performance.
Key Steps:- Key Steps:-
Output: Project Charter, Customer Requirements, Process Map,
Project plan
Project charter
Objective: Generate Insight and Vision for New Process Options
Objective: Develop detailed design and test/control plan Objective: Implement New Process
Key Steps:-
Key steps:-
Output: New process fully implemented.
Key steps:-
Objectives: Review team effectiveness, plan to
address remaining issues and institutionalise the
learning.
Output: Recommendations for future projects &
improvements to team processes. Project
documentation and learnings “pack”
DESIGN
C D
MA
I 6σ
VALIDATE FUTURE PLANS
Output: Design Options for New Process
Output: Preferred design ready for full implementation
Key Steps:-
•Select Process for Design/Redesign
•Project Charter and Business Case
•Understand the Process
•Understand Customer Requirements
•Develop project plan
•Implement new process design
•Implemented PMCS
•Manage the change
•Plan continuous improvement
•Select preferred design option
•Detailed Socio-technical design
•Simulation and Piloting
•Pilot evaluation
•Implementation Planning
•Analysis
•Generate Insights
•Visioning
•Generation of Options
METHODOLOGY
Process
•Quantify customer requirements & CTQ’s
•Measure Current Process Performance
•Understand Variation
•Assess Process Capability
Process
Process PLAN
TRANSFORM
ANALYZE
COLLECT
Process Analysis/
Redesign PrinciplesValue Stream
AnalysisBenchmarking Quality Function
Deployment
Existing process redesign New Process Design
•Post implementation review
•Prepare project documentation pack
Process PMCS
DMADV Process Storyboard
159
© Max Zornada
Lean Six Sigma: Yellow Belt Advanced
160
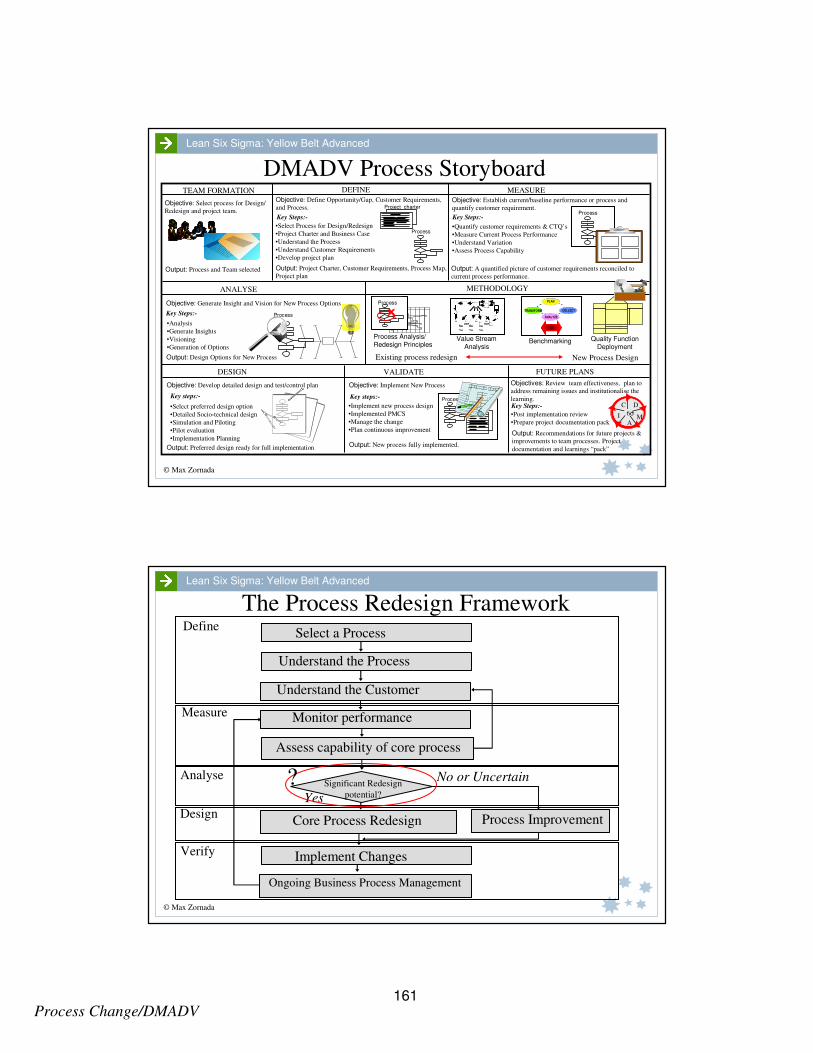
Process Change/DMADV
© Max Zornada
Lean Six Sigma: Yellow Belt Advanced
Process
Objective: Establish current/baseline performance or process and
quantify customer requirement.
Objective: Define Opportunity/Gap, Customer Requirements,
and Process.Objective: Select process for Design/
Redesign and project team.
Output: Process and Team selected
TEAM FORMATION DEFINE MEASURE
ANALYSE
Output: A quantified picture of customer requirements reconciled to
current process performance.
Key Steps:- Key Steps:-
Output: Project Charter, Customer Requirements, Process Map,
Project plan
Project charter
Objective: Generate Insight and Vision for New Process Options
Objective: Develop detailed design and test/control plan Objective: Implement New Process
Key Steps:-
Key steps:-
Output: New process fully implemented.
Key steps:-
Objectives: Review team effectiveness, plan to
address remaining issues and institutionalise the
learning.
Output: Recommendations for future projects &
improvements to team processes. Project
documentation and learnings “pack”
DESIGN
C D
MA
I 6σ
VALIDATE FUTURE PLANS
Output: Design Options for New Process
Output: Preferred design ready for full implementation
Key Steps:-
•Select Process for Design/Redesign
•Project Charter and Business Case
•Understand the Process
•Understand Customer Requirements
•Develop project plan
•Implement new process design
•Implemented PMCS
•Manage the change
•Plan continuous improvement
•Select preferred design option
•Detailed Socio-technical design
•Simulation and Piloting
•Pilot evaluation
•Implementation Planning
•Analysis
•Generate Insights
•Visioning
•Generation of Options
METHODOLOGY
Process
•Quantify customer requirements & CTQ’s
•Measure Current Process Performance
•Understand Variation
•Assess Process Capability
Process
Process PLAN
TRANSFORM
ANALYZE
COLLECT
Process Analysis/ Redesign Principles
Value Stream Analysis
Benchmarking Quality Function Deployment
Existing process redesign New Process Design
•Post implementation review
•Prepare project documentation pack
Process PMCS
DMADV Process Storyboard
© Max Zornada
Lean Six Sigma: Yellow Belt Advanced
The Process Redesign Framework Define
Measure
Analyse
Design
Verify
No or Uncertain
Yes
?
Understand the Process
Understand the Customer
Monitor performance
Assess capability of core process
Significant Redesign
potential?
Core Process Redesign Process Improvement
Ongoing Business Process Management
Implement Changes
Select a Process
161
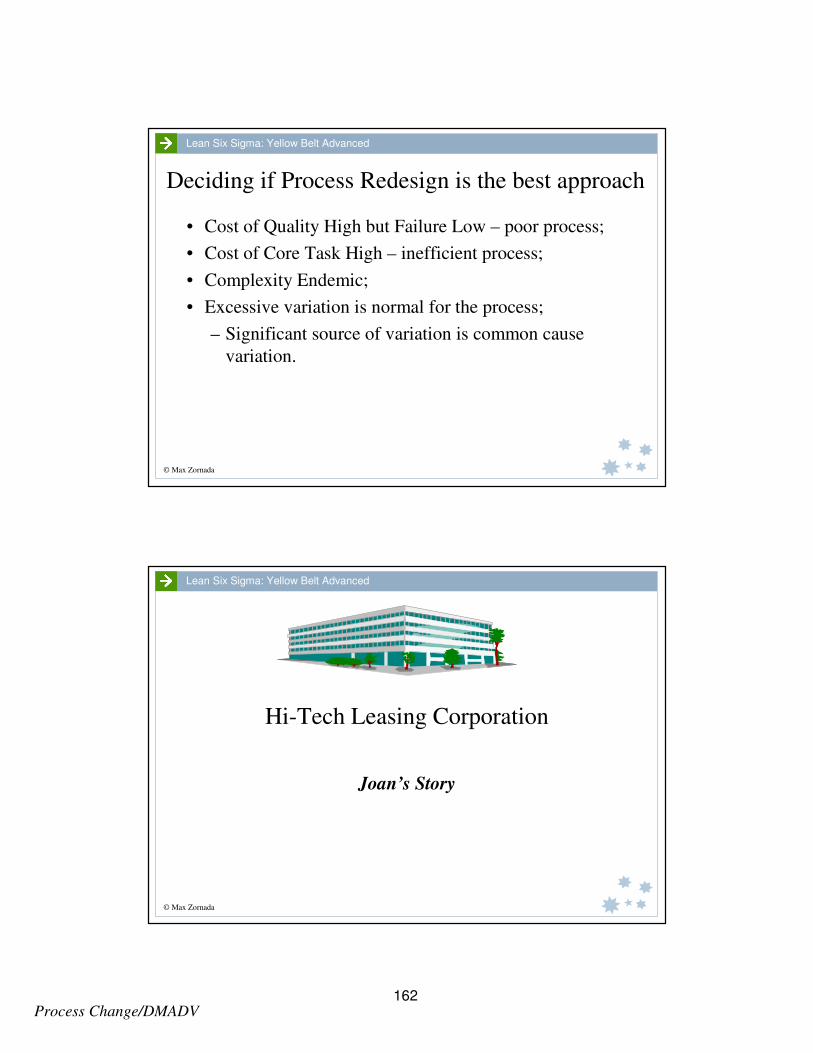
Process Change/DMADV
© Max Zornada
Lean Six Sigma: Yellow Belt Advanced
Deciding if Process Redesign is the best approach
• Cost of Quality High but Failure Low – poor process;
• Cost of Core Task High – inefficient process;
• Complexity Endemic;
• Excessive variation is normal for the process;
– Significant source of variation is common cause
variation.
© Max Zornada
Lean Six Sigma: Yellow Belt Advanced
Hi-Tech Leasing Corporation
Joan’s Story
162

Joan's Story Hi-Tech Leasing Corporation
163
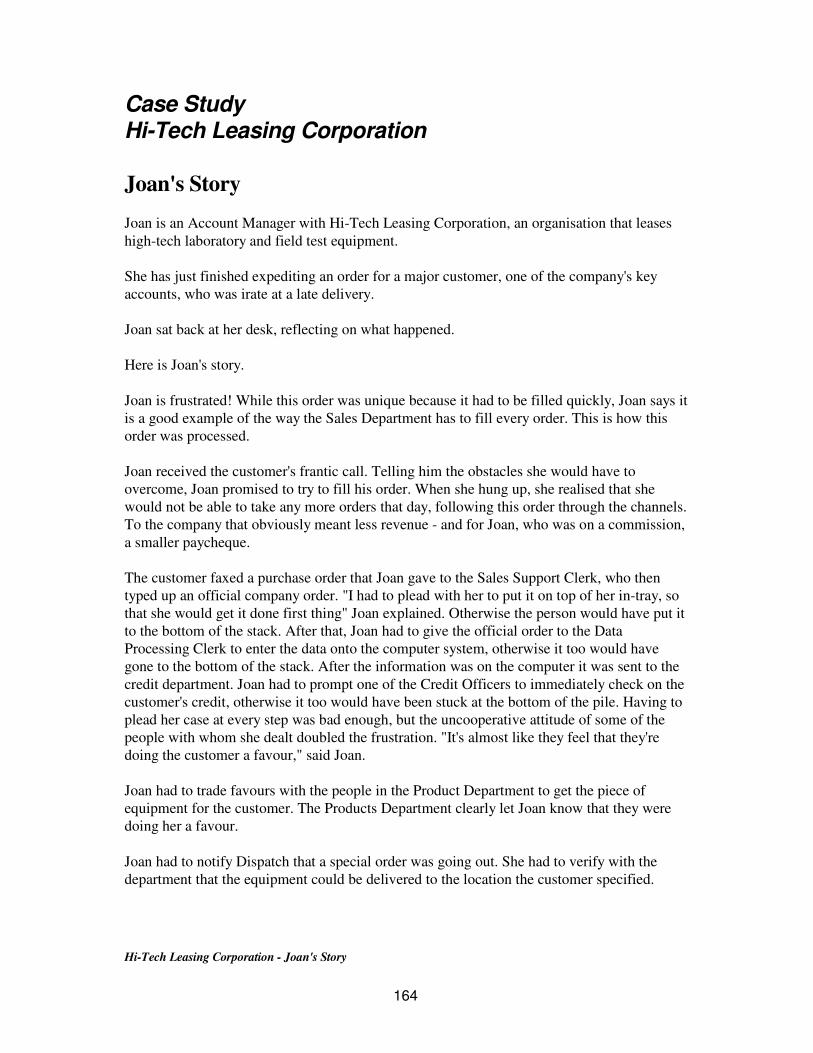
Hi-Tech Leasing Corporation - Joan's Story
Case Study Hi-Tech Leasing Corporation
Joan's Story
Joan is an Account Manager with Hi-Tech Leasing Corporation, an organisation that leases
high-tech laboratory and field test equipment.
She has just finished expediting an order for a major customer, one of the company's key
accounts, who was irate at a late delivery.
Joan sat back at her desk, reflecting on what happened.
Here is Joan's story.
Joan is frustrated! While this order was unique because it had to be filled quickly, Joan says it
is a good example of the way the Sales Department has to fill every order. This is how this
order was processed.
Joan received the customer's frantic call. Telling him the obstacles she would have to
overcome, Joan promised to try to fill his order. When she hung up, she realised that she
would not be able to take any more orders that day, following this order through the channels.
To the company that obviously meant less revenue - and for Joan, who was on a commission,
a smaller paycheque.
The customer faxed a purchase order that Joan gave to the Sales Support Clerk, who then
typed up an official company order. "I had to plead with her to put it on top of her in-tray, so
that she would get it done first thing" Joan explained. Otherwise the person would have put it
to the bottom of the stack. After that, Joan had to give the official order to the Data
Processing Clerk to enter the data onto the computer system, otherwise it too would have
gone to the bottom of the stack. After the information was on the computer it was sent to the
credit department. Joan had to prompt one of the Credit Officers to immediately check on the
customer's credit, otherwise it too would have been stuck at the bottom of the pile. Having to
plead her case at every step was bad enough, but the uncooperative attitude of some of the
people with whom she dealt doubled the frustration. "It's almost like they feel that they're
doing the customer a favour," said Joan.
Joan had to trade favours with the people in the Product Department to get the piece of
equipment for the customer. The Products Department clearly let Joan know that they were
doing her a favour.
Joan had to notify Dispatch that a special order was going out. She had to verify with the
department that the equipment could be delivered to the location the customer specified.
164

Hi-Tech Leasing Corporation - Joan's Story
She then had to schedule a service technician to set up the equipment once it arrived at the
customer's location. Given her past experience with the Service Department, Joan knew that
if she did not take care of the scheduling personally, it would not happen. She feels that
people in the company resent getting special customer requests.
Joan had to keep the customer informed of her progress and alert him immediately if the
company was not able to fill the order. "There are eight people who could screw up my order,
so I had to baby-sit it. I couldn't just pass it over and forget about it," she says. "On top of
that, I had to make sure I wasn't making anybody mad. If I ticked anybody off, I was dead.
None of the eight departments I had to work with would ever fill my orders again."
Finally the equipment was rounded up, checked and ready to go, but Joan hadn't heard from
the Credit Department. When she asked, the person told her the bank wasn't returning phone
calls.
Joan called the customer and the customer called the bank. Later, Joan discovered that the
customer's regular banker was on holidays. The bank had not offered that information to the
Credit Department and the Credit Department had not asked.
By 5:00pm everything was ready to go. Joan faxed the customer his shipping number and
other pertinent information.
"Although this was a rush order, I was able to fill it, but I had to fight all the way. That's the
way it always is around here. Things have to change. They keep telling us they are working
on it, but we don't see any changes. In fact, things appear to be getting worse - and tomorrow I
start work owing eight more favours."
165
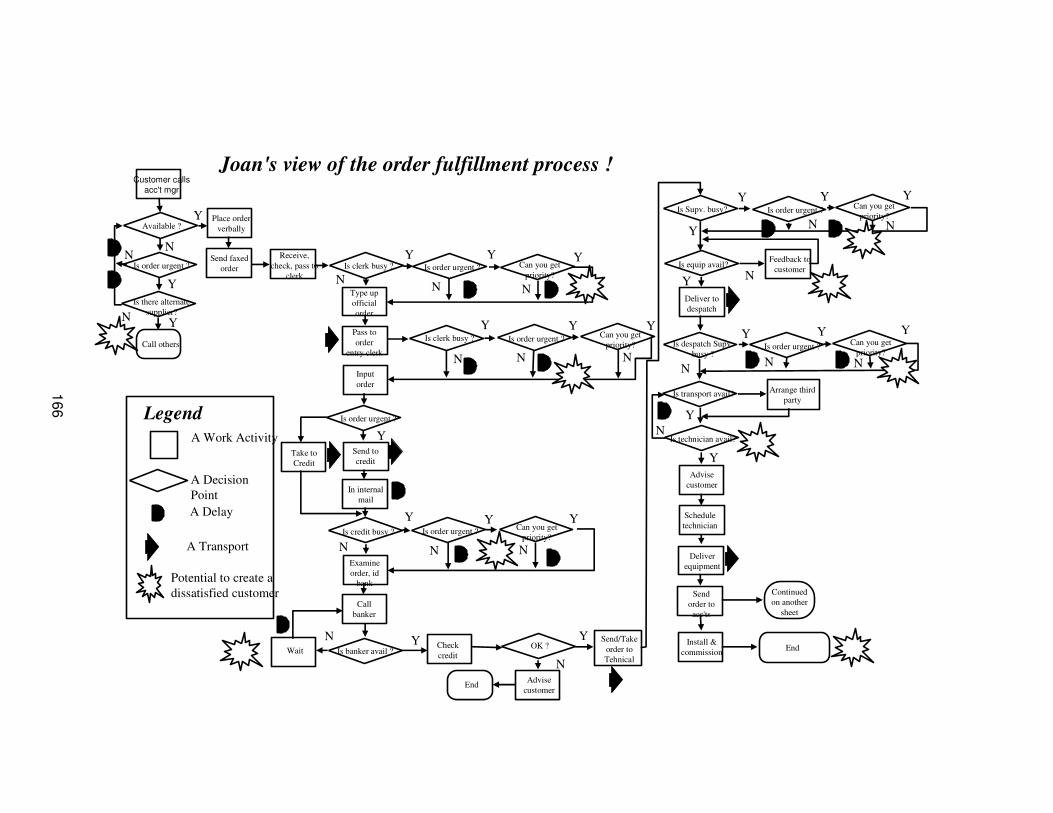
Customer calls acc't mgr
Available ?
Is order urgent ?
Is there alternate
supplier?
Call others
Place order
verbally
Send faxed
order
Receive,
check, pass to
clerk
Type up
official
order
Pass to
order
entry clerk
Input
order
Is clerk busy ? Is order urgent ? Can you get
priority?
Is clerk busy ? Is order urgent ?Can you get
priority?
Is order urgent ?
Send to
credit
In internal
Take to
Credit
Is credit busy ? Is order urgent ?Can you get
priority?
Examine
order, id
bank
Call
banker
Check
creditWait Is banker avail ?
OK ?
Advise
customerEnd
Send/Take
order to
Tehnical
Is Supv. busy? Is order urgent ?
Is equip avail?
Deliver to
despatch
Can you get
priority?
Feedback to
customer
Is despatch Supv.
busy ?Is order urgent ?
Can you get
priority?
Is technician avail?
Advise
customer
Schedule
technician
Deliver
equipment
Send
order to
acc'ts
Install &
commission
Is transport avail?Arrange third
party
End
Continued
on another
sheet
Y Y Y
Y
Y
Y Y
Y
Y
Y
N N N
N NN
N NN
N
N
YY Y
Y Y Y
YY
N
N N
NN
Y
Y
Y
N
N Y
Y
Y
YN
NN
Joan's view of the order fulfillment process !
A Work Activity
A Decision
Point
A Delay
A Transport
Potential to create a
dissatisfied customer
Legend
166
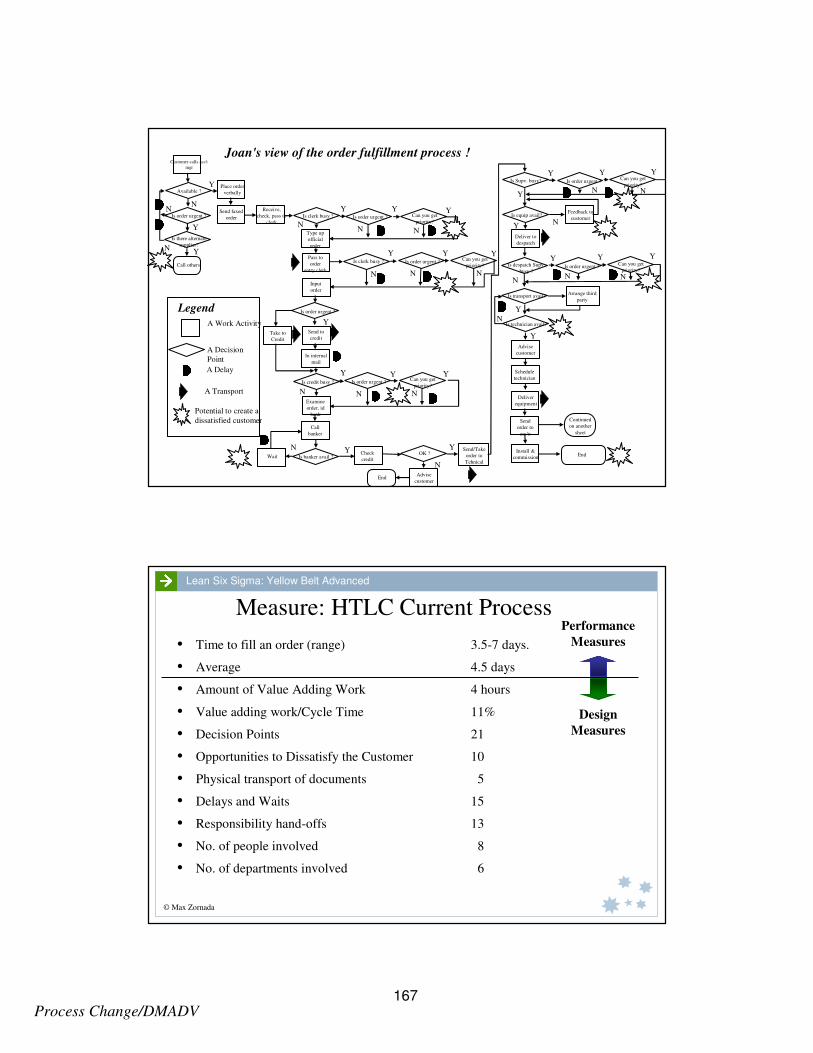
Process Change/DMADV
© Max Zornada
Lean Six Sigma: Yellow Belt Advanced
Customer calls acc't
mgr
Available ?
Is order urgent ?
Is there alternate
supplier?
Call others
Place order
verbally
Send faxed
order
Receive,
check, pass to
clerk
Type up
official
order
Pass to
order
entry clerk
Input
order
Is clerk busy ? Is order urgent ? Can you get
priority?
Is clerk busy ? Is order urgent ?Can you get
priority?
Is order urgent ?
Send to
credit
In internal
Take to
Credit
Is credit busy ? Is order urgent ?Can you get
priority?
Examine
order, id
bank
Call
banker
Check
creditWait Is banker avail ?
OK ?
Advise
customerEnd
Send/Take
order to
Tehnical
Is Supv. busy? Is order urgent ?
Is equip avail?
Deliver to
despatch
Can you get
priority?
Feedback to
customer
Is despatch Supv.
busy ?Is order urgent ?
Can you get
priority?
Is technician avail?
Advise
customer
Schedule
technician
Deliver
equipment
Send
order to
acc'ts
Install &
commission
Is transport avail?Arrange third
party
End
Continued
on another
sheet
Y Y Y
Y
Y
Y Y
Y
Y
Y
N N N
N NN
N NN
N
N
YY Y
Y Y Y
YY
N
N N
NN
Y
Y
Y
N
N Y
Y
Y
YN
NN
Joan's view of the order fulfillment process !
A Work Activity
A Decision
Point
A Delay
A Transport
Potential to create a
dissatisfied customer
Legend
© Max Zornada
Lean Six Sigma: Yellow Belt Advanced
Measure: HTLC Current Process
• Time to fill an order (range)
• Average
• Amount of Value Adding Work
• Value adding work/Cycle Time
• Decision Points
• Opportunities to Dissatisfy the Customer
• Physical transport of documents
• Delays and Waits
• Responsibility hand-offs
• No. of people involved
• No. of departments involved
3.5-7 days.
4.5 days
4 hours
11%
21
10
5
15
13
8
6
Design
Measures
Performance
Measures
167
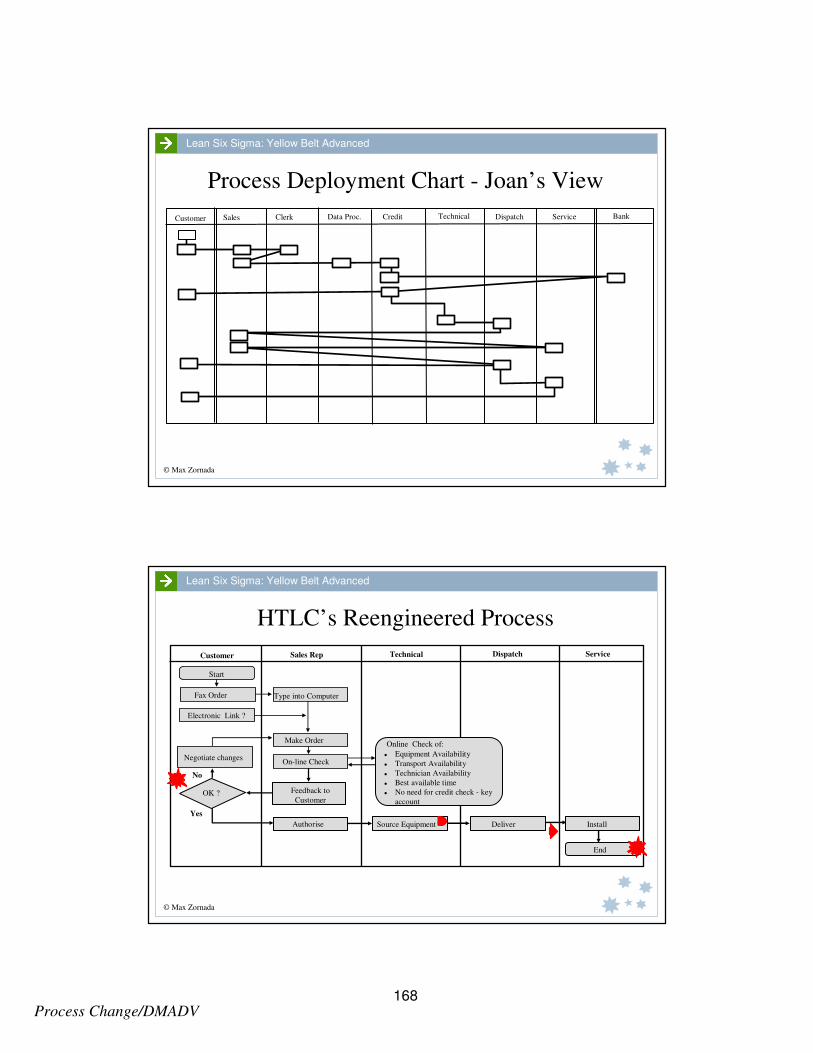
Process Change/DMADV
© Max Zornada
Lean Six Sigma: Yellow Belt Advanced
Process Deployment Chart - Joan’s View
Customer Sales Credit Dispatch ServiceClerk Data Proc. Technical Bank
© Max Zornada
Lean Six Sigma: Yellow Belt Advanced
HTLC’s Reengineered Process
No
Yes
Customer Sales Rep Technical Dispatch Service
Online Check of:
Fax Order
Electronic Link ?
Type into Computer
Make Order
On-line Check
Feedback to
Customer
Source Equipment Deliver Install
End
OK ?
� Equipment Availability
� Transport Availability
� Technician Availability
� Best available time
� No need for credit check - key
account
Start
Negotiate changes
Authorise
168
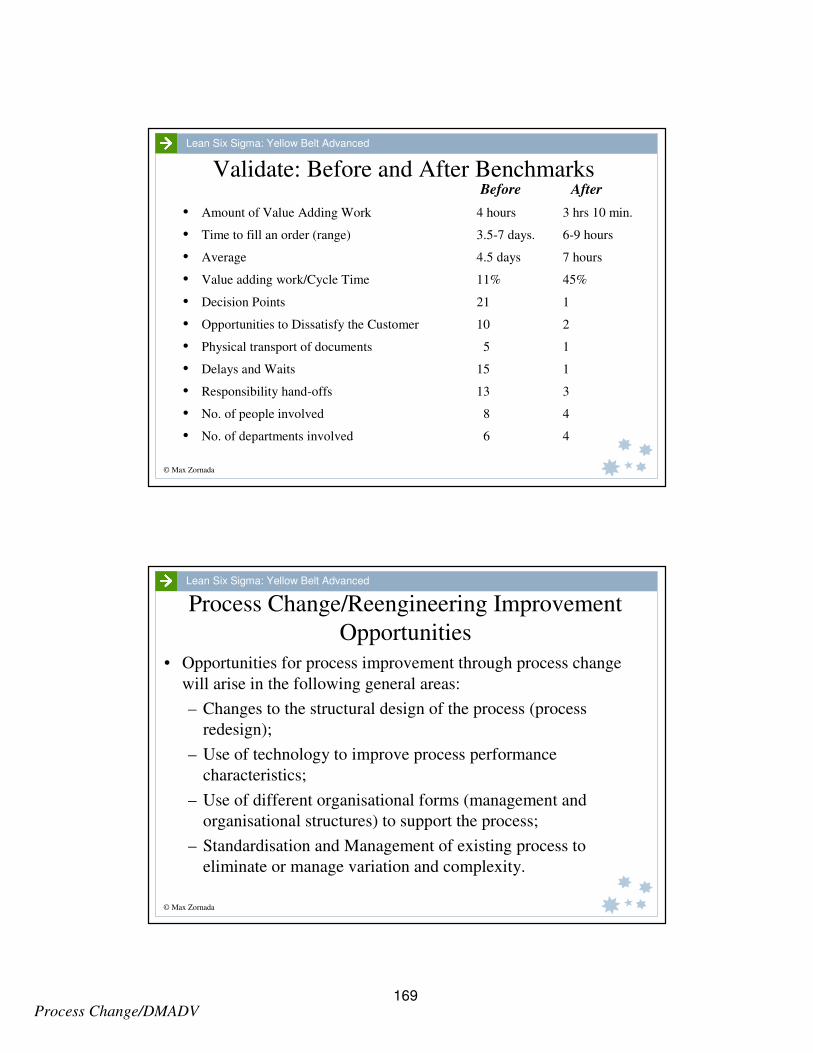
Process Change/DMADV
© Max Zornada
Lean Six Sigma: Yellow Belt Advanced
Validate: Before and After Benchmarks
• Amount of Value Adding Work
• Time to fill an order (range)
• Average
• Value adding work/Cycle Time
• Decision Points
• Opportunities to Dissatisfy the Customer
• Physical transport of documents
• Delays and Waits
• Responsibility hand-offs
• No. of people involved
• No. of departments involved
4 hours
3.5-7 days.
4.5 days
11%
21
10
5
15
13
8
6
3 hrs 10 min.
6-9 hours
7 hours
45%
1
2
1
1
3
4
4
Before After
© Max Zornada
Lean Six Sigma: Yellow Belt Advanced
Process Change/Reengineering Improvement
Opportunities
• Opportunities for process improvement through process change
will arise in the following general areas:
– Changes to the structural design of the process (process
redesign);
– Use of technology to improve process performance
characteristics;
– Use of different organisational forms (management and
organisational structures) to support the process;
– Standardisation and Management of existing process to
eliminate or manage variation and complexity.
169

Process Change/DMADV
© Max Zornada
Lean Six Sigma: Yellow Belt Advanced
What Goes Wrong When Organisations
Reengineer
• Focusing on the technology rather than the process;
• Automation and computerisation of existing process without
addressing fundamental process design issues, i.e. a manual mess
becomes a computerised mess;
• Reengineering is done in the absence of a knowledge of key
process & variation management principles;
• Processes didn't need changing, they just needed to be process
managed;
• No consideration is given to how the process will be managed after
the change - old structure doesn’t fit.
© Max Zornada
Lean Six Sigma: Yellow Belt Advanced
3- Key Reengineering Enablers
Process Design
Technology
Organisation &
Job Design
170

Process Change/DMADV
© Max Zornada
Lean Six Sigma: Yellow Belt Advanced
Process Redesign
Methodology Tool Kit
© Max Zornada
Lean Six Sigma: Yellow Belt Advanced
Process analysis and design tools/techniques
Process Deployment ChartDouble Fishbone
Process Mapping
Complexity Analysis
Value Added/Non-Value Added
AnalysisCustom
er
Value
Added
Operati
onal
Value
Added
Non-
Value
Added
Activity
171

Process Change/DMADV
© Max Zornada
Lean Six Sigma: Yellow Belt Advanced
Value-Added and Non-Value Added Analysis
• Process steps can be categorised as being value added or non-value
added;
• Value-added steps are steps considered essential to the process;
• Value-added process steps pass the following three tests:
– Is the step related to doing it right the first time ?
– Does the step get you one step closer to delivering the product or
service to the customer ?
– Would the customer be willing to pay for the step ?
• In Cost-of-Quality terms – Core and Prevention are considered value
added, Appraisal and Failure are non-value added.
© Max Zornada
Lean Six Sigma: Yellow Belt Advanced
Categorising VA/NVA Activities
Value-Added Activities (Customer Value Added)
• The customer recognises the value. Must want it/be willing to pay for it;
• Transforms the product or service in some way towards customer expectations;
• Is done “right first time”.
Non Value-Added but Needed Activities (Operational Value Added)
• Activities that create no value but which cannot be eliminated based on current state of technology or thinking;
• Activities required for regulatory and legal compliance, or which the customer mandates;
• Necessary activities due to non-robustness of process, risk management
Non Value-Added Activities
• Activities that consume resources but create no value in the eyes of the customer;
• Pure waste.
Complete Red-Yellow-Green Dot AnalysisGreen
Yellow
Red
172
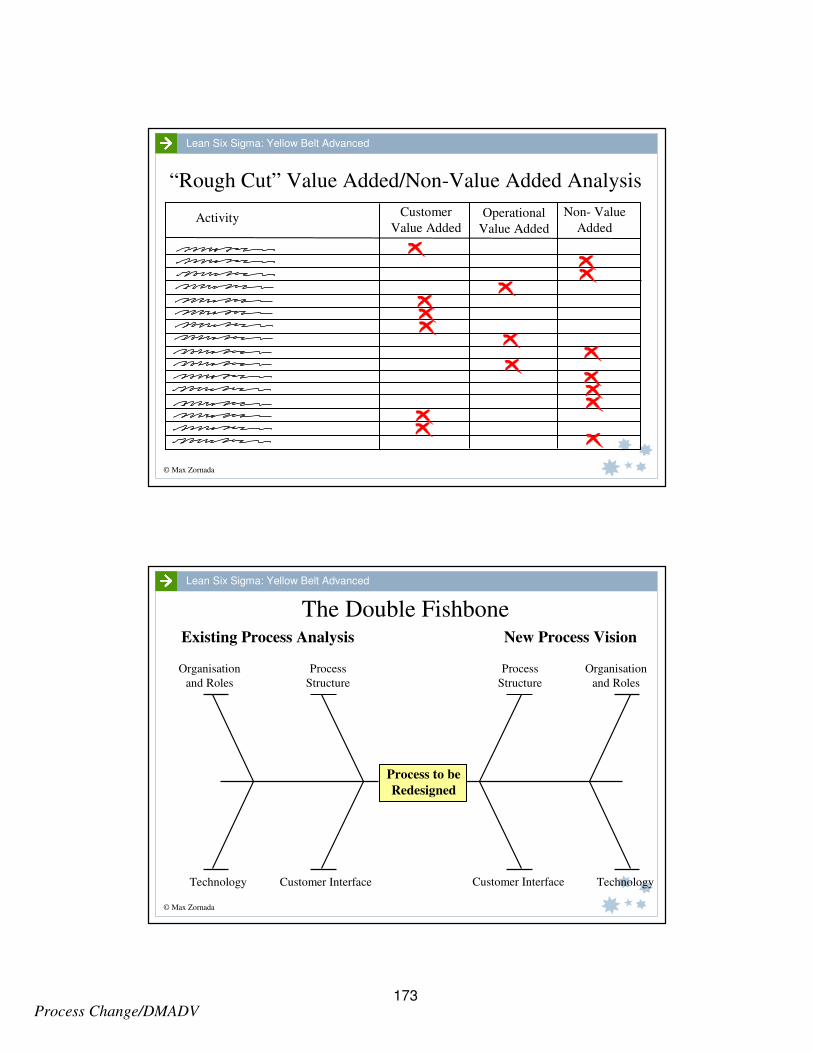
Process Change/DMADV
© Max Zornada
Lean Six Sigma: Yellow Belt Advanced
“Rough Cut” Value Added/Non-Value Added Analysis
Customer
Value Added
Operational
Value Added
Non- Value
AddedActivity
© Max Zornada
Lean Six Sigma: Yellow Belt Advanced
The Double Fishbone
Organisation
and Roles
Process
Structure
Technology Customer Interface
Process
Structure
Organisation
and Roles
TechnologyCustomer Interface
New Process Vision
Process to be
Redesigned
Existing Process Analysis
173
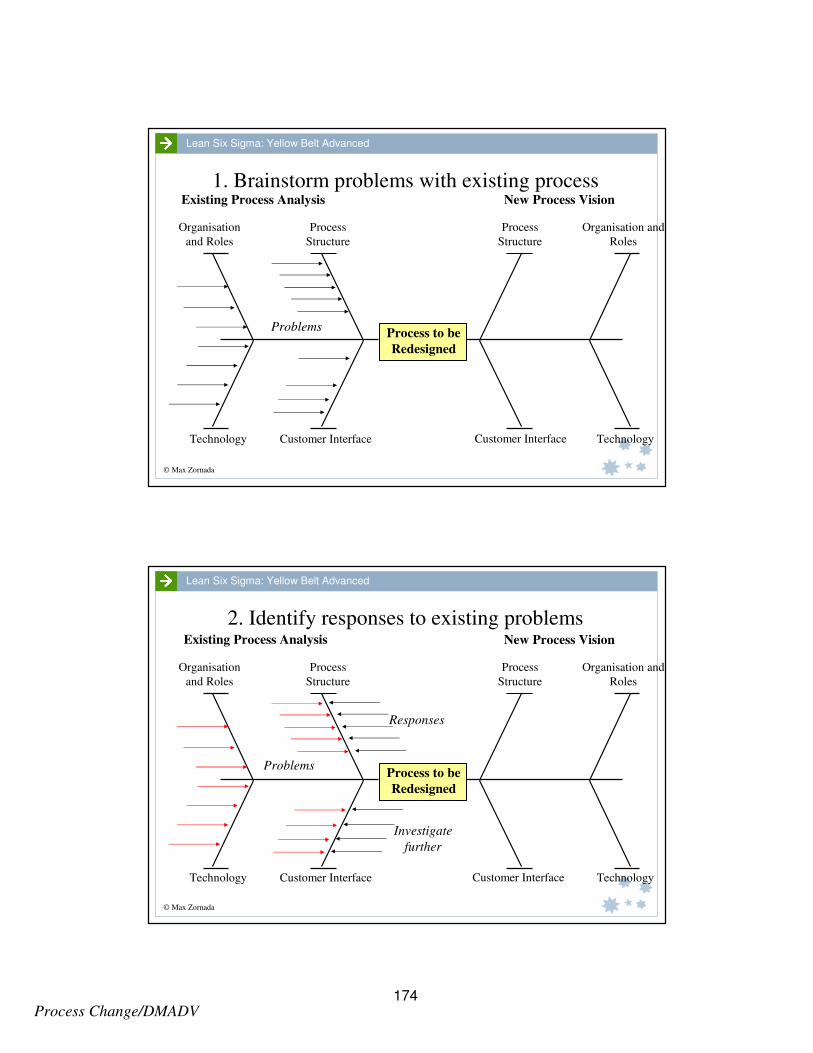
Process Change/DMADV
© Max Zornada
Lean Six Sigma: Yellow Belt Advanced
1. Brainstorm problems with existing process
Organisation
and Roles
Process
Structure
Process
Structure
Organisation and
Roles
New Process Vision
Process to be
Redesigned
Existing Process Analysis
Problems
Technology Customer Interface TechnologyCustomer Interface
© Max Zornada
Lean Six Sigma: Yellow Belt Advanced
2. Identify responses to existing problems
Organisation
and Roles
Process
Structure
Process
Structure
Organisation and
Roles
New Process Vision
Process to be
Redesigned
Existing Process Analysis
Problems
Responses
Investigate
further
Technology Customer Interface TechnologyCustomer Interface
174
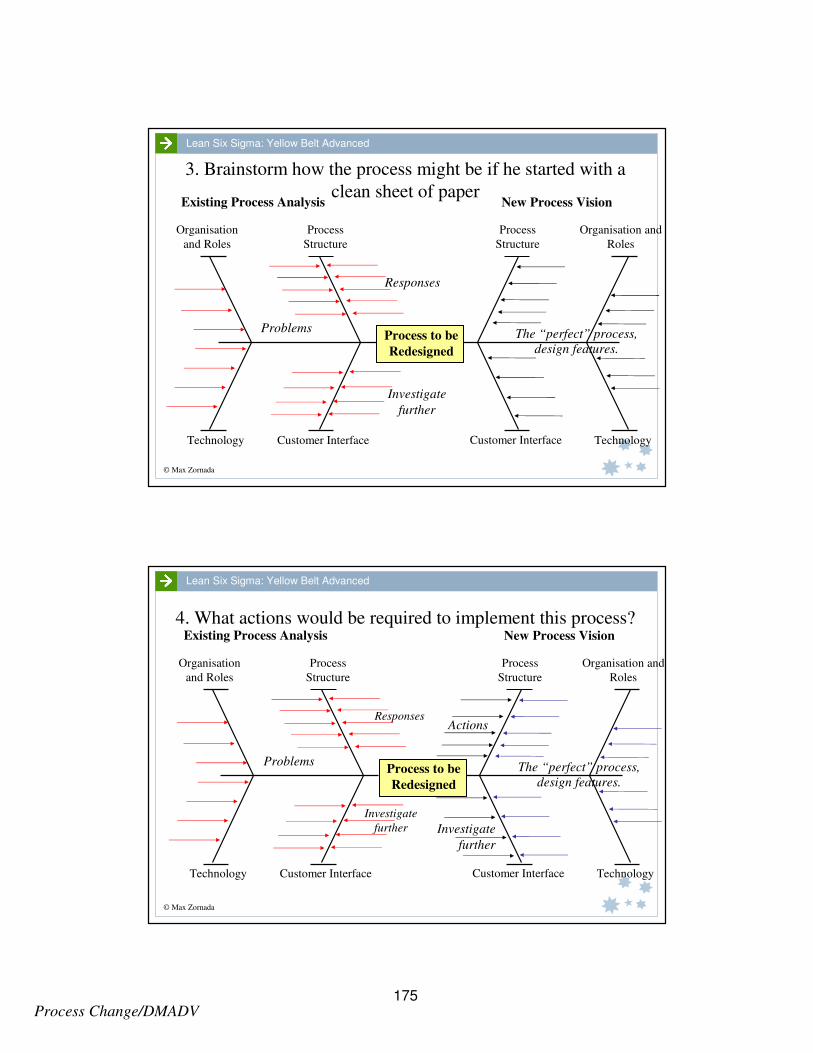
Process Change/DMADV
© Max Zornada
Lean Six Sigma: Yellow Belt Advanced
3. Brainstorm how the process might be if he started with a
clean sheet of paper
Organisation
and Roles
Process
Structure
Process
Structure
Organisation and
Roles
New Process Vision
Process to be
Redesigned
Existing Process Analysis
Problems
Responses
Investigate
further
Technology Customer Interface TechnologyCustomer Interface
The “perfect” process,
design features.
© Max Zornada
Lean Six Sigma: Yellow Belt Advanced
4. What actions would be required to implement this process?
Organisation
and Roles
Process
Structure
Process
Structure
Organisation and
Roles
New Process Vision
Process to be
Redesigned
Existing Process Analysis
Problems
Responses
Investigate
further
Technology Customer Interface TechnologyCustomer Interface
The “perfect” process,
design features.
Actions
Investigate
further
175
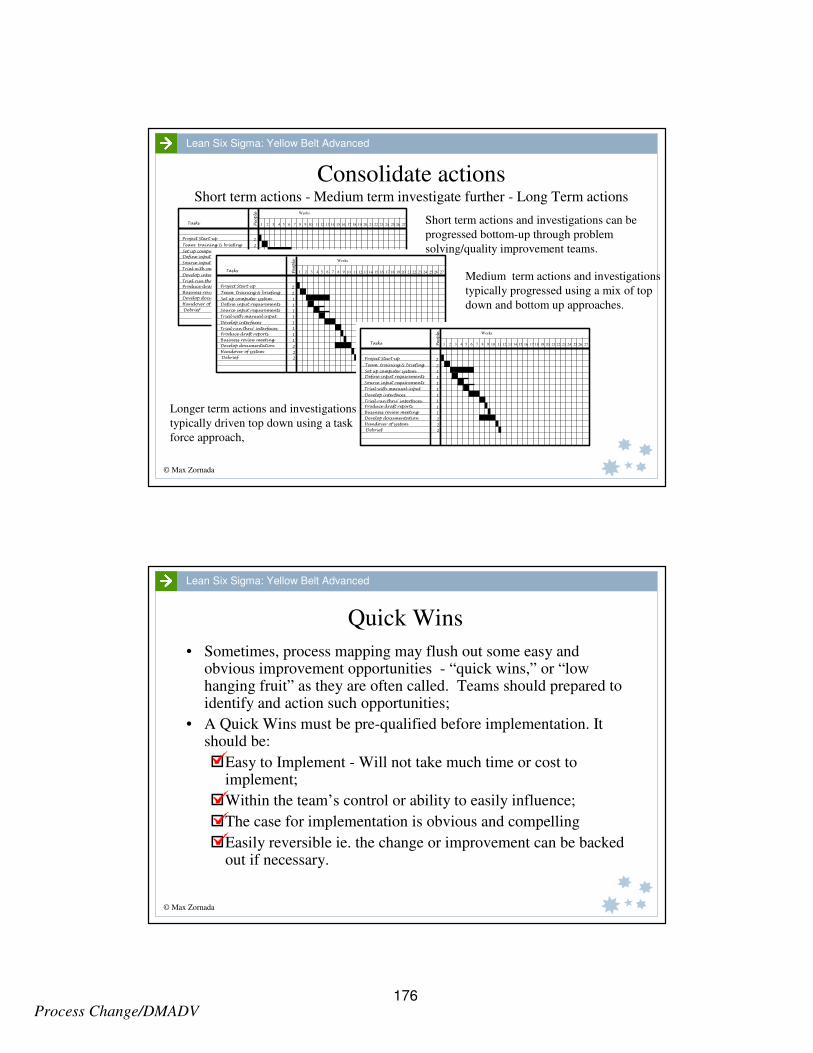
Process Change/DMADV
© Max Zornada
Lean Six Sigma: Yellow Belt Advanced
Consolidate actionsShort term actions - Medium term investigate further - Long Term actions
Weeks
1 2 3 4 5 6 7 8 9 10 11 12 13 14 15 16 17 18 19 20 21 22 23 24 25 26 27
Project Start-up
Team training & briefing
Define input requirements
Trial with manual input
Develop interfaces
Trial run thru’ interfacesProduce draft reports
Business review meeting
Handover of system
Debrief
2
2
1
11
1
11
1
1
2
22
Tasks Peo
ple
Set up computer system
Source input requirements
Develop documentation
Weeks
1 2 3 4 5 6 7 8 9 10 11 12 13 14 15 16 17 18 19 20 21 22 23 24 25 26 27
Project Start-up
Team training & briefing
Define input requirements
Trial with manual input
Develop interfaces
Trial run thru’ interfacesProduce draft reports
Business review meeting
Handover of system
Debrief
2
2
1
11
1
11
11
2
22
Tasks Peo
ple
Set up computer system
Source input requirements
Develop documentation
Weeks
1 2 3 4 5 6 7 8 9 10 11 12 13 14 15 16 17 18 19 20 21 22 23 24 25 26 27
Project Start-up
Team training & briefing
Define input requirements
Trial with manual input
Develop interfaces
Trial run thru’ interfacesProduce draft reports
Business review meeting
Handover of system
Debrief
2
21
1
1
1
1
1
11
2
22
Tasks Peo
ple
Set up computer system
Source input requirements
Develop documentation
Short term actions and investigations can be
progressed bottom-up through problem
solving/quality improvement teams.
Longer term actions and investigations
typically driven top down using a task
force approach,
Medium term actions and investigations
typically progressed using a mix of top
down and bottom up approaches.
© Max Zornada
Lean Six Sigma: Yellow Belt Advanced
Quick Wins
• Sometimes, process mapping may flush out some easy and obvious improvement opportunities - “quick wins,” or “low hanging fruit” as they are often called. Teams should prepared to identify and action such opportunities;
• A Quick Wins must be pre-qualified before implementation. It should be:
�Easy to Implement - Will not take much time or cost to implement;
�Within the team’s control or ability to easily influence;
�The case for implementation is obvious and compelling
�Easily reversible ie. the change or improvement can be backed out if necessary.
176

Process Change/DMADV
© Max Zornada
Lean Six Sigma: Yellow Belt Advanced
Generating Improvement Opportunities
21
Present
Reason
Alternatives
Selection
Improvement
Concerning Purpose Place Sequence Person Means
What is done ?
done ?
Can it be
Should it be
Eliminate Combine or Change Simplify
done ? done in the it ? done ?
done there ?
could it be
Where should
done then ? done by that done that
could it be could it be could it be
When should it Who should it How should it
Method
Means of
Questions Aspects Examined
Why is it
eliminated ?
eliminated ?
Where is it When is it
sequence ?
Who does How is it
Why is it
Where else
done ?
it be done ?
Why is it Why is it
person ?
Why is it
way ?
When else
done ?
Who else
done by ?
How else
done ?
be done ? be done by ? be done ?
© Max Zornada
Lean Six Sigma: Yellow Belt Advanced
The 5W2H Questions Who What Where
Why
� Who does it ?
� Who is doing it ?
� Who should be doing it ?
� Who else can do it ?
� Who else should do it ?
� What to do ?
� What is being done ?
� What should be done ?
� What should be done ?
� What else should be done ?
� What else should be done ?
� Where to do it ?
� Where is it done ?
� Where should it be done ?
� Where else can it be done ?
� Where else should it be done ?
� Why does he/she do it ?
� Why do it ?
� Why do it there ?
� Why do it then ?
� Why do it that way ?
How much?
� How much does it cost
now ?
� What will the cost be
after the improvement ?
When
� When to do it ?
� When is it done ?
� When should it be
done ?
� What other time can it
be done ?
� What other time
should it be done ?
How
� How to do it ?
� How is it done ?
� How should it be done ?
� Can this method be
used in other areas ?
� Is there any other way
to do it ?
177

Process Change/DMADV
© Max Zornada
Lean Six Sigma: Yellow Belt Advanced
178
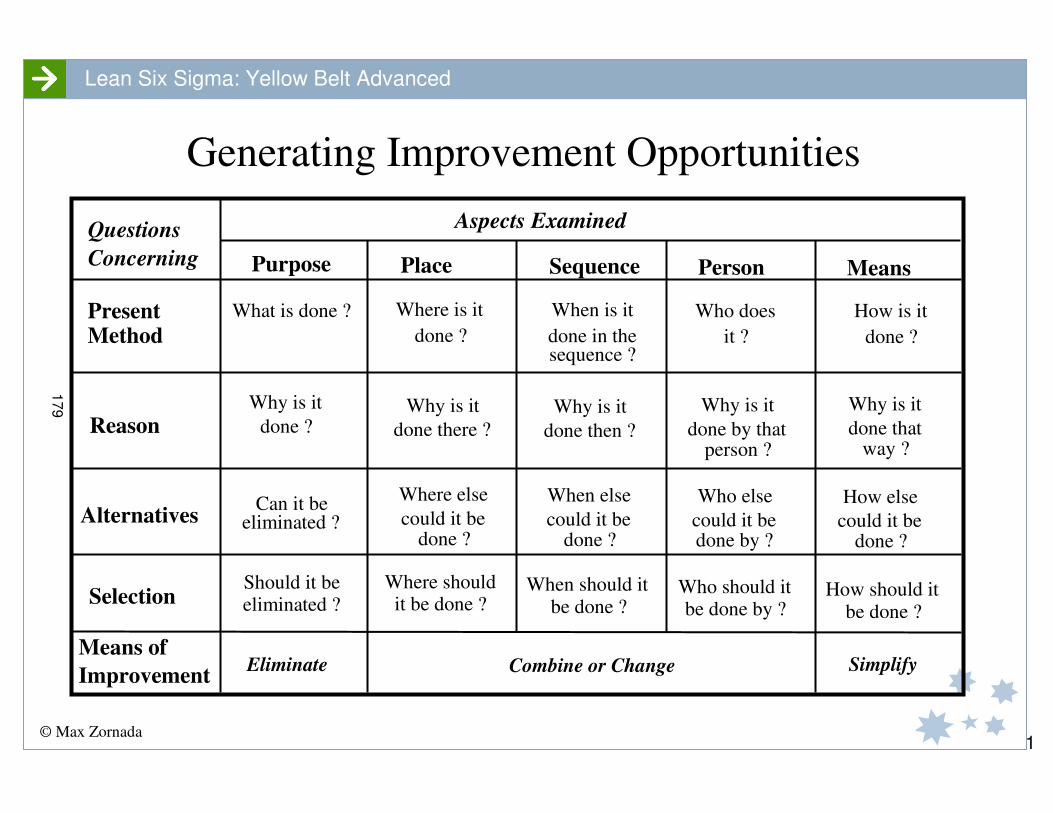
© Max Zornada
Lean Six Sigma: Yellow Belt Advanced
Generating Improvement Opportunities
1
Present
Reason
Alternatives
Selection
Improvement
Concerning Purpose Place Sequence Person Means
What is done ?
done ?
Can it be
Should it be
Eliminate Combine or Change Simplify
done ? done in the it ? done ?
done there ?
could it be
Where should
done then ? done by that done that
could it be could it be could it be
When should it Who should it How should it
Method
Means of
Questions Aspects Examined
Why is it
eliminated ?
eliminated ?
Where is it When is it
sequence ?
Who does How is it
Why is it
Where else
done ?
it be done ?
Why is it Why is it
person ?
Why is it
way ?
When else
done ?
Who else
done by ?
How else
done ?
be done ? be done by ? be done ?
179

© Max Zornada
Lean Six Sigma: Yellow Belt Advanced
The 5W2H Questions Who What Where
Why
� Who does it ?
� Who is doing it ?
� Who should be doing it ?
� Who else can do it ?
� Who else should do it ?
� What to do ?
� What is being done ?
� What should be done ?
� What should be done ?
� What else should be done ?
� What else should be done ?
� Where to do it ?
� Where is it done ?
� Where should it be done ?
� Where else can it be done ?
� Where else should it be done ?
� Why does he/she do it ?
� Why do it ?
� Why do it there ?
� Why do it then ?
� Why do it that way ?
How much?
� How much does it cost
now ?
� What will the cost be
after the improvement ?
When
� When to do it ?
� When is it done ?
� When should it be
done ?
� What other time can it
be done ?
� What other time
should it be done ?
How
� How to do it ?
� How is it done ?
� How should it be done ?
� Can this method be
used in other areas ?
� Is there any other way
to do it ?
180
Process Flow Management
Heijunka
181

182
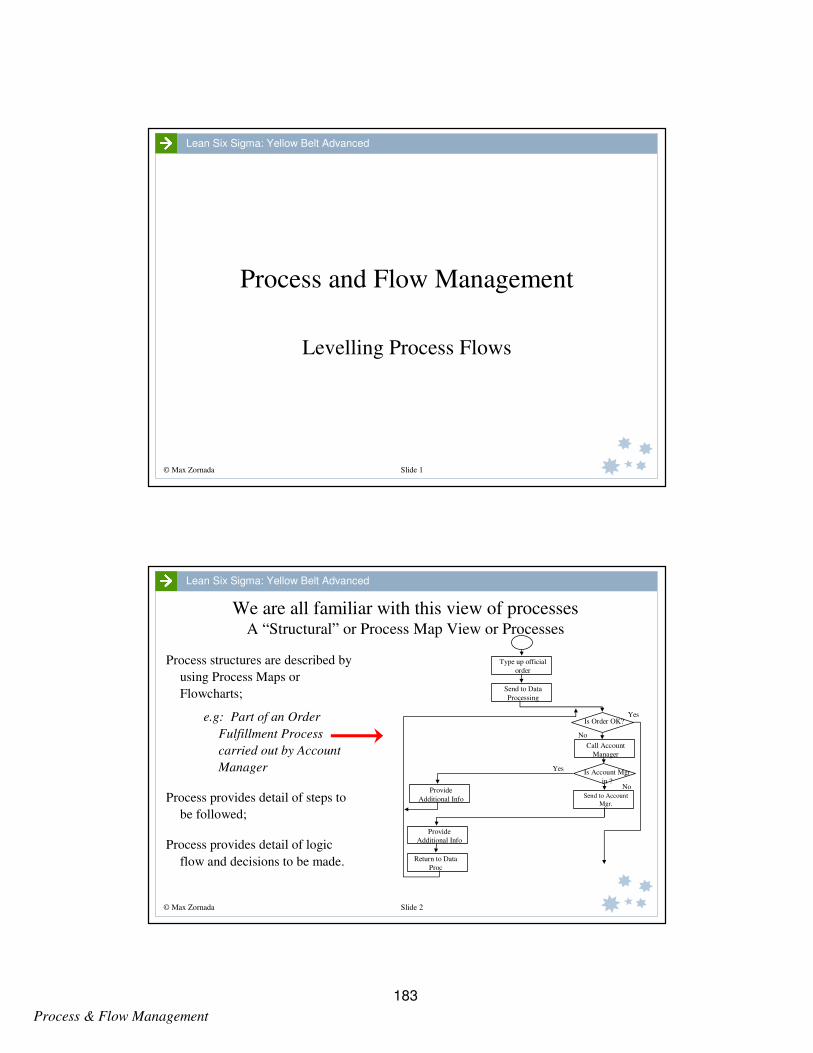
Process & Flow Management
© Max Zornada Slide 1
Lean Six Sigma: Yellow Belt Advanced
Process and Flow Management
Levelling Process Flows
© Max Zornada Slide 2
Lean Six Sigma: Yellow Belt Advanced
We are all familiar with this view of processesA “Structural” or Process Map View or Processes
Process structures are described by
using Process Maps or
Flowcharts;
e.g: Part of an Order
Fulfillment Process
carried out by Account
Manager
Process provides detail of steps to
be followed;
Process provides detail of logic
flow and decisions to be made.
Send to Account
Mgr.
Is Account Mgr
in ?
Type up official
order
Send to Data
Processing
Is Order OK?
Call Account
Manager
Provide
Additional Info
Provide
Additional Info
Return to Data
Proc
Yes
No
No
Yes
183

Process & Flow Management
© Max Zornada Slide 3
Lean Six Sigma: Yellow Belt Advanced
An example of a Work ProcessMake one hamburger
Standard time to
make a burger
= 40 sec.
Pick up and cut roll
Place condiments on roll
Check that meat is
cooked. If not, wait.
Place meat in roll and close
Wrap and place in tray
© Max Zornada Slide 4
Lean Six Sigma: Yellow Belt Advanced
What about …...Customers in
Customers served
Work Load
Queues
Waiting time
184
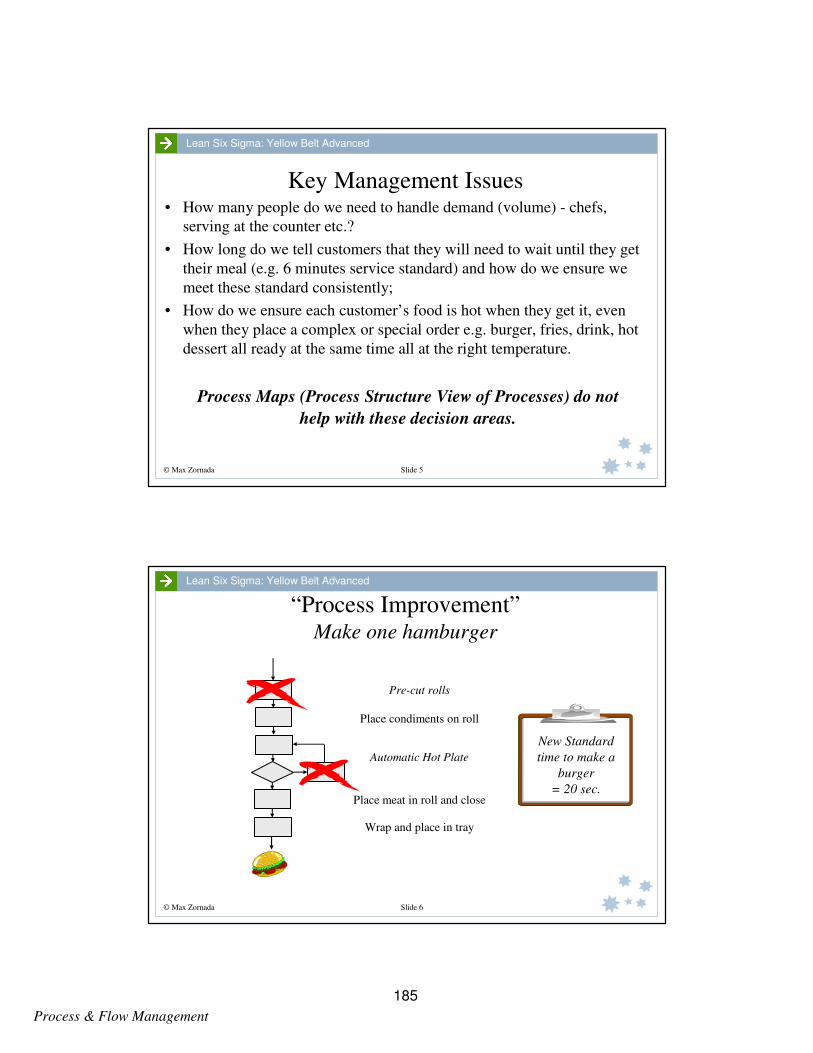
Process & Flow Management
© Max Zornada Slide 5
Lean Six Sigma: Yellow Belt Advanced
Key Management Issues• How many people do we need to handle demand (volume) - chefs,
serving at the counter etc.?
• How long do we tell customers that they will need to wait until they get
their meal (e.g. 6 minutes service standard) and how do we ensure we
meet these standard consistently;
• How do we ensure each customer’s food is hot when they get it, even
when they place a complex or special order e.g. burger, fries, drink, hot
dessert all ready at the same time all at the right temperature.
Process Maps (Process Structure View of Processes) do not
help with these decision areas.
© Max Zornada Slide 6
Lean Six Sigma: Yellow Belt Advanced
New Standard
time to make a
burger
= 20 sec.
Pre-cut rolls
Place condiments on roll
Automatic Hot Plate
Place meat in roll and close
Wrap and place in tray
“Process Improvement”Make one hamburger
185
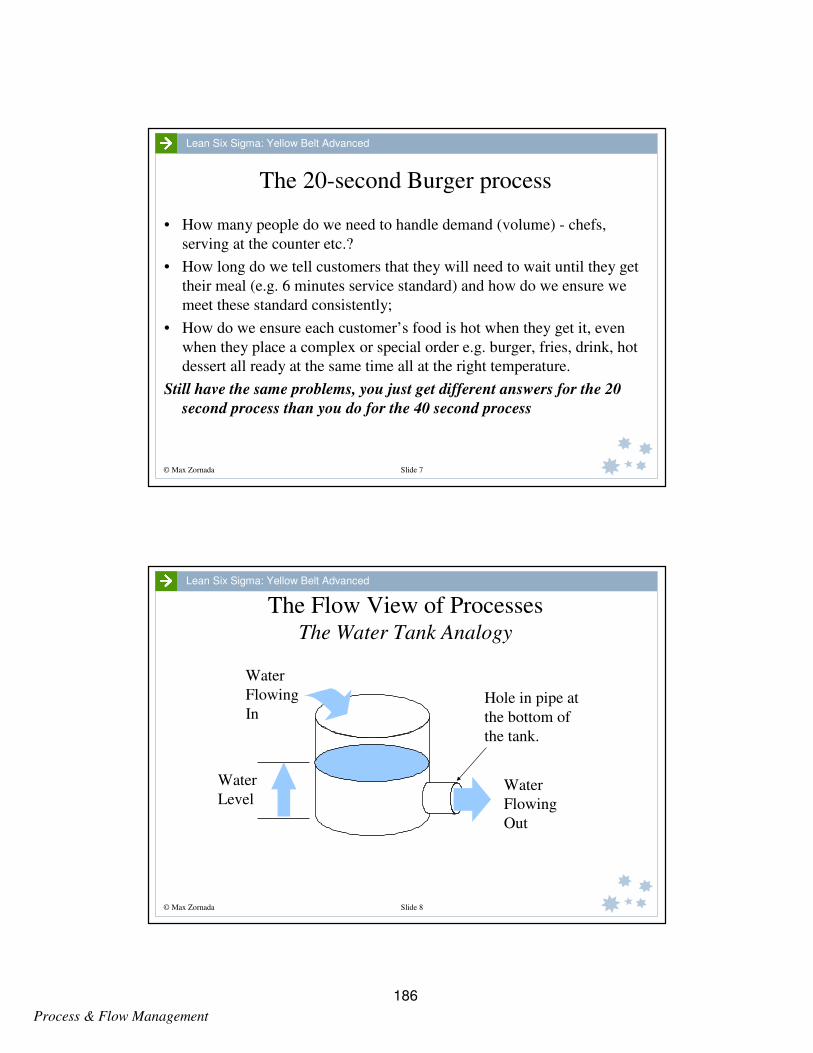
Process & Flow Management
© Max Zornada Slide 7
Lean Six Sigma: Yellow Belt Advanced
The 20-second Burger process
• How many people do we need to handle demand (volume) - chefs,
serving at the counter etc.?
• How long do we tell customers that they will need to wait until they get
their meal (e.g. 6 minutes service standard) and how do we ensure we
meet these standard consistently;
• How do we ensure each customer’s food is hot when they get it, even
when they place a complex or special order e.g. burger, fries, drink, hot
dessert all ready at the same time all at the right temperature.
Still have the same problems, you just get different answers for the 20
second process than you do for the 40 second process
© Max Zornada Slide 8
Lean Six Sigma: Yellow Belt Advanced
Water
Flowing
Out
Water
Flowing
In
Water
Level
The Flow View of ProcessesThe Water Tank Analogy
Hole in pipe at
the bottom of
the tank.
186

Process & Flow Management
© Max Zornada Slide 9
Lean Six Sigma: Yellow Belt Advanced
Workflow Process Management Model
Work
Flowing
Out
Work
Flowing
In
Work In
Progress
(WIP)
Resources
Capacity
Productivity
© Max Zornada Slide 10
Lean Six Sigma: Yellow Belt Advanced
Ave.
Work Out
100/day
Ave.
Work In
100/day
Work In
Progress
(WIP)
Claims Processing Example
What Service Level can be promised ... ?
500
187
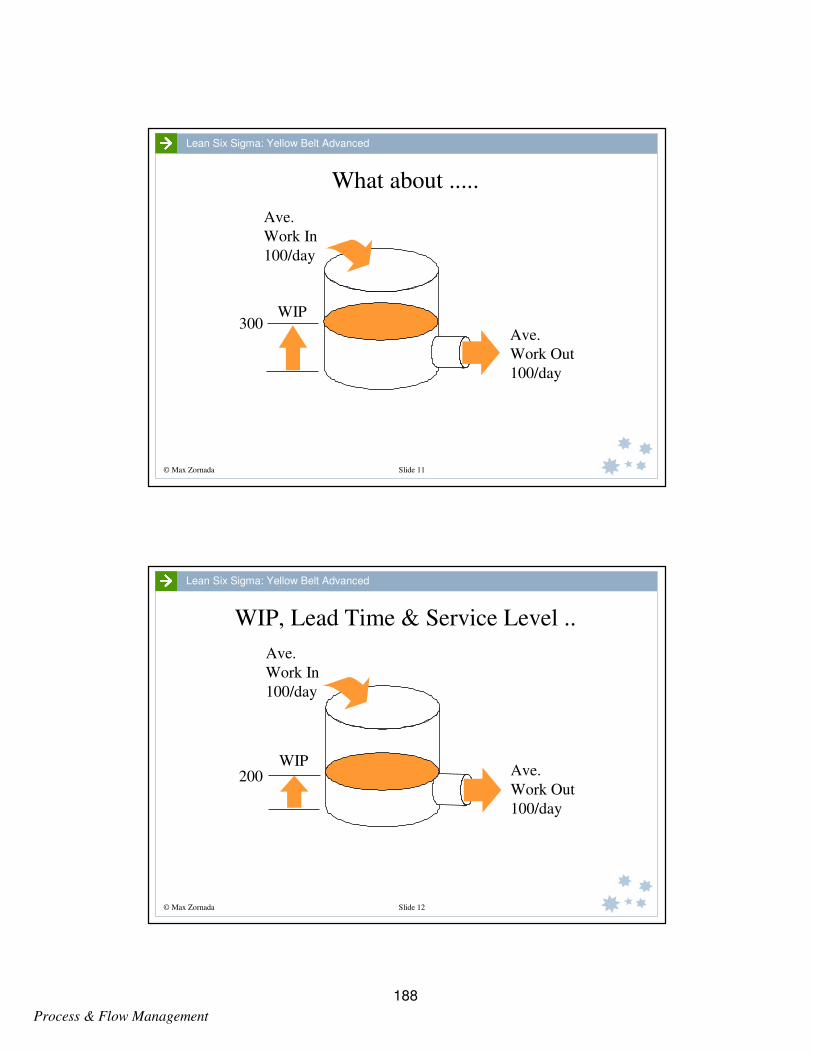
Process & Flow Management
© Max Zornada Slide 11
Lean Six Sigma: Yellow Belt Advanced
Ave.
Work Out
100/day
Ave.
Work In
100/day
WIP
What about .....
300
© Max Zornada Slide 12
Lean Six Sigma: Yellow Belt Advanced
Ave.
Work Out
100/day
Ave.
Work In
100/day
WIP
WIP, Lead Time & Service Level ..
200
188
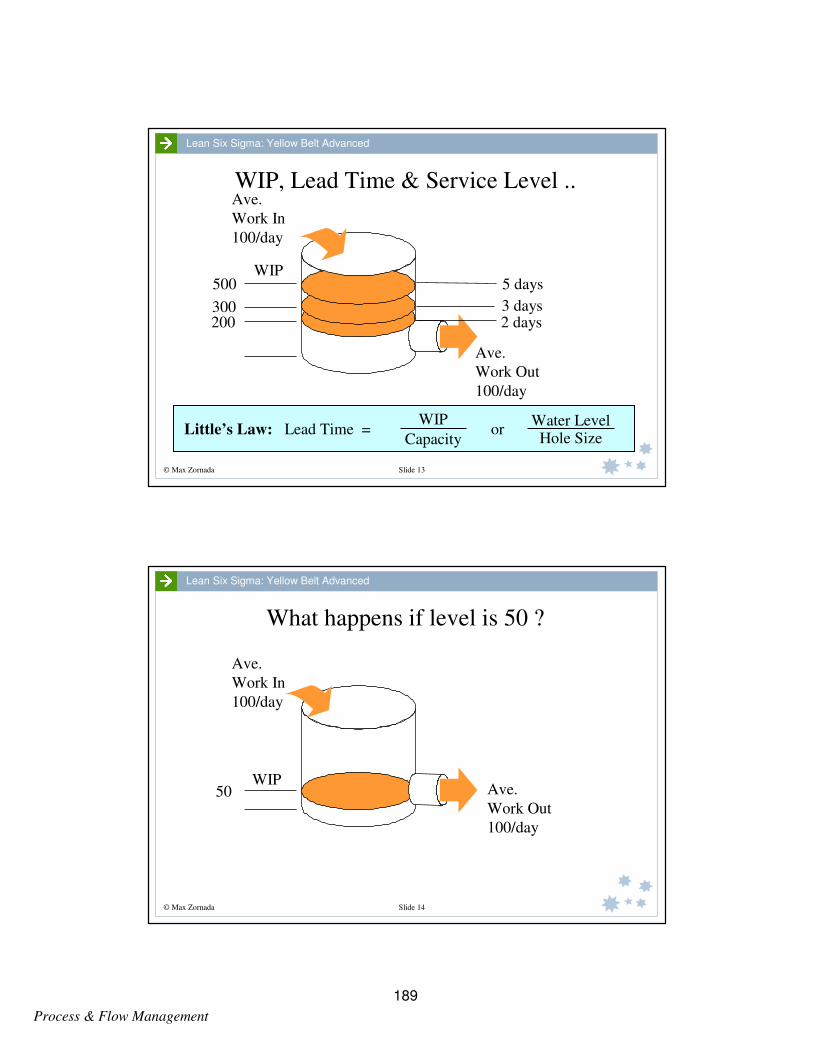
Process & Flow Management
© Max Zornada Slide 13
Lean Six Sigma: Yellow Belt Advanced
Ave.
Work Out
100/day
Ave.
Work In
100/day
WIP
WIP, Lead Time & Service Level ..
500
300200
5 days
3 days2 days
Little’s Law: Lead Time =Water Level
Hole Sizeor
Capacity
WIP
© Max Zornada Slide 14
Lean Six Sigma: Yellow Belt Advanced
Ave.
Work Out
100/day
Ave.
Work In
100/day
WIP
What happens if level is 50 ?
50
189
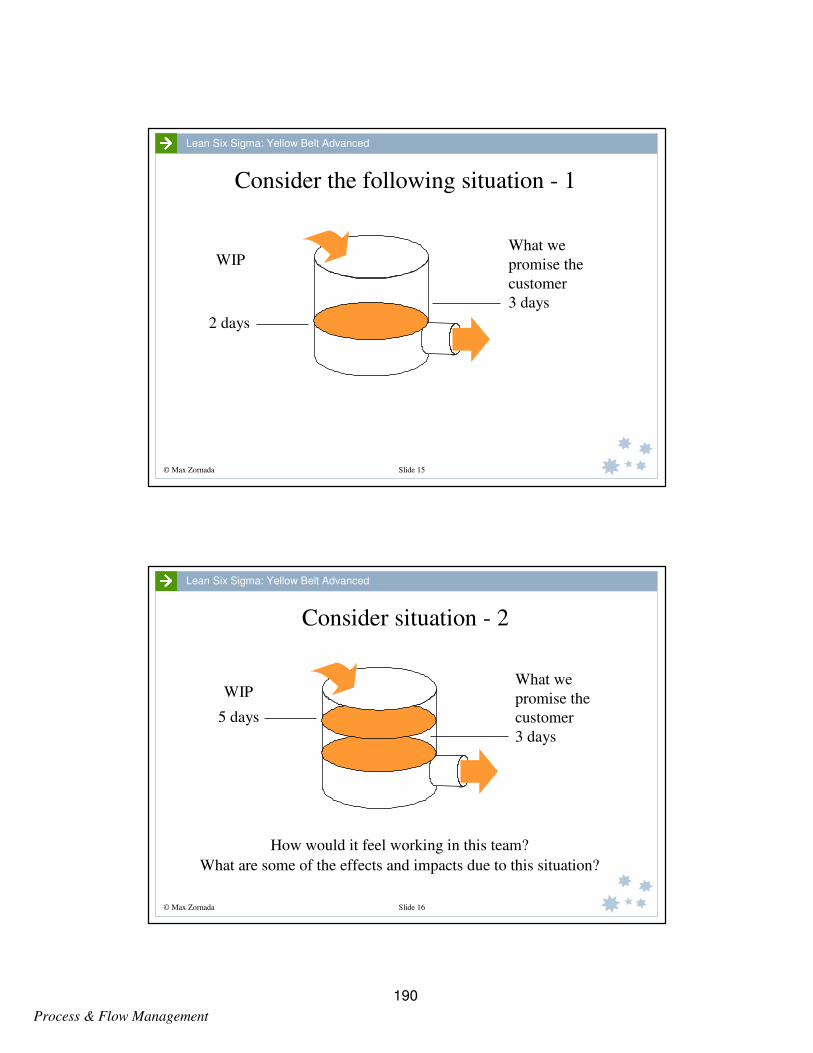
Process & Flow Management
© Max Zornada Slide 15
Lean Six Sigma: Yellow Belt Advanced
WIP
Consider the following situation - 1
What we
promise the
customer
3 days
2 days
© Max Zornada Slide 16
Lean Six Sigma: Yellow Belt Advanced
WIP
Consider situation - 2
5 days
What we
promise the
customer
3 days
How would it feel working in this team?
What are some of the effects and impacts due to this situation?
190

Process & Flow Management
© Max Zornada Slide 17
Lean Six Sigma: Yellow Belt Advanced
Key Work Management System Relationships
Work In Progress
Capacity
Resources
Lead Time
Service level
Utilisation
Productivity
© Max Zornada Slide 18
Lean Six Sigma: Yellow Belt Advanced
Smith's Auto-Service Centre
Managing Work Flows Case Study
191

Process & Flow Management
© Max Zornada Slide 19
Lean Six Sigma: Yellow Belt Advanced
192

Managing Work Flows
Case Study
Smith's Auto-Service Centre
193
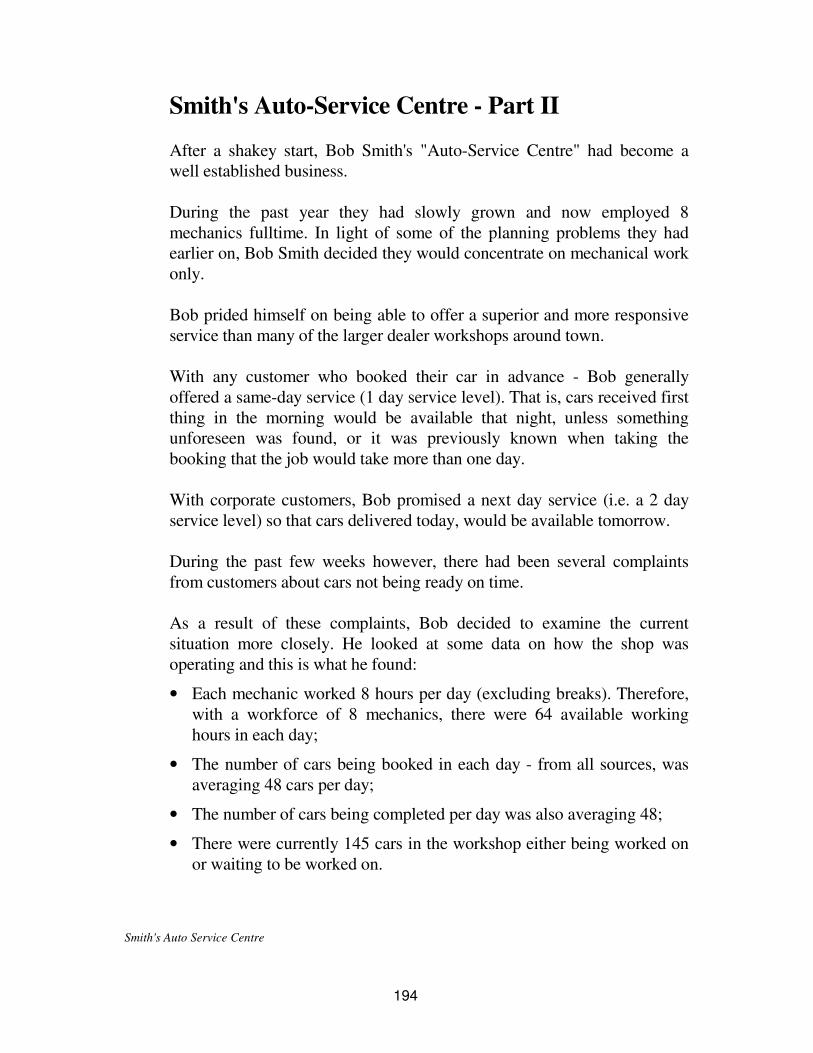
Smith's Auto Service Centre
Smith's Auto-Service Centre - Part II
After a shakey start, Bob Smith's "Auto-Service Centre" had become a
well established business.
During the past year they had slowly grown and now employed 8
mechanics fulltime. In light of some of the planning problems they had
earlier on, Bob Smith decided they would concentrate on mechanical work
only.
Bob prided himself on being able to offer a superior and more responsive
service than many of the larger dealer workshops around town.
With any customer who booked their car in advance - Bob generally
offered a same-day service (1 day service level). That is, cars received first
thing in the morning would be available that night, unless something
unforeseen was found, or it was previously known when taking the
booking that the job would take more than one day.
With corporate customers, Bob promised a next day service (i.e. a 2 day
service level) so that cars delivered today, would be available tomorrow.
During the past few weeks however, there had been several complaints
from customers about cars not being ready on time.
As a result of these complaints, Bob decided to examine the current
situation more closely. He looked at some data on how the shop was
operating and this is what he found:
• Each mechanic worked 8 hours per day (excluding breaks). Therefore,
with a workforce of 8 mechanics, there were 64 available working
hours in each day;
• The number of cars being booked in each day - from all sources, was
averaging 48 cars per day;
• The number of cars being completed per day was also averaging 48;
• There were currently 145 cars in the workshop either being worked on
or waiting to be worked on.
194
Smith's Auto Service Centre
Questions
What is your assessment of the current situation. Discuss:
1. Do you think Bob can meet his service levels i.e. how realistic are they?
2. What should Bob do to improve the situation?
Notes
195

Smith's Auto Service Centre
Smith's Auto-Service Centre
Worksheet
WIP
Work out
Work in
Mechanic
Hours
Mechanic
Hours/Car
Service level
196
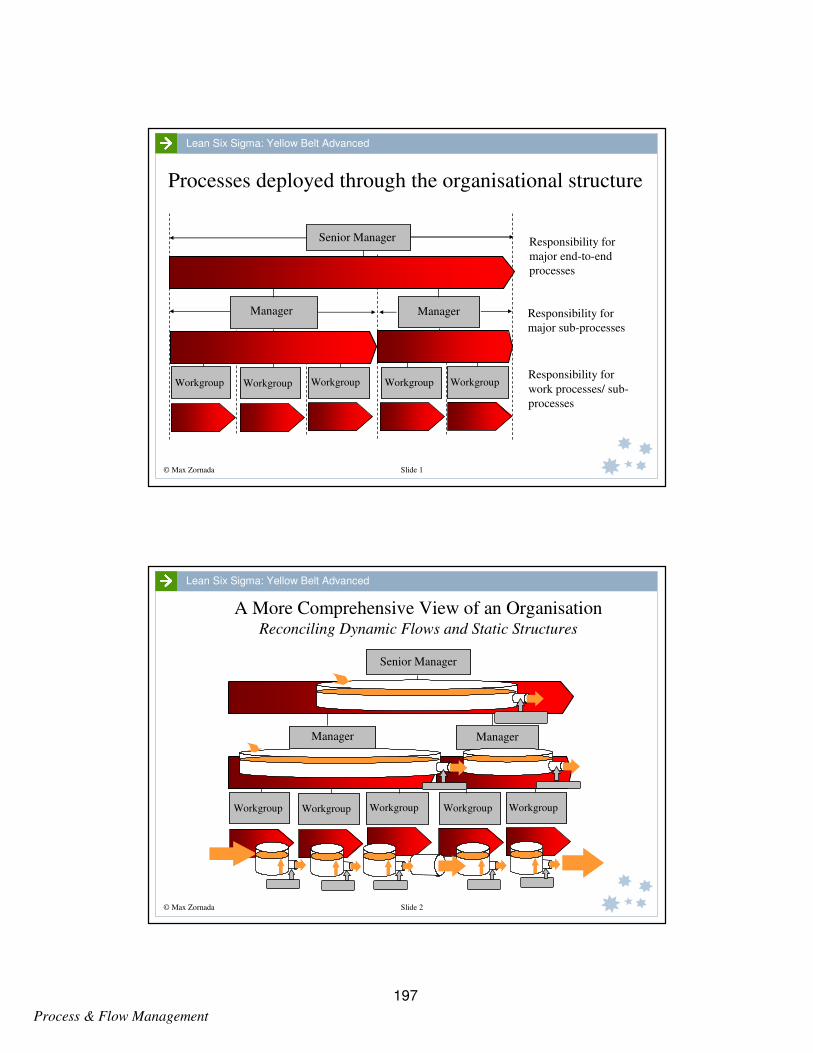
Process & Flow Management
© Max Zornada Slide 1
Lean Six Sigma: Yellow Belt Advanced
Processes deployed through the organisational structure
WorkgroupWorkgroup Workgroup Workgroup Workgroup
Senior Manager
ManagerManager
Responsibility for
major end-to-end
processes
Responsibility for
major sub-processes
Responsibility for
work processes/ sub-
processes
© Max Zornada Slide 2
Lean Six Sigma: Yellow Belt Advanced
A More Comprehensive View of an OrganisationReconciling Dynamic Flows and Static Structures
WorkgroupWorkgroup Workgroup Workgroup Workgroup
Senior Manager
ManagerManager
197
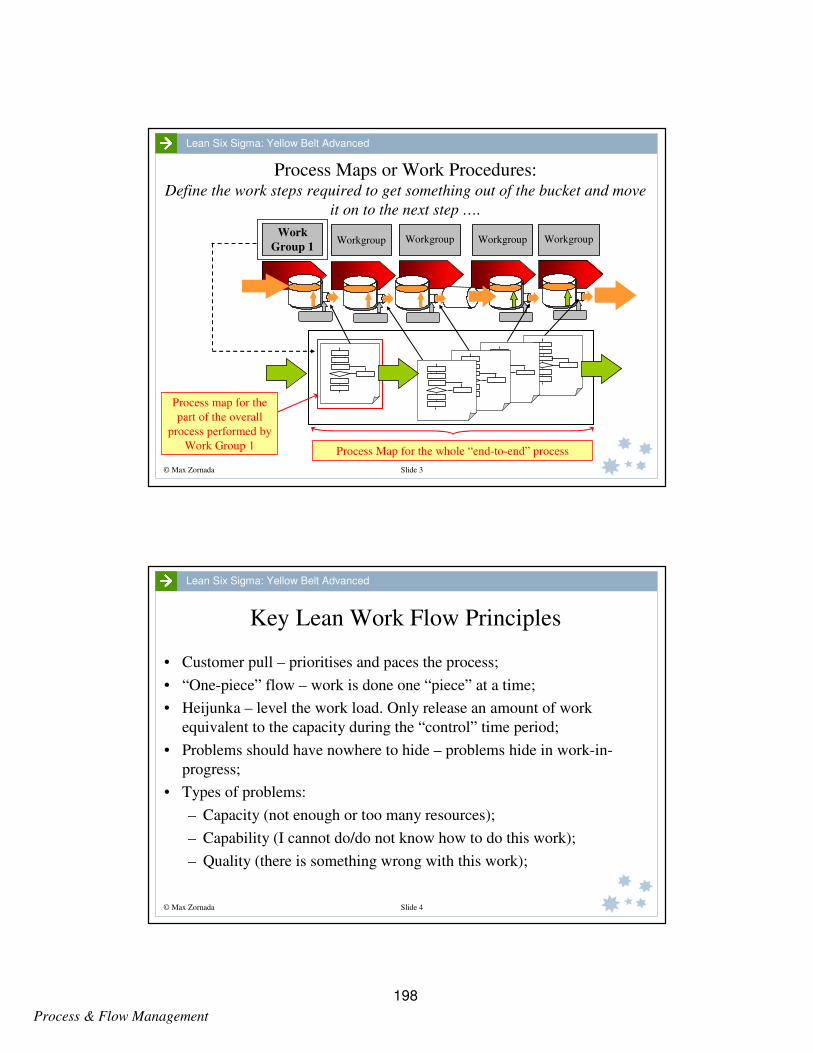
Process & Flow Management
© Max Zornada Slide 3
Lean Six Sigma: Yellow Belt Advanced
Process Maps or Work Procedures:Define the work steps required to get something out of the bucket and move
it on to the next step ….
WorkgroupWork
Group 1Workgroup Workgroup Workgroup
Process Map for the whole “end-to-end” process
Process map for the
part of the overall
process performed by
Work Group 1
© Max Zornada Slide 4
Lean Six Sigma: Yellow Belt Advanced
Key Lean Work Flow Principles
• Customer pull – prioritises and paces the process;
• “One-piece” flow – work is done one “piece” at a time;
• Heijunka – level the work load. Only release an amount of work
equivalent to the capacity during the “control” time period;
• Problems should have nowhere to hide – problems hide in work-in-
progress;
• Types of problems:
– Capacity (not enough or too many resources);
– Capability (I cannot do/do not know how to do this work);
– Quality (there is something wrong with this work);
198

Process & Flow Management
© Max Zornada Slide 5
Lean Six Sigma: Yellow Belt Advanced
Prioritisation, Scheduling and Customer “Pull”
Voice of the
Customer (VOC)
Schedule
Work sequence “pulled” to meet
customer requirement
© Max Zornada Slide 6
Lean Six Sigma: Yellow Belt Advanced
Work Leveling and “One Piece” flow
Voice of the
Customer (VOC)
Schedule
Work in
Team capacity
Work scheduled
199
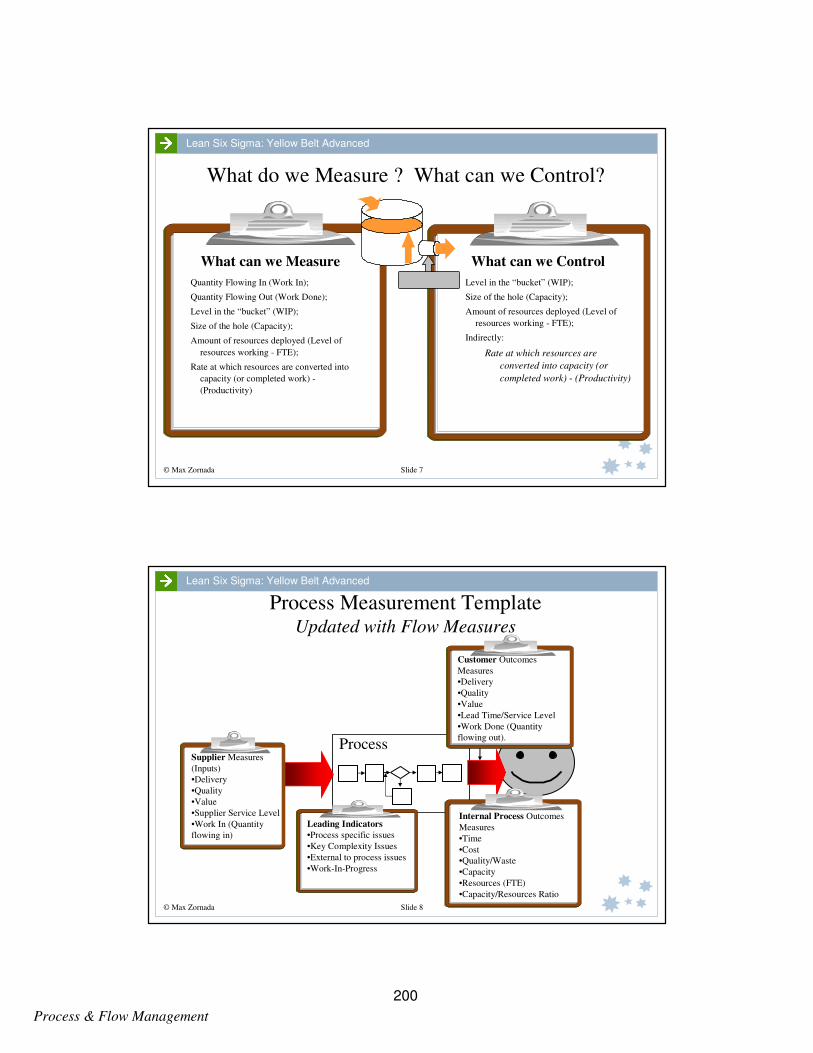
Process & Flow Management
© Max Zornada Slide 7
Lean Six Sigma: Yellow Belt Advanced
What do we Measure ? What can we Control?
Quantity Flowing In (Work In);
Quantity Flowing Out (Work Done);
Level in the “bucket” (WIP);
Size of the hole (Capacity);
Amount of resources deployed (Level of
resources working - FTE);
Rate at which resources are converted into
capacity (or completed work) -
(Productivity)
Level in the “bucket” (WIP);
Size of the hole (Capacity);
Amount of resources deployed (Level of
resources working - FTE);
Indirectly:
Rate at which resources are
converted into capacity (or
completed work) - (Productivity)
What can we Control What can we Measure
© Max Zornada Slide 8
Lean Six Sigma: Yellow Belt Advanced
Process Measurement Template Updated with Flow Measures
Customer Outcomes
Measures
•Delivery
•Quality
•Value
•Lead Time/Service Level
•Work Done (Quantity
flowing out).
Internal Process Outcomes
Measures
•Time
•Cost
•Quality/Waste
•Capacity
•Resources (FTE)
•Capacity/Resources Ratio
Supplier Measures
(Inputs)
•Delivery
•Quality
•Value
•Supplier Service Level
•Work In (Quantity
flowing in)
Process
Leading Indicators
•Process specific issues
•Key Complexity Issues
•External to process issues
•Work-In-Progress
200
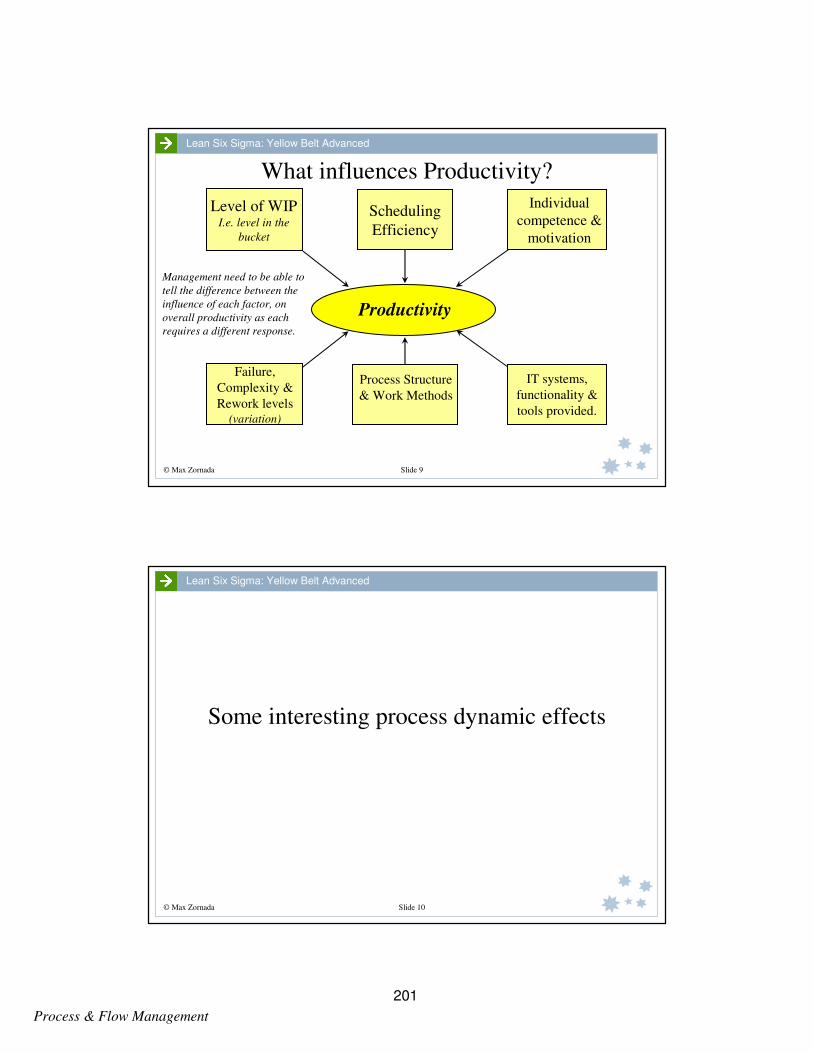
Process & Flow Management
© Max Zornada Slide 9
Lean Six Sigma: Yellow Belt Advanced
What influences Productivity?
Level of WIPI.e. level in the
bucket
Scheduling
Efficiency
Individual
competence &
motivation
Failure,
Complexity &
Rework levels (variation)
Process Structure
& Work Methods
IT systems,
functionality &
tools provided.
Management need to be able to
tell the difference between the
influence of each factor, on
overall productivity as each
requires a different response.
Productivity
© Max Zornada Slide 10
Lean Six Sigma: Yellow Belt Advanced
Some interesting process dynamic effects
201
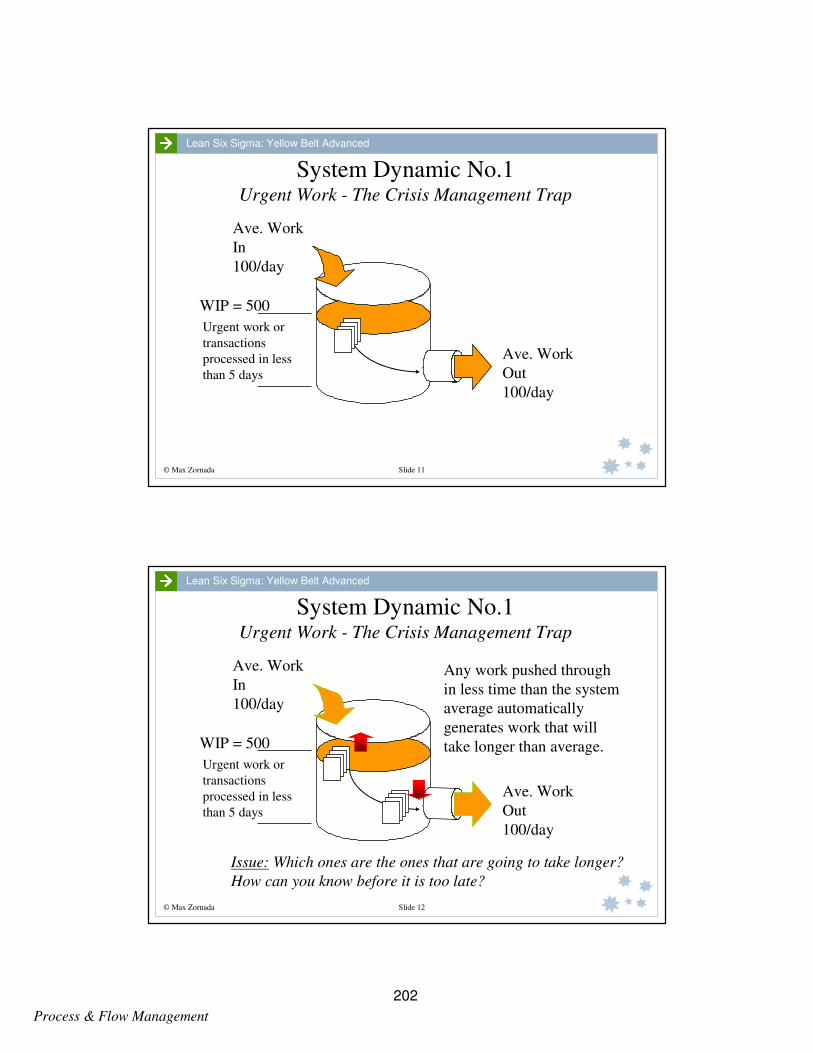
Process & Flow Management
© Max Zornada Slide 11
Lean Six Sigma: Yellow Belt Advanced
Ave. Work
Out
100/day
Ave. Work
In
100/day
System Dynamic No.1Urgent Work - The Crisis Management Trap
WIP = 500
Urgent work or
transactions
processed in less
than 5 days
© Max Zornada Slide 12
Lean Six Sigma: Yellow Belt Advanced
Ave. Work
Out
100/day
Ave. Work
In
100/day
WIP = 500
System Dynamic No.1Urgent Work - The Crisis Management Trap
Urgent work or
transactions
processed in less
than 5 days
Any work pushed through
in less time than the system
average automatically
generates work that will
take longer than average.
Issue: Which ones are the ones that are going to take longer?
How can you know before it is too late?
202
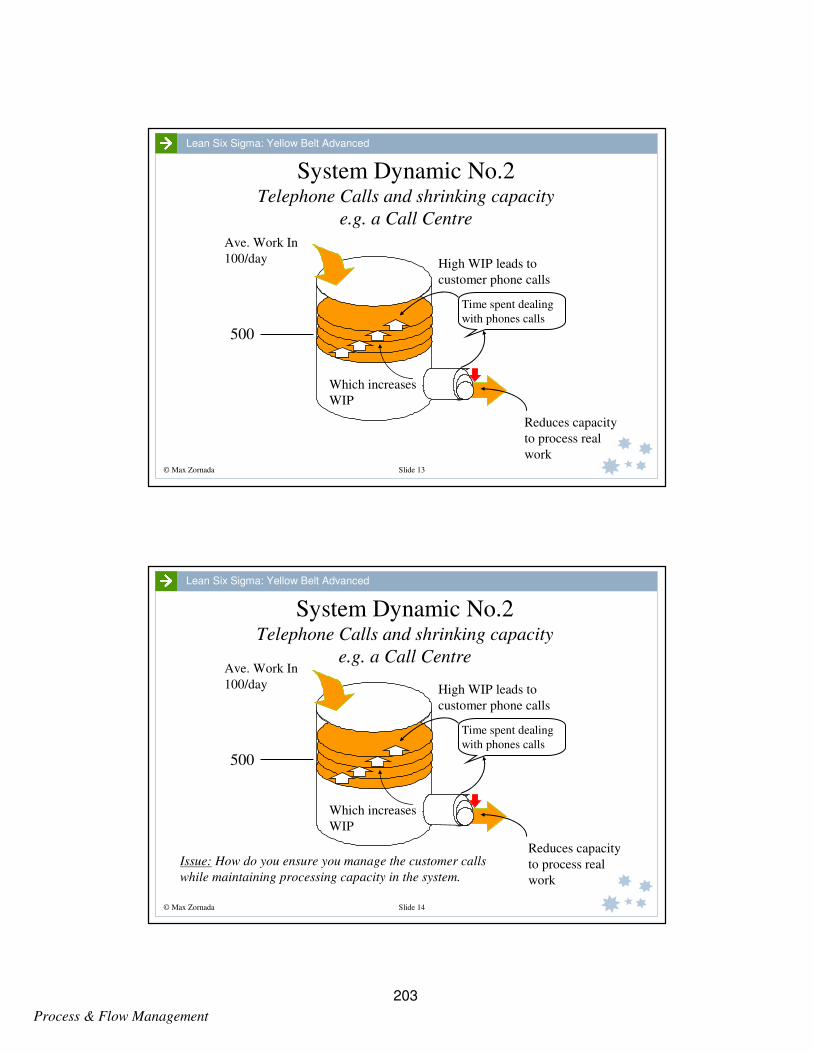
Process & Flow Management
© Max Zornada Slide 13
Lean Six Sigma: Yellow Belt Advanced
Ave. Work In
100/day
System Dynamic No.2Telephone Calls and shrinking capacity
e.g. a Call Centre
500
Reduces capacity
to process real
work
High WIP leads to
customer phone calls
Which increases
WIP
Time spent dealing
with phones calls
© Max Zornada Slide 14
Lean Six Sigma: Yellow Belt Advanced
Ave. Work In
100/day
System Dynamic No.2Telephone Calls and shrinking capacity
e.g. a Call Centre
500
Reduces capacity
to process real
work
High WIP leads to
customer phone calls
Which increases
WIP
Time spent dealing
with phones calls
Issue: How do you ensure you manage the customer calls
while maintaining processing capacity in the system.
203

Process & Flow Management
© Max Zornada Slide 15
Lean Six Sigma: Yellow Belt Advanced
System Dynamic No.3Rework and shrinking capacity
500
Resources spent on rework
reduces capacity to process
real work
High level of WIP
creates pressure on
workers – work faster
Leads to more errors and
more rework
Which
increases WIP
© Max Zornada Slide 16
Lean Six Sigma: Yellow Belt Advanced
System Dynamic No.3Rework and shrinking capacity
500
Resources spent on rework
reduces capacity to process
real work
High level of WIP
creates pressure on
workers – work faster
Leads to more errors and
more rework
Sources of Error and Strategies
Carelessness: take the pressure off
by reducing WIP – will eliminate
pressure induced errors/rework;
Systemic/Process based: fix the
process to eliminate root-causes of
errors/rework.
Which
increases WIP
204
Process & Flow Management
© Max Zornada Slide 17
Lean Six Sigma: Yellow Belt Advanced
The reality of work in many organisations
All three dynamics present and at
work at the same time.
© Max Zornada Slide 18
Lean Six Sigma: Yellow Belt Advanced
205

Process & Flow Management
© Max Zornada Slide 19
Lean Six Sigma: Yellow Belt Advanced
206

Implementation Issues and Conclusion
207

208

Implementation Issues
© Max Zornada Slide 1
Lean Six Sigma: Yellow Belt Advanced
Implementation Issues
© Max Zornada Slide 2
Lean Six Sigma: Yellow Belt Advanced
Succeeding at Operational ExcellenceCritical Success Factors …..
• Leadership;
• Link to Strategy;
• Build a culture that values Excellence;
• Provide education and training;
• Establish supporting “infrastructure”;
• Identify and action “enabling” projects;
• Manage change.
209

Implementation Issues
© Max Zornada Slide 3
Lean Six Sigma: Yellow Belt Advanced
Governance Structure
Steering Committee
Project Portfolio
Priorities Capacity
Select projects
Do projects
Measure Results
Resource
Balancing
Lean Six
Sigma teams
Business Strategy &
Strategic Priorities Strategic initiatives
COQ
Employee suggestions
Benchmarking
Agree Issues and
Opportunities
Sources of
Projects
© Max Zornada Slide 4
Lean Six Sigma: Yellow Belt Advanced
Managing Change
Need to change all 3 in order to have changed.
Can start at any point provided you go around all the
bases.
Change the
Systems &
Structures
Change the
Behaviours
Change the
Attitudes
210
Implementation Issues
© Max Zornada Slide 5
Lean Six Sigma: Yellow Belt Advanced
You do not have to do this.
Survival is not compulsory.
W. Edwards Deming.
(1900-1994)
© Max Zornada Slide 6
Lean Six Sigma: Yellow Belt Advanced
211

Implementation Issues
© Max Zornada Slide 7
Lean Six Sigma: Yellow Belt Advanced
212

Templates
213

214
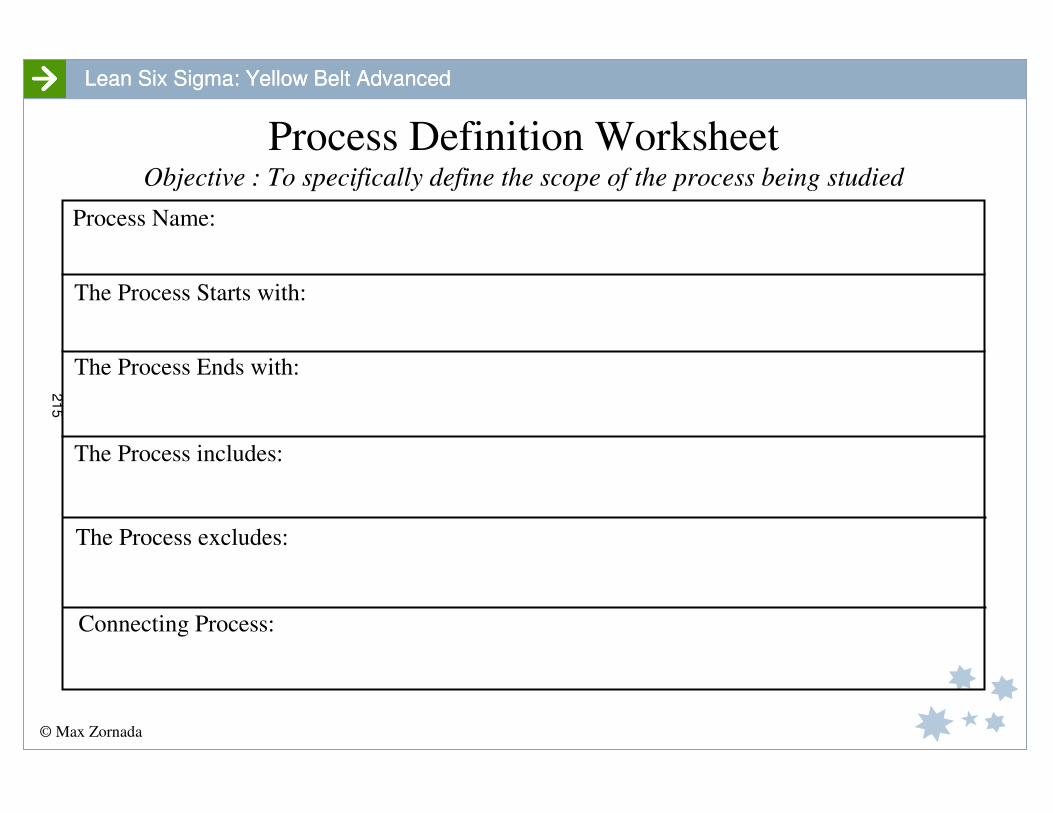
© Max Zornada
Lean Six Sigma: Yellow Belt AdvancedLean Six Sigma: Yellow Belt Advanced
Process Definition WorksheetObjective : To specifically define the scope of the process being studied
Process Name:
The Process Starts with:
The Process Ends with:
The Process includes:
The Process excludes:
Connecting Process:
215
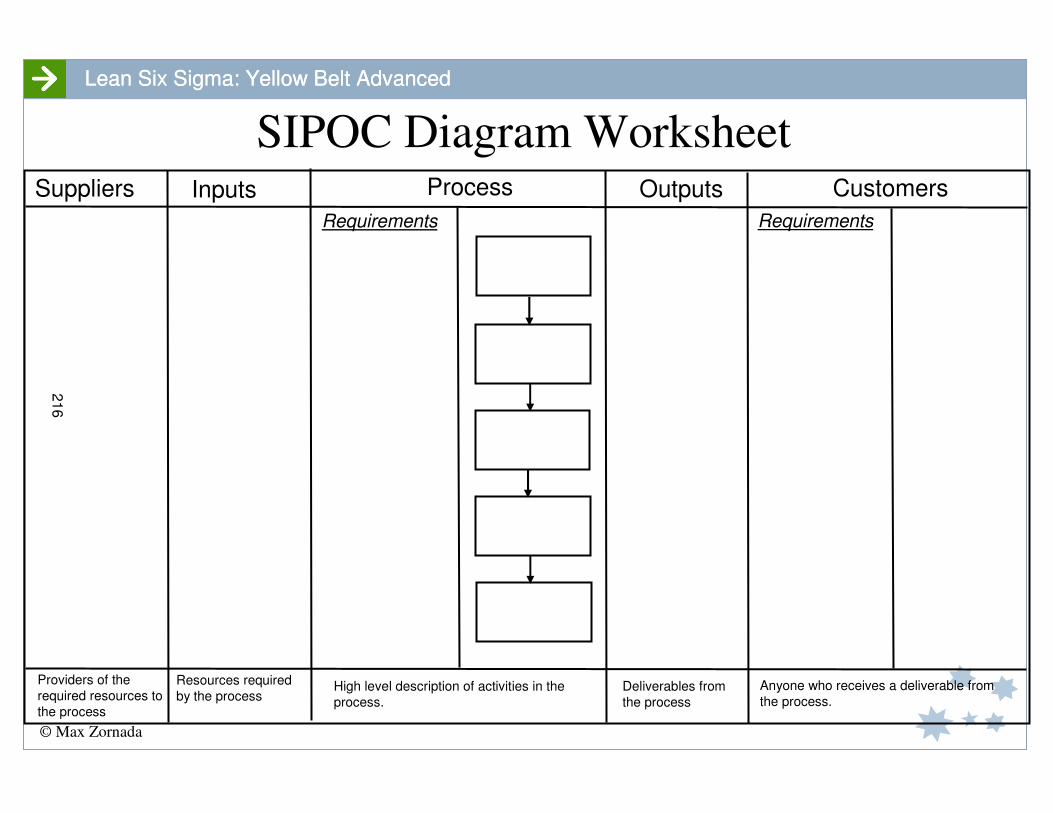
© Max Zornada
Lean Six Sigma: Yellow Belt AdvancedLean Six Sigma: Yellow Belt Advanced
SIPOC Diagram WorksheetSuppliers Inputs
Requirements
Process Outputs Customers
Requirements
Providers of the
required resources to
the process
Resources required
by the processHigh level description of activities in the
process.
Deliverables from
the process
Anyone who receives a deliverable from
the process.
216
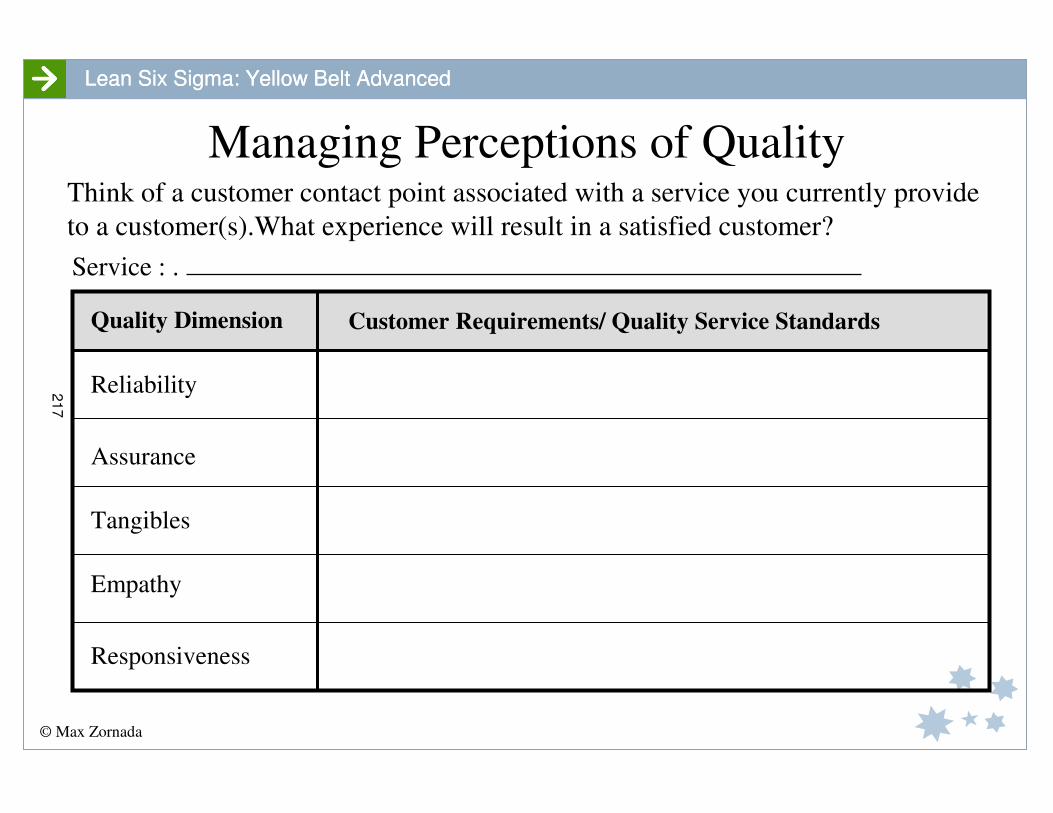
© Max Zornada
Lean Six Sigma: Yellow Belt AdvancedLean Six Sigma: Yellow Belt Advanced
Managing Perceptions of Quality
Service : .
Responsiveness
Assurance
Tangibles
Empathy
Reliability
Think of a customer contact point associated with a service you currently provide
to a customer(s).What experience will result in a satisfied customer?
Quality Dimension Customer Requirements/ Quality Service Standards
217
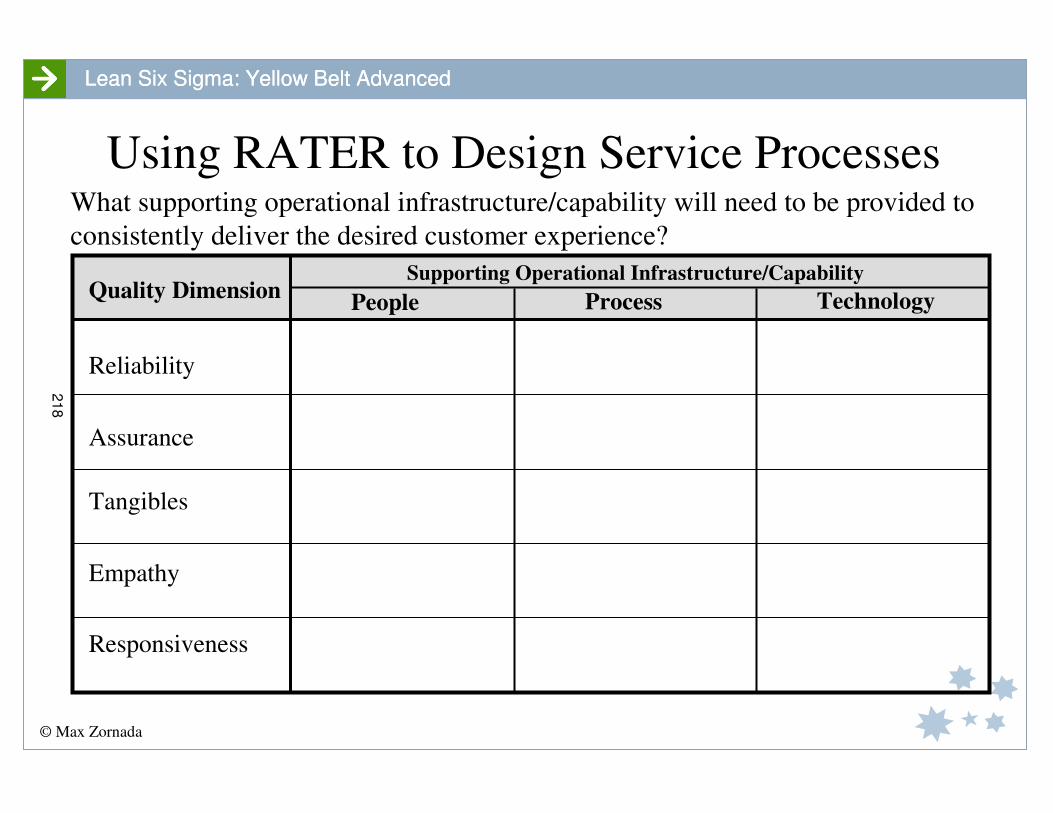
© Max Zornada
Lean Six Sigma: Yellow Belt AdvancedLean Six Sigma: Yellow Belt Advanced
Using RATER to Design Service ProcessesWhat supporting operational infrastructure/capability will need to be provided to
consistently deliver the desired customer experience?
Responsiveness
Assurance
Tangibles
Empathy
Reliability
Quality DimensionSupporting Operational Infrastructure/Capability
People Process Technology
218

© Max Zornada
Lean Six Sigma: Yellow Belt AdvancedLean Six Sigma: Yellow Belt Advanced
DMAIC Process Storyboard
Cause and Effect DiagramRun chart or
control chartProcess Map
Objective: Identify and implement the measures required to establish
baseline performance and quantify the opportunity.Objective: Define the Problem/Opportunity, Business
Case, Customers & Customer Requirements, and Process.Objective: To allocate a project worth
doing to a capable team.
Output: Project selected, team selected,
project allocated to team.
Develop Business Case
Develop Project Charter
Understand Customer Requirements
Understand the Process.
PRE-DMAIC DEFINE MEASURE
ANALYSE
Output: A quantified picture of the current process performance
(current state) and problem impact.
Key Steps:- Key Steps:-
IMPROVE - I : Generate Potential Solutions
Output: Business Case, Project Charter, Work Plan, Problem
Definition, Measurable Customer Requirements, Process Map
Team charter
Objective: Identify and verify the root cause(s) of the problem.
Objective: Implement the preferred solution. Confirm that the
problem and its root cause(s) have been reduced or eliminated.
Implement preferred solution
Verify effectiveness
Apply comparative methods if
necessary.
Objective: Prevent the problem and its root
cause from recurring.
Standardise the solution
(standards & procedures)
Develop and Implement
PMCS
Document project
Analyse Data
Analyse Process
Determine Potential Root Causes
Form & Test Hypothesis
Verify Root Causes
Key Steps:-
Objective: Determine possible solutions that will address the identified root cause(s) of
the problem.
Generate potential solutions
Assess potential solutions
Select preferred solution
Test/Pilot preferred solution
Develop implementation plan
Before
After
Key steps:-
Flowchart Standard procedure
Output: Solution embedded and “routinised” in
relevant process, procedures and standards.
Key steps:-
Objectives: Review team effectiveness, plan to
address remaining issues and institutionalise the
learning.
Output: Recommendations for future projects &
improvements to team processes. Project
documentation and learnings “pack”
IMPROVE - II: Implement and Check
Review remaining project
opportunities
Review other applications
Review learnings
C D
MA
I 6σ
CONTROL - Standardise FUTURE PLANS
Output: Root cause(s) identified & verified
Cause and Effect Diagram
(Fishbone)Checksheet
Pareto Chart
Output: Preferred solution or countermeasures
Key Steps:-
Output: Confirmation the best solution to eliminate the problem & its
root cause(s) has been implemented.
Potential Solutions
Key Steps:-
Action Plan
Step 1
Step 2
Step 3
Step 4
Step 5
Step 6
Identify opportunities
Select project
Select team
Allocate to team
Key Steps:-Determine what to Measure
Understand the Measures
Understand Variation
Assess Current Process
Performance
Pareto Chart
219

© Max Zornada
Lean Six Sigma: Yellow Belt AdvancedLean Six Sigma: Yellow Belt Advanced
DMAIC Process StoryboardPRE-DMAIC DEFINE MEASURE
ANALYSE IMPROVE - I : Generate Potential Solutions
IMPROVE - II: Implement and Check CONTROL - Standardise FUTURE PLANS
220
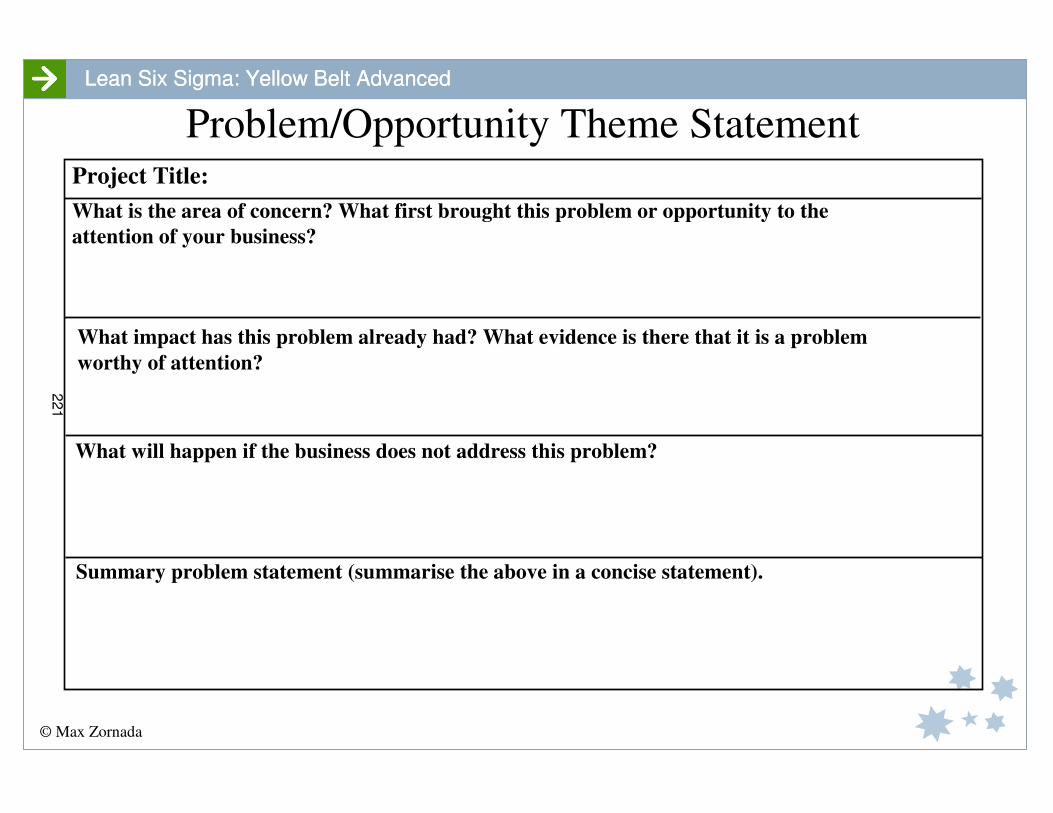
© Max Zornada
Lean Six Sigma: Yellow Belt AdvancedLean Six Sigma: Yellow Belt Advanced
Problem/Opportunity Theme Statement
What is the area of concern? What first brought this problem or opportunity to the
attention of your business?
Summary problem statement (summarise the above in a concise statement).
Project Title:
What will happen if the business does not address this problem?
What impact has this problem already had? What evidence is there that it is a problem
worthy of attention?
221

© Max Zornada
Lean Six Sigma: Yellow Belt AdvancedLean Six Sigma: Yellow Belt Advanced
Process
Green Belt
Process Owner
Start Date
Project Title
Objective
Problem/Opportunity
Definition
Business Case
Team Members
Customer Benefit
Schedule
What is the Problem to be solved or the
opportunity this project will exploit.
Project Scope
Improvement target, impact on Sigma,
COQ/COPQ and Customer Satisfaction
What improvement in business
performance is expected. $ impact and by
when.
Who are the team members and key experts
to be consulted.
Which part of the process will be
investigated
Who are the final customers. What
benefits will they see and what are their
most critical requirements.
What are key milestone dates for
completion of each stage.
Expected Financial Impact
Telephone Number
Organization/Function
Target Completion Date
Define completion
Measure completion
Analyse completion
Improve completion
Control completion
Project Completion
Improvement Project Charter
222
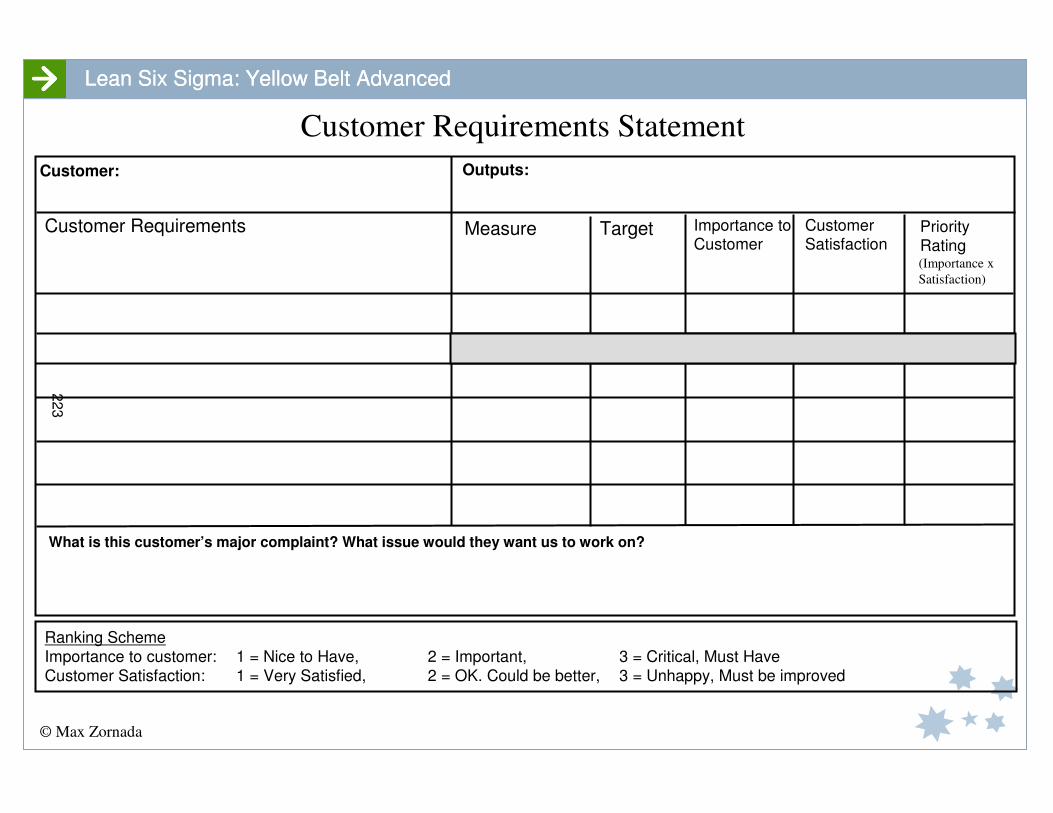
© Max Zornada
Lean Six Sigma: Yellow Belt AdvancedLean Six Sigma: Yellow Belt Advanced
Customer Requirements Statement
What is this customer’s major complaint? What issue would they want us to work on?
Customer Requirements
Ranking Scheme
Importance to customer: 1 = Nice to Have, 2 = Important, 3 = Critical, Must Have
Customer Satisfaction: 1 = Very Satisfied, 2 = OK. Could be better, 3 = Unhappy, Must be improved
Outputs: Customer:
Measure Importance to Customer
Customer Satisfaction
(Importance x
Satisfaction)
Target PriorityRating
223
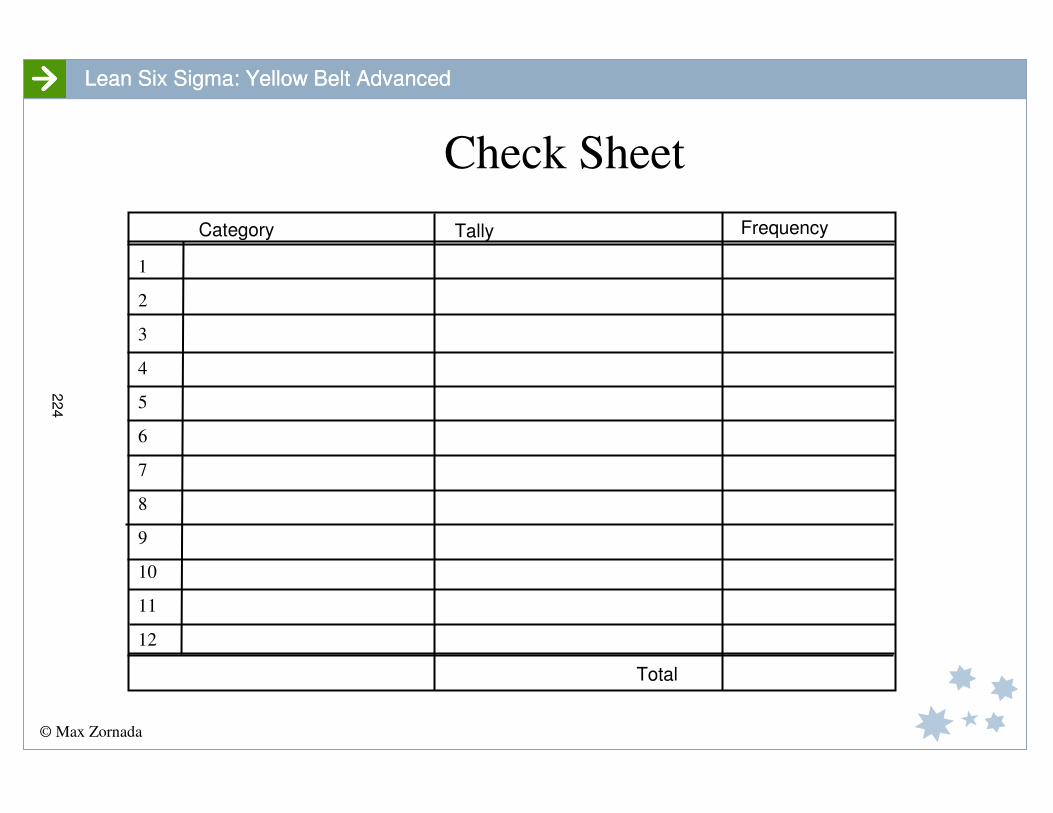
© Max Zornada
Lean Six Sigma: Yellow Belt AdvancedLean Six Sigma: Yellow Belt Advanced
Check Sheet
Category Tally Frequency
Total
1
2
3
4
5
6
7
8
9
10
11
12
224

© Max Zornada
Lean Six Sigma: Yellow Belt AdvancedLean Six Sigma: Yellow Belt Advanced
Fishbone DiagramPeople Procedures
Equipment/Systems Materials/Environment
225
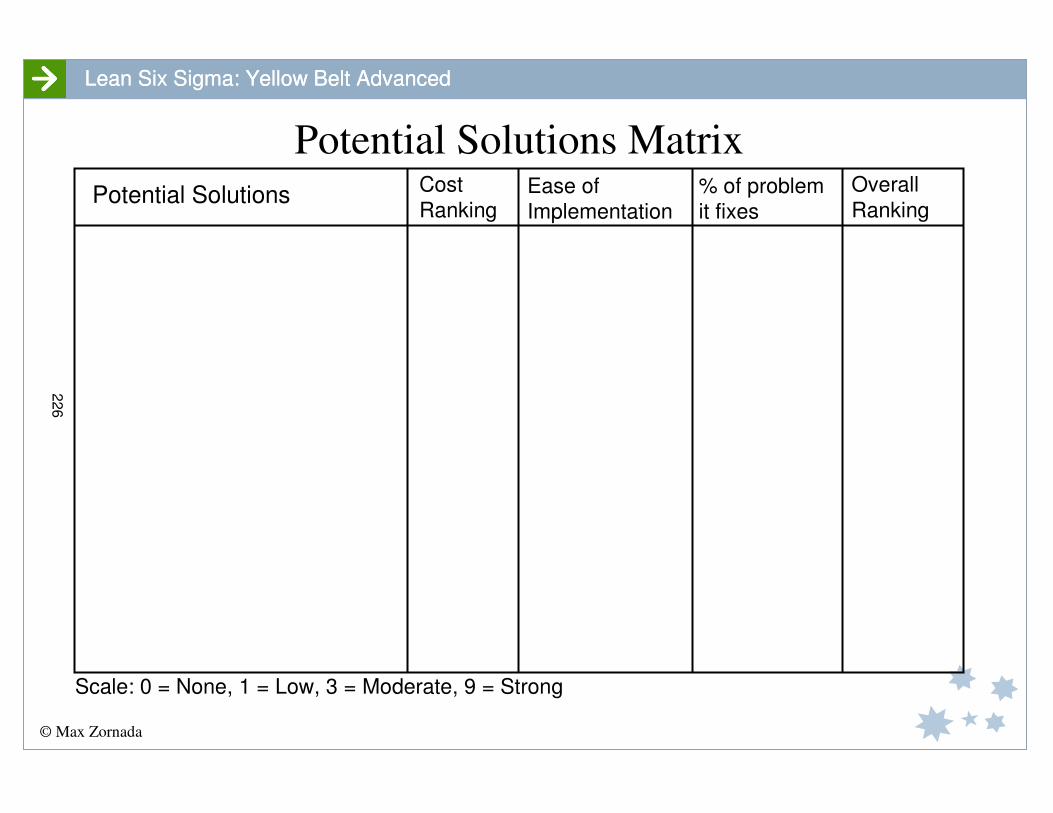
© Max Zornada
Lean Six Sigma: Yellow Belt AdvancedLean Six Sigma: Yellow Belt Advanced
Potential Solutions Matrix
Potential Solutions Cost
RankingEase of
Implementation
% of problem
it fixes
Overall
Ranking
Scale: 0 = None, 1 = Low, 3 = Moderate, 9 = Strong
226

© Max Zornada
Lean Six Sigma: Yellow Belt AdvancedLean Six Sigma: Yellow Belt Advanced
Process
Objective: Establish current/baseline performance or process and
quantify customer requirement.
Objective: Define Opportunity/Gap, Customer Requirements,
and Process.Objective: Select process for Design/
Redesign and project team.
Output: Process and Team selected
TEAM FORMATION DEFINE MEASURE
ANALYSE
Output: A quantified picture of customer requirements reconciled to
current process performance.
Key Steps:- Key Steps:-
Output: Project Charter, Customer Requirements, Process Map,
Project plan
Project charter
Objective: Generate Insight and Vision for New Process Options
Objective: Develop detailed design and test/control plan Objective: Implement New Process
Key Steps:-
Key steps:-
Output: New process fully implemented.
Key steps:-
Objectives: Review team effectiveness, plan to
address remaining issues and institutionalise the
learning.
Output: Recommendations for future projects &
improvements to team processes. Project
documentation and learnings “pack”
DESIGN
C D
MA
I 6σ
VALIDATE FUTURE PLANS
Output: Design Options for New Process
Output: Preferred design ready for full implementation
Key Steps:-
•Select Process for Design/Redesign
•Project Charter and Business Case
•Understand the Process
•Understand Customer Requirements
•Develop project plan
•Implement new process design
•Implemented PMCS
•Manage the change
•Plan continuous improvement
•Select preferred design option
•Detailed Socio-technical design
•Simulation and Piloting
•Pilot evaluation
•Implementation Planning
•Analysis
•Generate Insights
•Visioning
•Generation of Options
METHODOLOGY
Process
•Quantify customer requirements & CTQ’s
•Measure Current Process Performance
•Understand Variation
•Assess Process Capability
Process
Process PLAN
TRANSFORM
ANALYZE
COLLECT
Process Analysis/
Redesign PrinciplesValue Stream
AnalysisBenchmarking Quality Function
Deployment
Existing process redesign New Process Design
•Post implementation review
•Prepare project documentation pack
Process PMCS
DMADV Process Storyboard
227
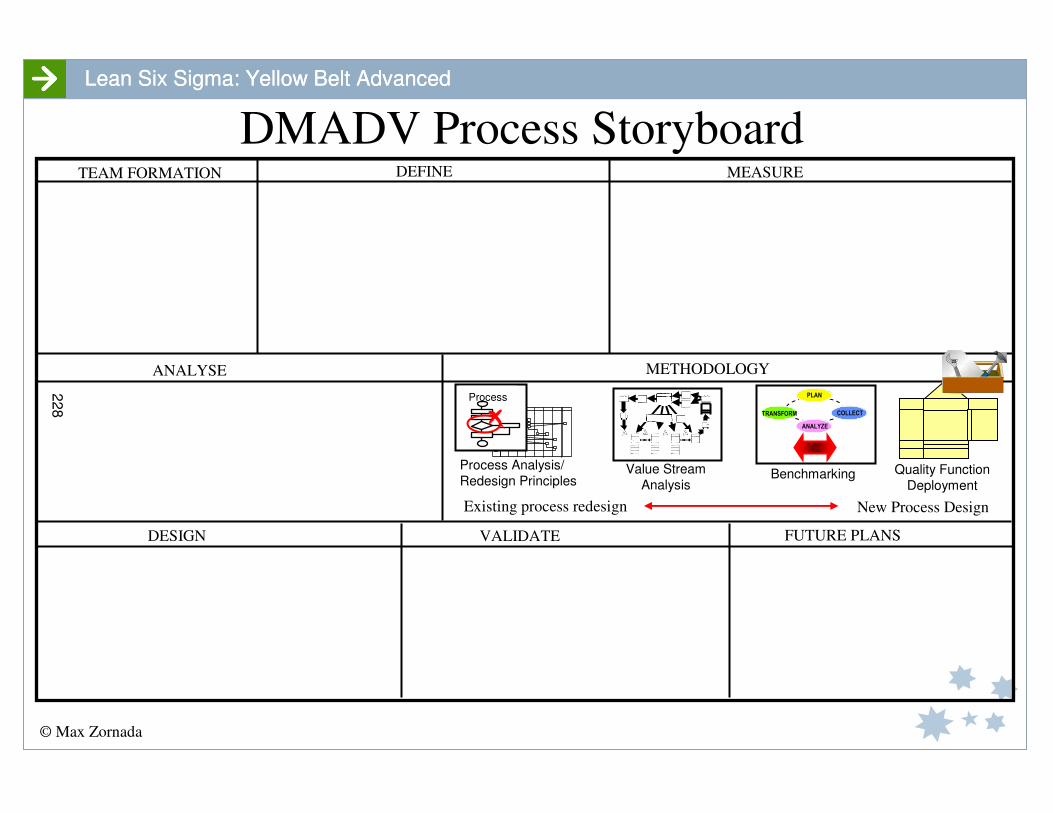
© Max Zornada
Lean Six Sigma: Yellow Belt AdvancedLean Six Sigma: Yellow Belt Advanced
TEAM FORMATION DEFINE MEASURE
ANALYSE
DESIGN VALIDATE FUTURE PLANS
METHODOLOGY
Process PLAN
TRANSFORM
ANALYZE
COLLECT
Process Analysis/
Redesign PrinciplesValue Stream
AnalysisBenchmarking Quality Function
Deployment
Existing process redesign New Process Design
DMADV Process Storyboard
228

© Max Zornada
Lean Six Sigma: Yellow Belt AdvancedLean Six Sigma: Yellow Belt Advanced
Process Deployment Chart
229
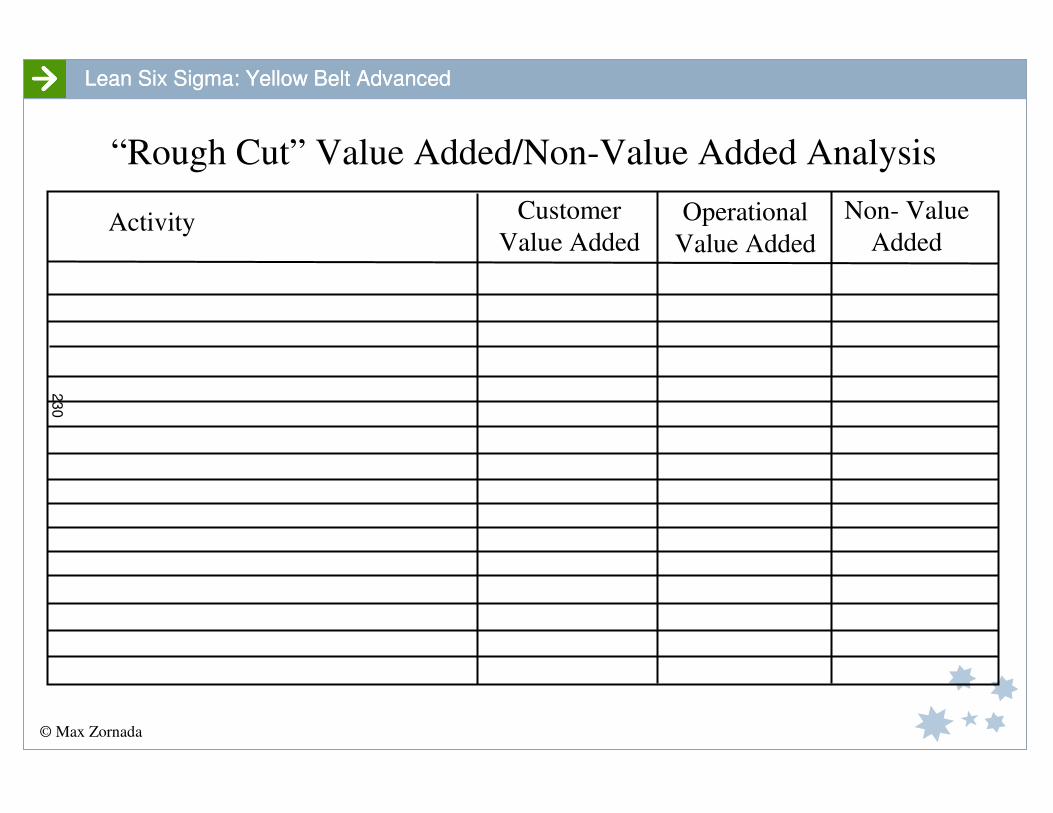
© Max Zornada
Lean Six Sigma: Yellow Belt AdvancedLean Six Sigma: Yellow Belt Advanced
“Rough Cut” Value Added/Non-Value Added Analysis
Customer
Value Added
Operational
Value Added
Non- Value
AddedActivity
230
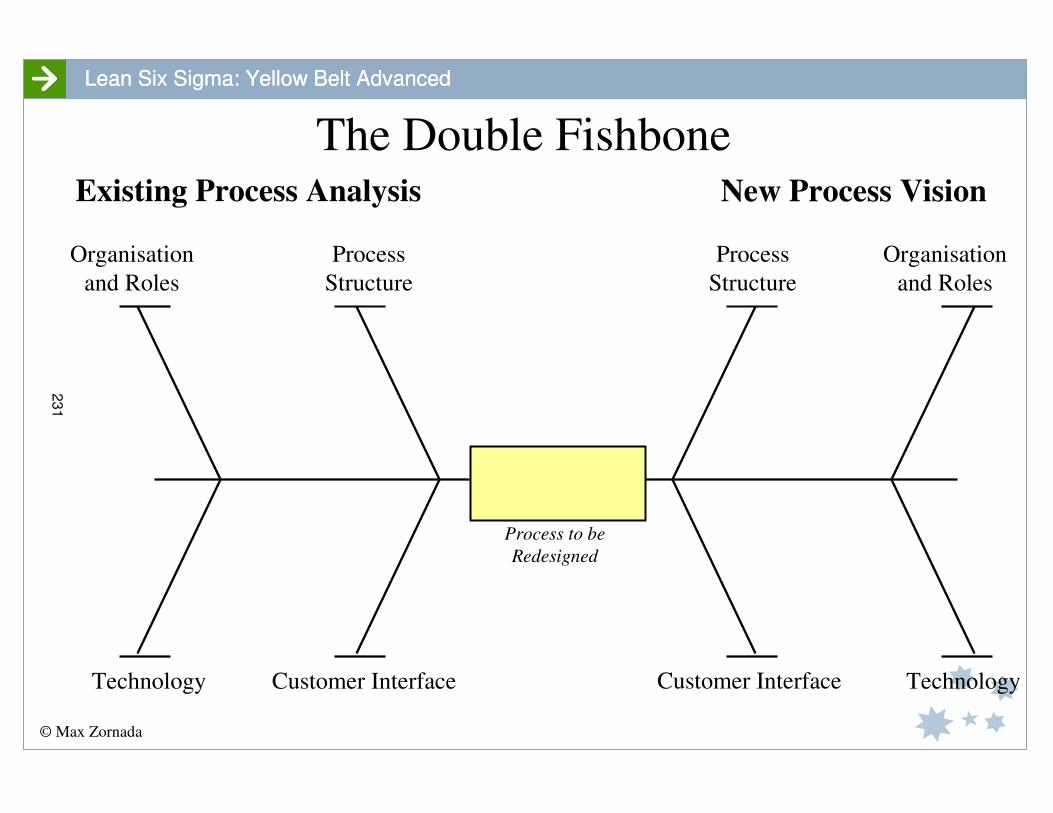
© Max Zornada
Lean Six Sigma: Yellow Belt AdvancedLean Six Sigma: Yellow Belt Advanced
The Double Fishbone
Organisation
and Roles
Process
Structure
Technology Customer Interface
Process
Structure
Organisation
and Roles
TechnologyCustomer Interface
New Process Vision
Process to be
Redesigned
Existing Process Analysis
231
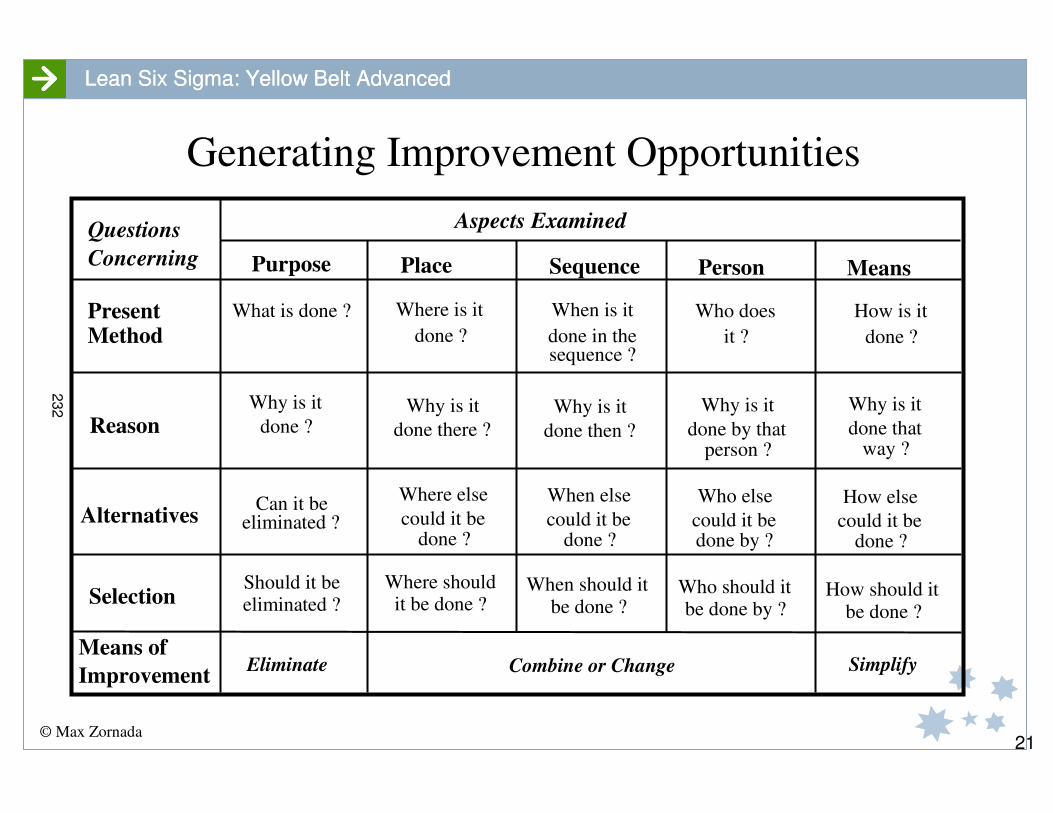
© Max Zornada
Lean Six Sigma: Yellow Belt AdvancedLean Six Sigma: Yellow Belt Advanced
Generating Improvement Opportunities
21
Present
Reason
Alternatives
Selection
Improvement
Concerning Purpose Place Sequence Person Means
What is done ?
done ?
Can it be
Should it be
Eliminate Combine or Change Simplify
done ? done in the it ? done ?
done there ?
could it be
Where should
done then ? done by that done that
could it be could it be could it be
When should it Who should it How should it
Method
Means of
Questions Aspects Examined
Why is it
eliminated ?
eliminated ?
Where is it When is it
sequence ?
Who does How is it
Why is it
Where else
done ?
it be done ?
Why is it Why is it
person ?
Why is it
way ?
When else
done ?
Who else
done by ?
How else
done ?
be done ? be done by ? be done ?
232
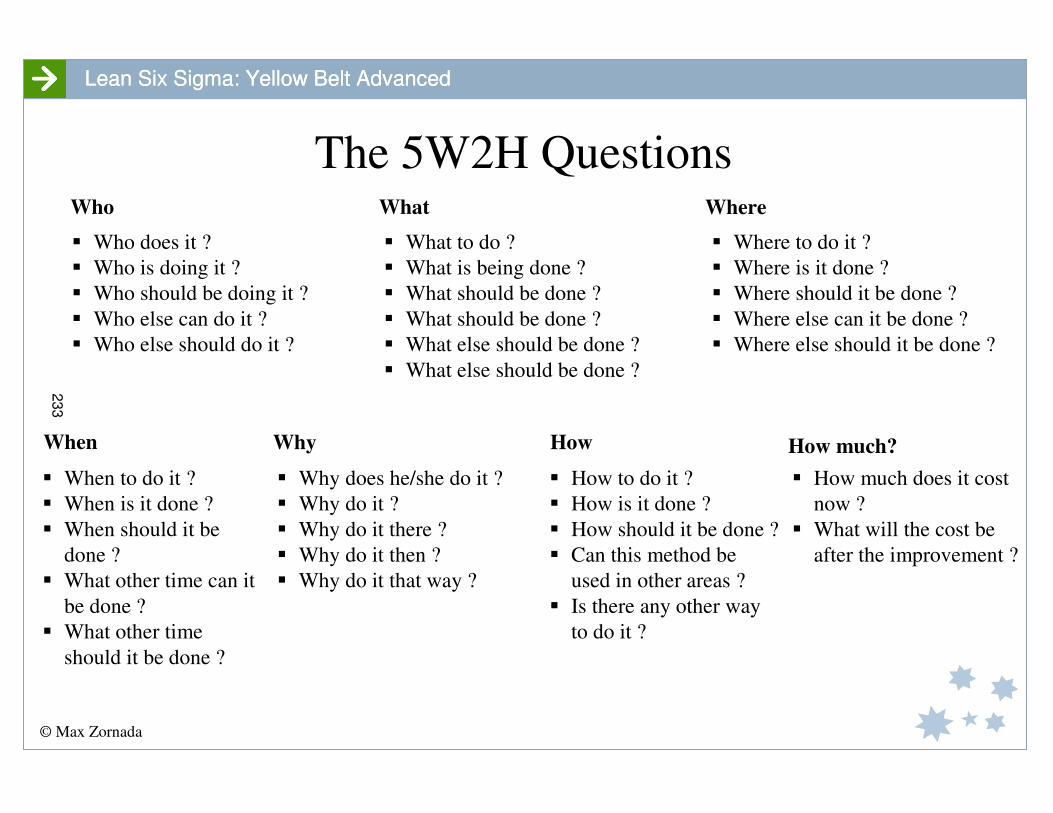
© Max Zornada
Lean Six Sigma: Yellow Belt AdvancedLean Six Sigma: Yellow Belt Advanced
The 5W2H Questions Who What Where
Why
� Who does it ?
� Who is doing it ?
� Who should be doing it ?
� Who else can do it ?
� Who else should do it ?
� What to do ?
� What is being done ?
� What should be done ?
� What should be done ?
� What else should be done ?
� What else should be done ?
� Where to do it ?
� Where is it done ?
� Where should it be done ?
� Where else can it be done ?
� Where else should it be done ?
� Why does he/she do it ?
� Why do it ?
� Why do it there ?
� Why do it then ?
� Why do it that way ?
How much?
� How much does it cost
now ?
� What will the cost be
after the improvement ?
When
� When to do it ?
� When is it done ?
� When should it be
done ?
� What other time can it
be done ?
� What other time
should it be done ?
How
� How to do it ?
� How is it done ?
� How should it be done ?
� Can this method be
used in other areas ?
� Is there any other way
to do it ?
233

© Max Zornada
Lean Six Sigma: Yellow Belt AdvancedLean Six Sigma: Yellow Belt Advanced
WIP
Flow Management Template
Work out
Work in
Resource
Hours
Hours/Work
Unit
Service Level
234