lean tools for reducing production time and …206034/...school of technology and design lean tools...
TRANSCRIPT

School of Technology and Design
Lean Tools for Reducing Production Time and Satisfying Employees
- A Case Study
VÄXJÖ, JUNE 2008
THESIS NO: TD 022/2008BUKET BOZTINAZTEPEFATIH CANANDEPARTMENT OF TEROTECHNOLOGY

II
Organisation/ Organization Författare/Author(s)VÄXJÖ UNIVERSITETInstitutionen för teknik och design Buket BoztınaztepeVäxjö University Fatih CananSchool of Technology and Design
Dokumenttyp/Type of document Handledare/tutor Examinator/examinerExamensarbete/ Diplomawork Mirka Kans Basim Al-Najjar
Titel och undertitel/Title and subtitle
Lean Tools for Reducing Production Time and Satisfying Employees –A Case StudySammanfattning (på svenska)
Nyckelord
Abstract (in English)The purpose of this thesis is to reduce the production time while providing employees satisfaction and the problem formulation for thesis is;
-How can a company use its work area effectively in order to reduce production time while providing employee satisfaction?
To answer problem formulation, proper lean tools were applied. Before implementing lean tools, the study started with a questionnaire to evaluate the effect of work area on employees. Five steps of 5S were implemented on work area so as to provide an organized work area for employee satisfaction in accordance with the theory. SMED’s four stage methodology was applied to the machine in the work area where was focused by the authors in order to reduce the production time. The study was made in a Swedish Company called Swepart Transmission AB. which produces gearboxes, bearings etc. Results obtained from the study shows that employees are under effect of work area and employees were satisfied after 5S implementation, also production time will be reduced at least one hour in the length of time. This thesis can be generalised to all manufacturing companies thus both employee satisfaction and production time reduction can be provided and companies can work more effectively which enables them to become competitiveness in order to survive in market.
Key Words: Lean tools, 5S, SMED, Employee Satisfaction, Production Time
Utgivningsår/Year of issue Språk/Language Antal sidor/Number of pages2008 English
Internet/WWW http://www.vxu.se/td
III
ACKNOWLEDGEMENTS
We would sincerely like to thank all the people that have contributed
to the work of this thesis.
First of all we would like to thank our tutor, Mirka Kans, who has
supervised us in an excellent way, given good and existing suggestions
and criticism to the process of the work and motivate us in a good way.
This has improved the quality of the thesis.
We would like to thanks Swepart Transmission AB in Liatorp for
giving us the opportunity to work on a real case study in the
production. Most of all, we would like to thank Torgel Kristensson,
and Ronny Karlsson , who were kindly enough to offer us the necessary
information and devote time during the interviews, and all the
employees that participate in our survey. Without their support, the
compilation of this thesis would not have been possible.
Växjö, June 2008
Fatih CANAN Buket BOZTINAZTEPE

IV
TABLE OF CONTENT
1. Introduction .......................................................................................................................... 1
1.1 Background....................................................................................................................... 1
1.2 Problem Discussion .......................................................................................................... 1
1.3 Problem Formulation........................................................................................................ 2
1.4 Purpose ............................................................................................................................. 2
1.5 Relevance.......................................................................................................................... 2
1.6 Limitations and Delimitations .......................................................................................... 2
1.7 Timeframe ........................................................................................................................ 3
2. Methodology ......................................................................................................................... 4
2.1 Scientific Perspective ....................................................................................................... 4
2.2 Research Approaches ....................................................................................................... 4
2.3 Research Methods............................................................................................................. 5
2.3.1 Data sources and data gathering................................................................................. 5
2.4 Results Evaluation ............................................................................................................ 6
2.4.1 Validity ...................................................................................................................... 6
2.4.2 Reliability................................................................................................................... 7
2.4.3 Generalization of Results ........................................................................................... 7
2.5 Thesis Research Methods ................................................................................................. 7
3. Theory ................................................................................................................................... 9
3.1 Lean Production................................................................................................................ 9
3.2 Continues Improvement-Kaizen..................................................................................... 10
3.3 5S .................................................................................................................................... 11
3.4 Setup Time...................................................................................................................... 13
3.4.1 Single Minute Exchange of Die (SMED) ................................................................ 14

V
3.5 The Effect of Work Area Arrangement on Employee.................................................... 15
4. Empirical Findings ............................................................................................................. 16
4.1 Presentation of Swepart Transmission AB..................................................................... 16
4.2 Presentation of Swepart Transmission AB Liatorp ........................................................ 17
4.3 Swepart Transmission Production Process..................................................................... 18
4.4 Sub Processes ................................................................................................................. 19
4.5 5S in Swepart.................................................................................................................. 20
4.6 Current Status of Yellow Group..................................................................................... 20
4.6.1 Description of Setup for S40 Machine..................................................................... 20
4.6.2 Setup Steps of S40 Machine .................................................................................... 21
4.7 How Swepart Assesses Production Time ....................................................................... 22
4.7.1 Production Time of S40 Machine ............................................................................ 22
4.8 Employee Satisfaction .................................................................................................... 23
5. Analysis ............................................................................................................................... 27
5.1 Employee Satisfaction .................................................................................................... 27
5.2 Implementation of 5S in yellow group ........................................................................... 28
5.3 SMED Analysis .............................................................................................................. 30
7. Conclusion and Recommendations................................................................................... 37
8. References ........................................................................................................................... 38
9. Appendix ............................................................................................................................. 40
VI
FIGURES-GRAPHS AND TABLES
Figure1. The tools and methods to collect data (Yin, 2003) ...................................................... 5
Figure2. Incremental and Innovation Improvement................................................................. 11
Figure3. 5S discipline (Sekine,1998) ....................................................................................... 12
Figure4. Set-up Time................................................................................................................ 14
Figure 5.Organization Schema (ibid) ....................................................................................... 17
Figure6. Production Process of Swepart .................................................................................. 19
Figure7. Change (internal setup time to external setup time) .................................................. 32
Figure8.Change (In setup time)................................................................................................ 33
Figure9. (Total change in setup time) ...................................................................................... 34
Table1. Turnover (ibid) ............................................................................................................ 17
Table2. Turnovers, investments and employee numbers for last six years(ibid) ..................... 17
Table3. Setup Steps of S40 Machine ....................................................................................... 22
Table4. Amount of product, the cycle time, setup time and production time.......................... 23
Table5. The list of setup steps (internal and external setup steps) ........................................... 32
Graph 1.The effect of working area arrangement on performance. ......................................... 24
Graph2. Increase in Motivation............................................................................................... 24
Graph3. The effect of messy working area on job ................................................................... 25
Graph4. The effect of messy working area on employee satisfaction...................................... 25
Graph5. The effect of working area to find the needed tools hardly........................................ 26
Graph6. Defined place for tools and equipments ..................................................................... 26

1
1. Introduction
In this chapter an introduction to thesis is presented. A description of the background, problem discussion, the purpose of the study and the task developed are included in this chapter.
1.1 Background
Today’s globalization in the world has an effect on the competitive environment of industry. That is why companies should be better in almost every area in order to survive. Companies have universal goals like low cost, high profit and quality which affect competitiveness(George, 2003). In the history of industry, the philosophy of manufacturing has changed. The first one, which focused on task, was craft production but it was eliminated when the idea of mass production was discovered. And nowadays, after the importance of the customer satisfaction is understood by companies, the idea of manufacturing is coming to a new perspective which is called lean production (Womack, 1990).
The term “lean production” was invented by the International Motor Vehicle Program (at MIT) during the late 1980’s however the idea was first coined by Taiichi Ohno of Toyota Motors in early 1950’s (Liker, 2004). Applying a successful lean concept provides some benefits such as reduced lead times, reduced costs, reduced delivery times and increased market share, profit, productivity, effectiveness and service diversity (Paixao, 2003).
1.2 Problem Discussion
Competitiveness is one of the strategic goals for all companies. To be more competitive one of the way is to meet customer demand promptly. To respond customer faster, production should be accomplished for each demand quickly so the faster a company is, the more competitive it is. For this reason, production time becomes important. Also, efficiency is an effect on competitiveness because efficiency level affects production time and much more elements of a production process. Employee satisfaction is important for increasing the level of efficiency in working process since satisfied employees work with more motivation and performance which conduces efficiency in production.
Nowadays in manufacturing area employee satisfaction is disregarded while all the attention is given to production but it should not be forgotten that without considering employee satisfaction it is not easy to gather a good result or useful solution to enhance production like reducing the production time.
Lean production is a useful key concept for the companies for achieving strategic goals. Lean tools will provide the chance to satisfy the employee as well as having effective way of production.

2
1.3 Problem Formulation
The main problem for this report is
How can a company use its work area effectively in order to reduce production time while providing employee satisfaction?
1.4 Purpose
The purpose of the thesis is to apply suitable lean tools in order to reduce production time while keeping the satisfaction level high. Also, the tools of lean production will be used in order to reach the problem formulation. Another goal of this study is applying methods in an improved way, different than normal process. The purpose of this report is to determine the current state, identify problems, generate suggestions and consider the suitable tools of lean production and also is to measure the results by utilizing lean tools on the production time and employee satisfaction.
1.5 Relevance
In today’s competitive world paying attention to customer and making production regarding customer is a important beginning but when all the companies does the same, produce what customer wants, then the competition starts in area of production and the one who is better in quality, faster in delivery, cheaper and more agile wins the competition (Nicholas, 1998) So to be better in manufacturing area lean production is a way with its-easy to use-tools. Production time is one of the main factors to provide the objects which mentioned as before to achieve competitiveness. There are some useful tools in lean concept such as 5S and SMED in order to minimize production time. Implementation of 5S provides proper working area for employees and also makes it appropriate for changing dies. Effective use of work area affects implementing SMED in a good way because tools are available in a shorter time and production time is directly reduced with SMED. Also effective use of work area provides employee motivation and satisfaction. This study will purvey the readers a better understanding of lean concept and also it will help the companies to become leaner. This thesis will both help the readers and the companies to realize the difference after becoming lean by providing measures of improvement.
1.6 Limitations and Delimitations
One of the most important limitations for this thesis is time limit. When implementing 5S, SMED and also obtaining the conclusion derived from these implementations it needs more time to achieve. In addition, the behavior of employees can be a limitation for us because it is very hard for them to give up the idea of working system they used to. Besides, lack of communication between the authors and the employees because of their English knowledge may be a limitation. Moreover, the authors delimit themselves for the implementation area because it is not possible for us work for all the company and machines hence the focus will be in a small area in the company but the way of working can be applied for all the machines.

3
Also the authors should delimit themselves about measuring production time because the change of production time can be obvious after a while when the new system is standardized and will be giving the same results all the time.
1.7 Timeframe
The timeframe for thesis is given below.
V.14 V.15 V.16 V.17 V.18 V.19 V.20 V.21 V.22 V.23
Literature survey
Introduction
Methodology
Theory
Emprical findings
Analysis
Result
Conclusions
Hand in thesis
Presentation

4
2. Methodology
In this chapter a description of how to select and design the research methodology is presented, also the methodology for this thesis is presented at the end of the chapter.
2.1 Scientific Perspective
There are two main scientific perspectives called positivism and hermeneutics. These perspectives define the truth and explain the conclusion from the given and collected knowledge.
Positivism approach was developed by Auguste Comte in the middle of 19th century who is believed to be the first sociologist. This approach involves the development of theory before its empirical testing and for the positivist theory consists of three components which are (a) concepts or constructs, (b) propositions or statements linking these concepts together and (c) rules for connecting concepts with empirical world (measurement) (Brannick, 2007). Nowadays positivism has at least three meanings, it can be said as the commitment to social evolution regarding Comte or it can refer to an articulated philosophical tradition as logical positivism or it can be said as a set of scientific research practices as methodological positivism (Riley, 2007).
Hermeneutics approach was developed in 16th century in order to make interpretations from the bible. In hermeneutics tradition the researches enter the research area with no or a few prejudices and so that they can use the science of hermeneutics using its rules to make interpretations (Brannick, 2007). Hermeneutics approach is mostly used in psychology and health care area (Gadamer, 2001 5th).
2.2 Research Approaches
Induction, deduction and hypothetic-deductive that have been used for relating theory and empirical findings, are different types of research approaches (Rothchild, 2003).
”Induction is the formation of a generalization derived from examination of a set of particulars.” (Rothchild, 2003).The induction approach is objective of investigation gained without using existing theories (ibid).
The deduction approach is used for providing a method to construct a logical conclusion via the use of existing theory and facts. The approach was selected by authors due to existing theory which is used to generate starting part of this research (Bryman, 1989).
According to Graziano (2007), hypothetic-deductive which is a third approach consists of combination of both deduction and induction. Aim of hypothetic-deductive study is to find logical conclusion with using empirical observation.

5
2.3 Research Methods
Two main methods to conduct research are qualitative and quantitative methods. Qualitative method for research “is a situated activity that locates the observer in the world and it consists of a set of interpretive, material practices that makes the world visible” (Ritchie, 2003)Qualitative method doesn’t provide any measurements among the information and the form of information are words, diagrams and drawings and doesn’t contain any numbers but it is believed that qualitative methods can provide a better understanding of social phenomena(Silverman, 2005).Furthermore quantitative methods are research methods in which the information gathered is measurable. As a result of quantitative research; graphs, tables and other forms of statistics are gained which is formed by numbers or series of numbers (http://www.answers.com/topic/quantitative-research?cat=technology, 080407). Quantitative research identifies the measurement and analysis of causal relationships between variables, not processes (Silverman, 2005).
2.3.1 Data sources and data gathering
Collection of data is the process of defining different characteristics of the objects. According to Yin there are six important sources of information for case studies that are; documentation, archival records, interviews, direct observations, participant observations and physical artifacts (Yin, 2003). Figure 1 shows applicable tools and methods to collect data for a case study.
Figure1. The tools and methods to collect data (Yin, 2003)
There are lots of written materials such as journals, books, brochure etc. are considered when applying the literature studies. The literature studies are easy and cheap way to gather information in a short time (Yin, 2003).
Interview is the most important sources of information when implementing a case study. The interview that can be implemented with different ways consists of guided conversation rather than structured inquiry. When implementing the interviews, the questions should be asked

6
“friendly” and “non-threatening” so as to provide a relaxed atmosphere for informant. Most commonly, the reason for interview unreserved is that the respondent will be asked about facts. The investigator, when proving information, should abstain to ask leading questions (Yin, 2003).
In participant-observation, the observer has a role that means the observer attends in the event being studied. This method has an advantage that is; the observer can realize some realities while attending study more than external observer but it has also a disadvantage that causes some difficulties for observer not to perform well-observation and take notes from different perspectives (Yin 2003).
Questionnaire consists of some items and these are questions (mostly) and answers. There can be statements instead of questions which requires response from the target audience and the answers are formed from some fixed set of alternatives in which the audience should made a choice. The important thing about questionnaire is to know how to categorize the answers before asking the questions otherwise it will cause problems for the researchers (Robson, 2007).
2.4 Results Evaluation
Quality of the research is very important and it is a requirement to show the readers that the study was reliable and the results were valid. So the validity, reliability and generalization of the results must be appropriate and the study should pass the tests of validity and reliability (Silverman, 2005).
2.4.1 Validity
Validity concept has so many descriptions in qualitative research studies. Validity questions if your research is explaining or measuring what you said you would be explaining or measuring. In other words, “validity pertains to the extent of a method investigates what it is intended to investigate” (Kvale, 1989). Validity can be used as another word for truth because it refers to the correctness or precision of the research. A research can be reliable without being valid but the opposite is not possible (Robson, 2007).
There are some different ways to validate or verify data and it is mainly divided into two areas as internal and external validity. “Internal validity deals with how research findings match reality” (Merriam, 1998). Like cause and effect studies, clinical studies and also experiments should be internally valid. There are two methods to ensure internal validity and they are, constant comparative method and deviant case analysis (Ritchie, 2003). External validity however, deals with applying the findings of one study for other situations. It is about generalizing the results for other situations. Triangulation is the method for achieving external validation and it is defined as the attempt to get a “true” on a situation by combining different findings. By triangulation the use of different sources of information will help to ensure the precision of the research study (Ritchie, 2003 and Silverman, 2005).
7
2.4.2 Reliability
Reliability can be understood as the replicability of the research study as it would be repeated by another study which uses the same or similar methods and topic. The study will be acceded as reliable if the measurements are fulfilled properly. Reliability mostly used for testing quantitative research but it is a concern for every research methods (Ritchie, 2003). With reliability test the aim is to minimize the errors (Yin, 2003)
2.4.3 Generalization of Results
Generalization is often linked into two different types which are empirical and theoretical generalization but there is some confusion in the understanding of empirical generalization when it implicates two different ways for detecting inference. According to Ritchie (2003) itis good to categorize generalization in three areas called theoretical, inferential and representational generalization. Theoretical generalization means exposing theoretical propositions, statements or principles from the research study to a more general situation. Inferential generalization however means, generalizing from the context of the research findings to other settings or context. Representational generalization means, generalizing to a parent population in which there is a sample chosen, from the research findings (Ritchie, 2003).
2.5 Thesis Research Methods
This report will be utilizing a positivistic perspective. Positivistic approach will be used while proving the literature survey while performing the implementations of 5S and SMED. Also the current state of the company will be analyzed deeply using existing theories in order to lead us to find new opinions. However hermeneutics approach will not be used for this study because it is not our goal to understand the in-depth reasons for unsatisfied employees and its effects on production time but to find means to increase employee satisfaction while reducing production time.
In this report deduction approach will be utilized. Deduction approach will be used for literature survey, analysis, questionnaires and suggestion to solve the problems. We are deductive for this report because we will be doing the things that are known before and main goal is to test the results for those things.
The report is a case study thus this report is within the qualitative area. But for data gathering both qualitative and quantitative methods is going to be used. Interviews, participant observations, questionnaires, literature surveys such as books, articles and journals are used to gather information.
Validity and reliability analysis will be used to prove the quality of this report. To provide data reliability different sources will be used as mentioned before. Also the report will become reliable if it can be done once more while the results are same this will be achieved by having every step of thesis clear and applicable for all researchers. The help from

8
colleagues and experts will be useful for this report to achieve reliability too, meeting with tutor and colleagues will provide reliability. To prove validity of the report the measures are based on theory and triangulation is used.

9
3. Theory
In this chapter the literature which has been used in this thesis is reviewed. The presented theories are used as a foundation for developing the conclusions and recommendations which have been the result for the thesis.
3.1 Lean Production
Lean concept was first born in Toyota in 1950’s and it was introduced as Toyota Production System (TPS). TPS had grown with Taichi Ohno’s own experiments and initiatives within the Toyota Motor Company. TPS was formally introduced to USA in 1984 when General Motors and Toyota had a joint venture with the name NUMMI but it was informally affecting US much earlier. The term lean production was labeled in the book “The machine that changed the world” and had a huge effect on manufacturers. Lean production can be defined as an integrated socio-technical system whose main goal is to eliminate waste by simultaneously reducing supplier, customer and internal variability (Shah, 2007).
TPS can be understood more easily with the help of three M’s which are muda, muri and mura. Muda means waste in Japanese and it contains the activities which don’t add any value to the product like unnecessary movements, high inventory, and high waiting time. Muri means forcing human or machine beyond its ability to handle. Forcing human causes quality and safety problems while forcing machines causes breakdowns. Furthermore mura means disorderliness and it occurs because of first two M’s (Liker, 2004) Lean concept focuses on waste reduction and Toyota has defined seven types of wastes. These are;
Waste from producing defects
Waste in transportation
Waste from inventory
Waste from overproduction
Waste of waiting time
Waste in processing
Waste of motion
Defects in products can be realized before sending to the customer but it is a wasteful process to detect and fix it. Besides when the defects are realized after the products are sent to the customer it also causes losses in existing and potential customers. The main goal to eliminate this waste is “doing right at the first time”. In all organizations, items (people, semi finished goods, parts,..) move from several stages in order to fill production but most of the time these movements are unnecessary and can be reduced with small changes in facility layout and operation sequences . Furthermore, inventory is called the root of all evil by Toyota because inventory means keeping items while they are waiting for something to happen and this never adds any value to the items and it causes loss in time, money and space. The other waste overproduction happens because of poor management because it is easier to make decisions when there are enough inventories to rely on. The other reason for overproduction is

10
achieving high level resource utilization by running the facility continuously. Waiting, as a waste, is easier to identify because it is obvious when one has to wait for parts, orders, items, materials, etc but the solution for this waste cannot be keeping workers and machines busy (in work) all the time because then it becomes a worse waste, overproduction. Waste in processing contains the steps which are unnecessary and can be removed from the process steps. Waste of motion is the unnecessary motion of the worker and the motion which doesn’t add any value to the product (Nicholas, 1998).
The purpose of lean production is producing the products which satisfies the demand from the customer with the minimum effort (like personnel, equipment, time, space, etc) while keeping them in a good condition of quality, function and price and sending them just at the right time for the customer. Therefore the focus within production should be on the valueadded times (Kulaç, 2003).
The tools of lean production can be said as;
Jidoka
5S
Poka-yoke
TPM
Heijunka
Milk-run
Value Mapping
Benchmarking
Risk management
SMED
Kanban
Single flow
Kaizen
In the following, three of these tools are presented in more depth.
3.2 Continues Improvement-Kaizen
Kaizen is the Japanese term for continual improvement through small, incremental changes made one at a time. The improvements are better when they are made without spending much money and covered by both managers and workers. Of course there are limits for theseimprovement potential by resources, physical or natural laws (Nicholas, 1998).
According to Nicholas there are two kinds of improvements and these are incremental and innovation improvements. Figure 2 illustrates both of them shown below. Incremental improvements are like an S curve and it shows the relationship between the effort (resources) to improve something and the result of that effort. At the point where the S curve starts to slow down there should be a jump to a new S curve and this is where the innovation improvements starts. Therefore continues improvement should be seen as a total view over

11
production. Small changes can be seen as one S curve and when it is done there should be a new and higher level of goals and there should be a jump to it.
Resources Resources
Perf
orm
ance Sy
stem
Impr
ovem
ent
Perf
orm
ance
Impr
ovem
ent
Figure2. Incremental and Innovation Improvement (Nicholas, 1998)
Several methodologies have been developed to achieve continues improvement. PDCA cycle, five why process, value analysis are all methodologies for continues improvement.
PDCA stands for plan, do, check and act and PDCA cycle is a way to apply continues cycle of perceiving and thinking. Actually, for continues improvement it is better to see production as a continuous cycle where there is no start or finish but while applying PDCA it is good to start with the plan step. Planning requires collection of data and definition of the problems considering the collected data. Also the goals for improvement and the solution of the problem should be planned at this step of the cycle. When implementations of the plans take place, it can be called as the do step of the cycle. After the plans are implemented than the new data is collected and it is checked in order to understand the success in reaching the goals. In the final step, act, the actions are taken based upon the results from the check step. This is a continuous process and never ends because as stated by Shigeo Shingo improvements require a continuous cycle (Nicholas, 1998).
3.3 5S
The 5s is very crucial method lean method and it is like a cornerstone to apply for other lean tools as well. It is such a philosophy to increase efficiency by eliminating waste and improving speedy work flow. The name 5s comes from the first letter of the five Japanese words start with S:”Seiri, Seiton, Seison, Seiketsu and Shitsuke” (Sekine, 1998).
Basically, 5s is the method for organizing case place and keeping it organized. This discipline requires eliminating things which are not needed so as to create better flow in order to get the goods needed. Creating better work environment is another most vital benefit of 5s like many others. Respectively, speedy work flow, easy access, better controlling, and easy identification of quality problems can be ordered as the benefits. 5S used with other Lean tools such as TPM and JIT also (Sekine, 1998).

12
According to Sekine (1998) 5S is a discipline and the first 2S’s are the most important ones because after a 5S implementation if those 2 steps are neglected, the look in work area will not be better than the situation before. To be successful with the implementation there are three points to be followed. First and foremost top management should be aware of what 5S isand should be acting to achieve 5S. Second, it is important to provide a system which reviews how well the activities are performed and which fosters repetition of those activities. And last point is to have a motivation system in order to keep everyone aware of results of the efforts, it is important to give people what they actually deserve. 5S discipline can be explained with the figure 3 below.
Figure3. 5S discipline (Sekine,1998)
1. Organization: Organizing the work place by identifying unneeded items and removing them2. Orderliness: Laying out necessary items so that they are easy to use and labeling them so everyone can see where to find and put them.3. Cleanliness: Performing a thorough cleaning and inspection of everything in workplace(Sekine,1998). An important part of “shining” is “Mess Prevention.(http://www.deu.edu.tr/userweb/uzeyme.dogan/dosyalar/5s_poka_yoke_tpm_ppt_doc.pdf).4. Standardized Cleanup: Maintaining the first three S’s (Sekine, 1998). To standardize three steps need to be followed; observe, define problems and define control points (http://www.deu.edu.tr/userweb/uzeyme.dogan/dosyalar/5s_poka_yoke_tpm_ppt_doc.pdf).5. Discipline: Following standards and educating everyone to make 5S a habit so that people follow without being told (Sekine, 1998).
Implementation of 5S is beneficial for companies. Warwood (2004) lists the benefits of 5S as following,
Waste reduction
Pollution prevention
Improved staff involvement
Better health and safety standards
1st
2nd S
3rd S
4th S
5th S

13
Less environmental risks
Better housekeeping
Safer storage of materials
Fast retrieval of itemsAlso lack of 5S influences the system and it causes, low morale and low incentive on employees and 5S implementation increases the level of morale and incentive of employees. (Warwood, 2004)
3.4 Setup Time
Setup time is “the time spent in preparation to do a job” (Nicholas, 1998). In production area, setup has a more detailed definition as the time passed between the last good product and the first good product. Setup time consist of the preparation time and includes replacements, adjustments and attachments to and on a machine. In a big fraction of the setup time the machine doesn’t run and doesn’t produce. When the machine starts running it is still considered as setup time until the first good output is gained. During this ineffective time the outputs are scraps or require rework (Nicholas, 1998).
Traditional way of dealing with setups are using skilled workers for setup, using large lots in production, not having different type of products and combining different jobs with similar setup requirements but when the focus is on reducing setup time there are lots of benefits from it. Reducing setup time provides; better quality because the chance of making mistakes are less when the workload is less on worker while changing the dies, reduced costs because it allows to use small batches thus it reduces work-in-process (inventory level in process) and finished product inventory, better flexibility because small lot sizes are feasible and this makes daily demand changes possible, worker utilization because when the setups become more easy there is no need to have specialized workers for setups and operators can be possible for setups thus the utilization happens, capacity optimization (reducing setup time increase the capacity), process variability because each setup includes process with several steps and the time spent will be less for each step (Nicholas, 1998).
There are common setup steps for almost every industry and there are four steps for it;
Retrieving, preparing and checking materials and tools before the setup. Checking the work area and machine before the study.
After the last output, removing the tools out from the machine and changing them with the new ones.
Measuring, setting and calibrating the machine for the right position to perform the task.
Producing the test parts and measuring them in order to calibrate the machine properly and continuing this step until the good output is gained. (Nicholas, 1998)

14
3.4.1 Single Minute Exchange of Die (SMED)
SMED is a lean tool to reduce setup time which first introduced by Shingo. It is an approach to purvey quick set-ups of machines. According to SMED Machine set-up is of two kinds;
Internal Set-up
External Set-up
Internal set-up is the activities which can only be done when the machines stop. However external set-up activities can be done while machines are running. The aim is to be able to do activities while machine is in operation thus the idle time of the machines will be reduced(Moxham, 2001). With the figure 4, it is understood that eliminating internal activities as much as possible will reduce the setup time, the time when the machine is not running.
Figure4. Set-up Time
(http://www.onlinekalite.com/htmdosyalar/jitsetupsmed.htm, 080513)
SMED is a four stage methodology to reduce setup times. First stage is identifying internal and external steps of a setup. Since there can’t be any change on labor work time the focus should be on internal time because in companies every step of setup supposed to be internal but actually it is not. There could be some works to do while the machine is running like bringing the tools close to machine within its run time. This step requires deep observations and also videotaping of the operation and stopwatch analysis as well as interviews with workers. The second stage is converting internal steps to external. To achieve this goal all internal setup steps should be examined deeply to reclassify them as external steps if possible. When the internal steps are defined as external, stage three requires improvement of all aspects of the setup. The last stage of SMED is abolishing setup while removing unnecessary movements out from the setup process also this step contains the standardization of setup process (Nicholas, 1998).
The inventor of SMED, Shingo, states that “SMED can be applied in any factory to any machine.” So it is way of being more lean and cost effective. The aims of SMED can be the
Last Good “A” First Good “B”
SET-UP TIME

15
optimization of machine usage time, reducing the idle time of the machines, having the ability to do more than one task at the same time while changing dies. Most importantly SMED gives the chance to produce small batches thus the way of production will be similar to JIT. One machine can be used for many types of products with a little loss of time (Moxham, 2001).
3.5 The Effect of Work Area Arrangement on Employee
Work arrangement involves both internal and external physical conditions of a workshop. In other words, the workshop cleanliness, the used devices and tools arrangement, air condition, enlightenment, noise level are some of the examples which form the work area arrangement. The satisfaction, performance and motivation level of employees can be affected in a positive way with a well-organized work area. Cleanliness of workshop and devices (machines, tools) affect the satisfaction and motivation of employees in a positive way and also with cleanliness of workshop, employees show more interest and mind in work. As a result of increased motivation, satisfaction and performance, efficiency and productivity will increase (Camkurt, 2007).

16
4. Empirical Findings
In this chapter, a description of the case company, the production process is presented. Also the chapter contains data gathered from the questionnaire.
4.1 Presentation of Swepart Transmission AB
Swepart Transmission AB is a manufacturer of customer unique gearboxes, precision grounded gear wheels, and other transmission-parts for heavy duty vehicles and industries. In cooperation with their customers, they take overall responsibility for design, engineering, and manufacturing of transmission components and solutions. Swepart Transmission AB has been owned by Hexagon, which is a global technology group with strong market positions within measurement technologies and polymers, since 1996. The group of Hexagon has about 10,000 employees in 30 countries and net sales of about 14,600 MSEK. Hexagon’sheadquarters is located in Stockholm.
After Swepart participated with Hexagon, the company has made significant improvements regarding its business structure. The company most competitive advantages are mapping and understanding the requirements of its internal and external customers as well as developing and continuously improving the company’s processes. New improvements aim to boost investments, to employee well-educated employees, etc. Thereupon, the company made a deal with Scania and took over their production of cogwheels in Sibbhult. They are working with 70 employees since 2006.
Swepart Transmission AB’s business idea is that with high competence and with cost effectiveness be the leading company that produces transmissions with specialties on:
Construction, production and assemble of costumed gears.
Construction and production of technical advanced cog and spinning wheels. (Swepart Presentation)
Swepart has a good organization system in which there are different responsible for plant, technology, quality sales and purchases. One general manager is the authority for all responsible employees but quality responsible is also controlling the other responsible. Themain importance of Swepart is quality so they give more responsibilities to quality managers. Swepart’s organizational structure could be described as a combination of matrix and process structure. There is a top structure which is hierarchical, and then underneath there is a matrix structure which is divided into product workshops where each of them are partly depended on each other. The organization scheme of Swepart can be found with figure 5 below (Swepart Presentation).

17
Figure 5.Organization Schema (ibid)
4.2 Presentation of Swepart Transmission AB Liatorp
Liatorp plant is Swepart’s main factory, with 215 employees. Turnover of Swepart Liatorp was 302 MSEK in the year of 2007 and this turnover was apportioned in customers according to the table1. (Swepart Presentation)
Volvo Powertrain 36%
Scania 24%
Komatsu 12%
Volvo Construction Equipment 10%
Volvo Penta 7%
ABB 6%
Others 5%
Table1. Turnover (ibid)
Swepart Liatorp has been growing much recently. Turnover rates and employee numbers have increased which tells us how they grow. Table2 which is given below shows the turnovers, investments and employee numbers for last six years. (ibid)
Economic Figure 2002 2003 2004 2005 2006 2007
Turnover (MSEK) 124 131 180 211 205 302
Investments (MSEK) 40 5 30 26 7 50
Number of Employees 101 93 102 113 114 210
Table2. Turnovers, investments and employee numbers for last six years(ibid)
Liatorp is divided in five product or production workshop workshops by colors. Every workshop is independent and has its own division for logistics, material handling and flow,

18
development, quality etc, and is responsible for its own products. There are 15 different production groups with robots and the plant works with 3shifts a day continuing production at the weekends too. Achieving quality goals is important for the company and they are certified according to ISO9001:2000, ISO TS16949, ISO9000 and ISO14001. Also for some specialproducts, high sensitive measurement tools are used. (ibid)
Products for Swepart Liatorp are, ground gear wheels 40-500mm, spline shafts, assembly and function control of gearboxes and also special products. The products are illustrated in appendix 2. (ibid)
4.3 Swepart Transmission Production Process
The production of process In Swepart consists of six steps which is described deeply in the following.
Step 1 – In this step, first the round plates are came from the suppliers and are turned. After they are turned, quality managers control every twenty-fifth gearwheel so as to provide high-quality gearwheels. If quality of gearwheels is met, gearwheels are brought to debarring process. Otherwise, production in related station stops and the main reasons that cause imperfection outputs are investigated. In the debarring process, burred-sound tests are applied so as to find imperfection on gearwheel and then Raw material (Iron forge) which Swepart utilize in their production is load into the machine by the quality manager.
Step 2 – The second step is Gear hobbling, in this step, Iron forge is cut and framed by the machine with the cooling liquid which is used in order to cool the temperatures of products during the production process.
Step 3 – Production is case hardening process, which is performed by another company. In this step, gearwheel’s quality is tested after case hardening. If there is an undesired condition, Swepart notifies the supplier that hardens gearwheel’s case
Step 4 – This step includes the burning of the ironing forges. It is heated until a specific degree so as to be hard bitten.
Step 5 – Cut pieces of iron forge are washed off.
Step 6 – The finished product is taken and sealed with a serial number by the product. After that if the products meet the production specification the products are measured manually and those processes are done automatically.

19
The production process of Swepart is illustrated with the figure 6.
Figure6. Production Process of Swepart
4.4 Sub Processes
In Swepart, the processes are divided the different colors workshop that are Red workshop, Blue workshop, Green workshop, Yellow workshop, White workshop.
• Red WorkshopTurning and hobbling process of the production are implemented in this area. Products of this are which are light and small in measurement.
• Blue WorkshopHeavy and big in size products are brought here for apply the operations of turning.
• Green WorkshopThe products which is came from red workshop are rough. Therefore, the products must be grinded by the grinding machine so as to provide smooth surface product.In green workshop the part almost gets its last frame.
• Yellow WorkshopIn this area of the plant, both for some other operations like small corrections on products with some gadgets and tools especially more depend on manpower than robot machines and it is also a supporting area for the green workshop.
• White workshopIf small amount of one product is needed to produce, this workshop will be utilized. Alsosome prototypes are created in this workshop.

20
4.5 5S in Swepart
The idea of implementing 5S in Swepart was founded one year ago so as to prevent disorderliness and mass in production area and to be able to use it as efficient as possible. Red group is the key area for Swepart since the most expensive and important machines/robots are in red group; therefore implementation of 5S was first started in red group. After implementing 5S significant changes occurred. The order in workshops, the way of applying setup, motivation of employees and many things are affected in a positive way via 5S. To benefit from all these effects for whole groups, the company still tries to improve every other group with implementing 5S.
4.6 Current Status of Yellow Group
There are several products that are produced at this area of the plant by S40 machine which is the most used grinding machine in this group, but yellow group is not so organized like the other groups. There is not any cell or flow production in this area and single machines does the task needed. Some of the machines in yellow group are old and cause a lot of problems. And since there is not obvious flow for single machines there are some chaoses when the details are being transported. Improvements are not implemented to this group yet which causes a lot of problems. Yellow area can be seen in appendix 4.
4.6.1 Description of Setup for S40 Machine
The production plan for the S40 machine is changing often since several products should be produced with this machine. Setups should be applied in order to produce different products so it is obvious that setups are applied often by the company.
The setup steps are not exactly the same for every product. Calibrating the machine from one specific product to other product requires some special steps or maybe it is not needed at all, but setups are similar to each other in general and it differs in small areas. General setup steps’ information which is mentioned below for S40 machine is gained from the interview with the operator of S40 machine. Pictures of S40 can be seen in appendix 5
Setup starts with stopping the machine after the last good product is produced. In accordance with the new production plan, needed tools are provided to the setup area by the employee.This step is done either during the machine stops or during running time. After everything is ready for the setup, the clamps are changed or set inside the machine. Later on when the settings are done within the machine the program is selected for new details of the product. Before the setup is finished machine is tested for the new first piece and then the new first piece is measured for each product by the employee except the specific product, for specific product, the first piece is sent to the quality department so as to measure with the qualitymachine The employee has to wait for the acceptance from the quality department and when the new settings are accepted by quality department and the fixtures are changed for each piece as the last step before starting production. At the same time tools are taken back to their places after cleaning.

21
4.6.2 Setup Steps of S40 Machine
S40 machine is in yellow group that we mentioned before. Table3 shows the setup of S40 and includes the setup step by step and time of each step.
Setup Steps of S40 Machine Times For Setup
1 Provide the needed tools Not Defined
2 Change the clamps and little things at the setting 45-60 min
3 Set the measure 5 min
4 Select the program for each product 1 min
5 Calibrating the Dubbs 30min
6 Control the “Dubb” 1 min
7 Set the slot for dubbdocks 1 min
8 Change the Z number at the program which is numbered 07960 inside of the machine
1 min
9 Test the portal of program 1 min
10 Control the disc so as to provide correct disc for machine 1 min
11 Change the details which is inside of the machine 30 sec
12 Set the length position 30 sec
13 Control the program/Hide the picto or advance it. 1 min
14 Practice with the new details 60 min
15 Set the measure management 30 sec
16 Hide the picto or advance it again. 1 min
17 Change the program with the current one. 30 sec

22
18 Set the fixture for product 30 min
19 Cleaned the tools and take them back to place. Not defined
Table3. Setup Steps of S40 Machine
4.7 How Swepart Assesses Production Time
Swepart Company calculates the production time which is indicated below.
Production time = (Amount * cycle time)/ 3600 + setup time)
(3600 is sec for changing sec to hour)
For three example products the production time is calculated with using the data from table4.
For product coded 11030234-2 production time is:
(1000* 66) /3600 + 3) = 21.33 hour
For product coded 1667973 production time is:
(1000*31)/3600+ 3) = 11.61 hour
For product coded 1673819 production time is:
(1000*75)/3600+3) = 23.83 hour
This formula shows that when the setup time is reduced the production time will be reduced automatically.
4.7.1 Production Time of S40 Machine
As we mentioned before in yellow group, lots of different items are produced. Examples of products are included with amount of product, the cycle time, setup time, production time in table 5;

23
Product Code Name Of Product Amount Cycle time Setup time P. Time
11030234-2 RUNDSLIPAT KUGGHJUL 1000 66 sec 3 h 21.33
1111885-1 RUNDSLIPAT KUGGHJUL 1000 41 sec 3 h 14.38
C0250-221-1 RUNDSLIPAD AXEL 1000 52 sec 3 h 17.44
11194467 MELLANAXEL 1000 58 sec 3 h 19.11
C0250-221-1 RUNDSLIPAT KUGGHJUL 1000 66 sec 3 h 21.33
1667973 FLANS 1000 31 sec 3 h 11.61
1673819 AXEL, INGAENDE 1000 75 sec 3 h 23.83
1668987-1 SLIPAD AXEL 1000 50 sec 3 h 16.88
Table4. Amount of product, the cycle time, setup time and production time
4.8 Employee Satisfaction
In accordance with problem formulation, our goal is to provide employee satisfaction while reducing the production time. Therefore the effect of working area on employee satisfaction is focused by the authors since it is believed that work area can both affect satisfaction and production. The questionnaire is applied for the employees in SwePart in order to evaluate the effect of work area on employees’ satisfaction, motivation and performance. The authors selected yellow area to apply questionnaire and it was applied for 40 employees. The questions were asked intended for understanding the general situation of company and the questionnaire includes six questions. Questionnaire is given with the appendix 1. Questions and the answers are shown by graphs, given below.

24
1- In which grade does your working area arrangement affect your performance in a positive way?
47%
40%
13% 0%0%
Very much
Much
Normal
Few
Any
Graph 1.The effect of working area arrangement on performance.
47 % of the employees have given the answer “Very much”, 40% of the employees havegiven the answer “much” and 13% of the employees have given the answer “Normal”.
2- In which grade, does your organized working areas increase your motivation?
47%
40%
13% 0%0%
Very much
Much
Normal
Few
Any
Graph2. Increase in Motivation.
47% of the employees have given the answer “Very much”, 40% of the employees have giventhe answer “much” and 13% of the employees have given the answer “Normal”.

25
3- In which grade, does your messy working area complicate your job?
50%
29%
7%
7%7%
Very much
Much
Normal
Few
Any
Graph3. The effect of messy working area on job
50% of the employees have given the answer “Very much”, 40% of the employees have giventhe answer “much” and 13% of the employees have given the answer “Normal”.
4- In which grade, does your messy working area dissatisfy you?
36%
43%
14%
7% 0%
Very much
Much
Normal
Few
Any
Graph4. The effect of messy working area on employee satisfaction
For this question, 43% of employees have given answer “Much”, 36% of the employees havegiven answer “Very Much”, 14% of the employee have given answer “Normal”.

26
5- In which grade, does your messy working area complicate to find the needed tools and equipments?
40%
33%
20%
0% 7%
Very much
Much
Normal
Few
Any
Graph5. The effect of working area to find the needed tools hardly
For this question, 40% of employees have given answer “Very Much”, 33% of the employees have given answer “Much”, 20% of the employees have given answer “Normal”.
6- In which grade, is it important to have needed tools and equipments in defined places?
54%33%
13% 0%0%
Very much
Much
Normal
Few
Any
Graph6. Defined place for tools and equipments
%54 of employee has given answer “Very Much”, %33 of the employee has given answer “Much”, % 13 of the employee has given answer “Normal”.

27
5. Analysis
In this chapter the analysis are performed regarding both the empirical information and the literature.
5.1 Employee Satisfaction
A questionnaire was applied to Swepart so as to evaluate the effect of work area on employees as we mentioned before. In accordance with the data from the questionnaire majority of employees (%47+%40) in Swepart thinks that work area arrangement affects their performance very much in a positive way. Rest of the employees which form %13 of the portion thinks work area arrangement affects their performance normally. These results indicate that performance of the employees can be increased when work area is organized and this will help the employees to do their job in a better way which will provide benefits for the company as the theory says (see section 3.5).
For the second question, the same percentages are valid as for question 1 which means that majority of employees thinks that it will increase their motivation to have an organized work area. The benefits for increased motivation will be the same as the effect of performance.
Third question evaluates the effect of messy working area on job and how it complicates the job for employees. %50 of the employees thinks that a messy working area makes their job very difficult for them and %29 of the employees considers as it is harder to do their job in a messy work area. In question five related to disorganization, the question “In which grade the messy work area causes difficulty to find the needed tools and equipments” is asked. The majority of employee answered “much” or “very much”. As shown in the theory, motivation and performance of employee are affected therefore it is obvious that productivity will be affected too (see section 3.5). Low level of motivation and performance will cause inefficiency.
With question four, employee satisfaction is measured. The employees are asked about their satisfaction level in a disorganized work area. %36 of them reply the question “very much” which means that the employees are effected with the organization in work area and %43 of the employees gave the answer “much” so a total of %79 of employees become dissatisfied in a messy work place.
As our goal is to provide employee satisfaction, with the help of this questionnaire and theoryit is found that organizing work area will satisfy employees so the authors will focus on arranging work area. Evaluating the answers from the sixth question it seems to be important to have defined places for the tools so with the effect of the answers from both questions 5S will be a useful method to arrange the area for employee satisfaction on the other hand 5S will be beneficial for starting SMED which is the way to reduce production time.

28
5.2 Implementation of 5S in yellow group
The employees are affected by the working area arrangement. Organized working area provides rising in performance and motivation of employee and also the employees are delighted when they are working in proper area as the theory says (see section 3.5).
When beginning our work in yellow group tools were messy and difficult to be found so this situation caused dissatisfaction of the employees. Pictures 1, 2 and 3 illustrate the situationbefore applying 5S for this area. The steps are followed in accordance the theory given in section 3.3 while applying 5S to yellow group.
Picture1.Messy Tools Picture2.Messy Tools
Picture 1-3. Before 5S
1- Sort:The first stage of 5S is to organize the work area, leaving only the tools and materials necessary to perform daily activities. Hereby the questions were asked to the employee so as to define which tools are often used and which tools are not then in accordance the frequency

29
of usage, they were classified into three categories such as most needed, needed and not needed. Picture 4 illustrates the sorting process.
Picture4. Classifying the tools
2- Straighten:At this step, the categorized tools are placed in proper area so as to make it easy to find. The most needed tools were hung out and also labeled with appropriate names on the board. Needed tools were put into drawers and not needed tools were defined in the work area. A visual explanation can be seen in pictures 5 and 6.
Picture5.Needed tools Picture6. The most needed tools
Picture 5-6. After 5S
30
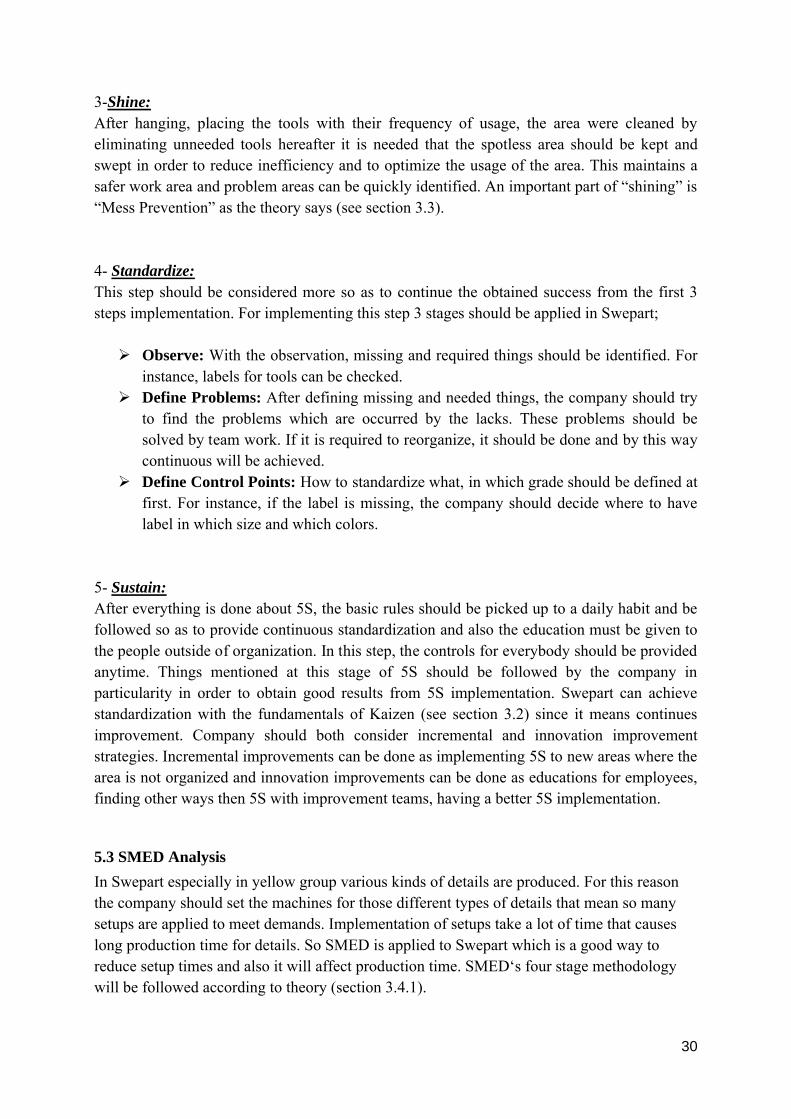
3-Shine:After hanging, placing the tools with their frequency of usage, the area were cleaned by eliminating unneeded tools hereafter it is needed that the spotless area should be kept and swept in order to reduce inefficiency and to optimize the usage of the area. This maintains a safer work area and problem areas can be quickly identified. An important part of “shining” is “Mess Prevention” as the theory says (see section 3.3).
4- Standardize:This step should be considered more so as to continue the obtained success from the first 3 steps implementation. For implementing this step 3 stages should be applied in Swepart;
Observe: With the observation, missing and required things should be identified. For instance, labels for tools can be checked.
Define Problems: After defining missing and needed things, the company should try to find the problems which are occurred by the lacks. These problems should be solved by team work. If it is required to reorganize, it should be done and by this way continuous will be achieved.
Define Control Points: How to standardize what, in which grade should be defined at first. For instance, if the label is missing, the company should decide where to have label in which size and which colors.
5- Sustain:After everything is done about 5S, the basic rules should be picked up to a daily habit and be followed so as to provide continuous standardization and also the education must be given to the people outside of organization. In this step, the controls for everybody should be provided anytime. Things mentioned at this stage of 5S should be followed by the company in particularity in order to obtain good results from 5S implementation. Swepart can achieve standardization with the fundamentals of Kaizen (see section 3.2) since it means continues improvement. Company should both consider incremental and innovation improvement strategies. Incremental improvements can be done as implementing 5S to new areas where the area is not organized and innovation improvements can be done as educations for employees, finding other ways then 5S with improvement teams, having a better 5S implementation.
5.3 SMED Analysis
In Swepart especially in yellow group various kinds of details are produced. For this reason the company should set the machines for those different types of details that mean so many setups are applied to meet demands. Implementation of setups take a lot of time that causes long production time for details. So SMED is applied to Swepart which is a good way to reduce setup times and also it will affect production time. SMED‘s four stage methodology will be followed according to theory (section 3.4.1).

31
SMED’s stages;
Identifying External and Internal Setups: This stage of the methodology requires the listing of setup steps and classification of setups as internal and external. Checklist which will be existed the nearest place possible to the machine is prepared. The list of setup steps which was put before in empirical findings chapter will be categorized as internal and external, which is shown with table 5;
Setup Steps of S40 Machine Time Classification of Steps
1 Provide the needed tools Not Defined External Setup
2 Change the clamps and little things at the setting 45-60 min Internal Setup
3 Set the measure 5 min Internal Setup
4 Select the program for each product 1 min Internal Setup
5 Calibrating the Dubbs 30min Internal Setup
6 Control the “Dubb” 1 min Internal Setup
7 Set the slot for dubbdocks 1 min Internal Setup
8 Change the Z number at the program which is numbered 07960 inside of the machine
1 min Internal Setup
9 Test the portal of program 1 min Internal Setup
10 Control the disc so as to provide correct disc for machine
1 min Internal Setup
11 Change the details which is inside of the machine 30 sec Internal Setup
12 Set the length position 30 sec Internal Setup
13 Control the program/Hide the picto or advance it. 1 min Internal Setup
14 Practice with the new details 60 min Internal Setup
15 Set the measure management 30 sec Internal Setup
32
16 Hide the picto or advance it again. 1 min Internal Setup
17 Change the program with the current one. 30 sec Internal Setup
18 Set the fixture for product 30 min Internal Setup
19 Cleaned the tools and take them back to place. Not defined
External Setup
Table5. The list of setup steps (internal and external setup steps)
While identifying the setup steps as internal and external, interviews were made with the operator of S40 machine. Videotaping and stop watch analysis couldn’t be performed since there were no setups implemented during the study when the authors were in the factory but some setup steps were observed with the help of operator.
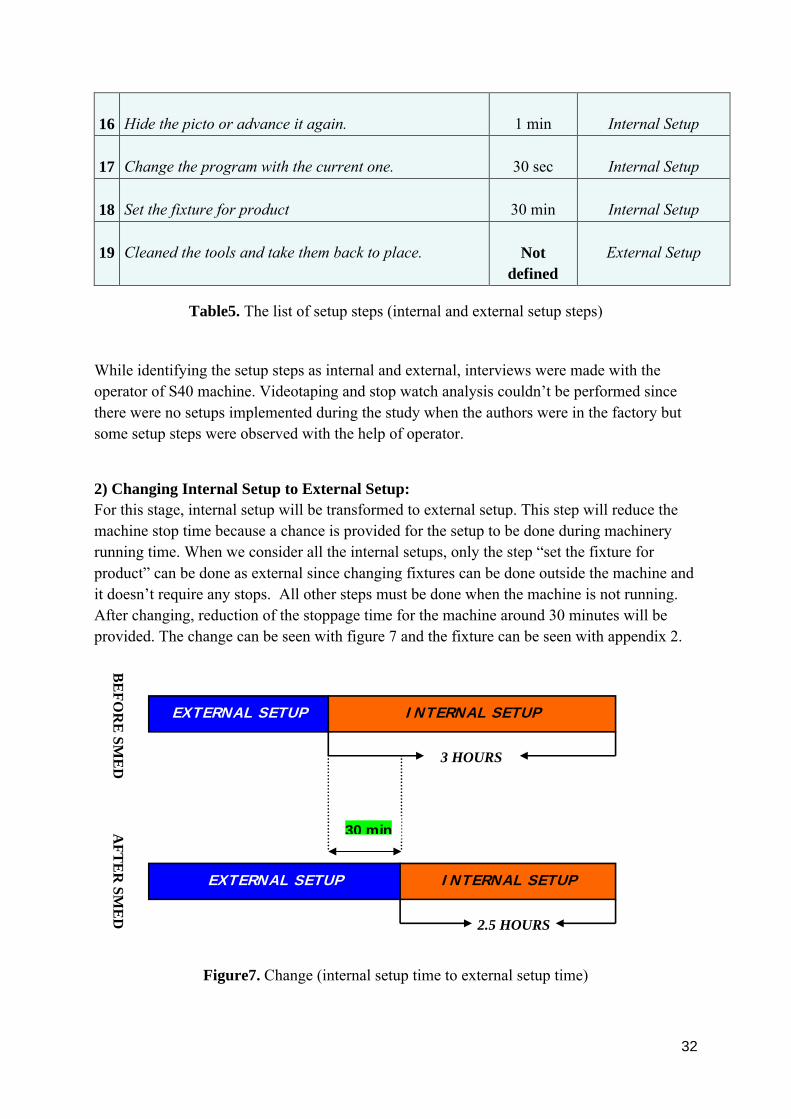
2) Changing Internal Setup to External Setup:For this stage, internal setup will be transformed to external setup. This step will reduce the machine stop time because a chance is provided for the setup to be done during machineryrunning time. When we consider all the internal setups, only the step “set the fixture for product” can be done as external since changing fixtures can be done outside the machine and it doesn’t require any stops. All other steps must be done when the machine is not running. After changing, reduction of the stoppage time for the machine around 30 minutes will be provided. The change can be seen with figure 7 and the fixture can be seen with appendix 2.
Figure7. Change (internal setup time to external setup time)
EXTERNAL SETUP INTERNAL SETUP
BE
FO
RE
SM
ED
EXTERNAL SETUP INTERNAL SETUP
AF
TE
R S
ME
D
3 HOURS
2.5 HOURS
30 min

33
3) Reducing Setup’s Step TimeIn this stage, the goal is to reduce the time that is spent for each step of setup. The work area and the tools should be organized, everything needed should be visible, unnecessary and useless tools, devices should not exist in the setup area. With 5S, implemented to Swepart, the needed tools for setup are placed in defined order, the area will be spotless and everything that is needed will be reached easily so it is a good way to reduce the time for finding the needed tools that is the first step for setup.
4) Optimizing Setup Process Finally, if there are any chances to make some setups steps at the same time, one more employee will be used to make these steps simultaneously since the important thing is finish the setup as early as possible so as to start production promptly. In yellow group for S40 machine, the step calibrating the Dubbs can be done simultaneously with the other step; Change the clamps and the little things at the settings. With the conjugate operations, the implementation of setup will be completed in a shorter time. After making operation conjugally, the setup time will be finished 30 minutes before. It can be seen in figure 8.
Figure8.Change (In setup time)
Change the clamps and the little things Calibrating the Dubbs
60 min 30 min
90 min
BE
FO
RE
SM
ED
Change the clamps and the little things
Calibrating the DubbsASDSADDASDASDDuDub
30 min 30 min 30 min
AF
TE
R S
ME
D
SAVE TİME

34
With the following figure (Figure 9), the total change in setup time can be seen.
Figure9. (Total change in setup time)
To show the effect of SMED on production time we use the same examples as empirical findings. For the products coded 11030234-2, 1667973 and 1673819 the production time will be calculated again with the new setup time.
For product coded 11030234-2 production time is:
(1000* 66) /3600 + 2) = 20.33 hour
For product coded 1667973 production time is:
(1000*31)/3600+ 2) = 10.61 hour
For product coded 1673819 production time is:
(1000*75)/3600+2) = 22.83 hour
EXTERNAL SETUP INTERNAL SETUP
BE
FO
RE
SM
ED
EXTERNAL SETUP INTERNAL SETUP
AF
TE
R S
ME
D
3 HOURS
2 HOURS
30 min 30 min

35
6. Results
In this chapter the results from the analysis will be presented.
This thesis focuses on production time reduction and employee satisfaction so to reach this goal, a questionnaire, 5S and SMED were applied to Swepart by the authors. In accordance with the theory, the questionnaire was performed so as to evaluate the effect of work area on employee. The data from the questionnaire indicates that;
performance and motivation of the employee is increased while employees are working in a well-organized area and also
in the messy work area, it is very hard to work and find the tools for setup so this chaos leads to long setup times as well as long production time.
On the other hand, the result of questionnaire presents that messy work area causes dissatisfied employees so organized work area, defined places for tools, easy way of finding tools and cleanliness of the area increases motivation, performance and satisfaction of the employees and these will be beneficial for the company since efficiency and productivity will increase as the theory says.
With 5S implementation, the work area was arranged and cleaned; the tools were fit in defined places with labels. As a result after the implementation, the tools can be found easily and complexity of area and tools were prevented, morale of employees was increased as the theory says which was also expressed by the employees. Also implementation of 5S was like a pre-stage for SMED since SMED includes improvements for preparation stage of setup.
SMED was implemented to reduce setup time so as to reduce production time. With SMED the most important thing achieved is to decrease the production time. Four stages of SMED conduced, more external setups since internal setup steps were transformed into external and easier way of working because the needed tools can be found without any problems and the work area was organized better. In Swepart for S40 machine, nineteen setup steps were identified and seventeen of them were internal steps and two of them were external steps. Changing of “Set the fixtures for product” step from internal to external was decided by the authors according to interviews made with employees and also the authors decided that “Change the clamps and the little things at the settings” and “Calibrating the Dubbs” steps can be done simultaneously.
With all these changes in the way of applying setups, at least an hour will be reduced. 30 minutes were gained from the transformed and the other 30 minutes were gained from the conjugate works. Decrease of one hour will affect the system crucially when the numbers of products are concerned because more products mean more setups. When the implementation of setup become more standardized, the steps will take less time and also the experience of the employee will be higher each day which will show its effect in future.

36
To sum up, 5S affected employee satisfaction in a positive way as well as SMED implementation which decreased the setup time and production time for each product was reduced one hour accordingly.

37
7. Conclusion and Recommendations
In this chapter, the answer to the problem formulation will be presented and recommendation to the case company will be given. Future researches are also discussed.
The study covers production time reduction and employee satisfaction at the same time andthis is important for all manufacturing companies from theory it is known that when the employees are satisfied the work can be done in a better way and purveys increase in productivity and efficiency. The production time is important because production time is directly related to profit and less production time means more production and more profit. This thesis has shown how lean tools could be applied to reach the goals of reduced production time and increased employee satisfaction.
This thesis involves some interesting implication for practitioners. First of all, it is possible to satisfy the employees with arranging the work area by 5S and reduce the production time by SMED and secondly, it gives knowledge about employees, how they are affected by the work area. To benefit from the questionnaire, employee satisfaction can be measured and evaluated;this shows a way to the company to reach employee satisfaction with arranging the work area.
This study provides employee satisfaction as well as production time reduction with 5S and SMED implementation in manufacturing companies especially the ones which applies too many setups and have long production time. This thesis can be practicable easy to follow for each manufacturing company. 5S is a useful tool for manufacturers to arrange the work area so as to satisfy employees and also 5S provides some benefits like, high morale and incentive of employees, prevention of pollution, reduction of waste and improved staff involvement. Besides, SMED is a tool for improving setup process. As a result, SMED provides reduced setup time which will also reduce production time also with SMED implementation; production outputs will increase, respond for customer will be faster and overtime production costs will be reduced.
In Swepart Transmission AB, which is the case company for this thesis, production time was reduced as a result of SMED and employees are being satisfied with 5S. Our recommendations for Swepart are the following; implementations of 5S and SMED should be continuous so as to gain better results day by day. Furthermore, SwePart could investigate the possibilities in enhancing the overall production planning to avoid any problems in setupsbecause when the production plan changes suddenly, the quality department can not be booked to measure dimensions for special products before setup start and this situation causes waste of time in setup.
This study could be done not only in one area of the company but also done in the whole work place. The tools applied can be used for all manufacturing companies; therefore, the same study can be done in different types of companies in order to define the range of generalization.
38
8. References
In this part, the literature and websites that were used to conduct this thesis are listed.
Andersson S., Svensson O. (2007), A Model to Guide a Company Towards a Decision of Whether to Change the Due Date of Work Orders or Not: A Case Study, School of Technology and Design, Vaxjö University
Brannick T., Coghlan D. (2007), In Defense of Being Native: The Case for Insider Academic Research, Organizational Research Methods, Vol.10 59-74
Bryman A. (1989), Research Methods and Organization Studies, the Academic Division of Uuwin hyman Ltd.
Camkurt M. Z. (2007), İş Yeri Çalışma Sistemi ve İşyeri Fiziksel Faktörlerinin İş Kazaları Üzerideki Etkisi, TÜHİS İş Hukuku ve İktisat Dergisi, Cilt: 20 Sayı: 6 , Cilt: 21 Sayı: 1
Diego R.L., Hellman B. (2007), Organizational Advantages through the development of Information Systems, School of Technology and Design, Vaxjö University
Gadamer H.G. (2001), Truth and Method, 5th, Sheed& Ward, London
George M.L. (2003), Lean Six Sigma for Service, McGraw-Hill, New York, NY.
Graziano, A. & Raulin, M. (2007), Research methods: a process of inquiry, 6th ed. Pearson Allyn and Bacon, Boston.
Kulaç Ü. (2003), Yalın Üretim Felsefesi, Yalın Enstütü Derneği
Kvale S. (1989), Issues of Validity in Qualitative Research, Bromley: Chartwell- Bratt.
Liker J.K. (2004), The Toyota Way: 14 Management Principles From the World’s Greatest Manufacturer, McGraw-Hill, New York, NY
Merriam S. (1998), Qualitative Research and Case Study Applications in Education, 2nd San Francisco : Jossey-Bass
Moxham C., Greatbanks R. (2001), Prerequisites for the implementation of the SMED methodology: A study in a textile processing environment, International Journal of Quality& Reliability Management Vol.18 404-414
Nicholas J.M. (1998), Competitive Manufacturing Management: Continues Improvement, Lean Production, Customer Focused Quality, McGraw-Hill, New York, NY

39
Paixao A.C., Marlow P.B. (2003), Fourth Generation Ports- A Question of Agility,International Journal of Physical Distribution& Logistics Management, Vol.33 355-376
Riley D. (2007), The Paradox of Positivism, Social Science History, Vol.31 115-126
Ritchie J., Lewis, J (2003), Qualitative Research Practice: A guide for social science students and researchers, SAGE Publications
Robson C., (2007), How To Do a Research Project, Blackwell Publishing
Rothchild, Irving (2003), Induction, Deduction and Scientific Method, School of Medicine of Case Western Reverse University
Sekine K., Arai K., (1998), TPM for the Lean Factory : Innovative Methods and Worksheets for Equipment Management, Productivity Press, Portland
Shah R., Ward P.T. (2007), Defining and Developing Measures of Lean Production, Journal of Operations Management, Vol.25 785-805
Silverman D. (2005), Doing Qualitative Research, 2nd, SAGE Publications
Swepart Presentation in English, 080308
Warwood S.F. (2004), An Investigation into Japanese 5S Practice in UK Industry, The TQM Magazine, Vol.16
Womack J.P., Jones D., Roos D. (1990), The Machine That Changed the World, Rawson Associates, New York, NY.
Yin, R. K., (2003), Case Study Research; Design and Methods, 3rd, Sage Publications Inc., Thousand Oaks
Web:http://www.answers.com/topic/quantitative-research?cat=technology, 080407
http://www.deu.edu.tr/userweb/uzeyme.dogan/dosyalar/5s_poka_yoke_tpm_ppt_doc.pdf, 080523
http://www.yalinenstitu.org.tr/makale_detay.asp?id=23, 080407
http://www.onlinekalite.com/htmdosyalar/jitsetupsmed.htm, 080513

40
9. Appendix
Appendix1. General Questionnaire
1- In which grade, does your working area arrangement affect your performance?
5 4 3 2 1
2- In which grade, does your organized working areas increase your motivation?
5 4 3 2 1
3- In which grade, does your messy working areas complicate your job?
5 4 3 2 1
4- In which grade, does your messy working areas dissatisfy you?
5 4 3 2 1
5- In which grade, does your messy working areas complicate to find the needed tools equipments?
5 4 3 2 1
6- In which grade, is it important to have needed tools and equipments in defined places?
5 4 3 2 1
Note: The numbers from 5 to 1 are in descending order .If you choose 5 it means very much, if you choose 1 it means exiguous.

41

42
Appendix 2.Swepart Products

43
Appendix3. Fixture
Fixture

44
Appendix4. Yellow Area
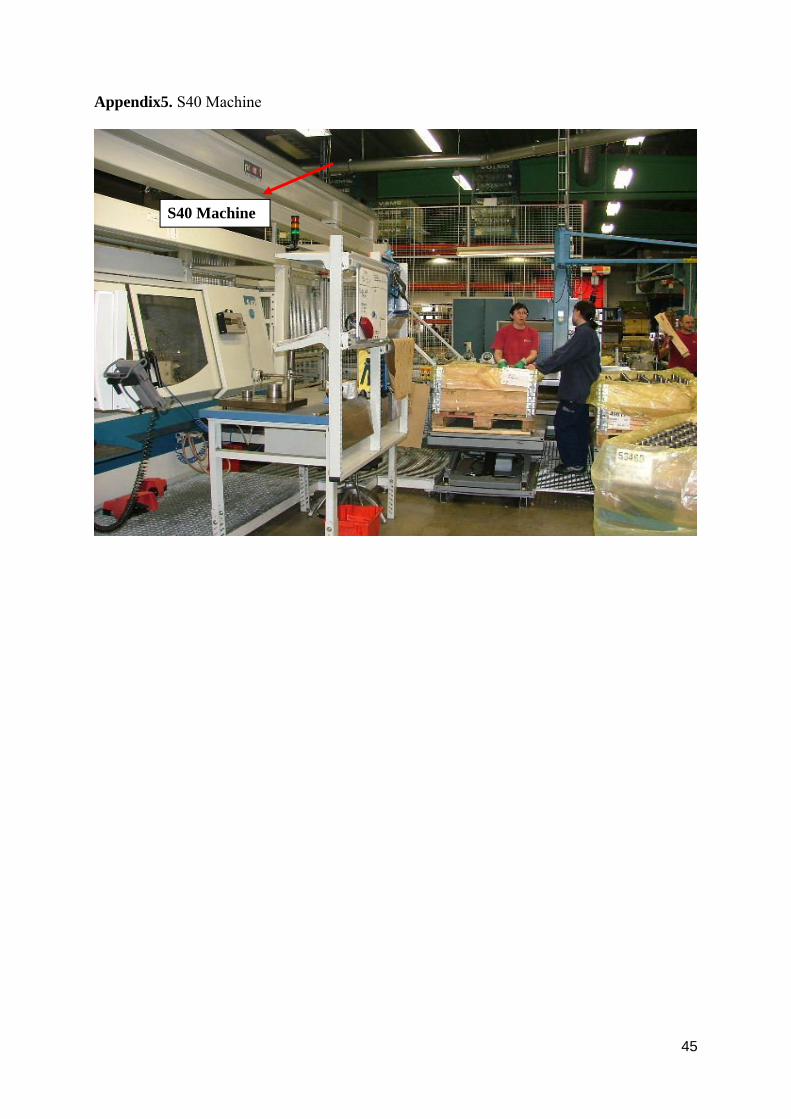
45
Appendix5. S40 Machine
S40 Machine

46
School of Technology and DesignSE- 351 95 Växjö
Sweden
tel +46 470-70 80 00, fax +46 470-76 85 40