learner satisfaction survey - assets.publishing.service.gov.uk · characteristics of the...
TRANSCRIPT

Learner Satisfaction
Survey
National Results
July 2017

Introduction

Learner satisfaction 2016 to 2017
• The learner satisfaction survey 2016 to 2017 took place
between October 2016 and April 2017.
• The survey was open to all learners funded through one of
the following funding groups: -
• 16 to 19 funding
• Adult education budget funding, including
community learning and apprenticeship funding
• Other funding
• Advanced learner loans
Learner satisfaction 2016 to 2017
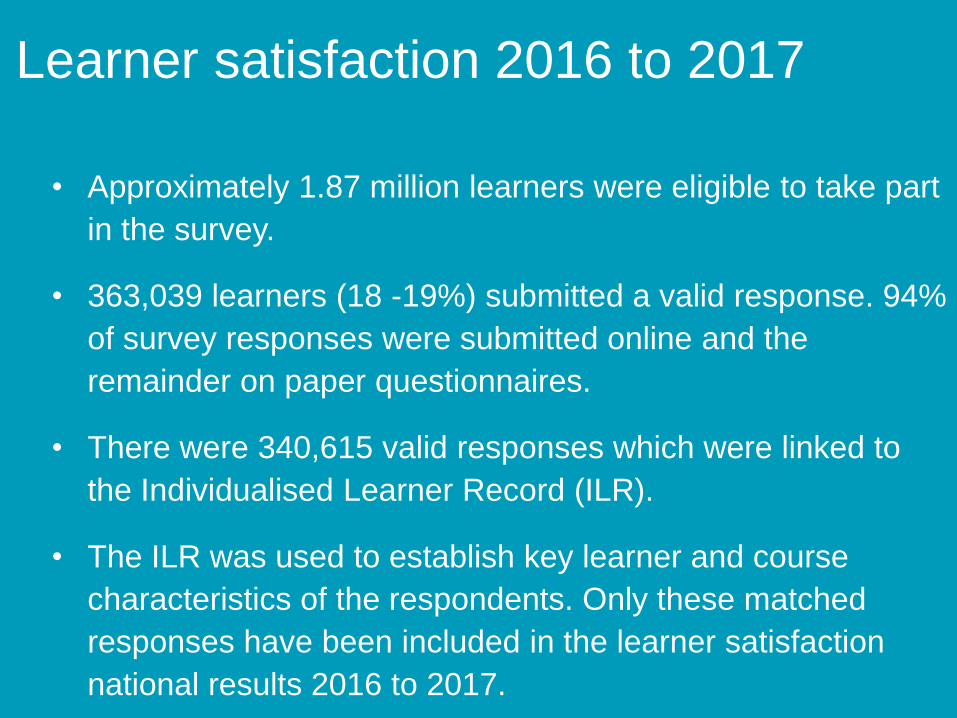
• Approximately 1.87 million learners were eligible to take part
in the survey.
• 363,039 learners (18 -19%) submitted a valid response. 94%
of survey responses were submitted online and the
remainder on paper questionnaires.
• There were 340,615 valid responses which were linked to
the Individualised Learner Record (ILR).
• The ILR was used to establish key learner and course
characteristics of the respondents. Only these matched
responses have been included in the learner satisfaction
national results 2016 to 2017.

Number of responses• The number of responses received provides a robust dataset
with a margin of error at a national level of +/-0.1%. A total of
18.2% of all eligible learners took part in the survey.
These figures are based on responses matched to the ILR against all eligible learners for the survey.1Includes No Level / Unknown Level
Learner GroupNumber of
Responses
Survey respondents
as a % of eligible
learner population
Female 182,257 17%
Male 158,358 19%
Learner GroupNumber of
Responses
Survey respondents
as a % of eligible
learner population
16-18 Female 81,233 28%
16-18 Male 99,041 28%
Learner GroupNumber of
Responses
Survey respondents
as a % of eligible
learner population
16-18 180,274 28%
19+ 160,341 13%
Learner GroupNumber of
Responses
Survey respondents
as a % of eligible
learner population
19+ Female 101,024 13%
19+ Male 59,317 13%
Learner GroupNumber of
Responses
Survey respondents
as a % of eligible
learner population
Level 1 or below 72,401 14%
Level 2 122,556 18%
Level 3+ 145,658 22%
1

Number of responses
These figures are based on responses matched to the ILR against all eligible learners for the survey.
Provider TypeNumber of
Responses
Survey respondents
as a % of eligible
learner population
General FE College incl Tertiary 189,264 18%
Other Public Funded e.g. LAs and HE 49,912 20%
Private Sector Public Funded 87,560 20%
Special & Specialist Designated Colleges 13,879 15%
Survey respondents as
a % of eligible learner
population in Each
Provider
% of Providers
Less than 10% 29%
10% - 20% 19%
20% - 30% 16%
30% - 40% 11%
40% - 50% 9%
50% - 60% 7%
60% - 70% 4%
70% - 80% 3%
80% - 90% 2%
90% - 100% 0%
RegionNumber of
Responses
Survey respondents
as a % of eligible
learner population
East of England 38,010 21%
East Midlands 31,968 19%
Greater London 42,661 15%
North East 24,987 22%
North West 51,196 19%
South East 43,244 18%
South West 32,535 18%
West Midlands 42,306 20%
Yorkshire and the Humber 31,338 16%
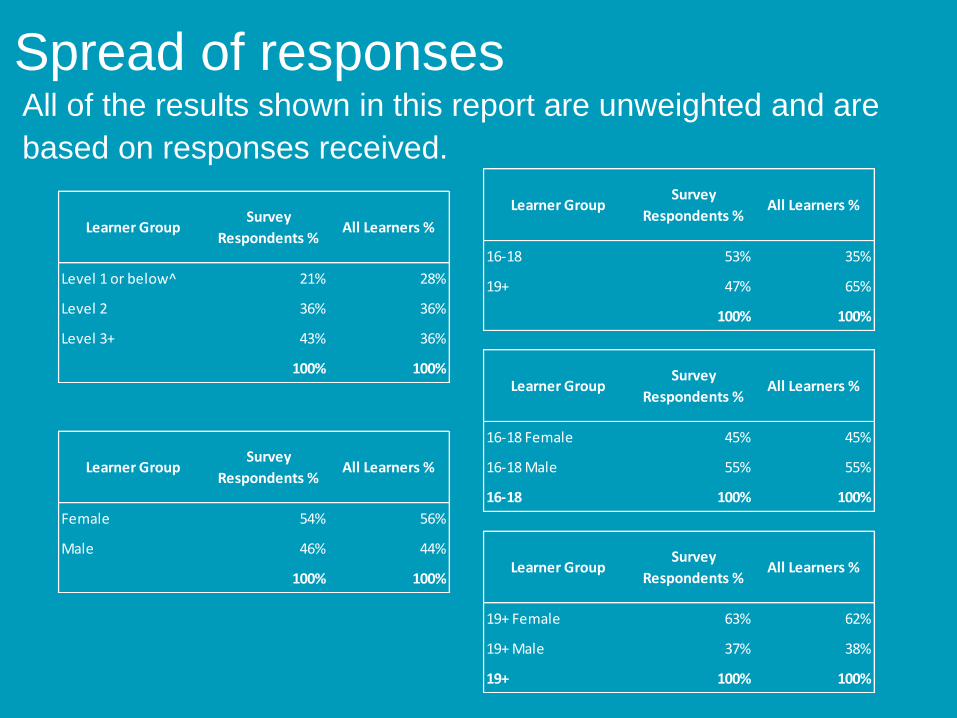
Spread of responsesAll of the results shown in this report are unweighted and are
based on responses received.
Learner GroupSurvey
Respondents %All Learners %
Level 1 or below^ 21% 28%
Level 2 36% 36%
Level 3+ 43% 36%
100% 100%
Learner GroupSurvey
Respondents %All Learners %
Female 54% 56%
Male 46% 44%
100% 100%
Learner GroupSurvey
Respondents %All Learners %
16-18 53% 35%
19+ 47% 65%
100% 100%
Learner GroupSurvey
Respondents %All Learners %
16-18 Female 45% 45%
16-18 Male 55% 55%
16-18 100% 100%
Learner GroupSurvey
Respondents %All Learners %
19+ Female 63% 62%
19+ Male 37% 38%
19+ 100% 100%
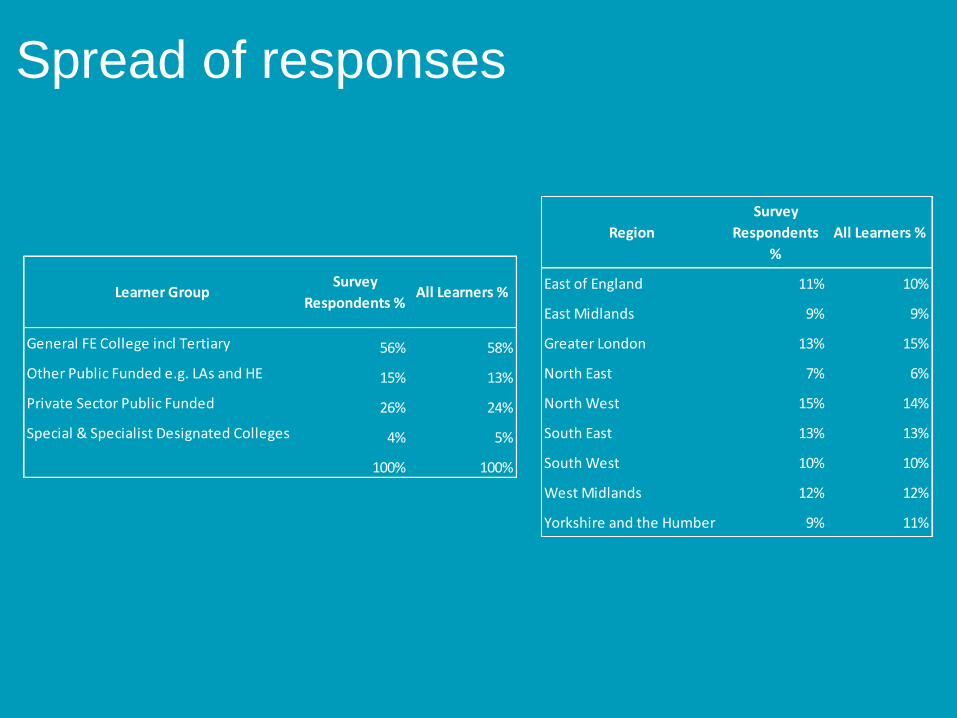
Spread of responses
Learner GroupSurvey
Respondents %All Learners %
General FE College incl Tertiary 56% 58%
Other Public Funded e.g. LAs and HE 15% 13%
Private Sector Public Funded 26% 24%
Special & Specialist Designated Colleges 4% 5%
100% 100%
Region
Survey
Respondents
%
All Learners %
East of England 11% 10%
East Midlands 9% 9%
Greater London 13% 15%
North East 7% 6%
North West 15% 14%
South East 13% 13%
South West 10% 10%
West Midlands 12% 12%
Yorkshire and the Humber 9% 11%
Learner satisfaction 2016 to 2017• The learner satisfaction survey has seven questions where learners are
asked to rate various aspects of their course, learning programme or
training programme on a scale of 0 to 10 where 0 is ‘very dissatisfied’ and
10 is ‘very satisfied’.
• Learners were also asked ‘How likely is it that you would recommend the
learning provider to friends or family?’. Learners could respond with the
options of ‘Extremely Likely’, ‘Likely’, ‘Neither Likely nor Unlikely’,
‘Unlikely’, or ‘Extremely Unlikely’.
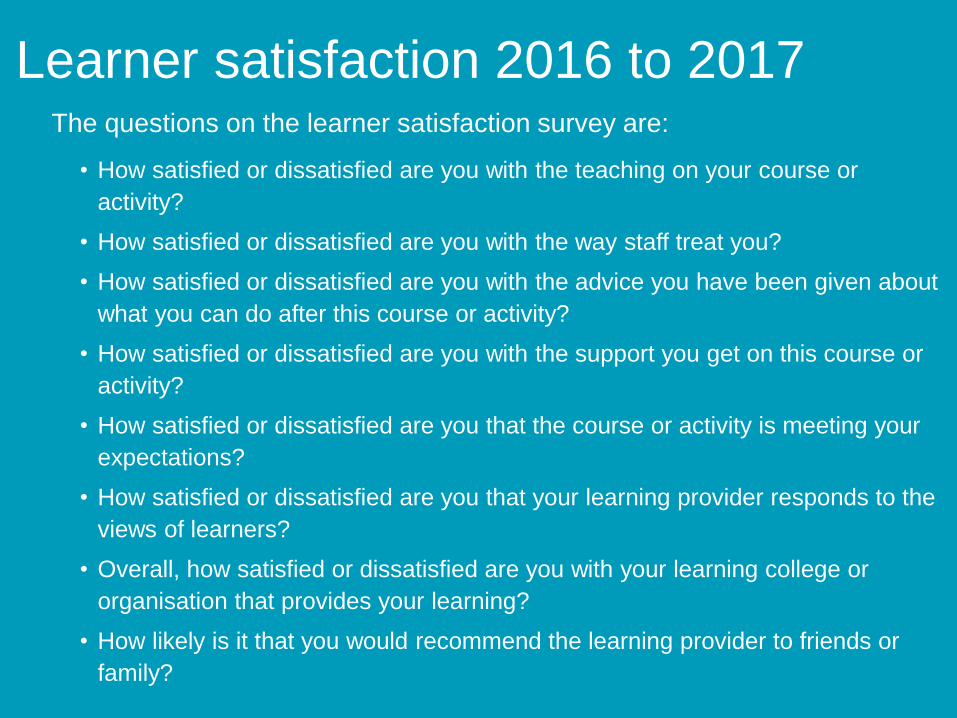
Learner satisfaction 2016 to 2017The questions on the learner satisfaction survey are:
• How satisfied or dissatisfied are you with the teaching on your course or
activity?
• How satisfied or dissatisfied are you with the way staff treat you?
• How satisfied or dissatisfied are you with the advice you have been given about
what you can do after this course or activity?
• How satisfied or dissatisfied are you with the support you get on this course or
activity?
• How satisfied or dissatisfied are you that the course or activity is meeting your
expectations?
• How satisfied or dissatisfied are you that your learning provider responds to the
views of learners?
• Overall, how satisfied or dissatisfied are you with your learning college or
organisation that provides your learning?
• How likely is it that you would recommend the learning provider to friends or
family?
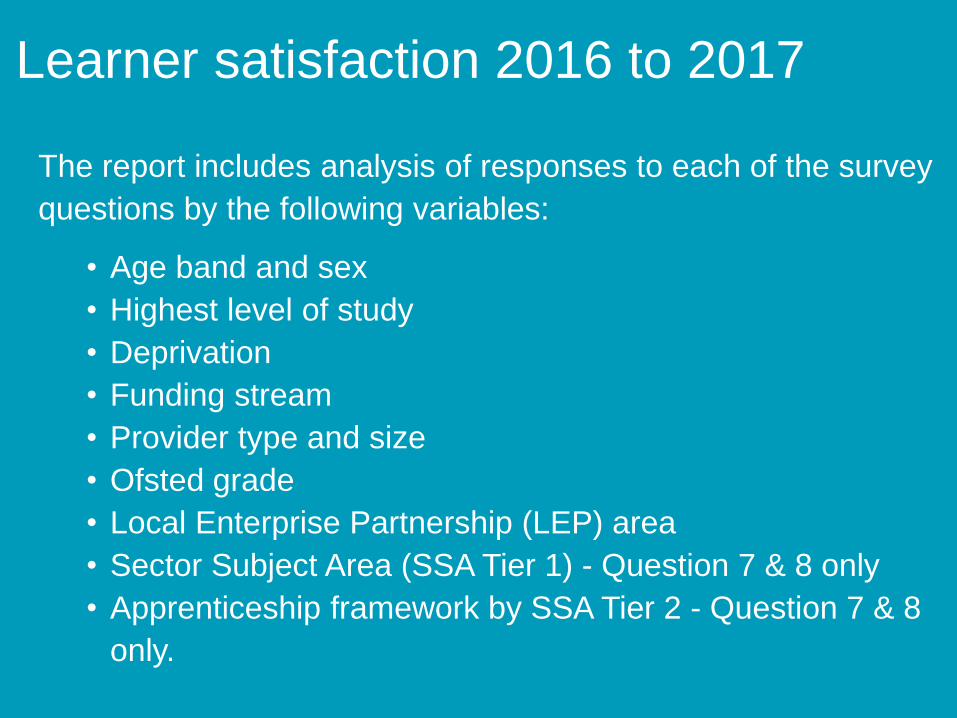
Learner satisfaction 2016 to 2017
The report includes analysis of responses to each of the survey
questions by the following variables:
• Age band and sex
• Highest level of study
• Deprivation
• Funding stream
• Provider type and size
• Ofsted grade
• Local Enterprise Partnership (LEP) area
• Sector Subject Area (SSA Tier 1) - Question 7 & 8 only
• Apprenticeship framework by SSA Tier 2 - Question 7 & 8
only.

Learner satisfaction 2016 to 2017
• Charts and tables in the report are based on survey
responses, which have been linked to the ILR.
• The charts in the report show the average (mean) scores and
the percentage of learners who gave a score of 8 or higher.
• The tables which show the deprivation profile of learners are
based on the Indices of Deprivation (IMD) 2015. Using the
Index of Multiple Deprivation domain, each learner has been
assigned to the relevant Deprivation group based on the
Lower Super Output Area (LSOA) in which they live. The IMD
has ranked each of the 32,844 LSOAs into 10 bands. Band 1
is the most deprived, whilst band 10 is the least deprived.

Learner satisfaction 2016 to 2017
• Subject scores are based on learners who are studying for at
least 80% of their time in a particular subject area or the main
framework aim for learners on an apprenticeship.
• All differences highlighted between groups in key findings are
statistically significant (at the 95% confidence level).

Summary of results (1)Subject Area % of Respondents Scoring 8 or More
Q1. How satisfied or dissatisfied are
you with the teaching on your course or
activity?
340,615 8.5 76%
Q2. How satisfied or dissatisfied are
you with the way staff treat you?340,615 8.8 83%
Q3. How satisfied or dissatisfied are
you with the advice you have been
given about what you can do after this
course or activity?
340,615 8.1 70%
Q4. How satisfied or dissatisfied are
you with the support you get on this
course or activity?
340,615 8.5 78%
Q5. How satisfied or dissatisfied are
you that the course or activity is
meeting your expectations?
340,615 8.3 74%
Q6. How satisfied or dissatisfied are
you that your learning provider
responds to the views of learners?
340,615 8.4 75%
Q7. Overall, how satisfied or
dissatisfied are you with your learning
college or organisation that provides
your learning?
340,615 8.4 75%
Base Mean Score

Summary of results (2)
How likely is it that you would recommend the learning
provider to friends or family?
Q8 - Response % of Respondents
Extremely Likely 38%
Likely 45%
Neither Likely nor Unlikely 12%
Unlikely 3%
Extremely Unlikely 2%
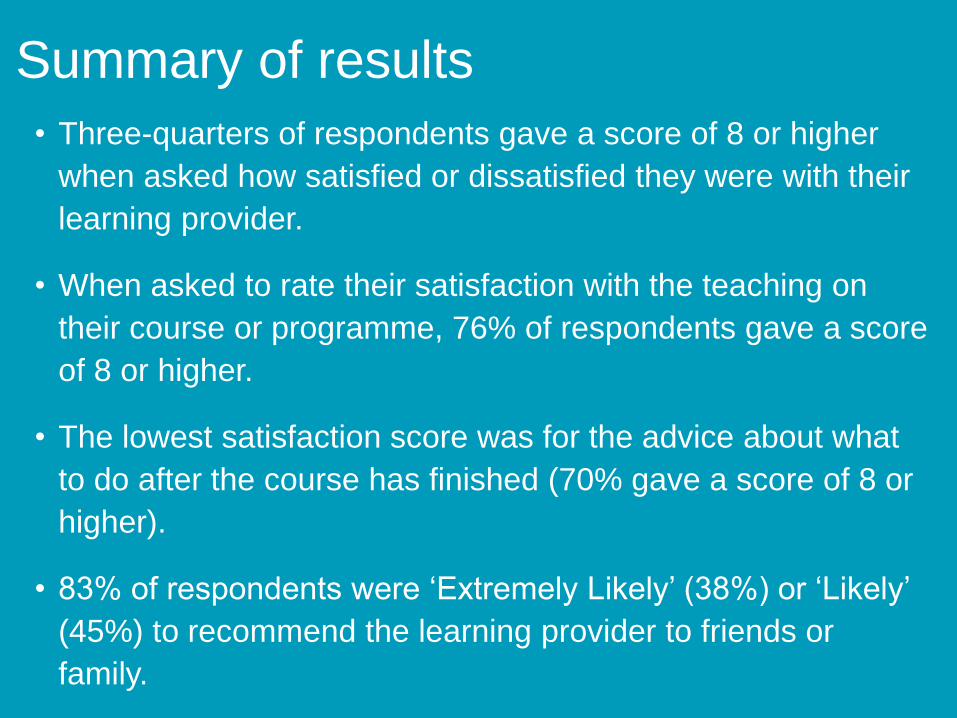
Summary of results
• Three-quarters of respondents gave a score of 8 or higher
when asked how satisfied or dissatisfied they were with their
learning provider.
• When asked to rate their satisfaction with the teaching on
their course or programme, 76% of respondents gave a score
of 8 or higher.
• The lowest satisfaction score was for the advice about what
to do after the course has finished (70% gave a score of 8 or
higher).
• 83% of respondents were ‘Extremely Likely’ (38%) or ‘Likely’
(45%) to recommend the learning provider to friends or
family.

Results analysis
The following sections shows the results from each of the 8
survey questions in detail.

Question 1: How satisfied or
dissatisfied are you with the teaching
on your course or activity
programme?

Key findings 1
• Older learners tended to be more satisfied with the teaching
on their course or programme. 93% of those respondents
aged 60 and over gave a score of 8 or higher compared to
68% of respondents aged 16-18.
• Satisfaction with the teaching decreases as Level of
learning increases. Learners studying at Level 1 or below
(including Unknown / No Level) gave the highest
satisfaction rating whereas Level 3+ learners gave the
lowest rating.
• Adult clasroom learners were the most satisfied with the
teaching on their course or activity and 16-18 classroom
learners were the least satisfied.

Key findings 2
• The proportion of learners satisfied with the teaching on
their course or activity increases slightly as learner
deprivation increases, with a higher proportion of learners
from the most disadvantaged learner groups scoring 8 or
higher than the least deprived.
• Learners who lived in the Tees Valley, North East and
Liverpool City Region LEP areas had the highest
satisfaction rating with over 82% scoring 8 or higher. The
lowest satisfaction rating was given by learners living in the
Swindon and Wiltshire, and Greater Cambridge, and
Greater Peterborough LEP areas with just 68% scoring 8 or
higher.
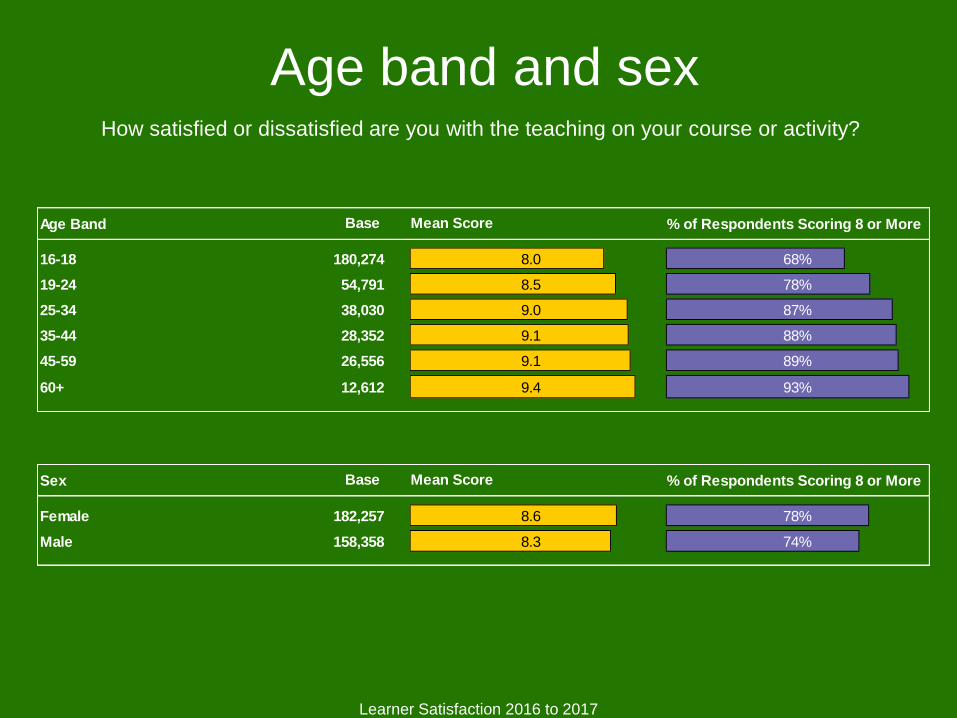
Age band and sex
Learner Satisfaction 2016 to 2017
How satisfied or dissatisfied are you with the teaching on your course or activity?
Sex % of Respondents Scoring 8 or More
Female 182,257 8.6 78%
Male 158,358 8.3 74%
Base Mean Score
Age Band % of Respondents Scoring 8 or More
16-18 180,274 8.0 68%
19-24 54,791 8.5 78%
25-34 38,030 9.0 87%
35-44 28,352 9.1 88%
45-59 26,556 9.1 89%
60+ 12,612 9.4 93%
Mean ScoreBase
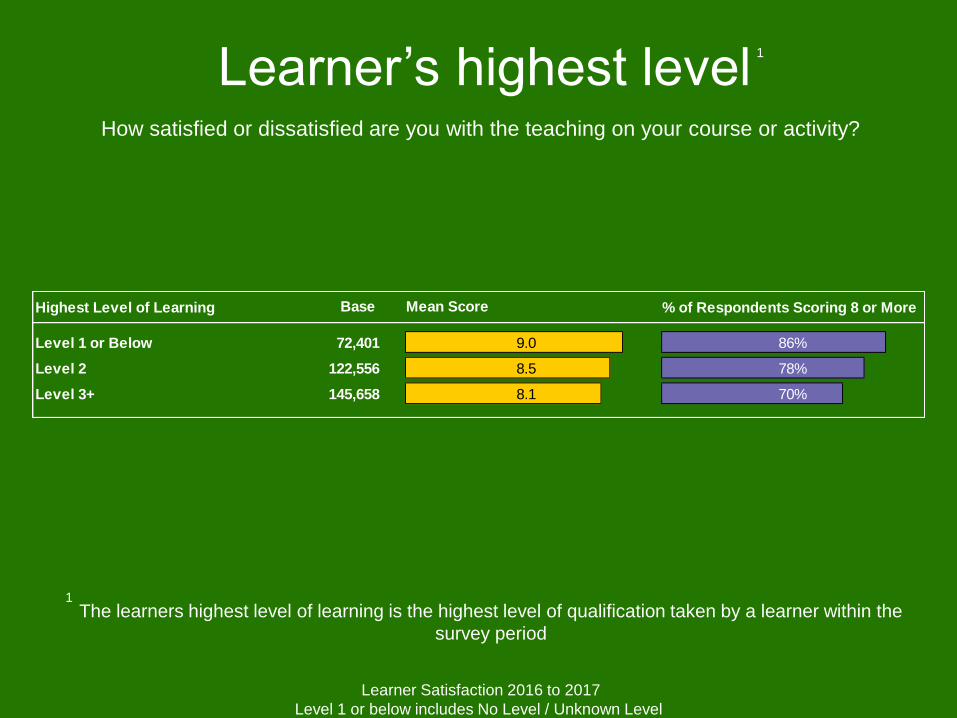
Learner’s highest level
Learner Satisfaction 2016 to 2017
Level 1 or below includes No Level / Unknown Level
How satisfied or dissatisfied are you with the teaching on your course or activity?
Highest Level of Learning % of Respondents Scoring 8 or More
Level 1 or Below 72,401 9.0 86%
Level 2 122,556 8.5 78%
Level 3+ 145,658 8.1 70%
Base Mean Score
The learners highest level of learning is the highest level of qualification taken by a learner within the
survey period
1
1

Learner deprivation
Learner Satisfaction 2016 to 2017
How satisfied or dissatisfied are you with the teaching on your course or activity?
Deprivation % of Respondents Scoring 8 or More
Band 1 (Most Deprived) 51,362 8.6 79%
Band 2 44,318 8.5 77%
Band 3 39,636 8.5 77%
Band 4 36,077 8.5 76%
Band 5 32,585 8.4 76%
Band 6 29,980 8.4 75%
Band 7 28,093 8.4 75%
Band 8 27,161 8.4 74%
Band 9 25,670 8.3 74%
Band 10 (Least Deprived) 23,363 8.3 74%
Base Mean Score

Funding stream
Learner Satisfaction 2016 to 2017
How satisfied or dissatisfied are you with the teaching on your course or activity?
Funding Stream % of Respondents Scoring 8 or More
16-18 Apprenticeships 35,416 8.5 77%
16-18 Classroom Learning 157,740 8.0 67%
19+ Apprenticeships 60,738 8.9 84%
19+ Classroom Learning 91,635 9.0 86%
Base Mean Score

Provider type and size
Learner Satisfaction 2016 to 2017
How satisfied or dissatisfied are you with the teaching on your course or activity?
Provider Type % of Respondents Scoring 8 or More
General FE College incl Tertiary 189,264 8.1 70%
Other Public Funded e.g. LAs and HE 49,912 9.1 87%
Private Sector Public Funded 87,560 8.8 83%
Special & Specialist Designated Colleges 13,879 8.1 70%
Base Mean Score
Provider Type Size % of Respondents Scoring 8 or More
Large (7,000+ learners) 61,663 8.1 70%
Medium (4,000-7,000) 75,841 8.2 70%
Small (<4,000) 51,760 8.1 70%
Large (2,000+ learners) 26,397 9.1 88%
Medium (500-2,000) 20,299 9.1 88%
Small (<500) 3,216 8.6 78%
Large (2,000+ learners) 25,724 8.8 83%
Medium (500-2,000) 41,192 8.9 85%
Small (<500) 20,644 8.7 81%
Large (2,500+ learners) 9,352 8.2 71%
Medium (1,000-2,500) 4,136 8.0 66%
Small (<1,000) 391 8.5 77%
Base Mean Score
General FE College
incl Tertiary
Other Public
Funded e.g. LAs
and HE
Private Sector
Public Funded
Special & Specialist
Designated
Colleges

OFSTED grade
Learner Satisfaction 2016 to 2017
How satisfied or dissatisfied are you with the teaching on your course or activity?
OFSTED Grade (Awarded from 2012/13) % of Respondents Scoring 8 or More
Outstanding 18,856 8.4 76%
Good 219,022 8.5 77%
Requires Improvement 60,355 8.2 71%
Inadequate 8,940 8.1 69%
Base Mean Score

LEP areas (1)How satisfied or dissatisfied are you with the teaching on your course or activity?
LEP Area % of Respondents Scoring 8 or More
Tees Valley 6,365 8.9 84%
North East 18,622 8.8 83%
Liverpool City Region 9,451 8.8 83%
Black Country 9,754 8.7 81%
Humber 6,166 8.6 81%
Leeds City Region 16,176 8.6 79%
Cornwall and Isles of Scilly 2,784 8.6 80%
York, North Yorkshire and East Riding 6,443 8.6 79%
Lancashire 11,719 8.5 78%
Sheffield City Region 12,824 8.5 77%
Dorset 3,978 8.5 77%
Stoke-on-Trent and Staffordshire 8,086 8.5 78%
Leicester and Leicestershire 6,132 8.5 77%
Derby, Derbyshire, Nottingham and Nottinghamshire 16,365 8.5 77%
Greater Lincolnshire 6,647 8.5 76%
Greater Birmingham and Solihull 15,202 8.5 76%
Coventry and Warwickshire 6,083 8.5 77%
Thames Valley Berkshire 5,238 8.5 76%
Greater Manchester 19,965 8.5 76%
Base Mean Score

LEP areas (2)
Learner Satisfaction 2016 to 2017
How satisfied or dissatisfied are you with the teaching on your course or activity?
LEP Area % of Respondents Scoring 8 or More
Solent 6,422 8.4 76%
London 42,661 8.4 75%
Heart of the South West 12,358 8.4 76%
The Marches 4,759 8.4 75%
South East 21,458 8.4 74%
Enterprise M3 7,690 8.4 74%
Cumbria 3,675 8.3 76%
Coast to Capital 8,739 8.3 73%
Worcestershire 2,534 8.3 74%
Buckinghamshire Thames Valley 3,142 8.3 73%
Cheshire and Warrington 6,386 8.3 72%
New Anglia 11,079 8.2 72%
West of England 6,592 8.2 71%
South East Midlands 11,387 8.2 70%
Gloucestershire 3,360 8.1 70%
Hertfordshire 6,161 8.1 69%
Oxfordshire 2,980 8.1 70%
Greater Cambridge and Greater Peterborough 9,162 8.1 68%
Swindon and Wiltshire 3,463 8.0 68%
Base Mean Score

Question 2: How satisfied or
dissatisfied are you with the way staff
treat you?

Key findings 1
• Older respondents were more likely to be satisfied with the
way staff treated them. 76% of respondents aged 16-18
gave a score of 8 or more compared to 97% of those aged
60 and over.
• Respondents who lived in areas of higher deprivation gave
slightly higher satisfaction scores in comparison to those
in less deprived areas.

Key findings 2
• 87% of respondents taking 16-18 apprenticeships gave a
score of 8 or higher compared to 74% of 16-18 classroom
based learners. Satisfaction levels were similar among
adults taking 19+ apprenticeships compared to those
taking 19+ classroom learning.
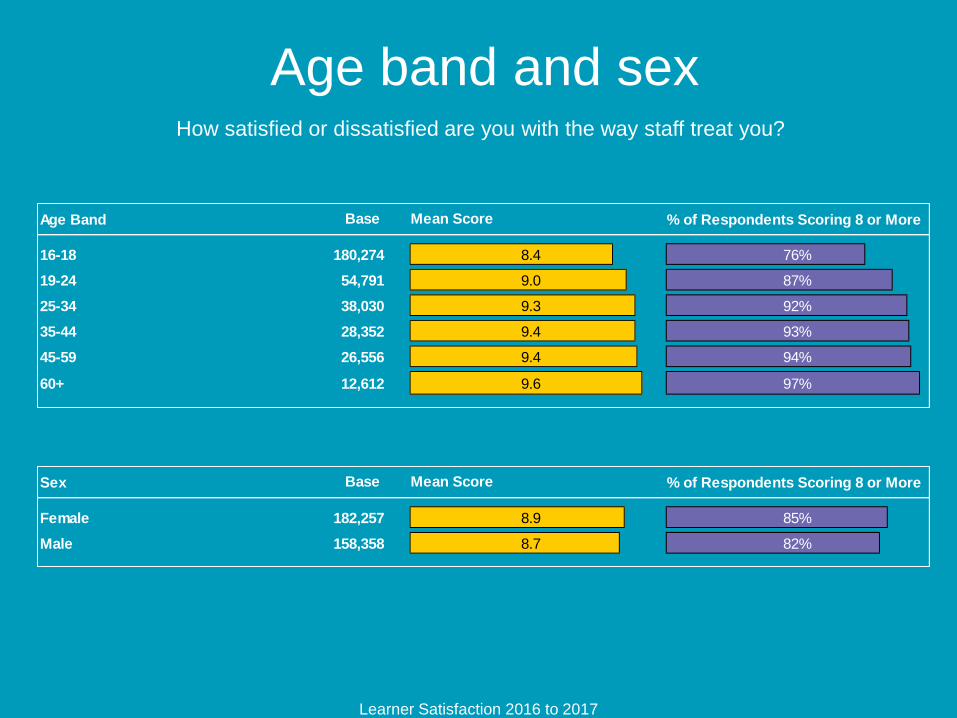
Age band and sex
Learner Satisfaction 2016 to 2017
How satisfied or dissatisfied are you with the way staff treat you?
Age Band % of Respondents Scoring 8 or More
16-18 180,274 8.4 76%
19-24 54,791 9.0 87%
25-34 38,030 9.3 92%
35-44 28,352 9.4 93%
45-59 26,556 9.4 94%
60+ 12,612 9.6 97%
Base Mean Score
Sex % of Respondents Scoring 8 or More
Female 182,257 8.9 85%
Male 158,358 8.7 82%
Base Mean Score

Learner’s highest level
Learner Satisfaction 2016 to 2017
Level 1 or below includes No Level / Unknown Level
How satisfied or dissatisfied are you with the way staff treat you?
Highest Level of Learning % of Respondents Scoring 8 or More
Level 1 or Below 72,401 9.2 90%
Level 2 122,556 8.8 83%
Level 3+ 145,658 8.6 80%
Base Mean Score
The learners highest level of learning is the highest level of qualification taken by a learner within
the survey period
1
1
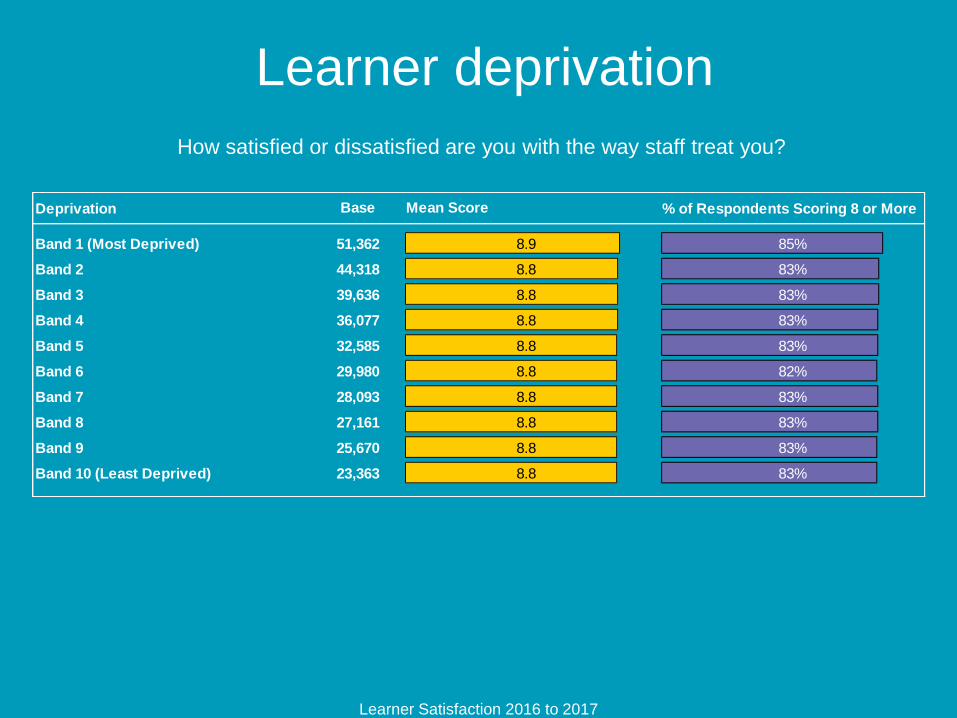
Learner deprivation
Learner Satisfaction 2016 to 2017
How satisfied or dissatisfied are you with the way staff treat you?
Deprivation % of Respondents Scoring 8 or More
Band 1 (Most Deprived) 51,362 8.9 85%
Band 2 44,318 8.8 83%
Band 3 39,636 8.8 83%
Band 4 36,077 8.8 83%
Band 5 32,585 8.8 83%
Band 6 29,980 8.8 82%
Band 7 28,093 8.8 83%
Band 8 27,161 8.8 83%
Band 9 25,670 8.8 83%
Band 10 (Least Deprived) 23,363 8.8 83%
Base Mean Score

Funding stream
Learner Satisfaction 2016 to 2017
How satisfied or dissatisfied are you with the way staff treat you?
Funding Stream % of Respondents Scoring 8 or More
16-18 Apprenticeships 35,416 9.0 87%
16-18 Classroom Learning 157,740 8.3 74%
19+ Apprenticeships 60,738 9.3 92%
19+ Classroom Learning 91,635 9.3 91%
Base Mean Score
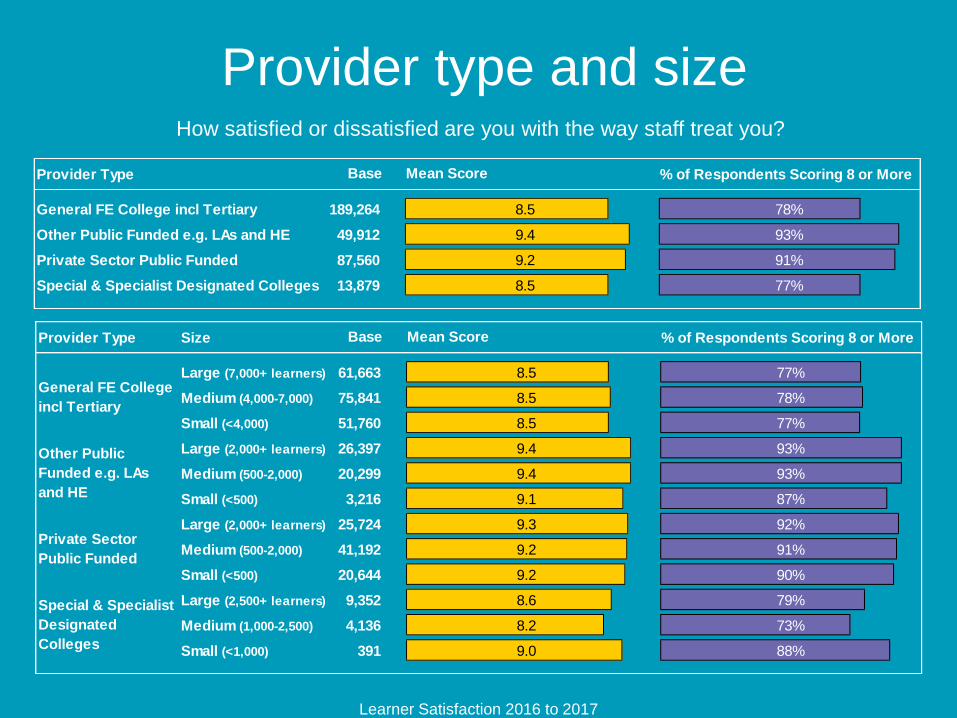
Provider type and size
Learner Satisfaction 2016 to 2017
How satisfied or dissatisfied are you with the way staff treat you?
Provider Type % of Respondents Scoring 8 or More
General FE College incl Tertiary 189,264 8.5 78%
Other Public Funded e.g. LAs and HE 49,912 9.4 93%
Private Sector Public Funded 87,560 9.2 91%
Special & Specialist Designated Colleges 13,879 8.5 77%
Base Mean Score
Provider Type Size % of Respondents Scoring 8 or More
Large (7,000+ learners) 61,663 8.5 77%
Medium (4,000-7,000) 75,841 8.5 78%
Small (<4,000) 51,760 8.5 77%
Large (2,000+ learners) 26,397 9.4 93%
Medium (500-2,000) 20,299 9.4 93%
Small (<500) 3,216 9.1 87%
Large (2,000+ learners) 25,724 9.3 92%
Medium (500-2,000) 41,192 9.2 91%
Small (<500) 20,644 9.2 90%
Large (2,500+ learners) 9,352 8.6 79%
Medium (1,000-2,500) 4,136 8.2 73%
Small (<1,000) 391 9.0 88%
General FE College
incl Tertiary
Other Public
Funded e.g. LAs
and HE
Private Sector
Public Funded
Special & Specialist
Designated
Colleges
Base Mean Score

OFSTED grade
Learner Satisfaction 2016 to 2017
How satisfied or dissatisfied are you with the way staff treat you?
OFSTED Grade (Awarded from 2012/13) % of Respondents Scoring 8 or More
Outstanding 18,856 8.8 84%
Good 219,022 8.9 84%
Requires Improvement 60,355 8.6 79%
Inadequate 8,940 8.5 77%
Base Mean Score

LEP areas (1)How satisfied or dissatisfied are you with the way staff treat you?
LEP Area % of Respondents Scoring 8 or More
Liverpool City Region 9,451 9.2 90%
Tees Valley 6,365 9.2 89%
North East 18,622 9.2 89%
Cornwall and Isles of Scilly 2,784 9.0 88%
Black Country 9,754 9.0 87%
Leeds City Region 16,176 9.0 86%
Humber 6,166 9.0 86%
York, North Yorkshire and East Riding 6,443 8.9 86%
Dorset 3,978 8.9 85%
Sheffield City Region 12,824 8.9 85%
Lancashire 11,719 8.9 84%
Derby, Derbyshire, Nottingham and Nottinghamshire 16,365 8.9 84%
Stoke-on-Trent and Staffordshire 8,086 8.9 84%
Leicester and Leicestershire 6,132 8.8 83%
Greater Lincolnshire 6,647 8.8 83%
Coventry and Warwickshire 6,083 8.8 84%
Cumbria 3,675 8.8 84%
Worcestershire 2,534 8.8 83%
Greater Birmingham and Solihull 15,202 8.8 83%
Base Mean Score

LEP areas (2)
Learner Satisfaction 2016 to 2017
How satisfied or dissatisfied are you with the way staff treat you?
LEP Area % of Respondents Scoring 8 or More
Thames Valley Berkshire 5,238 8.8 83%
The Marches 4,759 8.8 84%
Heart of the South West 12,358 8.8 84%
Greater Manchester 19,965 8.8 82%
Solent 6,422 8.8 83%
Enterprise M3 7,690 8.8 82%
South East 21,458 8.7 82%
Buckinghamshire Thames Valley 3,142 8.7 80%
London 42,661 8.7 81%
Cheshire and Warrington 6,386 8.7 80%
Oxfordshire 2,980 8.7 81%
West of England 6,592 8.6 80%
Coast to Capital 8,739 8.6 80%
New Anglia 11,079 8.6 80%
South East Midlands 11,387 8.6 79%
Hertfordshire 6,161 8.6 79%
Gloucestershire 3,360 8.6 79%
Swindon and Wiltshire 3,463 8.5 77%
Greater Cambridge and Greater Peterborough 9,162 8.5 77%
Base Mean Score

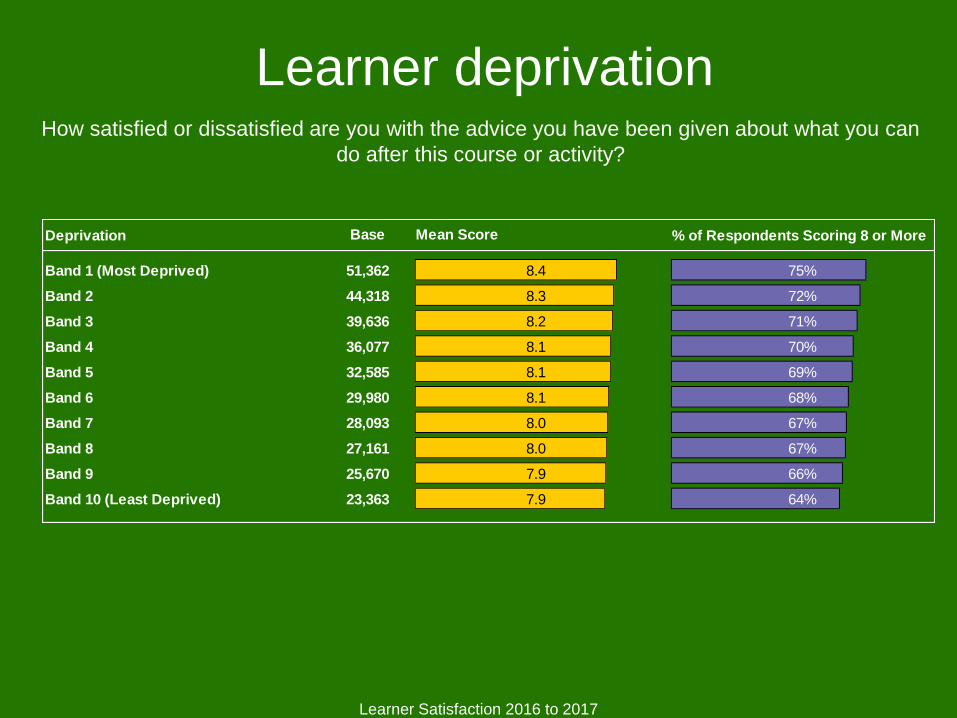
Question 3: How satisfied or
dissatisfied are you with the advice
you have been given about what you
can do after this course or activity?

Key findings 1
• 62% of respondents aged 16-18 and 72% of 19-24 year
olds gave a score of 8 or more when rating the advice they
have been given about what they could do after their
course or programme. This compares with over 80% of
those aged 25 and older.
• Learners on higher level courses were the least satisfied
with the advice they have been given with 63% of Level 3+
learners giving a score of 8 or higher. This compares with
80% for learners studying at Level 1 or below (including
Unknown / No Level).

Key findings 2
• Respondents living in more deprived areas were more
satisfied with the advice they have been given about what
they can do after their course or programme than those
living in less deprived areas.
• College learners were less likely than those studying at
other types of organisation to give a satisfaction score of 8
or higher.

Age band and sex
Learner Satisfaction 2016 to 2017
How satisfied or dissatisfied are you with the advice you have been given about what you can
do after this course or activity?
Age Band % of Respondents Scoring 8 or More
16-18 180,274 7.8 62%
19-24 54,791 8.3 72%
25-34 38,030 8.8 82%
35-44 28,352 8.8 84%
45-59 26,556 8.9 84%
60+ 12,612 9.1 88%
Base Mean Score
Sex % of Respondents Scoring 8 or More
Female 182,257 8.2 71%
Male 158,358 8.0 68%
Base Mean Score

Learner’s highest level
Learner Satisfaction 2016 to 2017
Level 1 or below includes No Level / Unknown Level
How satisfied or dissatisfied are you with the advice you have been given about what you can
do after this course or activity?
Highest Level of Learning % of Respondents Scoring 8 or More
Level 1 or Below 72,401 8.7 80%
Level 2 122,556 8.2 72%
Level 3+ 145,658 7.8 63%
Base Mean Score
The learners highest level of learning is the highest level of qualification taken by a learner within the
survey period
1
1
Learner deprivation
Learner Satisfaction 2016 to 2017
How satisfied or dissatisfied are you with the advice you have been given about what you can
do after this course or activity?
Deprivation % of Respondents Scoring 8 or More
Band 1 (Most Deprived) 51,362 8.4 75%
Band 2 44,318 8.3 72%
Band 3 39,636 8.2 71%
Band 4 36,077 8.1 70%
Band 5 32,585 8.1 69%
Band 6 29,980 8.1 68%
Band 7 28,093 8.0 67%
Band 8 27,161 8.0 67%
Band 9 25,670 7.9 66%
Band 10 (Least Deprived) 23,363 7.9 64%
Base Mean Score

Funding stream
Learner Satisfaction 2016 to 2017
How satisfied or dissatisfied are you with the advice you have been given about what you can
do after this course or activity?
Funding Stream % of Respondents Scoring 8 or More
16-18 Apprenticeships 35,416 8.1 69%
16-18 Classroom Learning 157,740 7.7 61%
19+ Apprenticeships 60,738 8.6 80%
19+ Classroom Learning 91,635 8.7 80%
Base Mean Score

Provider type and size
Learner Satisfaction 2016 to 2017
How satisfied or dissatisfied are you with the advice you have been given about what you can
do after this course or activity?
Provider Type % of Respondents Scoring 8 or More
General FE College incl Tertiary 189,264 7.9 64%
Other Public Funded e.g. LAs and HE 49,912 8.7 80%
Private Sector Public Funded 87,560 8.5 78%
Special & Specialist Designated Colleges 13,879 7.7 60%
Base Mean Score
Provider Type Size % of Respondents Scoring 8 or More
Large (7,000+ learners) 61,663 7.8 64%
Medium (4,000-7,000) 75,841 7.9 65%
Small (<4,000) 51,760 7.9 64%
Large (2,000+ learners) 26,397 8.7 81%
Medium (500-2,000) 20,299 8.7 81%
Small (<500) 3,216 8.3 71%
Large (2,000+ learners) 25,724 8.5 77%
Medium (500-2,000) 41,192 8.6 80%
Small (<500) 20,644 8.4 75%
Large (2,500+ learners) 9,352 7.8 62%
Medium (1,000-2,500) 4,136 7.5 58%
Small (<1,000) 391 8.0 63%
Base Mean Score
Other Public
Funded e.g. LAs
and HE
Private Sector
Public Funded
Special & Specialist
Designated
Colleges
General FE College
incl Tertiary

OFSTED grade
Learner Satisfaction 2016 to 2017
How satisfied or dissatisfied are you with the advice you have been given about what you can
do after this course or activity?
OFSTED Grade (Awarded from 2012/13) % of Respondents Scoring 8 or More
Outstanding 18,856 8.0 67%
Good 219,022 8.2 71%
Requires Improvement 60,355 7.9 66%
Inadequate 8,940 7.8 62%
Base Mean Score

LEP areas (1)How satisfied or dissatisfied are you with the advice you have been given about what you can
do after this course or activity?
LEP Area % of Respondents Scoring 8 or More
Liverpool City Region 9,451 8.6 78%
North East 18,622 8.6 78%
Tees Valley 6,365 8.5 77%
Black Country 9,754 8.4 75%
Humber 6,166 8.3 74%
Leeds City Region 16,176 8.3 73%
Lancashire 11,719 8.3 73%
Sheffield City Region 12,824 8.3 73%
Greater Birmingham and Solihull 15,202 8.2 72%
Stoke-on-Trent and Staffordshire 8,086 8.2 72%
Cornwall and Isles of Scilly 2,784 8.2 72%
Greater Manchester 19,965 8.2 71%
York, North Yorkshire and East Riding 6,443 8.2 71%
Greater Lincolnshire 6,647 8.2 71%
London 42,661 8.2 70%
Derby, Derbyshire, Nottingham and Nottinghamshire 16,365 8.1 70%
Dorset 3,978 8.1 69%
Coventry and Warwickshire 6,083 8.1 70%
Base Mean Score

LEP areas (2)
Learner Satisfaction 2016 to 2017
How satisfied or dissatisfied are you with the advice you have been given about what you can
do after this course or activity?
LEP Area % of Respondents Scoring 8 or More
The Marches 4,759 8.1 69%
Leicester and Leicestershire 6,132 8.1 68%
Solent 6,422 8.1 68%
Cumbria 3,675 8.0 68%
Cheshire and Warrington 6,386 8.0 67%
Heart of the South West 12,358 8.0 66%
South East 21,458 8.0 67%
Coast to Capital 8,739 8.0 66%
Thames Valley Berkshire 5,238 8.0 67%
Worcestershire 2,534 8.0 66%
Enterprise M3 7,690 7.9 65%
New Anglia 11,079 7.9 64%
Hertfordshire 6,161 7.9 63%
West of England 6,592 7.9 64%
Oxfordshire 2,980 7.9 64%
Buckinghamshire Thames Valley 3,142 7.8 64%
South East Midlands 11,387 7.8 63%
Greater Cambridge and Greater Peterborough 9,162 7.7 62%
Swindon and Wiltshire 3,463 7.7 61%
Gloucestershire 3,360 7.7 61%
Base Mean Score

Question 4: How satisfied or
dissatisfied are you with the support
you get on this course or activity?

Key findings 1
• 80% of female respondents gave a satisfaction score of 8
or higher when asked about the support they get on their
course or programme compared to 76% of males.
• Organisation’s with higher OFSTED grades had higher
levels of satisfaction.
• Learners studying at Level 3+ gave lower satisfaction
scores than those on lower levels.
Key findings 2
• The older the respondents were, the more likely they were
to be satisfied with the support given to them on their
course or programme. 70% of respondents aged 16-18
gave a score of 8 or more compared to over 94% of those
aged over 60.

Age band and sex
Learner Satisfaction 2016 to 2017
How satisfied or dissatisfied are you with the support you get on this course or activity?
Age Band % of Respondents Scoring 8 or More
16-18 180,274 8.1 70%
19-24 54,791 8.7 80%
25-34 38,030 9.1 88%
35-44 28,352 9.2 90%
45-59 26,556 9.2 90%
60+ 12,612 9.5 94%
Base Mean Score
Sex % of Respondents Scoring 8 or More
Female 182,257 8.6 80%
Male 158,358 8.4 76%
Base Mean Score

Learner’s highest level
Learner Satisfaction 2016 to 2017
Level 1 or below includes No Level / Unknown Level
How satisfied or dissatisfied are you with the support you get on this course or activity?
Highest Level of Learning % of Respondents Scoring 8 or More
Level 1 or Below 72,401 9.1 88%
Level 2 122,556 8.6 80%
Level 3+ 145,658 8.2 71%
Base Mean Score
The learners highest level of learning is the highest level of qualification taken by a learner within the
survey period
1
1
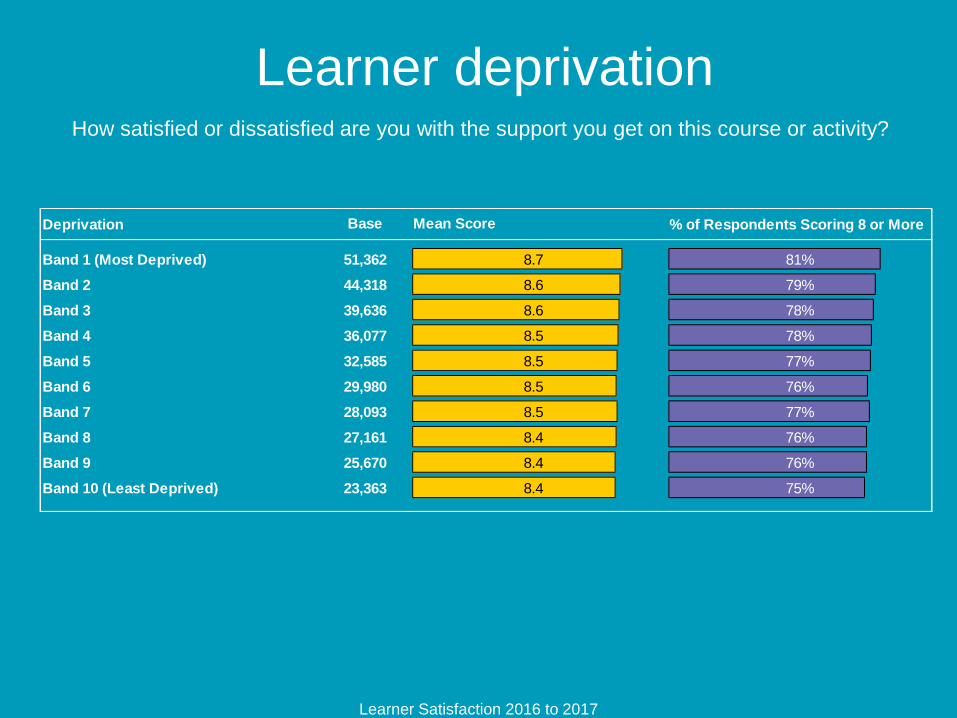
Learner deprivation
Learner Satisfaction 2016 to 2017
How satisfied or dissatisfied are you with the support you get on this course or activity?
Deprivation % of Respondents Scoring 8 or More
Band 1 (Most Deprived) 51,362 8.7 81%
Band 2 44,318 8.6 79%
Band 3 39,636 8.6 78%
Band 4 36,077 8.5 78%
Band 5 32,585 8.5 77%
Band 6 29,980 8.5 76%
Band 7 28,093 8.5 77%
Band 8 27,161 8.4 76%
Band 9 25,670 8.4 76%
Band 10 (Least Deprived) 23,363 8.4 75%
Base Mean Score

Funding stream
Learner Satisfaction 2016 to 2017
How satisfied or dissatisfied are you with the support you get on this course or activity?
Funding Stream % of Respondents Scoring 8 or More
16-18 Apprenticeships 35,416 8.6 79%
16-18 Classroom Learning 157,740 8.1 69%
19+ Apprenticeships 60,738 9.0 87%
19+ Classroom Learning 91,635 9.1 87%
Base Mean Score

Provider type and size
Learner Satisfaction 2016 to 2017
How satisfied or dissatisfied are you with the support you get on this course or activity?
Provider Type % of Respondents Scoring 8 or More
General FE College incl Tertiary 189,264 8.2 72%
Other Public Funded e.g. LAs and HE 49,912 9.1 89%
Private Sector Public Funded 87,560 8.9 86%
Special & Specialist Designated Colleges 13,879 8.2 70%
Base Mean Score
Provider Type Size % of Respondents Scoring 8 or More
Large (7,000+ learners) 61,663 8.2 71%
Medium (4,000-7,000) 75,841 8.3 72%
Small (<4,000) 51,760 8.2 72%
Large (2,000+ learners) 26,397 9.2 90%
Medium (500-2,000) 20,299 9.2 89%
Small (<500) 3,216 8.7 80%
Large (2,000+ learners) 25,724 8.9 85%
Medium (500-2,000) 41,192 9.0 87%
Small (<500) 20,644 8.8 84%
Large (2,500+ learners) 9,352 8.2 72%
Medium (1,000-2,500) 4,136 8.0 67%
Small (<1,000) 391 8.6 77%
General FE College
incl Tertiary
Other Public
Funded e.g. LAs
and HE
Private Sector
Public Funded
Special & Specialist
Designated
Colleges
Base Mean Score

OFSTED grade
Learner Satisfaction 2016 to 2017
How satisfied or dissatisfied are you with the support you get on this course or activity?
OFSTED Grade (Awarded from 2012/13) % of Respondents Scoring 8 or More
Outstanding 18,856 8.5 77%
Good 219,022 8.6 79%
Requires Improvement 60,355 8.3 73%
Inadequate 8,940 8.2 71%
Base Mean Score

LEP areas (1)How satisfied or dissatisfied are you with the support you get on this course or activity?
LEP Area % of Respondents Scoring 8 or More
Tees Valley 6,365 9.0 86%
North East 18,622 8.9 85%
Liverpool City Region 9,451 8.9 85%
Black Country 9,754 8.8 82%
Humber 6,166 8.7 82%
Leeds City Region 16,176 8.7 81%
Cornwall and Isles of Scilly 2,784 8.7 82%
York, North Yorkshire and East Riding 6,443 8.7 80%
Lancashire 11,719 8.6 79%
Dorset 3,978 8.6 79%
Sheffield City Region 12,824 8.6 79%
Stoke-on-Trent and Staffordshire 8,086 8.6 80%
Greater Lincolnshire 6,647 8.6 79%
Greater Birmingham and Solihull 15,202 8.6 78%
Greater Manchester 19,965 8.6 78%
Derby, Derbyshire, Nottingham and Nottinghamshire 16,365 8.6 78%
Leicester and Leicestershire 6,132 8.6 77%
Coventry and Warwickshire 6,083 8.5 78%
The Marches 4,759 8.5 79%
Base Mean Score
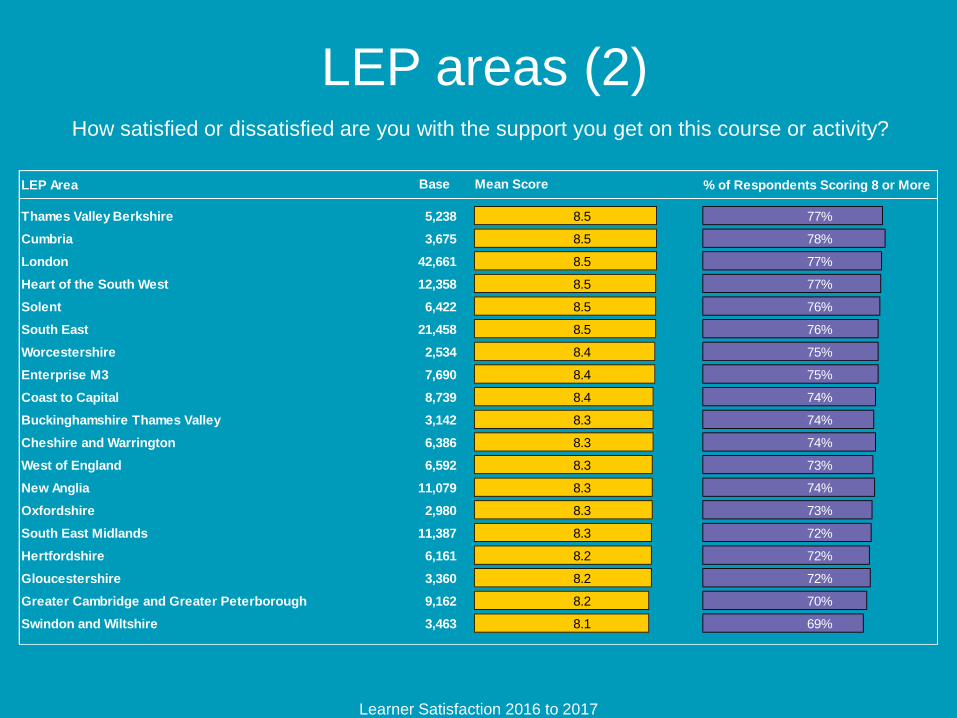
LEP areas (2)
Learner Satisfaction 2016 to 2017
How satisfied or dissatisfied are you with the support you get on this course or activity?
LEP Area % of Respondents Scoring 8 or More
Thames Valley Berkshire 5,238 8.5 77%
Cumbria 3,675 8.5 78%
London 42,661 8.5 77%
Heart of the South West 12,358 8.5 77%
Solent 6,422 8.5 76%
South East 21,458 8.5 76%
Worcestershire 2,534 8.4 75%
Enterprise M3 7,690 8.4 75%
Coast to Capital 8,739 8.4 74%
Buckinghamshire Thames Valley 3,142 8.3 74%
Cheshire and Warrington 6,386 8.3 74%
West of England 6,592 8.3 73%
New Anglia 11,079 8.3 74%
Oxfordshire 2,980 8.3 73%
South East Midlands 11,387 8.3 72%
Hertfordshire 6,161 8.2 72%
Gloucestershire 3,360 8.2 72%
Greater Cambridge and Greater Peterborough 9,162 8.2 70%
Swindon and Wiltshire 3,463 8.1 69%
Base Mean Score

Question 5: How satisfied or
dissatisfied are you that the course or
activity is meeting your expectations?
Key findings 1
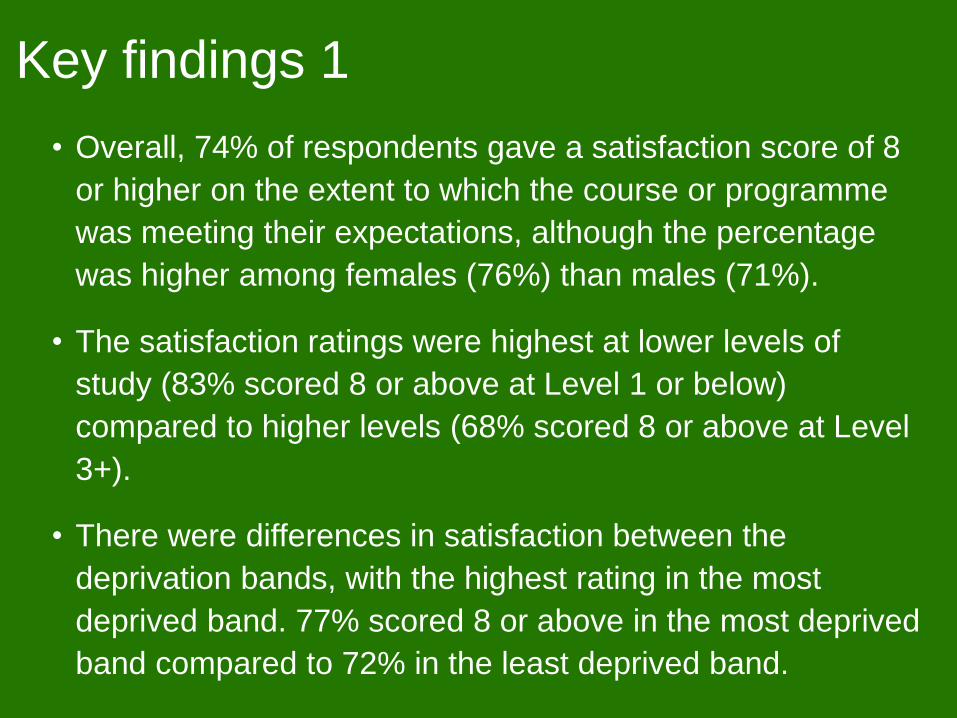
• Overall, 74% of respondents gave a satisfaction score of 8
or higher on the extent to which the course or programme
was meeting their expectations, although the percentage
was higher among females (76%) than males (71%).
• The satisfaction ratings were highest at lower levels of
study (83% scored 8 or above at Level 1 or below)
compared to higher levels (68% scored 8 or above at Level
3+).
• There were differences in satisfaction between the
deprivation bands, with the highest rating in the most
deprived band. 77% scored 8 or above in the most deprived
band compared to 72% in the least deprived band.

Key findings 2
• Respondents in Tees Valley, North East and Liverpool City
Region LEP areas had the highest level of satisfaction with
their course or programme living up to expectations (80%
scored 8 or above) whereas respondents in the Swindon
and Wiltshire LEP area were the least satisfied (65%
scored 8 or above).

Age band and sex
Learner Satisfaction 2016 to 2017
How satisfied or dissatisfied are you that the course or activity is meeting your expectations?
Age Band % of Respondents Scoring 8 or More
16-18 180,274 7.9 65%
19-24 54,791 8.4 76%
25-34 38,030 8.9 84%
35-44 28,352 8.9 86%
45-59 26,556 9.0 87%
60+ 12,612 9.3 92%
Base Mean Score
Sex % of Respondents Scoring 8 or More
Female 182,257 8.4 76%
Male 158,358 8.2 71%
Base Mean Score

Learner’s highest level
Learner Satisfaction 2016 to 2017
Level 1 or below includes No Level / Unknown Level
How satisfied or dissatisfied are you that the course or activity is meeting your expectations?
Highest Level of Learning % of Respondents Scoring 8 or More
Level 1 or Below 72,401 8.8 83%
Level 2 122,556 8.4 75%
Level 3+ 145,658 8.0 68%
Base Mean Score
The learners highest level of learning is the highest level of qualification taken by a learner within the
survey period
1
1

Learner deprivation
Learner Satisfaction 2016 to 2017
How satisfied or dissatisfied are you that the course or activity is meeting your expectations?
Deprivation % of Respondents Scoring 8 or More
Band 1 (Most Deprived) 51,362 8.5 77%
Band 2 44,318 8.4 75%
Band 3 39,636 8.3 74%
Band 4 36,077 8.3 73%
Band 5 32,585 8.3 73%
Band 6 29,980 8.2 72%
Band 7 28,093 8.2 73%
Band 8 27,161 8.2 72%
Band 9 25,670 8.2 72%
Band 10 (Least Deprived) 23,363 8.2 72%
Base Mean Score

Funding stream
Learner Satisfaction 2016 to 2017
How satisfied or dissatisfied are you that the course or activity is meeting your expectations?
Funding Stream % of Respondents Scoring 8 or More
16-18 Apprenticeships 35,416 8.3 75%
16-18 Classroom Learning 157,740 7.8 64%
19+ Apprenticeships 60,738 8.7 83%
19+ Classroom Learning 91,635 8.9 84%
Base Mean Score

Provider type and size
Learner Satisfaction 2016 to 2017
How satisfied or dissatisfied are you that the course or activity is meeting your expectations?
Provider Type % of Respondents Scoring 8 or More
General FE College incl Tertiary 189,264 8.0 67%
Other Public Funded e.g. LAs and HE 49,912 8.9 85%
Private Sector Public Funded 87,560 8.7 82%
Special & Specialist Designated Colleges 13,879 8.0 67%
Base Mean Score
Provider Type Size % of Respondents Scoring 8 or More
Large (7,000+ learners) 61,663 8.0 67%
Medium (4,000-7,000) 75,841 8.0 68%
Small (<4,000) 51,760 8.0 67%
Large (2,000+ learners) 26,397 9.0 86%
Medium (500-2,000) 20,299 9.0 86%
Small (<500) 3,216 8.5 77%
Large (2,000+ learners) 25,724 8.6 81%
Medium (500-2,000) 41,192 8.8 83%
Small (<500) 20,644 8.6 80%
Large (2,500+ learners) 9,352 8.1 68%
Medium (1,000-2,500) 4,136 7.7 63%
Small (<1,000) 391 8.3 72%
General FE College
incl Tertiary
Other Public
Funded e.g. LAs
and HE
Private Sector
Public Funded
Special & Specialist
Designated
Colleges
Base Mean Score

OFSTED grade
Learner Satisfaction 2016 to 2017
How satisfied or dissatisfied are you that the course or activity is meeting your expectations?
OFSTED Grade (Awarded from 2012/13) % of Respondents Scoring 8 or More
Outstanding 18,856 8.2 72%
Good 219,022 8.4 75%
Requires Improvement 60,355 8.0 68%
Inadequate 8,940 8.0 66%
Base Mean Score

LEP areas (1)How satisfied or dissatisfied are you that the course or activity is meeting your expectations?
LEP Area % of Respondents Scoring 8 or More
Tees Valley 6,365 8.7 81%
North East 18,622 8.7 81%
Liverpool City Region 9,451 8.7 81%
Black Country 9,754 8.6 79%
Leeds City Region 16,176 8.5 78%
Humber 6,166 8.5 78%
Cornwall and Isles of Scilly 2,784 8.5 77%
York, North Yorkshire and East Riding 6,443 8.4 77%
Sheffield City Region 12,824 8.4 76%
Lancashire 11,719 8.4 75%
Stoke-on-Trent and Staffordshire 8,086 8.4 75%
Dorset 3,978 8.4 75%
Derby, Derbyshire, Nottingham and Nottinghamshire 16,365 8.4 75%
Greater Lincolnshire 6,647 8.4 74%
Greater Birmingham and Solihull 15,202 8.3 74%
Leicester and Leicestershire 6,132 8.3 74%
Coventry and Warwickshire 6,083 8.3 73%
The Marches 4,759 8.3 74%
Thames Valley Berkshire 5,238 8.3 73%
Base Mean Score
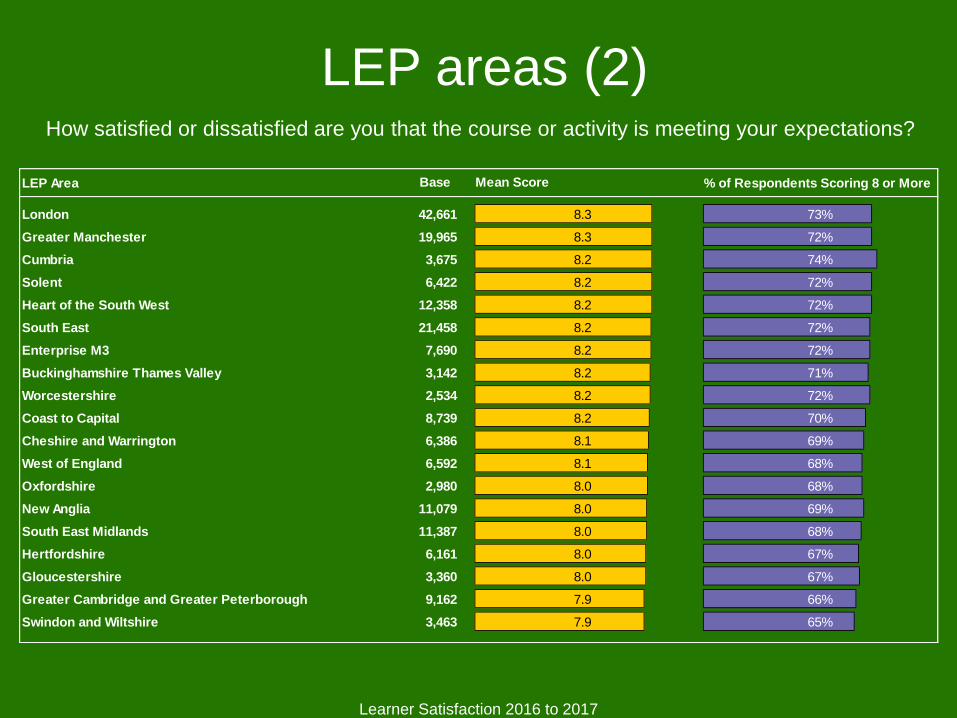
LEP areas (2)How satisfied or dissatisfied are you that the course or activity is meeting your expectations?
Learner Satisfaction 2016 to 2017
LEP Area % of Respondents Scoring 8 or More
London 42,661 8.3 73%
Greater Manchester 19,965 8.3 72%
Cumbria 3,675 8.2 74%
Solent 6,422 8.2 72%
Heart of the South West 12,358 8.2 72%
South East 21,458 8.2 72%
Enterprise M3 7,690 8.2 72%
Buckinghamshire Thames Valley 3,142 8.2 71%
Worcestershire 2,534 8.2 72%
Coast to Capital 8,739 8.2 70%
Cheshire and Warrington 6,386 8.1 69%
West of England 6,592 8.1 68%
Oxfordshire 2,980 8.0 68%
New Anglia 11,079 8.0 69%
South East Midlands 11,387 8.0 68%
Hertfordshire 6,161 8.0 67%
Gloucestershire 3,360 8.0 67%
Greater Cambridge and Greater Peterborough 9,162 7.9 66%
Swindon and Wiltshire 3,463 7.9 65%
Base Mean Score

Question 6: How satisfied or
dissatisfied are you that your learning
provider responds to the views of
learners?

Key findings 1
• Older learners tended to be more satisfied that their
learning provider responds to the views of learners. 92%
of those respondents aged 60 and over gave a score of 8
or higher compared to 79% of 19-24 year olds and 67% of
respondents aged 16-18.
• 87% of respondents who attended ‘Other Public Funded’
providers and 85% who attended ‘Private Sector Public
Funded’ providers scored 8 or more, compared to 69% for
General FE Colleges and 68% for Special Colleges &
SDCs.

Key findings 2
• Respondents living in more deprived areas were more
satisfied that their learning provider responds to the views
of learners than those living in less deprived areas.

Age band and sex
Learner Satisfaction 2016 to 2017
How satisfied or dissatisfied are you that your learning provider responds to the views of
learners?
Age Band % of Respondents Scoring 8 or More
16-18 180,274 8.0 67%
19-24 54,791 8.6 79%
25-34 38,030 9.1 88%
35-44 28,352 9.1 89%
45-59 26,556 9.2 89%
60+ 12,612 9.3 92%
Base Mean Score
Sex % of Respondents Scoring 8 or More
Female 182,257 8.5 77%
Male 158,358 8.3 73%
Base Mean Score

Learner’s highest level
Learner Satisfaction 2016 to 2017
Level 1 or below includes No Level / Unknown Level
How satisfied or dissatisfied are you that your learning provider responds to the views of
learners?
Highest Level of Learning % of Respondents Scoring 8 or More
Level 1 or Below 72,401 8.9 85%
Level 2 122,556 8.5 77%
Level 3+ 145,658 8.1 69%
Base Mean Score
The learners highest level of learning is the highest level of qualification taken by a learner within the
survey period
1
1

Learner deprivation
Learner Satisfaction 2016 to 2017
How satisfied or dissatisfied are you that your learning provider responds to the views of
learners?
Deprivation % of Respondents Scoring 8 or More
Band 1 (Most Deprived) 51,362 8.6 79%
Band 2 44,318 8.5 77%
Band 3 39,636 8.5 76%
Band 4 36,077 8.4 76%
Band 5 32,585 8.4 75%
Band 6 29,980 8.4 74%
Band 7 28,093 8.3 74%
Band 8 27,161 8.3 73%
Band 9 25,670 8.3 73%
Band 10 (Least Deprived) 23,363 8.3 72%
Base Mean Score

Funding stream
Learner Satisfaction 2016 to 2017
How satisfied or dissatisfied are you that your learning provider responds to the views of
learners?
Funding Stream % of Respondents Scoring 8 or More
16-18 Apprenticeships 35,416 8.5 78%
16-18 Classroom Learning 157,740 7.9 65%
19+ Apprenticeships 60,738 9.0 86%
19+ Classroom Learning 91,635 9.0 86%
Base Mean Score

Provider type and size
Learner Satisfaction 2016 to 2017
How satisfied or dissatisfied are you that your learning provider responds to the views of
learners?
Provider Type Size % of Respondents Scoring 8 or More
Large (7,000+ learners) 61,663 8.1 68%
Medium (4,000-7,000) 75,841 8.1 69%
Small (<4,000) 51,760 8.1 68%
Large (2,000+ learners) 26,397 9.1 88%
Medium (500-2,000) 20,299 9.1 87%
Small (<500) 3,216 8.6 78%
Large (2,000+ learners) 25,724 8.9 85%
Medium (500-2,000) 41,192 8.9 86%
Small (<500) 20,644 8.8 83%
Large (2,500+ learners) 9,352 8.1 70%
Medium (1,000-2,500) 4,136 7.8 63%
Small (<1,000) 391 8.6 81%
Base Mean Score
General FE College
incl Tertiary
Other Public
Funded e.g. LAs
and HE
Private Sector
Public Funded
Special & Specialist
Designated
Colleges
Provider Type % of Respondents Scoring 8 or More
General FE College incl Tertiary 189,264 8.1 69%
Other Public Funded e.g. LAs and HE 49,912 9.0 87%
Private Sector Public Funded 87,560 8.9 85%
Special & Specialist Designated Colleges 13,879 8.1 68%
Base Mean Score

OFSTED grade
Learner Satisfaction 2016 to 2017
How satisfied or dissatisfied are you that your learning provider responds to the views of
learners?
OFSTED Grade (Awarded from 2012/13) % of Respondents Scoring 8 or More
Outstanding 18,856 8.4 74%
Good 219,022 8.5 77%
Requires Improvement 60,355 8.2 70%
Inadequate 8,940 8.1 68%
Base Mean Score

LEP areas (1)How satisfied or dissatisfied are you that your learning provider responds to the views of
learners?
LEP Area % of Respondents Scoring 8 or More
Tees Valley 6,365 8.9 84%
North East 18,622 8.8 84%
Liverpool City Region 9,451 8.8 83%
Black Country 9,754 8.7 80%
Leeds City Region 16,176 8.6 79%
Humber 6,166 8.6 80%
Cornwall and Isles of Scilly 2,784 8.6 79%
Lancashire 11,719 8.5 77%
Sheffield City Region 12,824 8.5 78%
Stoke-on-Trent and Staffordshire 8,086 8.5 77%
Greater Birmingham and Solihull 15,202 8.5 77%
York, North Yorkshire and East Riding 6,443 8.5 77%
Dorset 3,978 8.5 77%
Greater Lincolnshire 6,647 8.5 77%
Coventry and Warwickshire 6,083 8.5 76%
Derby, Derbyshire, Nottingham and Nottinghamshire 16,365 8.5 76%
Greater Manchester 19,965 8.4 75%
London 42,661 8.4 75%
Worcestershire 2,534 8.4 75%
Base Mean Score
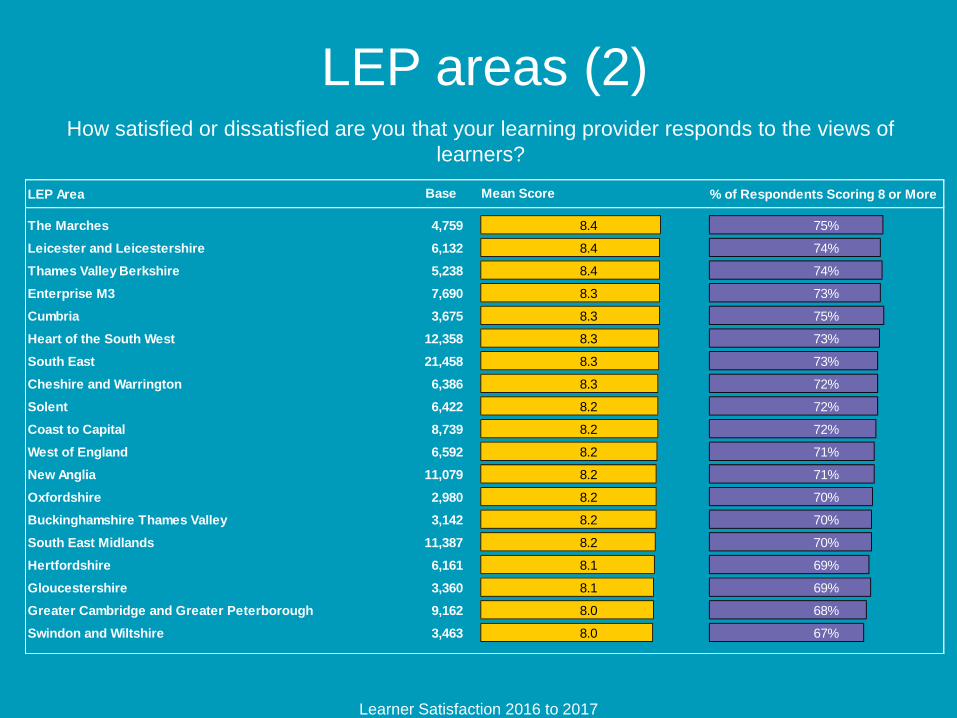
LEP areas (2)
Learner Satisfaction 2016 to 2017
How satisfied or dissatisfied are you that your learning provider responds to the views of
learners?
LEP Area % of Respondents Scoring 8 or More
The Marches 4,759 8.4 75%
Leicester and Leicestershire 6,132 8.4 74%
Thames Valley Berkshire 5,238 8.4 74%
Enterprise M3 7,690 8.3 73%
Cumbria 3,675 8.3 75%
Heart of the South West 12,358 8.3 73%
South East 21,458 8.3 73%
Cheshire and Warrington 6,386 8.3 72%
Solent 6,422 8.2 72%
Coast to Capital 8,739 8.2 72%
West of England 6,592 8.2 71%
New Anglia 11,079 8.2 71%
Oxfordshire 2,980 8.2 70%
Buckinghamshire Thames Valley 3,142 8.2 70%
South East Midlands 11,387 8.2 70%
Hertfordshire 6,161 8.1 69%
Gloucestershire 3,360 8.1 69%
Greater Cambridge and Greater Peterborough 9,162 8.0 68%
Swindon and Wiltshire 3,463 8.0 67%
Base Mean Score
Question 7: Overall, how satisfied or
dissatisfied are you with your learning
provider that provides your learning?
Key findings 1
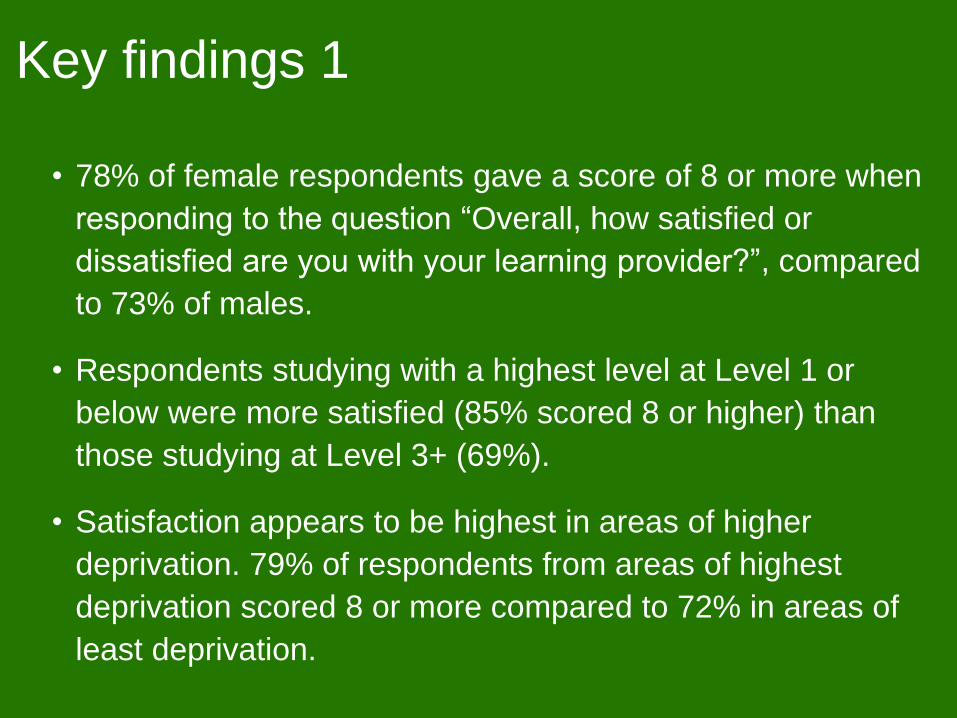
• 78% of female respondents gave a score of 8 or more when
responding to the question “Overall, how satisfied or
dissatisfied are you with your learning provider?”, compared
to 73% of males.
• Respondents studying with a highest level at Level 1 or
below were more satisfied (85% scored 8 or higher) than
those studying at Level 3+ (69%).
• Satisfaction appears to be highest in areas of higher
deprivation. 79% of respondents from areas of highest
deprivation scored 8 or more compared to 72% in areas of
least deprivation.

Key findings 2
• Learning providers with OFSTED grades of “Outstanding”
had the most satisfied learners with 77% giving a
satisfaction score of 8 or higher. This compares with 66% of
respondents from learning providers with “Inadequate”
grades.

Age band and sex
Learner Satisfaction 2016 to 2017
Overall, how satisfied or dissatisfied are you with your learning provider?
Age Band % of Respondents Scoring 8 or More
16-18 180,274 8.0 67%
19-24 54,791 8.6 79%
25-34 38,030 9.0 87%
35-44 28,352 9.1 88%
45-59 26,556 9.1 89%
60+ 12,612 9.1 89%
Base Mean Score
Sex % of Respondents Scoring 8 or More
Female 182,257 8.5 78%
Male 158,358 8.2 73%
Base Mean Score

Learner’s highest level
Learner Satisfaction 2016 to 2017
Level 1 or below includes No Level / Unknown Level
Overall, how satisfied or dissatisfied are you with your learning provider?
Highest Level of Learning % of Respondents Scoring 8 or More
Level 1 or Below 72,401 8.9 85%
Level 2 122,556 8.5 77%
Level 3+ 145,658 8.1 69%
Base Mean Score
The learners highest level of learning is the highest level of qualification taken by a learner within the
survey period
1
1
Learner deprivation
Learner Satisfaction 2016 to 2017
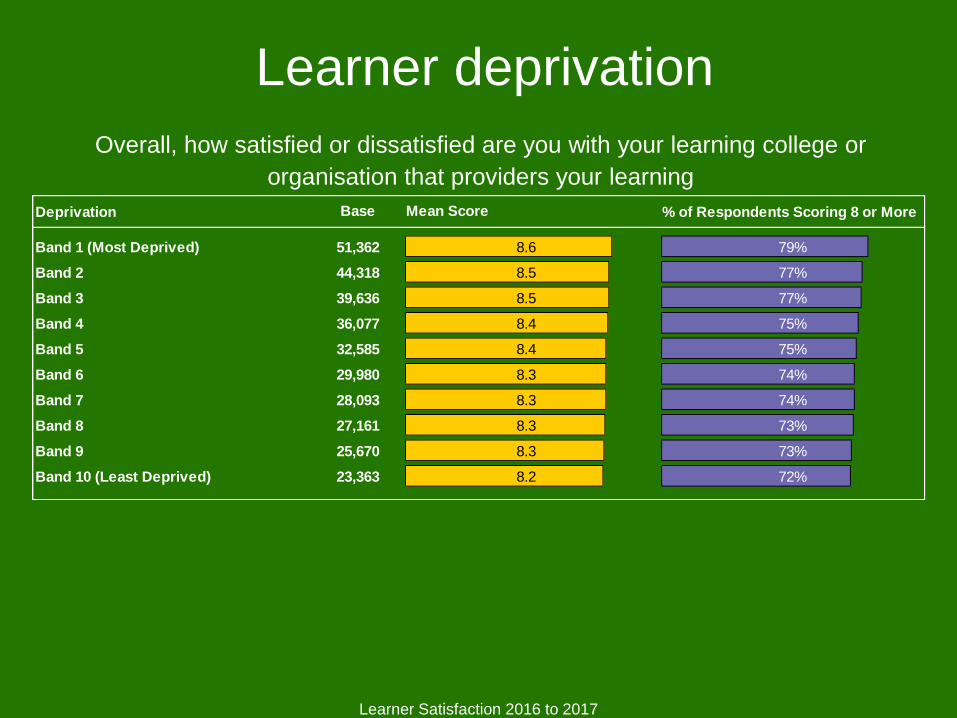
Overall, how satisfied or dissatisfied are you with your learning college or
organisation that providers your learning
Deprivation % of Respondents Scoring 8 or More
Band 1 (Most Deprived) 51,362 8.6 79%
Band 2 44,318 8.5 77%
Band 3 39,636 8.5 77%
Band 4 36,077 8.4 75%
Band 5 32,585 8.4 75%
Band 6 29,980 8.3 74%
Band 7 28,093 8.3 74%
Band 8 27,161 8.3 73%
Band 9 25,670 8.3 73%
Band 10 (Least Deprived) 23,363 8.2 72%
Base Mean Score

Funding stream
Learner Satisfaction 2016 to 2017
Overall, how satisfied or dissatisfied are you with your learning college or
organisation that providers your learning
Funding Stream % of Respondents Scoring 8 or More
16-18 Apprenticeships 35,416 8.6 80%
16-18 Classroom Learning 157,740 7.8 64%
19+ Apprenticeships 60,738 9.0 87%
19+ Classroom Learning 91,635 8.9 85%
Base Mean Score

Provider type and size
Learner Satisfaction 2016 to 2017
Provider Type % of Respondents Scoring 8 or More
General FE College incl Tertiary 189,264 8.0 68%
Other Public Funded e.g. LAs and HE 49,912 9.0 87%
Private Sector Public Funded 87,560 8.9 86%
Special & Specialist Designated Colleges 13,879 8.0 68%
Base Mean Score
Overall, how satisfied or dissatisfied are you with your learning college or
organisation that providers your learning
Provider Type Size % of Respondents Scoring 8 or More
Large (7,000+ learners) 61,663 8.0 69%
Medium (4,000-7,000) 75,841 8.1 69%
Small (<4,000) 51,760 8.0 67%
Large (2,000+ learners) 26,397 9.0 87%
Medium (500-2,000) 20,299 9.0 87%
Small (<500) 3,216 8.8 82%
Large (2,000+ learners) 25,724 8.9 85%
Medium (500-2,000) 41,192 9.0 87%
Small (<500) 20,644 8.8 84%
Large (2,500+ learners) 9,352 8.1 69%
Medium (1,000-2,500) 4,136 7.8 64%
Small (<1,000) 391 8.7 84%
Base Mean Score
Private Sector
Public Funded
Special & Specialist
Designated
Colleges
General FE College
incl Tertiary
Other Public
Funded e.g. LAs
and HE

OFSTED grade
Learner Satisfaction 2016 to 2017
OFSTED Grade (Awarded from 2012/13) % of Respondents Scoring 8 or More
Outstanding 18,856 8.4 77%
Good 219,022 8.5 77%
Requires Improvement 60,355 8.1 69%
Inadequate 8,940 7.9 66%
Base Mean Score
Overall, how satisfied or dissatisfied are you with your learning college or
organisation that providers your learning

LEP areas (1)
LEP Area % of Respondents Scoring 8 or More
North East 18,622 8.8 84%
Tees Valley 6,365 8.8 83%
Liverpool City Region 9,451 8.8 83%
Cornwall and Isles of Scilly 2,784 8.7 82%
Black Country 9,754 8.7 81%
Leeds City Region 16,176 8.6 80%
Humber 6,166 8.6 79%
York, North Yorkshire and East Riding 6,443 8.5 78%
Lancashire 11,719 8.5 77%
Sheffield City Region 12,824 8.5 78%
Dorset 3,978 8.5 77%
Greater Lincolnshire 6,647 8.5 77%
Derby, Derbyshire, Nottingham and Nottinghamshire 16,365 8.5 76%
Stoke-on-Trent and Staffordshire 8,086 8.4 76%
Greater Birmingham and Solihull 15,202 8.4 76%
Solent 6,422 8.4 76%
Leicester and Leicestershire 6,132 8.4 75%
Greater Manchester 19,965 8.4 75%
Heart of the South West 12,358 8.4 75%
Base Mean Score
Overall, how satisfied or dissatisfied are you with your learning college or
organisation that providers your learning
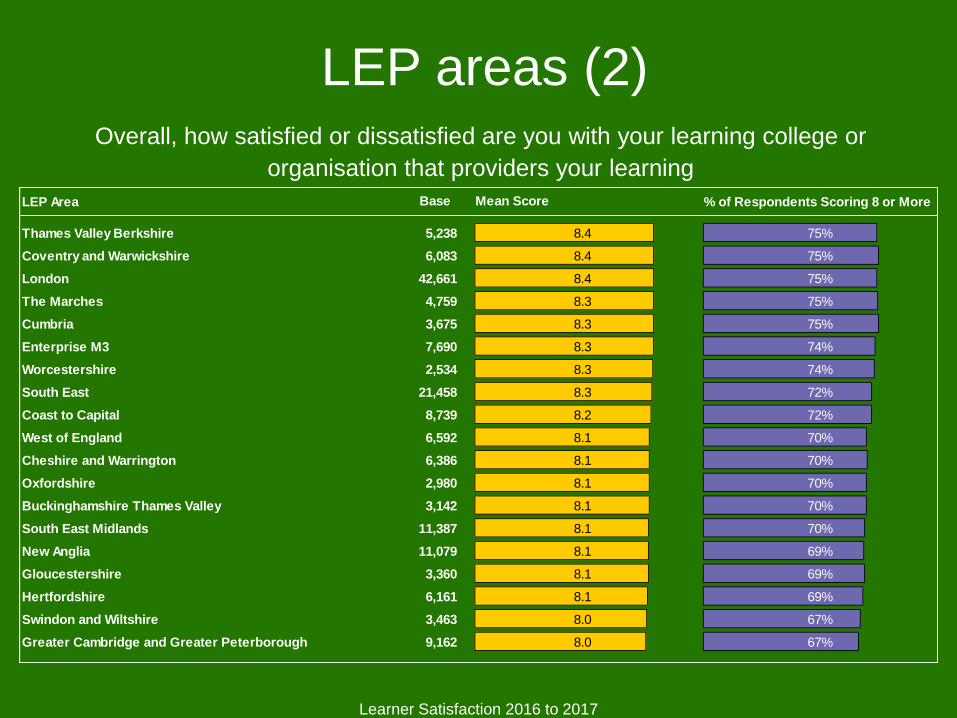
LEP areas (2)
Learner Satisfaction 2016 to 2017
LEP Area % of Respondents Scoring 8 or More
Thames Valley Berkshire 5,238 8.4 75%
Coventry and Warwickshire 6,083 8.4 75%
London 42,661 8.4 75%
The Marches 4,759 8.3 75%
Cumbria 3,675 8.3 75%
Enterprise M3 7,690 8.3 74%
Worcestershire 2,534 8.3 74%
South East 21,458 8.3 72%
Coast to Capital 8,739 8.2 72%
West of England 6,592 8.1 70%
Cheshire and Warrington 6,386 8.1 70%
Oxfordshire 2,980 8.1 70%
Buckinghamshire Thames Valley 3,142 8.1 70%
South East Midlands 11,387 8.1 70%
New Anglia 11,079 8.1 69%
Gloucestershire 3,360 8.1 69%
Hertfordshire 6,161 8.1 69%
Swindon and Wiltshire 3,463 8.0 67%
Greater Cambridge and Greater Peterborough 9,162 8.0 67%
Base Mean Score
Overall, how satisfied or dissatisfied are you with your learning college or
organisation that providers your learning
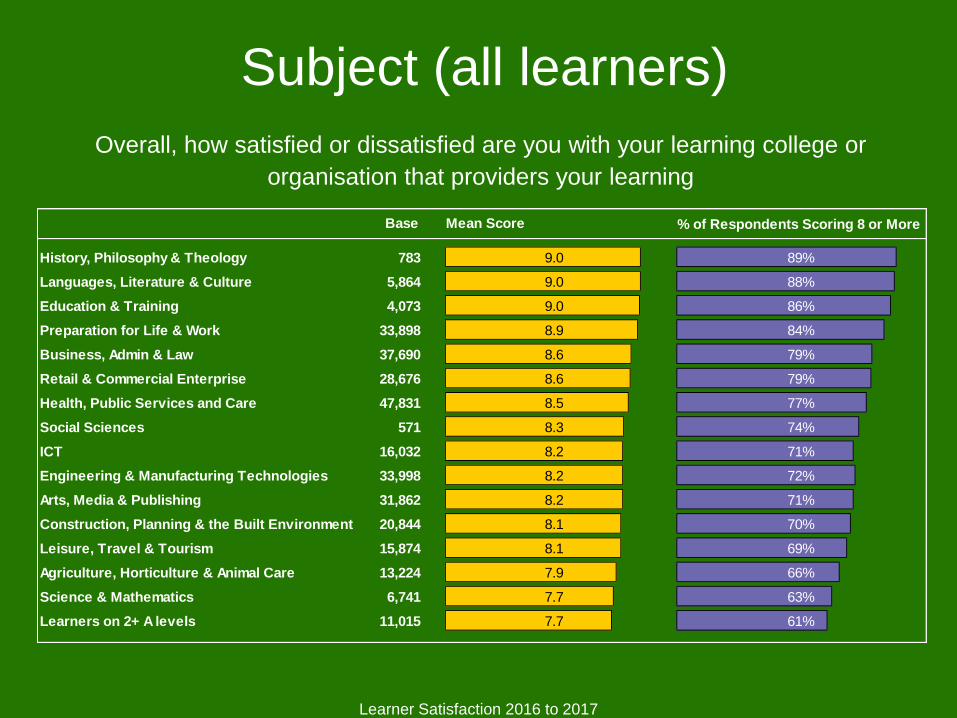
Subject (all learners)
Learner Satisfaction 2016 to 2017
Overall, how satisfied or dissatisfied are you with your learning college or
organisation that providers your learning
% of Respondents Scoring 8 or More
History, Philosophy & Theology 783 9.0 89%
Languages, Literature & Culture 5,864 9.0 88%
Education & Training 4,073 9.0 86%
Preparation for Life & Work 33,898 8.9 84%
Business, Admin & Law 37,690 8.6 79%
Retail & Commercial Enterprise 28,676 8.6 79%
Health, Public Services and Care 47,831 8.5 77%
Social Sciences 571 8.3 74%
ICT 16,032 8.2 71%
Engineering & Manufacturing Technologies 33,998 8.2 72%
Arts, Media & Publishing 31,862 8.2 71%
Construction, Planning & the Built Environment 20,844 8.1 70%
Leisure, Travel & Tourism 15,874 8.1 69%
Agriculture, Horticulture & Animal Care 13,224 7.9 66%
Science & Mathematics 6,741 7.7 63%
Learners on 2+ A levels 11,015 7.7 61%
Base Mean Score

Apprenticeship frameworks
Framework % of Respondents Scoring 8 or More
Hospitality and Catering 2,381 9.3 93%
Retailing and Wholesaling 990 9.3 93%
Health and Social Care 16,301 9.3 92%
Service Enterprises 6,314 9.2 92%
Business Management 7,091 9.1 90%
Warehousing and Distribution 1,468 9.1 88%
Child Development and Well Being 4,163 9.0 86%
Animal Care and Veterinary Science 1,630 8.9 86%
Sport, Leisure and Recreation 1,858 8.9 87%
ICT for Users 536 8.9 85%
Administration 15,936 8.9 85%
Agriculture 539 8.9 88%
Direct Learning Support 1,271 8.8 85%
Horticulture and Forestry 567 8.8 84%
Transportation Operations and Maintenance 5,358 8.6 81%
Marketing and Sales 914 8.6 79%
Manufacturing Technologies 10,650 8.4 76%
Building and Construction 5,033 8.4 77%
Engineering 3,124 8.3 76%
ICT Practitioners 1,563 8.2 73%
Accounting and Finance 2,764 8.2 73%
Base Mean Score

Question 8: How likely is it that you
would recommend the learning
provider to friends or family?

Key findings 1
• Learners taking science and maths courses were the least
likely to recommend their learning provider.
• Among the respondents taking apprenticeships, those
taking ICT Practitioner frameworks were the least likely to
recommend their learning provider.
• Older learners, aged 25 and over, were much more likely
to recommend their learning provider to friends or family
compared to those aged under 25.

Key findings 2
• 87% of female learners were likely to recommend their
course or programme compared to 79% of male learners.
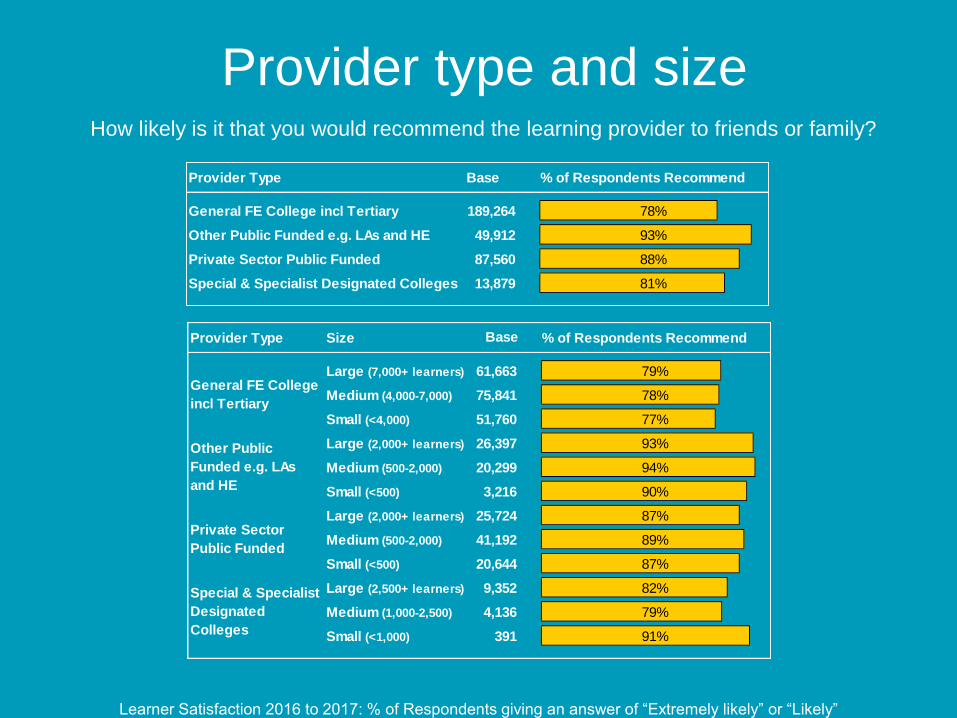
• 93% of respondents who attended ‘Other Public Funded’
providers and 88% who attended ‘Private Sector Public
Funded’ organisations would recommend their provider,
compared to 78% of those attending General FE Colleges
and 81% of those attending Special Colleges & SDCs.

Age band and sex
Learner Satisfaction 2016 to 2017: % of Respondents giving an answer of “Extremely likely” or “Likely”
How likely is it that you would recommend the learning provider to friends or family?
Sex % of Respondents Recommend
Female 182,257 87%
Male 158,358 79%
Base
Age Band % of Respondents Recommend
16-18 180,274 76%
19-24 54,791 84%
25-34 38,030 93%
35-44 28,352 94%
45-59 26,556 93%
60+ 12,612 94%
Base

Learner’s highest level
Learner Satisfaction 2016 to 2017: % of Respondents giving an answer of “Extremely likely” or “Likely”
Level 1 or below includes No Level / Unknown Level
How likely is it that you would recommend the learning provider to friends or family?
Highest Level of Learning Base % of Respondents Recommend
Level 1 or Below 72,401 92%
Level 2 122,556 83%
Level 3+ 145,658 78%
The learners highest level of learning is the highest level of qualification taken by
a learner within the survey period
1
1

Learner deprivation
Learner Satisfaction 2016 to 2017: % of Respondents giving an answer of “Extremely likely” or “Likely”
How likely is it that you would recommend the learning provider to friends or family?
Deprivation Base % of Respondents Recommend
Band 1 (Most Deprived) 51,362 86%
Band 2 44,318 84%
Band 3 39,636 84%
Band 4 36,077 83%
Band 5 32,585 82%
Band 6 29,980 82%
Band 7 28,093 82%
Band 8 27,161 81%
Band 9 25,670 81%
Band 10 (Least Deprived) 23,363 81%

Funding stream
Learner Satisfaction 2016 to 2017: % of Respondents giving an answer of “Extremely likely” or “Likely”
How likely is it that you would recommend the learning provider to friends or family?
Funding Stream Base % of Respondents Recommend
16-18 Apprenticeships 35,416 82%
16-18 Classroom Learning 157,740 76%
19+ Apprenticeships 60,738 88%
19+ Classroom Learning 91,635 92%
Provider type and size
Learner Satisfaction 2016 to 2017: % of Respondents giving an answer of “Extremely likely” or “Likely”
How likely is it that you would recommend the learning provider to friends or family?
Provider Type Base % of Respondents Recommend
General FE College incl Tertiary 189,264 78%
Other Public Funded e.g. LAs and HE 49,912 93%
Private Sector Public Funded 87,560 88%
Special & Specialist Designated Colleges 13,879 81%
Provider Type Size % of Respondents Recommend
Large (7,000+ learners) 61,663 79%
Medium (4,000-7,000) 75,841 78%
Small (<4,000) 51,760 77%
Large (2,000+ learners) 26,397 93%
Medium (500-2,000) 20,299 94%
Small (<500) 3,216 90%
Large (2,000+ learners) 25,724 87%
Medium (500-2,000) 41,192 89%
Small (<500) 20,644 87%
Large (2,500+ learners) 9,352 82%
Medium (1,000-2,500) 4,136 79%
Small (<1,000) 391 91%
Private Sector
Public Funded
Special & Specialist
Designated
Colleges
Base
General FE College
incl Tertiary
Other Public
Funded e.g. LAs
and HE

OFSTED grade
Learner Satisfaction 2016 to 2017: % of Respondents giving an answer of “Extremely likely” or “Likely”
How likely is it that you would recommend the learning provider to friends or family?
OFSTED Grade (Awarded from 2012/13) % of Respondents Recommend
Outstanding 18,856 85%
Good 219,022 85%
Requires Improvement 60,355 77%
Inadequate 8,940 74%
Base

LEP areas (1)How likely is it that you would recommend the learning provider to friends or family?
Learner Satisfaction 2016 to 2017: % of Respondents giving an answer of “Extremely likely” or “Likely”
LEP Area % of Respondents Recommend
Tees Valley 6,365 88%
Cornwall and Isles of Scilly 2,784 88%
North East 18,622 88%
Black Country 9,754 87%
Liverpool City Region 9,451 87%
Leeds City Region 16,176 85%
Humber 6,166 85%
Dorset 3,978 85%
Heart of the South West 12,358 85%
York, North Yorkshire and East Riding 6,443 84%
London 42,661 84%
Stoke-on-Trent and Staffordshire 8,086 84%
Sheffield City Region 12,824 84%
Greater Lincolnshire 6,647 83%
Enterprise M3 7,690 83%
Cumbria 3,675 83%
Thames Valley Berkshire 5,238 83%
Lancashire 11,719 83%
Leicester and Leicestershire 6,132 83%
Base

LEP areas (2)
Learner Satisfaction 2016 to 2017: % of Respondents giving an answer of “Extremely likely” or “Likely”
How likely is it that you would recommend the learning provider to friends or family?
LEP Area % of Respondents Recommend
Solent 6,422 83%
Derby, Derbyshire, Nottingham and Nottinghamshire 16,365 83%
Coventry and Warwickshire 6,083 83%
Greater Birmingham and Solihull 15,202 83%
The Marches 4,759 82%
Coast to Capital 8,739 81%
South East 21,458 81%
Greater Manchester 19,965 81%
Oxfordshire 2,980 81%
Worcestershire 2,534 80%
Buckinghamshire Thames Valley 3,142 80%
South East Midlands 11,387 79%
West of England 6,592 79%
Gloucestershire 3,360 79%
New Anglia 11,079 79%
Cheshire and Warrington 6,386 79%
Hertfordshire 6,161 78%
Swindon and Wiltshire 3,463 78%
Greater Cambridge and Greater Peterborough 9,162 76%
Base

Subject (all learners)
Learner Satisfaction 2016 to 2017: % of Respondents giving an answer of “Extremely likely” or “Likely”
How likely is it that you would recommend the learning provider to friends or family?
Subject Area Base % of Respondents Recommend
Languages, Literature & Culture 5,864 94%
History, Philosophy & Theology 783 94%
Preparation for Life & Work 33,898 92%
Education & Training 4,073 91%
Social Sciences 571 87%
Retail & Commercial Enterprise 28,676 86%
Health, Public Services and Care 47,831 85%
Business, Admin & Law 37,690 83%
Arts, Media & Publishing 31,862 82%
Agriculture, Horticulture & Animal Care 13,224 79%
Leisure, Travel & Tourism 15,874 79%
ICT 16,032 77%
Engineering & Manufacturing Technologies 33,998 77%
Construction, Planning & the Built Environment 20,844 76%
Learners on 2+ A levels 11,015 75%
Science & Mathematics 6,741 73%

Apprenticeship frameworksHow likely is it that you would recommend the learning provider to friends or family?
Framework % of Respondents Recommend
Health and Social Care 16,301 94%
Hospitality and Catering 2,381 92%
Service Enterprises 6,314 91%
Business Management 7,091 91%
Warehousing and Distribution 1,468 90%
Child Development and Well Being 4,163 89%
Animal Care and Veterinary Science 1,630 89%
Retailing and Wholesaling 990 89%
Direct Learning Support 1,271 87%
Sport, Leisure and Recreation 1,858 86%
Administration 15,936 86%
Horticulture and Forestry 567 86%
ICT for Users 536 85%
Agriculture 539 81%
Transportation Operations and Maintenance 5,358 81%
Marketing and Sales 914 79%
Manufacturing Technologies 10,650 79%
Building and Construction 5,033 78%
Accounting and Finance 2,764 78%
Engineering 3,124 77%
ICT Practitioners 1,563 76%
Base