learning achievement in primary schools of...
TRANSCRIPT
Learning Achievement in
Primary Schools of Pakistan
A Quest for Quality Education
UNESCO, Islamabad in collaboration with
Ministry of Education Curriculum Wing Govt. of Pakistan

compiled by
Dr. S. M. Aijaz
The author is responsible for the choice, presentation and interpretation of data and information in this report, and for the opinions expressed therein, which are not
necessarily those of UNESCO, or the Ministry of Education, Palustan.
Published by United Nations Educational, Scientific and Cultural Organization
First Floor, Sauai Pak Tower Blue, Area, Islamabad
First Printed - March, 2001 Second Print - August, 2002

CONTENTS
Foreword ... ... ... ...
Acronyms ... ... ... ...
I. INTRODUCTION ... ... ... ... Teaching Learning Process ... ... Teaching-Learning Environment in Primary Schools of Pakistan
(a) Provision of Primary Education in Rural Pakistan (b) Provision of Primary Education in Urban Pakistan
Evaluating learning outcome ... ... (a) Examination ... ... (b) Learning Assessment ... ...
Initiatives for Education Quality for All ... ... Assessment Studies in Pakistan ... ...
II. LEARNING ASSESSMENT A T PRIMARY LEVEL ... Pre-EFA Studies ... ... ... Post-EFA Studies ... ... ... National Level Studies ... ... Methodoloqical Framework of Studies ... ...
0)
(iii)
1 2 3 3 4 6 7 8
1 1 12
13 13 14 14 15
1. Differentia18Achievement of Primary School Children and Cost-Effectiveness by school Types (Undated) ... 16
2. Basic Competencies of Children in Pakistan (1 995). .. 17 3. Determinants of Primary Students’ Achievement (1 995) 20 4. Comparative Analysis of Public, Private and NGO
5. Measuring Learning Achievement at Primary Level Schools (1 999) ... ... 23
in Pakistan (1999) ... ... 24 Provincial Level Studies ... ... 26 Punjab Assessment Studies (1 995-99) ... ... 27
1. The IER Assessment Study under PEP (1995) 27 2. Learning Achievement of Grades 3 to 5 Children of
Kasur District (1 999) ... ... 27 Sindh Assessment Studies (1 996-98) ... ... 28
1. SPEDP studies (1 996-98) ... ... 29 2. Baseline Survey of Learning Achievement (2000) 29

N.W.F.P. Assessment Studies (1995-1999) ... 1. PEDP Assessment Study (1 995-96) ... 2. Learning Achievement of Grade 3 to 5 Children
in Rural Primary Schools (1999) ... ... Balochistan Assessment Studies (1 997- 2000)
1. BPEDP Assessment Study (1 997-98) ... ...
2. Learning Achievement of grade 3 to 5 Children in Rural Primary Schools of District Pishin, Balochistan (1 999) ... ...
Northern Areas Assessment Study (1 999-2000) Features of Assessment Studies ... ... Achievemerlt Level of Primary School Children in Pakistan Assessment Level Target ... ...
...
I l l . QUALITATIVE DATA FROM ASSESSMENT STUDIES ... Head Teachers’ Perceptions ... ... Teachers’ Perceptions ... ... Learning Coordinators’ Perceptions ... Students’ Perception ... ... Parent’s Perceptions ... ...
New Directions ... ... ...
IV. LEARNING ASSESSMENT FOR QUALITY IMPROVEMENT
Making Assessment Work ... ...
ANNEX I. LEARNING ASSESSMENT RESEARCHES IN PAKISTAN AT PRIMARY LEVEL ... ...
29 30
30 31 31
31 32 32 34 35
37 37 39 41 43 43 45 44 51
54-55 ANNEX I I . ABSTRACT OF RESEARCHES ON LEARNING ACHIEVEMENT
OF PRIMARY SCHOOL CHILDREN IN PAKISTAN ... 56-77 ANNEX I l l . AGE OF ENTRY AND DURATION OF PRIMARY
EDUCATION AROUND THE WORLD ... ... 78 REFERENCES ... ... ... 79

LIST OF FIGURES
FIGURE 1.1 FIGURE 1.2 FIGURE 1.3
FIGURE 11.1
FIGURE 11.2
FIGURE 11.3 FIGURE
FIGURE
FIGURE
FIGURE
I .4
1.5
1.6
1.7
FIGURE 11.8
FIGURE 11.9
FIGURE 11.10
FIGURE 11.11
FIGURE 11.12
FIGURE 11.13
FIGURE IV.l FIGURE IV.2.
Basic Teaching-Learning Model . . . ... 2 Primary Education Providers in Pakistan ... 4
Learning Assessment ... ... 10 Distinguishing Features of Examination and
Mean Achievement and Behaviour Scores by Type of School ... ... 16 Percentage of Children Competent in Different
Percentage of Children’s Competencies by Provinces 18 Gender Differences (Girls minus Boys) in Specific
Rural Minus Urban Differences in Specific
Inter-Provincial Differences in Performance of Primary School Children in Different Subjects . . . 21 Gender Differences in Performance of Primary School
Rural minus Urban Difference in Achievement in
Comparative Performance of Students by Types of School and Subjects ... ... 23 Inter-Provincial Differences in Achievement in Different Subjects ... ... 25 Differences in Learning Achievement by Gender And Subject ... ... 25 Rural Minus Urban Differences in Student Performance By Subjects ... ... 26 Estimated National and Provincial Levels of Student
Mastery and Development Learning Outcomes . . . Sample Frame for Learning Assessment Studies
Competencies ... ... 17
Competencies (Percentage of Children) ... 19
Competencies (Percentage of Children) ... 20
Students in Different Subjects . . . ... 22
Different Subjects ... ... 22
Achievement by Subject and Gender ... 35 46 49

LIST OF TABLES
TABLE 11.1 TABLE 11.2 TABLE 11.3 TABLE 11.4
TABLE
TABLE
TABLE
TABLE
TABLE
TABLE
TABLE
I .5
1.6
I .7
I .8
1.9
Average Percentage Scores by subject, grade and province 13 National Average Percentage Scores by Grade and Subject 14 Percentage of Children Competent in Different Provinces Mean Percentage Scores of Rural Students in Punjab
Mean Percentage Scores of Sindh Rural Students by
Mean Percent Scores of N.W.F.P. Students by
Mean Percentage Scores of N.W.F.P. Rural Students by
Range of Scores of Students in Balochistan by Grade
Mean Percentage Scores af Rural Students from Balochistan Students by Subject and Grade . . .
by Subject and Grade ... ...
Subject and Grade ... ...
Subject and Grade ... ...
Subject and Grade ... ...
and Subjects ... ...
1.10 Summary of SubjectdAreas and Grades Tested in
11.1 National Level Assessment Studies ... Reasons Identified by Head Teachers for Poor Student Achievement ... ...
TABLE 111.2 Reasons Identified by Teachers for Poor Student Achieve men t ... ...
TABLE 111.3 Reasons Identified by Learning Coordinators for Poor Student Achievement ... ...
TABLE IV.l Number of Countries with Different Entry Age and Duration of Primary Education ... ...
18
28
29
30
30
31
31
33
38
40
42
52

LIST OF BOXES
BOX 1.1
B O X 1.2
Impressionistic Profile of a Typical Rural Primary School in Pakistan ... I ... 3 Equality of Educational Opportunities: Some are more equal than others ... 6
B O X 11.1 Not by Accident Alone ... ... 34 B O X 111.1 Where Students Closely Follow their Teachers ... 39 BOX 111.2 What Mars the Learning Environment in Schools 42 B O X 111.3 Of Curriculum and Student Achievement ... 44 B O X IV.l Ghost Students in Primary Schools of Pakistan . . . 50
FOREWORD
Nations with social, economic and political vision, invest in education. The 1990 World Declaration on Education for All, highlighted the need to provide ‘useful knowledge, reasoning ability, skills, and values’ to children. Ten years later, the World Education Forum, which met in April 2000 at Dakar, Senegal, reiterated the quality dimension of EFA by putting it forth as one of the six goals of the Dakar Framework of Action.
To facilitate the realization of the goals and commitments made in the 1990 EFA Declaration of Jomtien, U N E S C O has been assisting member states in building their capacity for assessing learning achievement of children, and improving the quality of education at school level. An important global initiative in this area has been the Joint UNESCO-UNICEF Monitoring Learning Achievement Project launched in 1992. In the context of Pakistan, U N E S C O Office, Islamabad, supported the Ministry of Education and provincial Bureaus of Curriculum in undertaking pilot studies on learning assessment, and action research to diagnose the factors affecting quality, and organizing remedial training courses.
The present report is a compendium of all the major initiatives supported by U N E S C O so far in Pakistan on learning assessment. By presenting a synopses of most of the assessment studies conducted and by drawing lessons therefrom, the book is likely to serve as a useful reference for planners of future assessment studies. Besides, the perspectives on various methodological issues may suggest possible lines of action.
The dropout rate at primary level is alarming in the country. According to some studies, less than 40% primary school children could read with comprehension, and one fifth can write a letter. Pakistan will have to develop and institutionalize a system for monitoring the quality of education at primary level. The proposed system will need to address (i) assessment of pupil learning achievement in areas of literacy, numeracy and life skills competencies; and (ii) identification of pupil, teacher, school and community characteristics affecting learning outcomes. Policy decisions on future directions will have to be based on a critical appraisal of what has been done so far and the lessons drawr! from it.
I appreciate and acknowledge the cooperation and assistance of the Curriculum Wing, Ministry of Education and the Provincial Bureaus of Curriculum in planning and completing the assessment studies. My deep recognition goes to Dr. S. M. Aijaz for the painstaking and valuable work done in synthesizing the findings of various studies, with varying objectives and diverse patterns of assessment findings.
(Mrs. Anjum Riyazul Haque) Officer-in-Charge
UNESCO, Islamabad

ACRONYMS
AJK ADEO AEPAM BCDES
BCEC
BCEW
BPEDP BRIDGES
CRDC
DE0 DOE DFlD EFA EMlS FANA FATA ICT IER
LC LM MLA MoE M S U-S AP NAEP NEMIS PED
- Azad Jammu and Kashmir - Assistant District Education Officer - Academy of Educational Planning and Management - Bureau of Curriculum Development and Extension Services, - Bureau of Curriculum and Extension Centre, - Bureau of Curriculum and Extension Wing, - Balochistan Primary Education Development Project - Basic Research and Implementation in Developing Education Systems, Haward Institute of International Development
Department of Education, Lahore, Punjab.
Department of Education, Abbottabad, N.W. F.P.
Department of Education, Quetta, Balochistan.
Department of Education, Jamshoro, Sindh.
- Curriculum Research and Development Centre, - District Education Officer - Department of Education - Department for International Development (UK) - Education for All - Educational Management Information Services - Federally Administered Northern Areas - Federally Administered Tribal Areas - Islamabad Capital Territory - Institute of Education and Researeh, University of the Punjab,
- Learning Coordinator - Learning Module - UNESCO-UNICEF Monitoring of Learning Achievement Project - (Federal) Ministry of Education - Multi-Donor Support Unit for the Social Action Programme - Northern Areas Education Project - National Educational Management Information System - Provincial Education Department
Lahore.
(ii i)

PEDP PEP PLW PMSP SAP SPEDP UNESCO UNICEF
- Primary Education Development Project, Peshawar. - Primary Education Project - Punjab Literacy Watch - Punjab Middle Schooling Project - Social Action Programme - Sindh Primary Education Development Project - United Nations Educational, Scientific and Cultural Organization - United Nations Children’s Fund

INTRODUCTION
In modern societies, education is increasingly being seen as the only effective means of solving social and economic problems. In fact, many developed countries regard education as a means of safeguarding their very existence. “There is no doubt that the future of our State will and must greatly depend upon the type of education we give to our children, ...” stated Quaid-i-Azam Muhammad Ali Jinnah, founder of the nation, in his message to the first Pakistan Education Conference held during November-December 1947 (Pakistan: Ministry of Interior. 1983).
1.2 The importance of education stems from the fact that it develops the mental resources of an individual for living an economically productive life, besides empowering him with the ability to evolve creative and innovative approaches to face new challenges. It is through education that people acquire the competencies required for conflict resolution and stress reduction. Primary education occupies a special nexus both because it provides the individual with fundamental competencies required for higher studies and because it opens up possibilities for further development. That is why there is “now general agreement that the State in its own interests should provide to its boys and girls, universal, compulsory and free basic education, which is the primary requisite of training in democracy,” stated Fazlur Rahman, Education Minister, during his inaugural address at the first Pakistan Education Conference (Pakistan: 1983, p. 9). The article 37 (b) of the Constitution of Pakistan makes the State responsible for provision of free and compulsory education up to secondary level.
1.3 If education is so critical an undertaking, its outcome cannot be left simply to chance. The system must evolve a mechanism for ensuring that those receiving education attain a prescribed minimum level of efficiency in various essential competencies. Examination has always been an integral part of teaching learning process. Assessment of learning outcome, whether through tests, examinations, or anecdotal records, is the means for keeping a watch on the growth of the learner. Attaining desired learning tcomes being so very important, nations invest huge amount of their resou 8 es on their system of education. Assessment of the efficiency and effectiveness of the system thus acquires crucial importance. Learning assessment is increasingly being used, around the world, to identify strengths and weaknesses of the system. Data on important factors affecting learning outcome is collected along with student achievement data to help identify areas needing reform. Improvement/revision of
1

curriculum, textbooks, teacher training, etc. result from analysis of learning assessment data collected periodically.
Teaching-Learning Process
1.4 The basic purpose of the school is to develop certain competencies among students. A teaching-learning model facilitates the understanding of the process through which these competencies are developed. When a pupil enters the school he has already reached a level of development. He brings with him his peculiar intellectual, social, and emotional make-up, which is the result of the experiences he has had in the family and his immediate surroundings. The school, he enters in, has its own peculiar intellectual, social and emotional environment. The school environment is the result of the interaction of teachers, students, management, and activities undertaken for achieving its objectives. Similarly, each teacher has a distinct intellectual and emotional make-up. The learning outcome is the result of a dynamic and complex interaction of a wide variety of factors.
1.5 A simple teaching-learning model, presented below, brings out the fact that the teacher, by providing learning experiences, affects changes in the pupil, resulting in learning out comes. The model highlights the fact that the teaching-
FIGURE 1.1. Basic Teaching-Learning Model
learning process involves a number of teacher-related, school-related and pupil- related factors. The overlapping of these factors emphasizes the fact that these do not act in isolation. The teacher-related and the school-related factors interact with one another in a complex manner, and acting in a peculiar manner upon the student-related factor, produce a unique and distinct effect upon each student to produce changes in him. The phenomenon of differential learning achievement
2

of students taught by the same teacher in the same school can be viewed in proper perspective in terms of this teaching-learning model.
Not Enrolled 0 Kachi I 20-60
Teaching-Learning Environment in Primary Schools of Pakistan
Officiallv Enrolled 1 2 3 4 s 15 I 15 I 12 I 10 I10 I
1.6 Since school-related, teacher-related and pupil-related factors are important determinants of student achievement, it might be useful to have a pen picture of the primary schools in Pakistan. The wide divergence in the provision of primary education in rural and urban Pakistan demands their separate treatment.
la) Provision of Primarv Education in Rural Pakistan
1.7 An almost complete absence of environment conducive for student learning characterizes primary schools in rural areas. In spite of inter- and intra- provincial differences in the primary school scenario in rural areas, it is possible to draw a profile that would closely fit all. This is primarily because all primary schools have been established by Provincial Education Directorates using a uniform scale of physical facilities and staffing. Box 1 contains an impressionistic profile of a typical rural primary school, constructed from anecdotal evidence collected from educators from all provinces.
BOX 1.1. Impressionistic Profile of a Typical Rural Primary School in Pakistan Enrolment:
Student background: Building: Furniture:
Staff:
Textbook for teachers:
Resource Material: Copy of cu rricu I u m: Teaching Kit: Academic Supervision: General Supervision: Lesson Plan: Examination:
School Hours:
Most belong to poor and illiterate families. 2 rooms and a verandah. One chair and a table for teachers'. Matdbenches for students'. Black board for each class'. Head teacher: Matriculate/lnter" with Training Teachers: One/two, Matriculate/lnter with Training. One might have received in-service training once. Nil (the one set supplied on opening of school has probably become out of date). None. Not avai I ab1 e. Supplied once; rarely, if ever, used. Learning coordinator visits twice a month. Rarely. Not available, probably never prepared. For grades 1-4 by school in Punjab; by Supervisor in other provinces. For grade 5, by ADEO in all provinces. 31 hourdweek in six days.
Supplied at the time of opening of school; neither repaired nor replaced since. Higher qualification in Punjab/Sindh/NWFP, particularly in schools close to cities.

1.8 The profile is that of a small-size institution with low enrolment, barest of physical facilities, an almost complete absence of instructional material, appalling lack of mental stimulation, and an almost total absence of any planned teaching- learning activity. A typical rural primary school is likely to have seven levels of students: pre-school group of under-age children; children of official school age, not demonstrating reading readiness (counting numbers and/or recognizing alphabets); and five levels of regular primary school. Pre-school, known as ‘zero grade’, and school-age children with low reading readiness, known as ‘kachi’, are not formally enrolled and are not recognized by Education Department for purposes of resource allocation. “. . . children may repeat the pre primary classes for several years before moving to class one.” (N.W.F.P.1991). Children in these two ‘unofficial’ grades constitute at least half of the total number of students present in school.
/b) Provision of Primary Education in Urban Pakistan
1.9 Urban Pakistan presents an unlimited variety of primary educational facilities. This precluded the possibility of constructing the profile of a typical urban primary school. The differences among urban and rural primary schools are due to a number of factors. With growth of demand for education by urban dwellers of all socio-economic levels and increase in urban population, educational facilities created by the Education Departments became utterly inadequate. A number of Government Departments established schools for children of their own employees. A number of NGOs stepped in to meet the needs of different socio-economic groups. Religious and philanthropic establish- ments had been operating schools since the days of British rule.
1.1 0 The adoption of varying scales of facilities and staffing by different service providers largely contributed to the deepening of urban-rural and socio-economic divide. The provincial directorates adopt varying scales for allocation of resources to primary schools in rural and urban areas. This may be due to differences in demand for education and survival rates, leading to a higher rate of return on investment in urban areas. Similarly, different service providers operating mainly in urban areas adopt different scales, even when they were all using public money.
1.1 1 While barest level of facilities characterizes rural primary school, over- crowding is the striking feature in urban schools. Almost all classrooms have more students than can be properly seated. Very often, students occupying a bench or desk have hardly any elbow space to write or read comfortably. This is because of the burgeoning demand for education and slower expansion of facilities as compared to the population growth. While rural primary schools are congested due to sharing of rooms by multiple classes, congestion in urban schools is due to larger enrolment.
4

1.12 The diagram in Box 2 illustrates the phenomenon of support from multiple service providers in urban areas as against the almost exclusive dependence of rural populace on public education system.
FIGURE I. 2. Primary Education Providers in Pakistan
NOTES:
I Primary Schools 1
Rural Schools -r I Urban Schools I I
I
1. Provincial Education Directorates adopt different scales for providing facilities and staff to rural and urban schools.
2. Education and Army Directorates also have different scales. 3. Government nominated Boards of Governors have another set of scales
for autonomous institutions estdblished by them with public money. 4. Primary schools for rural girls established under Public-Private-Community
partnership programme in N W F P and Baluchistan are not reflected in the above chart because of their negligible size.
5

1.1 3 Private schools are making a significant contribution to primary education by meeting the shortfall between demand for and supply by the public education system. In terms of quality, some of the best and some of the poorest primary schools in urban areas are probably in the private sector.
Teacher per school Mosque school Primary school
Rural Urban 1.25 2.18 2.52 6.78
~ ~~ ~
Sources: 1. Pakistan, April 2000. 2. Pakistan, November 1999.
1.14 There are considerable differences in the teaching-learning environment at the primary level in rural and urban areas. These differences are due to a number of social, economic, and political factors, which have institutionalized different scales used to allocate resources to these schools. These environmental differences will have to be fully taken into account in any assessment of learning outcome.
Evaluating learning outcome
1.15 The school and the supporting system are all established for the simple purpose of teaching students. All resources, human and material, are allocated to facilitate student learning-outcomes. It is believed that if the teaching-learning
6

process is organized properly, all students will learn what is taught. Low level of student achievement indicates inadequacy/inefficiency of the teaching-learning process. At the school level, examination is used to assess the success or otherwise of the teaching-learning process. Proper analysis of examination data helps in diagnosing factors responsible for poor performance of students and indicates possible remedies. At the macro-level, high dropout and repetition rates and low survival rates are objectively verifiable indicators of failurehnefficiency of the system. The technique of learning assessment has recently been evolved to diagnose factors causing inefficiency of the system and to suggest the desired reforms/changes, through measurement of student achievement.
(a) Examination
1.16 Evaluation of student achievement has all along been an integral part of the teaching learning process. Educators have long known that the nature of examination given to students determines what students read, when they read it, and how they read it. Where external examination is the practice, the nature of examination also determines what, when and how the teacher teaches. Evaluation determines whether students are making adequate progress towards the instructional objectives the teacher seeks to achieve. Examination data is used to communicate to students, parents and education authorities about the level achieved by students individually and/or collectively.
1.17 Examination follows teaching of a lesson or course to a class. The focus of examination is the individual learner. Examination assesses the level of learning attained by students. Examination is a powerful tool in the hand of teachers. Examination data helps teachers improve the teaching-learning process. In pedagogical terms, examination results help both students and teachers to forge links between the instruction preceding it and the instruction it follows. Examination serves the following important purposes (Izard, 1992, and Gronlund and Linn, 1990):
. It helps students and teachers in the choice of further instructional or learning activities to increase mastery.
. It helps them focus attention on importanf aspects of different subjects.
. It helps reinforce broad goals that instructors and curriculum have for students, including the desired standards of performance.
. It helps teachers assess if his teaching methodology is realistic for this group of students.
7
. It helps teachers assess the extent to which the pupils were ready for the next learning experience.
. It helps teachers assess the extent to which his pupils were attaining the minimum essentials of the course.
. It helps teachers determine the types of learning difficulties being encountered by his pupils.
’ It helps teachers identify students who are in need of remedial help.
. It helps in the development of students’ perceptions of their capabilities.
It helps students monitor their progress and develop self- evaluation.
. It helps student develop their learning skills and influences their motivation to study.
. It influences students’ choice of learning strategies and study patterns.
. It helps teachers to understand the validity of textbook, and their strengths and short comings.
1.18 Examination, thus, plays an important role in adapting the teaching- learning situation to the needs of students. Examination data can be used to improve the teaching-learning situation for enhancing learning outcomes.
(b) Learning Assessment
1.19 Dissatisfaction with the performance of the school is endemic. In most of the countries, people have been expressing concern with the level of competencies demonstrated by school completers. Since the 1980’s, efforts have been underway to develop a coherent system for monitoring and evaluating pupil learning outcomes. This system is referred to as national assessment (Greaney and Kellaghan, 1996).
1.20 The national assessment system obtains a representative sample of measures of student achievement, in key curriculum areas, at regular intervals, at selected grade levels. The purpose of the exercise is to assess the achievement of the education system through national aggregation of individual student performance. Data on the performance of students on various sub- domains of curriculum can point to strengths and weaknesses within the curriculum areas.
8

1.21 Simultaneously with data on student achievement, information is also collected on correlates of learning outcome. Any desired combination of correlates may be chosen from amongst student-related, school-related or teacher-related factors. Information on how student outcome is related with these factors can help policymakers identify and focus upon those which were likely to contribute to improvements in student achievement level.
1.22 Analyses of data on sub-domains of curriculum and correlates of learning outcomes provide insight into how intended curricula are implemented in schools and into factors affecting student learning. Learning assessment data provides indication of the state, efficiency, or performance of an education system. Learning assessment serves the following purposes:
. Provides pertinent data to guide policy-makers in selection of priorities in curriculum, in allocation of resources, and in designing teacher-training strategies.
Provides accurate data on changes in level of student achievement over years to substantiate or refute assertion pertaining to lowering of educational standards.
. Information on manipulatable variables affecting student outcome can help in assessing the impact of in-service training, supervision procedure, emphasis on different curriculum content and language instruction, etc.
. Introduce accountability in the system.
. Help bring about cost efficiencies by identifying failing feature of existing system or by providing evidence to support more effective alternatives.
1.23 The effectiveness of the national assessment system will depend on the relevance of indicators selected, quality of data collected, and validity of analyses.
1.24 Examination and learning assessment both collect data on student achievement level and use it for improvement of the quality of education. The examination data is used by teachers both for gradation of students as well as improvement of the quality of their instruction. Learning assessment data, on the other hand, is used by policy makers and planners for improvement of the school system. Important differences between the two, in respect of the purpose and approach, data collection method, analysis of data and utilization of results, are presented in Figure 1.3.
9

FIGURE 1. 3. Distinguishing Features of ExaminE
Instruments
1 Examinees Frequency of testing Decisions affect
I
Examination Determi ne achievement level of individual student.
Individual student. Examination papers/tests covering important areas in subjects taught.
Vary from school to school and across examining bodies.
All enrolled students.
Regularly; related to academic session. Students’ career, e.g. pass/fail; pro mot ionhe petit ion ; completion certificate iss ued/de n i ed .
Provides no information on achievement correlates. Provides no help for improving curriculum or instruction.
Initiatives for Education Quality for All
on and Learning Assessment Learning Assessment, - Determine aggregated achievement level of students in order to gauge efficiency of the svstem. School system as a whole (a) Competencies and skills sought to be developed by curriculum. (b) Instrument for collection of data on desired factors affecting st uden t-lea rn i ng outcomes. Uniform throughout the system/country and for some time.
A representative sample from each regiodarea under study. Conducted periodically after intervals of 2 to 5 vears. Decisions affect policies pertaining to curriculum reforms, teacher training, examination system, admission/promotion criterion, etc. Provides systematic data on the correlates of academic achievement. Provide data on children’s learning, which is useful in making decisions on curricular/ instruction. -
1.25 Concern for quality of primary education has been expressed in all the national education policies formulated since independence. However, adoption of the World Declaration on Education for All at Jomtien in 1990 brought to focus: the issues of: (a) access and equity for the disadvantaged, such as rural poor and urban slum-dwellers, (b) regional disparities, and (c) enhancement of the quality of education. The Declaration emphasized that it was not enough to bring
10

and keep children into the school but to ensure that “they incorporate useful knowledge, reasoning ability, skills, and values” (Inter-Agency Commission, 1990). This highlighted the need “to define acceptable levels of learning acquisitions for educational programmes and to improve and apply systems of assessing learning achievement.”
1.26 Student achievement as an indicator of quality received global recognition when the International Consultative Forum on EFA listed it as one of the indicators to be used for The Year 2000 EFA Assessment (International Consultative Forum on EFA, 1998). In Pakistan also a number of studies were undertaken to assess the level of student achievement. The international community continues to voice its concern for quality of learning outcome. This is reflected in the collective commitment to “improving all aspects of the quality of education and ensuring excellence of all so that recognized and measurable learning outcomes are achieved by all.. .” This commitment is spelled out as six goals of the Dakar Framework of Action for EFA. (World Education Forum, April 2000).
1.27 Pakistan’s commitment to free, compulsory and quality education for all children, made at various international forums, found expression in a number of initiatives. For example, the Social Action Programme, initiated in 1992, to redress the past neglect in the social sector, seeks to address to the question of quality of education while continuing to work for access and equity.
1.28 As a follow-up to Jomtien, the global joint UNESCO-UNICEF Monitoring of Learning Achievement project sought to help member countries, through capacity building measures, to develop monitoring systems to assess learning achievement in basic education. The focus of the project is on “development of a monitoring culture, and strengthening endogenous capacities for national assessment, . . .” (PUNJAB and MSU for SAP, 1997). The assessment of student learning will provide decision makers with information on the quality of their basic education progrmmes. Assessment of student achievement at the primary level is programmed under SAP-II. Since joining this global initiative in 1996, Pakistan took a number of significant steps towards creating the required infrastructures at national and sub-national levels for carrying out periodic assessment of grade 4 children in the country.
1 1

Assessment Studies in Pakistan
1.29 To assist in the formulation of appropriate policies, national assessment studies were first conducted in 1983 under the Primary Education Project. This was followed by studies under the “BRIDGES” project of the Haward Institute of International Development during 1988-89. However, these were one-time, project-driven activities and did not become part of the system. The World Declaration on Education for All drew attention to the need for improving learning outcomes. The Technical Guidelines prepared for the Year 2000 Assessment, impressed the need to adequately assess the level of student achievement. Consequently, a number of assessment studies were conducted during the 1990’s with the support of UN Agencies. Lack of administrative infrastructures prevented pooling together of national capacity for planning and execution of learning assessment studies and held back progress in this field. Attention is now being focused on development of required infrastructures, both at national and provincial levels, under the Social Action Programme.
1.30 In the following pages, an effort will be made to present all available information on the assessment studies conducted in Pakistan so far. This will be done by summarizing quantitative and qualitative data from different assessment researches and by briefly presenting their findings. The findings will include the systemic changes that will facilitate success of the reform initiatives. Finally, those conceptual and methodological concerns will be identified, which future assessment studies should address in order to live up to their promise of quality education for all.
12

II. Learning Assessment at Primary Level
Subject Grade Punjab Sindh Science 4 20.1 25.9 Mathematics 5 19.8 19.3
It is believed that judicious use of learning assessment data and its analysis can help government expand enrolment while at the same time improve the quality of education, without increasing expenditure. It is, therefore, important that the status of learning assessment in the country is reviewed with a view to identifying the direction it has taken so far in respect of objectives and methodology. Pakistan’s experience with assessment research started soon after the development of the concept in the 1980’s. However, this got a new impetus with Pakistan’s commitment to the goals of EFA in 1990 and with joining of the UNESCO-UNICEF global initiative for Monitoring Learning Achievement in 1996. The list of learning assessment studies conducted in Pakistan is presented in Annex I.
N.W.F.P. 16.9 14.1
(a) Pre-EFA Studies
11.2 The first learning assessment study was conducted in Pakistan under the World Bank’s Primary Education Project in 1984. The study collected achievement data from 3,300 students of grade 4 in Science and as equal number of grade 5 students in Mathematics. The data was collected from a representative sample of schools in N.W.F.P., Punjab and Sindh. The break-up of average percentage scores for the three provinces in Science and Mathematics is given in Table 11.1.
11.3 The study analyzed the performance of students by provinces in terms of scores on multiple-choice and completion items. Students of N.W .F.P. performed poorly on completion items, where they had to write out their answer, because of the language problem.
11.4 As part of an US-AID sponsored international study, the Harvard Institute of International Development carried out an assessment of primary education during 1988-89. The study collected both quantitative and qualitative data on achievement of students of classes 4 and 5 in Mathematics and Science as well as on student, teacher and school characteristics from about 500 sampled schools across -Pakistan. About 100 teachers were interviewed and about 11,000 students were tested. Findings of different aspects of the system were reported in international journals and some Development Discussion Papers
13

were also produced. No formal research report was presented, perhaps because the project was wound up at a very short notice due. to political reasons’. However, a comprehensive and forthright analysis of learning in primary schools of Pakistan, based on the data collected for the study, is available in Warwick and Reimers (1995).
Subject Science Mathematics
11.5 The average percentage scores on Science and Mathematics from the BRIDGES project were presented in an ED1 seminar at Bhurban, Pakistan. These are presented in Table 11.2, which indicate extremely low level of achievement in both subjects. Average percentage score of students in grade 5 is only one percentage point higher than that for grade 4 in Mathematics and 4 percentage points higher in Science.
Grade 4 Grade 5 29 33 25 26
11.6 The lowering of level of achievement in both Science and Mathematics between 1884 and 1989 should be viewed with concern. It is significant that initiatives for supply of teaching kits and appointment of Learning Coordinators for more intensive academic supervision had no impact on student learning.
11.7 The BRIDGES assessment study collected data on teacher classroom behaviour and identified those teaching practices that show positive effect on student learning. These findings have implications for teacher training.
(b) Post-EFA Studies
(i) National Level Studies
11.8 Five assessment studies with national coverage were conducted during 1994-99. These studies focussed on level of student achievement in different combinations of grades 3 to 5 of-the primary school. These national-level studies used different instruments and sampling techniques for estimating student achievement. The instruments also sampled different competencies/content areas. The instruments had passed through varying degree of refinement and
’A number of casual papers marked ‘Papers not formally reviewed. Please do not quote or cite’ also provide data and information on some component of the study.
14

had unspecified difficulty levels. The results, accordingly, reflect different levels of learning achievements in different school subjects. However, some general, common patterns emerge from these studies. The results confirmed that primary boys and girls had the talent and could assimilate the knowledge dished out to them, given the time to memorize. Further, that the teaching methodology used in primary schools only promoted memorization at the cost of problem solving.
Methodological Framework of Studies
11.9 The differential performance of various primary education delivery systems and their cost effectiveness were studied under PEP-Ill. Tests were developed to assess student achievement as well as behaviour. These tests were administered to boys and girls studying in 472 schools of different type in Punjab. Sindh and N.W.F.P. The composite scores of students were correlated with the per student cost of different types of schools to determine the most cost- effective delivery system. The report presented data to establish the cost- effectiveness of different types of schools but did not try to find the reasons for these differences.
11.10 Looking at the situation of basic education in Pakistan, the study on Basic Competencies of Children in Pakistan, conducted by Pervez, identified four basic competencies: the 3R’s and life skills knowledge. A model sampling design, recommended by the W H O , was adopted to select a representative sample of 1 1 -1 2 year old children. The sample, thus, included children in school, children who had been to school and had completed different qrades, and also children who had never been to school. The study did not seek to determine learning achievement of primary school children and the data collection instrument was not based on school textbooks.
11.11 The MSU for SAP study (1995) on Determinants of Primary Students’ Achievement focused on grade 5 students. An achievement test based on the curriculum and books tauqht in qrades 3 and 4 was administered to qrade 5 students. Thus the study sought to determine the extent to which grade 5 students learned the material taught in grades 3 and 4. The students were those who passed examination held at the end of grade 3 and later also the examination at the end of grade 4. Those who could not demonstrate learning at the end of grades 3 and later those who could not display learning at the end of grade 4 were excluded from the group tested. Only those who reached grade 5 were tested.
11.12 The AEPAM study (1 999) entitled Measuring Learning Achievement at Primary Level in Pakistan sought to assess learning achievement of grade 4 students in Mathematics, Science and Language (Urdu). The test consisted of 33 multiple-choice items on Mathematics, 35 items on science, and 35 items on Urdu. The tests were administered to a sample of 1,411 students of 75 boys’ schools and 1,383 students of 70 girls’ schools in 28 districts of Pakistan. The
15

number of schools and students included in the sample were not proportionate to the universe. Besides, the study reported differences in student performance without relating these differences to causative factors. This refers to Shah’s analysis of differences on multiple-choice and completion items by N.W .F.P. students to posit the difference in performance to language difficulty.
11.1 3 Major methodological features and findings of the five national-level studies are presented below.
1. Differential Achievement of Primary Age Children and the Cost Effectiveness by School Type (Undated)
11.1 4 Institute of Education and Research, Punjab University, conducted this learning assessment study, sponsored by the Ministry of Education. Achievement tests were administered in four primary school subjects to 8,883 students of grades 3 and 7,108 students of grade 5 from a sample of 472 schools selected from the four provinces of Balochistan, N.W.F.P., Punjab and Sindh. In addition to achievement tests, an instrument was developed to assess student behaviour on such attributes as class participation, motivation, cooperation and socialization, discipline, cleanliness, carefulness, and regularity and punctuality. The study also collected data on per-student cost from the sampled mosque schools, two-teachers and five-teachers primary schools, and primary sections with middle and high schools. The mean achievement and behaviour scores of students in different types of schools are shown in Figure 11.1.
FIGURE 11.1. Mean Achievement and Behaviour Scores by Type of School
100
75
50
25
0 Mosque 2-teachers 5-teachers Primary in Primary in
Source: Mirza and Hameed
11.15 The marginal difference in the achievement level of students from different types of schools is a matter of concern in view of the difference in per student cost. In many other studies, the performance of students was higher in single grade teaching as compared to multi-grade teaching.
11.16 The study concluded that students of primary sections of the middle schools and the five-teacher-primary-schools performed better than students of the primary sections of high schools. Further more, students of mosque schools
16

had lowest scores. The study did not provide any reason for the marginal improvement in student performance when greater in-puts in terms of school facilities and teachers were provided. The study has implications for organization of the primary schools and their staffing.
2. Basic Competencies of Children in Pakistan (1995)
11.17 The study of basic competencies of Pakistani children conducted by Pervez is not essentially a learning assessment study. It is a survey of basic competency level of 1 1 + children in sampled geographical clusters, whether they were in school or not, and whether they ever attended school or not. Unlike learning assessment studies, data was not collected from children in a specified grade in sampled schools. Again, the test administered was not strictly an achievement test in selected subjects. However, the study is reviewed here because it sought to assess the efficiency and effectiveness of primary education delivery system and provided basic data required for developing school improvement initiatives.
(a) Status of Basic Competencies at National Level
l1.18 The study revealed that most of those completing primary education did not have the competencies required for pursuing education at the middle school level (Pervez, 1995). This was evidenced from the fact that only 18 per cent of those completing primary education could write a letter. Only few 1 1 + children of Pakistan were found competent. A child was considered competent if he could correctly answer 66 Yo questions in all four competencies - life skills, reading, writing, and arithmetic (Pervez, 1995). Percentage of children competent in specific competencies is indicated in Figure 11.2. About 21 Yo children were found
FIGURE II. 2. Percentage of Children Competent in Different Competencies
r 69.6 67.7
L-
Source: Pervez, Basic Competencies of Children in Pakistan. 1995.
17

competent in three of the four competencies, that is, only 21% children could answer 66% questions correctly in three of the four areas. Within each competency, a higher percentage of children were found to be competent in routine, mechanical tasks requiring memorization. Thus, over 60% children were competent in rote reading, writing from dictation, numeracy and arithmetic, and mental arithmetic. On the other hand, between 18 and 27 per cent students could write a letter, read with comprehension, and demonstrate life skill knowledge.
(b) Inter-Provincial Differences
II. 19 Inter-provincial comparison of achievement can generate awareness among provinces about the strengths and weaknesses in their system and thus help focus on the areas of concern. Pervez (1995) found that the percentage of competent children (correctly answering 66% questions in any' three of the four competencies) varied from 9 to 23 (Table 11.3). The percentage of competent
Source: Pervez, Basic Competencies of Children in Pakistan, 1995.
children in Punjab, Sindh and Balochistan ranged between 22 and 23. Only the percentage of competent children in N.W.F.P. was significantly lower.
11.20 The study showed that the competency varied widely from province to province (Figure 11.3). Highest percentage of children from the Punjab was
FIGURE II. 3. Percentage of Children's Competencies by Provinces
El Punjab 0 Sindh
EA Balochist ~N.w.F.P.
Source: Pervez, Basic Competencies of Children in Pakistan, 1995.
18

competent in five and from Sindh in three basic competencies.
11.21 Children from each province had their own pattern of competencies. Children from Punjab scored well on routine, mechanical tasks requiring memorization (like rote reading, dictation, numeracy and arithmetic, and mental arithmetic). Few children from Punjab were high on life skills knowledge, comprehension and letter writing. Competency pattern of children from Sindh was very similar to that of children from Punjab, except that a higher proportion had life skills knowledge, comprehension and could read Qur'an. Children from N.W.F.P. obtained high average percentage scores on rote learning, writing from dictation, numeracy and arithmetic, mental arithmetic and reading Qur'an. On numeracy and arithmetic, and mental arithmetic, they scored better than students from Sindh and Balochistan, being only marginally lower than students from Punjab. Students from Balochistan were close to top in life skill knowledge and only second in writing letter to students from Punjab.
(c) Gender Differences in Competency Level
11.22 Differences in learning achievement of boys and girls is of special interest in view of low access of primary education for girls. Pewez found that only 16.8% boys were competent as against 28.5% girls (Pewez, 1995). The acquisition of basic competencies by a higher proportion of girls as compared to boys, in spite of their involvement in domestic work, indicates high level of talent and motivation. A higher percentage of girls were competent in all competencies except numeracy and arithmetic, than boys (Figure 11.4).
FIGURE II. 4. Gender Differences in Specific Competencies (Percentage of Chi Id ren)
Source: Pervez, Basic Competencies of Children in Pakistan, 1995.
(d) Competency Status by Urban-Rural
11.23 The survey of basic competencies (1995) indicates that 11.8% of rural children as against 29.2% of urban children are competent (Figure 11.5). The result is, as one would expect, in view of the vast differences in physical facilities,
19

instructional material, teacher qualification and literacy level of parents in rural and urban areas. A higher percentage of urban children were competent in all specific competencies. The difference ranged between 1 1 and 25 percent points. The largest difference of 25 per cent point being in writing from dictation, which is a routine, mechanical task, and the lowest difference of eleven percentage points in writing a letter, which is a creative activity.
FIGURE 11.5. Rural - Urban Differences in Specific Competencies (Percentage of Children).
c c 0 a c a,
a, a
.-
c
2
0
-1 0
-20
-30
Source: Pervez, Basic Competencies of Children in Pakistan, 1 995.
3. Determinants of Primary Students’ Achievement (1 995)
11.24 In 1995, M S U for S A P conducted a national survey of students and teachers of grade 5 to determine the level of student mastery of curricular material for grades 3 and 4 and to determine the critical factors affecting achievement. The survey covered 527 government, private commercial and NGO/Trust schools in Balochistan, Punjab and Sindh. Two questionnaires were used, one to collect information about the school and the other to determine achievement level of students and teachers.
(a) Achievement at National Level
11.25 The survey found that, on an average, children could correctly answer only 61% questions. While the overall performance of children was rather satisfactory in general knowledge (74% questions correctly answered) and comprehension (69% questions correctly answered), performance in arithmetic was quite low (46 % questions correctly answered). The low performance in arithmetic was attributable to low competence in solving narrative problems (only 35% questions in this area could be correctly answered). The average performance in handling number problems was quite satisfactory (68% questions
20

were correctly answered). promotes memorization rather than problem solving.
This confirms the earlier finding that the school
(b) Inter-Provincial Differences
11.26 Primary school children in the provinces of Punjab, N.W.F.P. and Balochistan scored lowest on Mathematics’. On the test of comprehension, children from Balochistan scored at par with those from Punjab. In Mathematics, children from Balochistan scored two per cent point higher than children from N.W.F.P. The composite test score of children from Balochistan was marginally higher than that of children from N.W.F.P. Figure 11.6 shows that the scores of
FIGURE II. 6. Inter-Provincial Differences in Performance of Primary School Children in Different Subjects
..
__ .-
. r Punjab
-ON.W.F.P. c Mathematiqs General Knowledge Comprehension Total 1 Balochistan Scource: MSU, Determinants of Primary Students’ Achievement, 1 995.
children from Punjab were higher on all tests: the biggest difference being in mat hematics .
11.27 It may be reiterated that the MSU study, in effect, sought to determine the extent to which grade 5 students learned the material taught to them in grades 3 and 4. The scores do not reflect the achievement of grade 5 students in subjects taught to them in grade 5.
(c) Gender Differences (Girls minus Boys) in Achievement
11.28 The MSU for SAP survey shows that girls performed better than boys in overall terms. They performed better than boys on tests of comprehension and general Knowledge (Figure 11.7). The boys performed better than girls only in mathematics by three percent points.
’ Data from Sindh was discarded because tests could not be administered in the true spirit of the survey.
21

FIGURE 11.7. Gender Differences in Performance of Primary School Children in Different Subjects
Girls Boys
Mathematics General Comprehension Composite Knowledge Average
Lp--.- ~.
(d) Achievement by Urban-Rural
11.29 This survey did not find any significant difference in the overall performance of rural and urban children: on an average, rural children correctly answered 60.9% questions, while urban children answered 60.3% questions correctly. Again, no evidence was found of, across the board, better performance by urban children (Figure 11.8). Rather, the rural children performed
FIGURE II. 8. Rural minus Urban Differences in Achievement in Different Subjects
^ _ I___ -_x_x ~ -'A..---- 7 B -2.6
~ _ _ _ _ _ ~ ~ I
---%",-----
i Mathematics General Knowledge Comprehension i rural - Urban Source: MSU, Determinants of Primary Students' Achievement, 1995.
__ ___
better in mathematics, while the urban children did better in General Knowledge and Comprehension ( Urdu ). As compared to higher percentage of urban children being competent in Pervez's (1995) survey, the MSU for SAP survey showed little urban-rural difference. Could the school be leveling differences while the society is aggravating it?
22
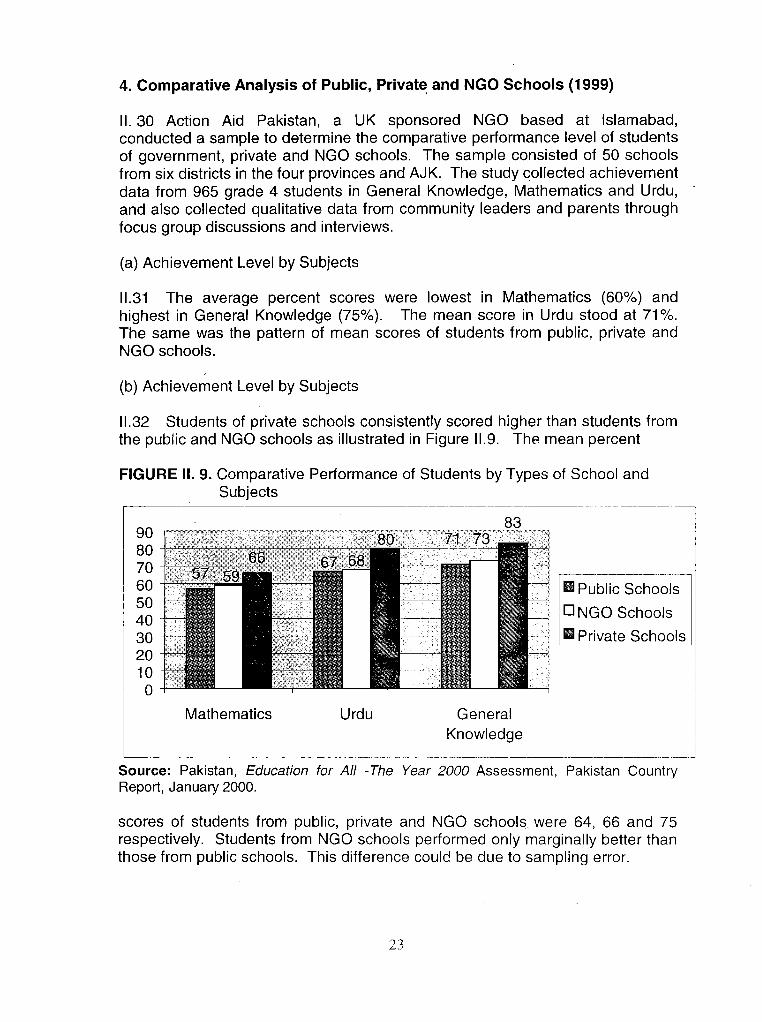
4. Comparative Analysis of Public, Private and NGO Schools (1 999)
II. 30 Action Aid Pakistan, a UK sponsored N G O based at Islamabad, conducted a sample to determine the comparative performance level of students of government, private and NGO schools. The sample consisted of 50 schools from six districts in the four provinces and AJK. The study collected achievement data from 965 grade 4 students in General Knowledge, Mathematics and Urdu, and also collected qualitative data from community leaders and parents through focus group discussions and interviews.
(a) Achievement Level by Subjects
11.31 The average percent scores were lowest in Mathematics (60%) and highest in General Knowledge (75%). The mean score in Urdu stood at 71%. The same was the pattern of mean scores of students from public, private and N G O schools.
(b) Achievement Level by Subjects
11.32 the public and NGO schools as illustrated in Figure 11.9. The mean percent
Students of private schools consistently scored higher than students from
FIGURE II. 9. Comparative Performance of Students by Types of School and Subjects
03 90 80 70 60 50 40 30 20 10 0
Mathematics Urdu General Knowledge
Public Schools
Private Schools O N G O Schools
~~~~~~~~ ~
Source: Pakistan, Education for A// -The Year 2000 Assessment, Pakistan Country Report, January 2000.
scores of students from public, private and NGO schools were 64, 66 and 75 respectively. Students from NGO schools performed only marginally better than those from public schools. This difference could be due to sampling error.
23

11.33 A much higher proportion of students from private schools obtained 80% or more marks than students from public and NGO schools. The proportion of students scoring 80% or more marks was 47 in private schools as against only 25% and 31 Yo from public and NGO schools. Again, 84 Yo students from private schools marked 60% or more questions correctly as against only 56 per cent students from public and NGO schools.
11.34 The test results were consistent with opinions expressed during focus group discussion and interview. Four out of six focus group participants thought thatfthe quality of education in private schools was better than that in public,and NGO schools. The rankings given by focus groups to the schools were: private schools, NGO schools and public schools.
5. Measuring Learning Achievement at Primary Level in Pakistan (1999)
11.35 The learning assessment study conducted by the Academy of Educational Planning and Management, during 1999, had the widest coverage. It collected student achievement data from 2,794. students of grade 5 sampled from 145 schools in 28 districts of the four provinces, FATA, FANA, ICT and AJK. The instruments consisted of multiple-choice tests in Science (35 items), Mathematics (33 items) and Urdu (35 items). The tests covered the curriculum objectives and content materials of textbooks up to grade 4. However, the test did not include questions to assess writing skills and power of expression.
(a) Status of Achievement at National Level
11.36 The study showed that the performance of primary school children was lowest in Mathematics (only 58% questions correctly answered). The overall performance in Science and Urdu was found to be quite satisfactory (72% questions answered correctly). The results again highlight the need for strengthening problem solving activities in schools. The achievement level reported in the study is higher than that reported in earlier studies. It may be due to inclusion of a large number of items with low difficulty level, particularly from the textbooks for grade 3. The possibility that the tests were not administered under proper testing conditions, by a third party, could also not be ruled out.
(b) Inter-Provincial Differences
11.37 The students of Sindh obtained highest average percentage scores in all subjects. In all provinces/areas, except Sindh, students obtained highest score in Science. The lowest performance in each province was in Mathematics. Inter provincial comparisons of performance of primary school children .in different subjects are brought out in Figure 11.10.
24

FIGURE II. IO. Inter-Provincial Differences in Performance of Primary School Children in Different Subjects
I
.- . . .... "_" II . . - . 90
I Punjab Sindh N.W.F;P. Balochistan
Mathematics Urdu
Source: AEPAM., Measuring Learning Achievement at Primary Level in Pakistan, 1999.
(c) Gender Differences in Student Achievement
11.38 The results of AEPAM survey (1999) are significant in that the results of MSU for SAP survey (1995) pertaining to gender differences are confirmed. The AEPAM study shows that girls performed better than boys in Science and Urdu, while boys performing better in mathematics. Better performance of girls in language and ' better performance of boys in Mathematics also reflects international trend (Abideen and Jones, 2000). Differences in performance by gender and subject are shown in Figure 11.1 1. FIGURE 11.1 1. Difference in Learning Achievement by Gender and Subjects
I
6
4 a E 2 2 0 0
-2
- C
a
1 - " ~
Science Mathematics Urdu
Source: AEPAM, Measuring Learning Achievement at Primary Level in Pakistan, 1999.
(d) Achievement Status by urban-rural
11.39 The AEPAM survey shows that rural children perform poorly as compared to urban children except in Sindh (Figure 11.12). This result should be viewed in the context of an entirely different criteria used in Sindh for determining 'rural' or
25

FIGURE 11.12. Rural Minus Urban Differences in Student Performance by Subjects
- IW 1 ( -8 I Mathematics
-7 Science
Source: AEPAM, Measuring Learning Achievement at Primary Level in Pakistan, 1999.
'urban' status of an area, which is a political division rather than one based on the level of physical and administrative infrastructures in the area. Thus, many areas, which have all the urban facilities, are classified as 'rural' in the province of Sindh. Performance of rural children is poorer across the board; the widest margin being in Urdu. Rural children score 7 per cent points lower than urban children in science, 8 in mathematics and 9 in Urdu.
(ii) Provincial Level Studies
11.40 In the post-EFA era (after 1990), a number of assessment studies were conducted in the provinces/areas. These studies were conducted under the donor-funded Primary Education Development Projects, operating in the provinces of Balochistan, N.W.F.P. and Sindh. A study was also conducted in Punjab under PEP in 1995. Besides, UNESCO initiated and supported student assessment exercises in all the four provinces, during 1999-2000, to provide data for EFA 2000 assessment. The purpose of these research activities was to collect baseline data for student assessment. The Northern Area Education Project, supported by the World Bank, the Government and DEID, conducted a baseline achievement study in the Northern Areas.
11.41 The Provincial Bureaus of Curriculum and Extension Centres were commissioned by UNESCO to carry out surveys on learning achievement of students in grades 3, 4 and 5 in Mathematics, Science, Urdu and Social Studies. Each Bureau developed its own achievement tests for each grade and subject. Questionnaires were also developed for gathering opinion of teachers, head teachers, students, LCs and parents on different aspects of teaching-learning process. The data collection was restricted to primary schools located in the rural areas within a specific district selected in consultation with UNESCO. Simultaneously, UNESCO also supported Punjab Literacy Watch, an NGO, to conduct survey of student achievement in six districts of Punjab; two districts each from Northern, Central and Southern regions. Thus, learning assessment studies conducted during the 1990's contributed to national capacity building for
26

carrying out monitoring of learning achievement for improving the quality of primary education.
11.42 The four provincial-level learning assessment studies did not collect data on school-related, teacher-related and student-related factors. Instead, the views of head teachers, teachers, Learning Coordinators, students and parent on the quality of education in their schools were collected. These views are consolidated and presented in the next chapter.
Punjab Assessment Studies (1 995-99)
11.43 Between 1995-1 999, three learning assessment studies were conducted in Punjab, of these two were sponsored by UNESCO and one by the IER, Punjab University, under PEP. Abstracts of the two UNESCO supported studies are included in Annex I I . The IER study could not be abstracted because of non- availability of the research report.
1. The IER Assessment Study under PEP (1 995)
11.44 IER constructed achievement tests in all subject for grades I to 5. Thus, this study is the most compjehensive attempt at assessing the achievement level of primary students in the’Punjab. These tests were administered to 8,792 students in 132 schools of four districts. Analysis showed that girls and urban students scored better in grades 1-4. Boys, in general, and rural students, in particular, improved their pefformanc’e by the time they reach grade 5 so as to perform at par with others. This finding has implication for the age of entry into the primary school. Children in rural communities are not ready for school at age five, because of lack of stimulation at home. This results in their poor performance as compared to urban students. However, with maturity they catch up with their urban counterparts. The study also showed that students in all grades score higher in rote learning as compared to comprehension/application questions (The World Bank, 1999).
2. Learning Achievement of Grades 3 to 5 Children of Kasur District (1999)
11.45 The Punjab Curriculum Development and Research Centre (CRDC) analyzed the “contents of first 4 to 5 chapters of textbooks” to develop assessment objectives in the light of curricula relevant to these chapters (CRDC, 1999). The Punjab study reported that the test covered first three to four lessons in the text book of each subject to ensure that the test did not include material not taught to students by the time the tests were administered. This was done in consultation with teachers of schools selected for study to ensure that the test did not include textual material not studied by students. The report does not specify whether the ‘instructional objectives’ identified from analysis of textbook were got validated from classroom teachers. The instruments were reviewed by experts and pre-tested. Instruments were “modified in the light of review and
27

observations of pre-testing” (CRDC, 1999). No mention is made of the item analysis techniques having been applied for refinement of the achievement tests.
Grades
3 4 5
11.46 The assessment data collected under the study, shows that in all grades rural students performed best in Science and Mathematics and poorest in Social Studies (Table 11.5). Girls scored higher than boys in both Mathematics and
Subjects Mathematics Science Urdu Social Studies
37 51 42 27 50 51 48 21
48 43 43 28
Science in all grades while boys scored higher than girls in Social Studies. Girls scored better in Urdu in grade 3 but boys caught up in grade 4 and surpassed in grade 5. The average percent scores range between 21 and 51, the highest being in Science and the lowest in Social Studies. With minor fluctuations, the level of student performance in Punjab is maintained and improved between grades 3 to 5 in all subjects except Social Studies. Teaching of Social Studies needs to be strengthened in Punjab.
3. Level of Pupil Achievement in Rural Primary Schools of Punjab (1999)
11.47 With support from UNESCO, the Punjab Literacy Watch conducted a survey of pupil achievement in six districts of Punjab, two in each of the Northern, Central and Southern regions. The districts were: Attock, Chakwal, Lahore, Sialkot, Muzaffargarh and Layyah. Tests in Mathematics and Urdu were administered to 1371 students of grades 3, 4 and 5 in 16 boys’ schools, 14 girls’ schools and one co-educational school.
11.48 On an average, students were able to correctly answer only 25 percent questions. Students’ average percentage score was 22 in Mathematics and 28 in Urdu. Girls scored higher than boys in Urdu in all classes, while boys scored higher than girls in Mathematics in all classes. Another significant finding was that the combined (Mathematics + Urdu) mean percentage scores were 26, 26.3 and 23.1 for grades 3, 4 and 5 respectively. Thus, while students in grades 3 and 4 correctly answered 26 percent questions, students in grade 5 could answer only 23 percent questions correctly.
Sindh Assessment Studies (1996-2000)
11.49 In Sindh, three learning achievement studies were conducted during the second half of the 90’s. While two of the studies were conducted under the SPEDP, UNESCO sponsored the third.
28

1. SPEDP studies (1 996-98)
Grades
3 4 5
II . 50 Provincial BCEW conducted the first study in 1996. For this study, teachers, LCs and Supervisors graded performance of students of grades 1 to 3 in all subjects on the scale A to D. Under the second study, conducted in 1998, achievement tests in Mathematics and Sindhi/Urdu were administered to students of grades 3 and 5 (The World Bank, 1999). Findings of these studies have not been reviewed here because of non-availability of research reports.
Subjects Mathematics Science Sindhi Social Studies
20 17 41 19 9 18 46 17 8 10 46 14
Language
2. Baseline Survey of Learning Achievement (2000)
11.51 BCEW, Jamshoro, conducted this study, which was sponsored by UNESCO. Students’ performance in Mathematics, Science, Sindhi, Social Studies and lslamiyat was assessed through tests. Achievement data for the study was collected from five boys’ and five girls’ schools, each from the rural areas of Hyderabad and Dadu districts. Tests were administered to 50 boys and 5G girls in each of the grades 3 to 5. The mean percentage scores range between 8 in Mathematics and 46 in Sindhi language (Table 11.6). Rural students in ttw provlnce obtained very high scores in Sindhi language but performed poorly in all other subjects (Sindh, 2000). Student performance in Mathematics, Science, and Social Studies should be a matter of concern for the
TABLE 11.5 Mean Percentage Scores of Sindh Rural Students by Subject and Grade
school administration. Student performance in rural Sindh shows a downward trend as they progress through primary grades; performance in Sindhi language being an exception. Achievement scores in the terminal years are alarmingly low in all subjects except Sindhi language.
N.W.F.P. Assessment Studies (1 995-1 999)
11.52 Two learning assessment studies were carried out in NWFP during the 90’s. The Educational Assessment Unit established under the PEDP carried out an assessment study in 1995-96 while the Provincial BCDES, Abbottabad, conducted the UNESCO sponsored study in 1999.
29

1. PEDP Assessment Study (1995-96)
Grades Subjects Mathematics I Science Urdu Pushtu
11.53 Student achievement data was collected from 6,946 students of grade 3 and 4,627 of grade 5 in Mathematics, Science, Urdu and Pushtu. The mean percentage scores by grades and subjects are presented in Table 11.7 (The World Bank, 1999). Students scored highest in Pushto followed by Urdu. Students of
Grades
3 4 5
Subjects Mathematics Science Urdu Social Studies
31 40 54 22 34 40 22 40 26 30 23 46
grade 3 scored high in Science but their achievement becomes low in grade 5. The reverse is the trend in achievement in Mathematics. Teaching of Science and Mathematics should receive greater attention in primary schools of NWFP.
2. Learning Achievement of Grade 3 to 5 Children in Rural Primary Schools (1 999)
11.54 The U N E S C O commissioned the Provincial BCDES, Abbottabad, to conduct a learning assessment of rural primary school children in District Mansehra, N.W.F.P. The study revealed extremely low level of achievement by rural children in all subject and at all grade levels. The mean percent scores of students in N.W.F.P. vary from grade to grade and subject to subject. Rural students in N.W.F.P. perform better in Science and Social Studies followed by
Mathematics and Urdu. Students in rural N.W.F.P. do not maintain the level of performance as they progress through grades, except in Social Studies. Rural students, who have so little exposure to Urdu, perform well in the subject in grade 3. Their performance keeps falling every year. The sudden drop in level of performance from grade 3 to grade 4 in Urdu needs further probing. It should be a matter of concern that student achievement level also drops in Mathematics and Science between grades 4 and 5.
30

Balochistan Assessment Studies (1 997- 2000)
Grades
3 5
11.55 The BPEDP, Quetta, carried out a learning assessment study during 1997-98 covering both rural and urban areas. The Provincial B C E C conducted an assessment study in rural schools of Pishin district during 1999-2000 with U N E S C O support. The results suggest that the achievement levels of rural and urban children are equally low.
Subjects Life Skills Mathematics Urdu 41 -51 47-53 22-29 36-66 27-57 35-44
1. BPEDP Assessment Study (1 997-98)
Grades
3 4 5
11.56 The study conducted by BPEDP, Quetta, collected achievement data from students of grades 3 and 5 in Life Skills, Mathematics and Urdu. The study reported district-wise data. The range of district-wise achievement scores by subjects and grades are presented in Table 11.9 (The World Bank, 1999). Balochistan students score lowest in Urdu. The range of scores tends to increase as the students progress from grade 3 to grade 5. The achievement in Urdu shows overall improvement as the students move from grade 4 to grade 5.
Su bb'ects Mathematics Science Urdu Social Studies
30 40 31 43 46 55 28 38 34 39 30 31
On the other hand, the performance in Mathematics and Science shows a downward trend.
2. Learning Achievement of grade 3 to 5 Children in Rural Primary Schools of District Pishin, Balochistan (1 999)
11.57 The study collected achievement data from 447 male and 354 female students in Mathematics, Science, Social Studies and Urdu. The study shows low achievement level of rural students in Pishin district. The mean percentage scores ranged between 55 in Science to 28 in Urdu (Table 11.10). The performance of rural students in Science and Mathematics tends to improve as they progress from grade 3 to 4, but again slides back as they reach grade 5.
TABLE 11.9. Mean Percentage Scores of Rural Students in Balochistan by Subiects and Grades
31
The drop in level of performance In Science and Mathematics after grade 4 is too steep to be ignored. The performance of rural students of Balochistan is consistently low in Urdu.
Northern Areas Assessment Study (1 999-2000)
11.58 As part of the Social Action Program, the Northern Areas Education Project, supported by the World Bank, government, and DFID, conducted an assessment study during 1999-2000. Based on the National Curriculum, tests in Urdu and Mathematics were developed for students of grade 4. The Urdu test had four components - listening, loud reading, reading with comprehension and writing. Mathematics test items covered problems in the areas of Number, Money, Measurement, Geometry, Information Handling and Problem Solving.
11.59 The average performance of students was good in listening, loud reading, and reading with comprehension, but poor in writing a story. In case of Mathematics, the average performance of students was good in number, money and measurement, but poor in geometry, information handling and problem solving. The findings again brought out the almost complete reliance on memorization at the expense of creativity and problem solving in primary schools.
11.60 Girls performed better than boys in the language tests, while boys performed better than girls in the mathematics tests. The mean percentage score was 66 on the listening test, 79 on loud reading, 54 on reading with comprehension, and 37 on mathematics tests. Thus, students of the Northern Areas performed better on language tests than on mathematics tests.
Features of Assessment Studies
11.61 The assessment studies conducted in Pakistan between 1984 and 2000 had different objectives. While studies conducted by Pervez (1 995) and MSU for SAP (1995) sought to assess competencies, those by Shah (1984), IER (undated) and AEPAM (1 999) concentrated on assessment of subject mastery (Table 11.10). However, the number of test items used to assess each competency was too small. It is believed that other things being equal, the longer the test, the higher the reliability and validity (Anastasi, 1990).
11.62 A second feature related to the extent to which data was collected on factors affecting quality. While Shah, IER, Pewez, MSU for SAP, and BRIDGES studies collected information on characteristics of students/schools, AEPAM and studies conducted by Provincial Bureau of Curriculum collected opinions of head teachers, teachers, learning coordinators, students and parents about factors affecting quality of education. BRIDGES studies and MSU for SAP administered the test meant for students to the teachers also. If assessment studies are to
32

provide direction for policy initiatives for quality improvement, more substantive evidence on contributing factors/variables should be provided.
11.63 A third feature of these studies related to the coverage of subjects and grades for data collection. While some sought to assess the performance of children who were in the final year of primary education through tests covering material contained in textbooks for grades 3 and 4. Other researches tested students of grades 3 to 5 with tests based on curriculum objectives and textbook materials for their grade. The items were sometimes based on the first four to five chapters of textbooks. Thus the data did not provide evidence of level of achievement at the end of grade. Again, some sfudies collected student achievement data pertaining to Mathematics and Urdu, other included Science and/or Social Studies and also Islamiyat. These features are presented in a summary form in Table 11.10.
TABLE 11.10. Summary of Subjects/Areas and Grades Tested in National Level Assessment Studies
clusters whether attended, attending or
11.59 The sampling techniques and population covered also varied from study to study. Pervez drew his subjects from the sampled clusters. The sample drawn for AEPAM study does not appear to be a representative sample as the sample size from different provinces was not proportionate to their population. When aggregated national averages are reported these are likely to be biased. Studies conducted by Provincial Bureau of Curriculum collected data from a purposive sample of rural schools only. The question of drawing a representative sample
33

poses aifficulties in view of a wide variety of schools with markedly different learning environment
11.60 These features of the studies make any comparison of results difficult. However, the conclusion that primary school system is not working with efficiency and effectiveness is too obvious. This calls fer urgent reform initiatives.
Achievement Level of Primary School Children in Pakistan
11.61 The results of assessment researches have varied widely with time as well as with purpose, curricular domain, instrument, grade level, sampl'ng procedure and instrument. Shah found in 1984 that grade 5 students could correctly answer between 14 and 19 per cent questions on the Mathematics test. MSU for SAP found in 1995 that grade 5 students could correctly answcr 46 per cent questions on the Mathematics test. AEPAM study of 1999 found that grade 4 students obtained average mean scores of 72 in Science and Urdu and 59 in Mathematics.
BOX 11.1. Not bv Accident Alone There is considerable variation in student achievement levels reflected in national assessment studies conducted from Islamabad and the provincial studies conducted by each province within its own jurisdiction. This variation in <lata, collected at more or less the same time, could not be by accident alone. Just to illustrate:
--
Study Science Mathematics Urdu/Sindhi AEPAM (1999) 72 58 72 ACTION AID (1999) 75 60 71 CRDC, Punjab (1 999) 51 37 42 BCEW, Sindh (2000) 19 9 45 BCDES, NWFP (1999) 40 34 22 BCEC, Balochistan (1 999) 54 45 29
The testing culture has, perhaps, not taken roots and, hence, people do not respect sanctity of data. Perhaps, teachers are more apprehensive of data being collected by people from outside and their performance being compared with that of other provinces. There was strong suspicion that people concerned deliberately tampered with student responses. This resulted in data from Sindh being discarded in the MSU for SAP study.
Special care is indicated durinc future assessment studies to ensure valid and reliable results.
34

11.62 On the basis of assessment results reviewed in this section, an attempt has been made to estimate the level of learning achievement of grade 5 students in Mathematics, Science and Urdu. The levels of learning assessment presented in Figure 11.12 are more impressionistic than based on any weight of scores from different studies.
Figure 11.1 3 Estimated National and Provincial Levels of Student Achievement
70
60
50
40
30
20
10
0
ics and Science bv Gender Sindh I N.W.F.P.
I
Balochistan
Legend: Girls = ; BOYS= U
11.63 In the final analysis, it may perhaps be reasonable to conclude that, “on average, students do not achieve competency on more than half the material in the 5th-grade curriculum” (Benoliel, 1999).
Assessment Level Target
11.64 All children have the potential to acquire competence in all the material taught in the class. All that is needed, according to educational theorists, is suitably designed curriculum, effective teaching methodology, proper learning material, well organized academic supervision and community support. In actual practice, however, student achievement varies widely. There is no universally
35
agreed desired target that students in each country should attain. Taking the ground realities into account, each country should set the desired level of achievement for its students. To be able to monitor progress towards the target, it would be necessary to define the minimum learning level for each grade in each subject. Considering the current low level of achievement, the national target may be set at 80 per cent of the cognitive primary curricular objectives to be achieved by at least 80 per of students.
36

111. QUALITATIVE DATA FROM ASSESSMENT STUDIES
Learning assessment is primarily a management tool for improving the efficiency and effectiveness of the education system. The ultimate objective is improvement of the quality of education in schools. To improve the quality, management should strive to provide an enabling environment to all major actors. Besides, collecting student achievement data, learning assessment research also seeks qualitative data from head teachers, teachers, supervisors, students and parents. The studies reviewed in the previous chapter, collected the opinions of all major players. This qualitative data is expected to provide basis for selection of manipulatable variables for future assessment studies.
111.2 Being cognizant of the vital role of the community, teachers, educational managers and students, the Provincial Bureaus of Curriculum, which designed and carried out studies into student learning achievement during 1999-2000, also collected qualitative data from the communities. In the following pages an account of the perceptions of the major players about the quality of primary education, factors affecting student learning and suggested improvement will be offered. The purpose is to better understand the school-related, teacher-related and student-related factors, which are currently perceived to be adversely affecting the learning outcomes.
Head Teachers’ Perceptions
(a) School-related factors 111.3 Head teachers were most concerned about school-related factors. The two factors identified by Head teachers from three Provinces, were absence of teaching resources and lack of parent-teacher communication. Head teachers from N.W.F.P. and Balochistan also expressed concern over poor physical facilities in primary schools to the point of emphasizing the ‘acute shortage’ of physical facilities in rural primary schools. The head teachers from Punjab were rather concerned about ‘over-crowded classrooms.’ This may be indicative of larger enrolment in comparison to classroom areas rather than complete absence of classrooms. Apart from varying density of population, the harshness or otherwise of the climate may be responsible for the response of head teachers to the lack of physical facilities in schools.
37

111.4 Head teachers from N.W.F.P. and Balochistan also allude to the unsuitability of curricula, which they considered to be heavy and difficult. The ‘difficulty’ of curricula is perhaps associated, at least partly, to the use of Urdu, rather than regional language, as the medium in the textbooks. In Balochistan, in particular, lower qualification of most teachers, might be contributing to the difficulty in understanding the Urdu text, which is not their mother tongue. Forty per cent male as well as female head teachers think that difficulty level of textbooks affects teacher performance.
I l l . 5 Of all the provinces, head teachers from Sindh pointed out to ‘infrequent’ supervision as a factor contributing to low quality of teaching in primary schools.
Sources: CRDC, 1999; BCEW, 2000; BCDES, 1999; and BCEC, 2000.
(b) Teacher-related factors 111.6 Head teachers from Punjab were quite concerned about frequent absence and late coming of teachers. Head teachers from Sindh were concerned about late coming of teachers, but head teachers from other provinces were not. May be teacher absenteeism and late coming are not as wide spread in other two provinces as in Punjab and Sindh. The system of extended supervision, operated through the new tier of Learning Coordinators, has, perhaps, reduced teacher absenteeism in N.W.F.P. to a level where it is no longer a serious problem. (N.W.F.P., 1983)
111.7 Head teachers in Punjab and N.W.F.P. point to non-completion of course of study by teachers as an important factor contributing to low student outcome. Seen in the context of high difficulty level of textbooks, reported by headteachers,
38

non-completion of course of study may result from inability of teachers to teach lessons that they themselves find difficult to comprehend.
BOX 111.1. Where Students Closely Follow their Teachers. Question: If average percentage score of students is 46, what could be the score of their teachers?
The MSU for SAP answered this unusual question by administering a test of Mathematics both to grade 5 students and their teachers. The test was based on textbooks for grade 4 and below. The test had two types of problems: numerical and narrative. The comparative scores of students and teachers on the two components were as follows:
(Answer: 81)
Numerical Narrative Students 68 35 Teachers 90 77
The magnitude of the problem is illustrated by the following data: 77% students and 44% teachers could not answer the question: In a class of 36 students, 2/3 is boys; find the number of girls.
The study concludes, “teachers’ lower performance is the major cause of the very low standards of academic achievement in students” (MSU fnr SAP lQQFc\
111.8 Only head teachers of Balochistan expressed concerns for ‘low qualification of teachers’ and ‘inappropriate teaching methods.’ Recent expansion of primary education, particularly for girls and in rural Balochistan, perhaps necessitated lowering of qualification of teachers. The issues relating to facilitating urban teachers to take up appointment in rural schools will have to be addressed.
(c) Student-related factors 111.9 Only head teachers from Punjab and Balochistan considered student- related factors to be important determinants of student achievement. The two concerns shared by head teachers from both these provinces related to non- availability of guidancehemedial help at home and lack of student response to teaching. Non-availability of guidance at home is a hard fact of life that schools will have to live with for years. Reasons for ‘lack of student response to teaching’ need to be studied carefully. How far is this related to other concern of head teachers such as ‘parents do not bother about children’ or to ‘inappropriate teaching method’ also needs to be understood. Teachers’ Perceptions (a) School-related Factors 111.10 Teachers’ perceptions of reasons for, poor student achievement are, understandably, quite different from those of head teachers. Teachers of Sindh, N.W.F.P. and Balochistan have voiced their concern at the poverty of school
39

TABLE 111. 2. Reasons Identified by Teachers for Poor Student Achievement
Sources: CRDC, 1999; BCEW, 2000; BCDES, 1999; and BCEC, 2000.
environment/facilities. The school environment is perceived as uninspiring, dull, and uninteresting. The teachers have to strive harder to motivate children in such a school environment.
111.11 Only teachers of Punjab and Balochistan perceive absence of teaching resources as an important factor contributing to poor student achievement. Data collected from primary schools in late 1980s indicated that National Teaching Kits were available in about 70% schools (Qadir, 1990) but was rarely used (Warwick, et all 1991). Teachers need for teaching resources were perhaps not being fully met by this kit.
111.12 Teachers from Punjab and Sindh consider infrequent supervision as a cause of low student achievement. During research visits carried out under the BRIDGES programme, teachers confirmed that they learned new methods of teaching during the visits of Learning Coordinators. Data on student achievement confirmed that students taught by these teachers obtained higher scores than those taught by teachers who did not learn new methods (Qadir,
111.1 3 Some school-related factors were peculiar to one province. For example, teachers from NWFP identified ‘lack of parent-teacher cooperation’ as a cause of poor student achievement; while ‘loaded and difficult curriculum’ and ‘lack of facility for remedial teaching’ only by Balochistan. Again, only teachers from Sindh considered ‘poor quality of textbooks’ as a reason for low student achievement. Thus, teachers from different provinces identified different facets of the complex problem.
1990).
40

(b) Teacher-related factors 111.14 Teachers from all provinces were conscious of the fact that ‘inappropriate teaching method’ used by them was an important teacher related cause of poor student achievement. As a consequence of this realization, teachers of Punjab and Sindh felt the need for greater opportunities for improving their teaching. Only teachers from Punjab felt that they did not have enough opportunities for professional growth and career development. Only teachers from N.W.F.P. were concerned about their heavy teaching load, which made it difficult for them to do justice to all their students.
(c) Stud e n t - re I at ed factors 111.14 Teachers of Sindh and N.W.F.P. did not identify any student-related factor responsible for low student achievement. Teachers from Punjab again hold ‘non- cooperation of parent’ as an important factor. They also find students lacking in motivation due to dull school environment. On the other hand, teachers from Balochistan found that the long time taken by their students in commuting between home and schools and not bring their textbooks were the two most important, reasons for low student achievement.
Learning Coordinators’ Perceptions
(a) Sc h oo I -re I at ed factors
111.15 Except for N.W.F.P., learning coordinators from all other provinces expressed concerned about lack of cooperation and liaison between the community and the school (Table 111.3). Learning Coordinators from Punjab and
Sindh considered lack of physical facilities as one of the factors contributing to low student achievement, while lack of learning resources were emphasized for Punjab and Balochistan.
41

111.16 Learning Coordinators from N.W.F.P. and Balochistan questioned the suitability of curriculum, while those from Balochistan questioned the desirability of using national rather than the regional language in primary schools. Learning Coordinators from N.W.F.P. were of the view that use of local language by teachers would result in lowering of standard of student achievement. These are recurrent themes and need to be given serious thought by administrators and planners. Two other issues raised by Learning Coordinators deserve special consideration. One relates to ‘poor school administration’ and other to ’inadequate examination system.’ The concern for examination system can be viewed in the context of importance attached by Learning Coordinators to evaluation as a means of improving classroom teaching (N.W.F.P., 1983).
BOX 111.2. What Mars the Learning Environment in Schools? All major players lament shortage of building, furniture, equipment, teachers and supplementary learning resources. However, they also voice concern for not making maximum utilization of available resources.
Head Teachers Plavers Opinion
Absence of teaching in school. Irregular attendance and late coming of
Non-completion of course of study. Inappropriate teaching method.
teachers.
Teachers
Supervisor
Parents
Students
Infrequent supervision. Lack of facility for professional growth and
Loss of student time in commuting. improving teaching methodology.
Late coming of teachers. Non-completion of course of study. Inappropriate examination. Heavy curriculum.
Teaching method fails to motivate students.
Complete absence of co-curricular activities
Corporal punishment to children. including literary activities.
Supervisors believe that poor school administration and impolite attitude of teachers towards students mar the environment for learning in schools. Effective administration and politeness do not require additional resources.
42

(b) Teacher-related factors
111.17 Like head teachers of Punjab and Sindh, Learning Cooordinators from these provinces were also concerned about late coming of teachers. Learning Coordinators from N.W.F.P. and Balochistan, on the other hand, were concerned about non-completion of course of study by teachers. In addition, LCs from Balochistan were also concerned about the presence of unqualified teachers in primary schools.
Students’ Perception
111.18 Students are the one’s directly affected by the quality of instruction provided in schools. They are quite observant and perceptive of events taking place around them and are known to be able to articulate their views. All that is required is to win the confidence of students and establish rapport with them. It is unfortunate that interviewers could not establish enough rapport with students to make them open up their hearts. No student views are reported from Punjab and Sindh.
111.19 Students from N.W.F.P. lamented the complete absence of co-curricular including literary activities in the school. Some pointed out that though the school has the playfield, no sports goods are available. The students also pointed out that they were occasionally administered corporal punishment by the teachers. The prevalence of corporal punishment in N.W.F.P. is documented in a study into the impact of Primary Education Project in that province (Qadir, 1990). Finally, students complained of their responsibilities at home, which are both tiresome and time consuming.
I l l . 20 Primary school students were also burdened with responsibilities at home. They also expressed their concern at the inability of their parents to assist them with the homework assigned by teachers. This, they thought, was adversely affecting their performance in school.
Parent’s Perceptions 111.21 The lack of communication between the community and the school, of which head teachers, teachers and LCs from Punjab and Sindh complain about, is fully reflected in the absence of their responses to the questionnaires devised for this purpose. Only community members from N.W.F.P. and Balochistan made known their perceptions of the school.
111.22 Parents from N.W.F.P. strongly felt that poor qualification of teachers was mainly responsible for poor quality of teaching in schools. Balochistan parents thought that inappropriate teaching method used by teachers failed to motivate children to take interest in schoolwork. They also recognized that their inability to provide guidance and support to their children at home was affecting learning performance.
43

111.23 A number of factors contributing to the poor quality of instruction in primary schools have been identified by head teachers, teachers, LCs, parents, and students. All the concerns of the stakeholders are very genuine. It would be necessary to take all these into consideration in any school improvement effort. The government will need to take some strategic decisions to address some of the concerns, particularly those requiring considerable investment of critical resources. However, stockholders’ perceptions would provide valuable insight into issues that need to be addressed on priority basis.
BOX 111.3. Of curriculum and Student Achievement During most of assessment studies conducted in the Provinces during 1 999-2000, head teachers, teachers and supervisors complained that the curriculum was too heavy and unrelated to student environment.
Little did they know that the same point of view was reflected in the findings of the first assessment research conducted in 1984 under the Primary Education Project. The research concluded that:
Given such low performance one is prompted to ask if one can afford to include peripheral luxuries in the curriculum. The problem faced in primary schools of Pakistan is not that of selecting appropriate enrichment material and exercises for children. It is rather one of addressing oneself to what are the basic minimum competencies a child must acquire.
During the last fifteen years, the curriculum designers did not give weight to assessment research findings and with what consequences.
44
IV. LEARNING ASSESSMENT FOR QUALITY IMPROVEMENT
A large number of leaning assessment studies have been organized in Pakistan between 1983 and 2000. The earliest initiative came from foreign-aided projects. This helped in capacity building and creation of awareness. Recently, however, learning assessment studies have been planned and executed exclusively by Pakistani educators. Thus, time is ripe for establishing a full-fledged national assessment system to improve the quality of our primary education and to fulfill international commitments under the World Declaration on Education for All and the Dakar Framework for Action.
New Directions
IV.l The assessment studies conducted so far have largely concentrated on testing students’ mastery of textbook material. Most of the items used in the tests were constructed by lifting material directly from the school textbooks. These tests provided useful information and insight into the strengths and weaknesses of the primary education system. What is needed now is to give learning assessment a new direction so as to focus on national needs. Some of the new dimensions, which need to be attended to are indicated below.
(a) Testing student competencies
IV.2 A shift from testing for mastery of textbook contents to testing student competencies would provide more useful data on which to plan quality improvement. It may not be quite useful for designing policy initiatives to know that student achievement is low in a particular subject. It might be more helpful for curriculum experts; textbook writers and teacher trainers to know which sub- domains are creating difficulty. To properly focus assessment research, it would be necessary to have an agreed list of competencies that students should have at the end of each grade. This exercise involves translating curriculum objectives into learning outcomes. These learning outcomes need to be stated in behavioural terms so as to form basis for assessment.
IV.3 Learning outcomes can generally be divided into two: those that should be mastered by all students, and those that provide for maximum individual development. The former are generally known as mastery outcomes and are concerned with the minimum essentials of a course. These learning outcomes are those that a student must demonstrate if he/she is to be successful at the next level of instruction. The developmental outcomes, on the other hand, are
45

concerned with those objectives that never can be fully achieved. Here, we can expect varying degrees of pupil progress along a continuum of development (Gronlund, and Linn, 1990). The bifurcation of learning outcomes into mastery and development outcomes is illustrated in Figure IV.l.
IV.4 Mastery objectives are typically concerned with relatively simple knowledge and skill outcomes. Each intended learning outcome can be analyzed in considerable detail to describe the expected pupil performance in very specific terms. It is possible with mastery objectives to specify a large representative sample of the specific responses expected of the pupils at the end of instruction. For example, the objective to “add whole number,” might be further defined by a list of specific tasks such as the following:
o Adds two single-digit numbers with sums of ten or less. o Adds three single-digit numbers with sums greater than ten. o Adds two two-digit numbers with simple carrying.
To realize the objectives of the curriculum, the instructional process should be geared to bring all pupils to the same level of mastery learning outcomes.
IV.5 complex learning outcomes e.g., understanding, application, and thinking skills.
Development objectives, on the other hand, are concerned with more
FIGURE IV.1, Mastery and Development Learning Outcomes
can add two two-digi can identify colours can show rivers and moun
can draw a tree
I I Source: Illustration based on material from Gronlund, and Linn, 1990
46

Because these objectives emphasize high-order learning outcomes that stress application of knowledge and skills to new situations, the pupils can be expected to show varying degree of progress.
IV.6. If quality education implies acquisition of basic learning competencies by most pupils, this is possible only if the textbook writers have designed textbooks with these clear objectives and if teachers have been trained accordingly. Anecdotal evidence shows that no primary school has a copy of the national curriculum; and no primary teacher has ever been briefed about the curriculum he is supposed to teach. The textbook is the only material provided to him. It seems unfair to expect a teacher to attain curricular and instructional objectives, when he has never been presented one and trained in it.. The capacity building measures should help teachers develop an understanding of curricular and instructional objectives that they are supposed to achieve through teaching. This would prepare teachers to shift the focus from the textbook to specific learning outcomes.
(b) Selection of manipulatable variables
IV.7 For assistance in policy formulation, assessment studies should provide data on factors affecting student learning. The factors selected should be those over which the policy-makers can exercise control through systemic changes or resource allocation. Some of the useful areas to research into could be:
Urban-rural, boys-girls, academic and professional level of teacher, teacher-student absenteeism, teacher classroom behaviour including such practices as supervised classroom practice, home work, use of the class monitor, teaching aids/a-v aids, etc. management and supervisory practices, hours per week/year for which different subjects are taught, type of school (mosque, primary, primary attached to middle or high school), school ownership (state, private commercial or NGO/trust), school admission/promotion and examination policies, includidng such phenomenon as katchi class, repetition, automatic promotion, etc. children’s mother tongue. Multi-grade teaching. Instructional material
Carrying out of a learning assessment study should not be an end in itself but a means to make bold recommendations for improvement of the national education system. Learning assessment should also research into the impact of changes introduced, leading to further adjustments, if indicated. This process should be continued till the best fit is achieved, given the resource constraint.
47

(c) Sampling Technique
IV.9 Sampling technique is another area in which improvement is indicated. Without the use of proper sampling procedures, it would be difficult to generalize and win support for the recommendations from policy-makers. It can safely be asserted that the population is very heterogeneous in respect of the variable that the study seeks to estimate, namely level of student achievement. This can be posited with confidence in view of wide variation in factors affecting teaching- learning environment in schocls. To control heterogeneity in population, the major categories of sample units, institutions imparting basic education, may be treated as independent stratum and sample selected from each stratum according to a well designed stratification plan, which should ensure selection of sample on the principle of probability proportionate to size.
IV.10 A listing of possible sample units is at diagram IV.2 on the next page. NEMIS has sufficient and reliable data on which to design a stratification plan. To obtain an estimate of the national/provincial/regional level of student performance, it would be necessary to draw up a sample which is a true representative of the population.
(d) Analysis of assessment data
IV.ll Proper and goal-oriented analysis of assessment data is the crux of the whole matter. Many studies, which were reviewed, appeared weak on that account. It would not be enough to provide descriptive data indicating differences in performance in various categories. For assessment studies to present convincing data on policy initiatives, the analysis must go beyond mere descriptive of achievement scores. It must explore the reasons underlying the differences. The factors affecting student performance must be identified in order for the assessment to lead to concrete corrective measures for quality improvement.
IV. 12 Complete data is needed on manipulative variables, besides school, teacher, students, etc. This would permit analysis of data to be carried beyond the macro level. For example, if initial analysis indicates that urban students perform better on mathematics, the analysis may be carried further to determine the type of institution, the qualification of teachers, the literacy level of parents, the system of admission/examination/promotion followed, and so on.
(e) Testing strategy
!V.13 The assessment studies conducted so far tested students in different stibjects at different levels. In view of resource constraints, It may be desirable to evolve a testing strategy. Instead of testing students in all subjects and at all levels, a phased programme of assessment may be more cost effective.
48

FIGURE IV.2. Sample Frame for Learning Assessment Studies I With building
- URBAN
IMPARTING BASIC Mosque schools
Without building <With building
< With building , With building
Without building With building
Primary schools Without building
Middle schools Without building
High schools
Higher secondary< schools Without building
Army Garrison Schools
Model schools < Medium
Schools under public sector corporations
Private schools <
English Medium
Urdu medium
English medium
Urdu medium Schools under Trusts/NGOs < English medium
‘ Mosque Schools < Primary schools <
Without building With building
Without building With building
Without building Middle schools , < With building
Without building With building
High schools
Higher secondary< schools Without building
RURAL
NOTE: (1) Break-up of schools into ‘with building’ and ‘without building’ by province and region is available in School Education Statistics (Pakistan, November 1999). (2) A similar sample frame required for girls schools.
49

Perhaps, it may be advantageous to focus initially on student achievement in science, mathematics and languages in grade 3. Again, given the limited time available for testing, it might be desirable to select a few curricular sub-domains so that a reasonable number of items in each sub-domain can be included to enhance reliability and validity of the tests. As it is, some of the assessment studies relied on very few test items. Item analysis makes it possible to shorten a test and, at the same time to increase its validity and reliability. However, other things being equal, a longer test is more valid and reliable than a shorter one (Anastasi, 1982).
(f) Sanctity of Data
IV.14 For a variety of reasons, the sanctity of datdinformation is not respected in our culture. People tend to mould facts to suit their personal ends. Schools tend to be apprehensive of an external agency conducting an examination of their students. Unsure of the use to which student achievement data might be put, schools want to look good. administration of achievement test to ensure validity of data.
Extra precaution needs to be taken
BOX IV.l. Ghost Students in Primary Schools of Pakistan?
In some developed countries, there are ghost writers of term papers and dissertations. In Pakistan, there are ghost primary school students. MSU for SAP had to discard all test protocols from Sindh on suspicion of having been responded to by ghost students. More specifically, they found that ”the tests to both students and teachers could not be administered in the true spirit of the survey” (MSU for SAP, July 1995).
In Northern Areas, Abideen and Jones also experienced difficulties in ensuring collection of achievement data in a standardized way (Abideen and Jones, November 2000). The motive to project an improved image of their students/school perhaps prompted some to violate the sanctity of student achievement data.
In the short run, the problem could be tackled by extra security measures to ensure valid data from assessment exercises. In the long run, however, steps need to be taken to create awareness and to allay unfounded apprehensions. Presentation of national and provincial results during workshops held at provinciaVregional levels could show that students of each province/district were equally good or even better than others in some fields. A short summary of findings and recommendations could also be disseminated widely throughout the country to create a testina culture in the countrv.
during
50

Making Assessment Work
IV. 15 Learning assessment has the potential to identify the strengths and weaknesses of the system, to unearth the underlying reasons and to recommend a viable improvement strategy. But the success depends upon creating necessary environment for change and upon tackling the issues of ownership and accountability.
IV. 16 Development of quality primary education requires a facilitating environment that can be created only by addressing to the following strategic issues:
(a) Entry Age and Duration of Schooling
IV.17 Pakistan is one of the three countries in the world where nine-year-old children are ready to start secondary education after completing five years of primary education. Children from 14 other countries also start secondary education at nine but they have had six or seven years of primary education. Thus, only three of the 217 countries provide 5 years of primary education and set the entry age at 5 years (Table IV.1). Age of entry into, and duration of, primary schooling are issues that are critically affecting quality. The primary school curriculum seeks to impart knowledge and skills required for pursuing studies at the secondary level. That this can be done through five years of schooling, beginning with five-year-old children, needs to be examined in the light of past experience and the socio-economic level of the country. A large proportion of Pakistani children, particularly rural children, do not have an adequately stimulating home and community environment. Newspapers and other reading material, including children’s literature, and the electronic media, provide considerable stimulation at home to children of literatehrban families. Literate parents prepare children at home for entry into primary school. Thus, by age five, urban children and/or children of literate parents are ready for the school. Not most rural children, mainly duo to illiterate parents.
IV.18 Five years of primary schooling, for children who have not received the desired level of stimulation from home and environment, is singularly inadequate. How the world copes with this issue is presented in Table IV.l in a summary form. This table has been extracted from Annex I l l , which provides information about the number of countries using different entry age and duration of primary education.
IV.19 Only 36 countries of the world set the entry age at five years or less but, with the exception of three, all provide primary education for six to nine years. Looking at it from another angle, 63 countries provide primary education to their children for five years or less, but except three, all start at age six or more. Thus, the countries that send children to primary school at a younger age, keep them
51

for a longer period there. modal entry age and duration of primary education are six years.
For the world primary education system, both the
TABLE IV.1. Number of Countries with Different Entry Age and Duration of
Source: UNESCO, Stdatktical Yearbook 1999.
(b) Unrealistic Admission Standards
IV.20 Two circumstances combine to make memorization the only practical methcd of teaching in primary schools. To qualify for admission into grade one, a child must be able to count up to 100, recognize Urdu alphabets (and now perhaps English alphabets also), read words and/or paragraph, demonstrate some knowledge of science, and recite verses from the Holy Qur’an (N.W.F.P., Kachi-Study, 1991 ). Much of the knowledge/information expected of children seeking admission into class one is “considered class one material” in many other countries (NW FP, Multi-Grade Study, 1991). Since rural and/or illiterate parents can not prepare children at home to qualify for admission into grade one, they send young children to school along with their elder siblings. These children are first kept, not admitted, into ‘zero’ class and after some progress they are kept, again without being formally admitted, into kachi class. Since students of zero and kachi classes are not officially recognized, no teacher is assigned for them. Burdened with teaching of five ‘regular’ classes, the teacher set tasks for zerc and kachi classes, which they can accomplish only through memorization. Thus, difficult admission criteria and absence of teachers qualified to conduct multi-grade teaching, set children and teachers well on road to memorization as the only tool of learning.
(c) Mixing Pre-school with Primary School
IV.21 Presence of pre-school children in primary schools, which are inadequately staffed even for the regular primary classes, complicates the issue of quality. The prescribed qualification of primary teachers is too low in view of
52

the poor quality of our teachers prepares them resort, nor for handling levels
school graduates. The training imparted to primary neither for multi-grade teaching, to which they have to pre-school children. Most primary schools have two
of pre-school: ‘zero class’ and ‘kachi class.’ In a study of 64 primary schools of N.W.F.P., eight from each of the eight selected groups of districts, all schools had a ‘kachi class’ and 77 per cent contained a ‘zero class’ also. In 75 per cent of the schools, the youngest ‘zero class’ child was 4 year old; in 23 per cent he was 3 year old while in 2 per cent he was 5 year old. Similarly, in 43 per cent schools the oldest ‘zero class’ child was 5 year old while in the rest he ranged up to 7 year old (N.W.F.P., Kachi-Study, 1991).
IV. 22 Children repeating ‘zero/kachi class’ a number of times and becoming overage at the time of admission into class I, pass through a frustrating experience of lasting impact on their intellectual and emotional development. Researches indicate that (a) younger children tend to score higher than elder children, and (b) students repeating a class tend to remain under-achievers as compared to the rest of the class (MSU for SAP, 1995). Thus, the policy of keeping students in ‘zero and kachi’ classes without accepting any responsibility and without providing teachers for them, creates an educational environment that is conducive to lowering of student achievement.
IV.23 Children’s attitudes towards the school are formed largely by experiences during the early years of schooling. With children repeating pre-primary classes for several years before moving to class one (N.W.F.P., Kachi-Study, 1991), the reported drop-out rate of 3 per cent in ‘zero class’ and 5 per cent in ‘kachi class’ appears to be modest. If the student-years spent in ‘zero’ and ‘kachi’ classes are taken into account the ‘real’ efficiency of the primary school system will be abysmal.
(d) The issue of ownership
IV.24 A number of initiatives in the past failed to materialize and deliver because the educational administrative machinery, particularly at the grass-root level, did not own it. The project-driven initiatives lack sustainability also. Accordingly, the whole effort goes waste as soon as project support is withdrawn.
IV.25 For the ownership to grow and seep into the system, it would be necessary to associate concerned actors at all tiers. The ownership is also likely to grow if the initiative quickly shows some result and all feel that they have made a contribution. The ownership may be strengthened if curriculum experts, textbook writers, teacher trainers and academic supervisors doing their act together. Finally, sustained political will is crucial if primary schools are to be converted into efficient and effective delivery points of quality education for all.
53

Serial No. 1.
2.
3.
4.
5.
6.*
7. *
8.'
9.*
10.'
ii.*
A number of researches on achievement test data in Mathematics and Science of grades 4 and 5 students. Differential Achievement of Primary Age Students and the Cost Effectiveness by School Type Basic Competencies of Children in Pakistan
ANNEX I ASSESSMENT RESEARCHES IN PAKISTAN AT PRIMARY LEVEL
1988- 89
1994
1995
Author(s)/Research Organization Prof. Mubarik Hussain Shah
(Not known)
(Not known)
(Not known)
Haward Institute for International Development, Harvard University, Cambridge, Mass., USA. Prof. Dr. Munawar Mirza and Dr. Abdul Hameed, Institute of Education and Research, University of the Punjab, Lahore. Dr. Muhammad Pervez, Quaid-i-Azam University, Islamabad. Multi-Donor Support Unit For the Social Action Programme (MSU-SAP). Institute of Education and- Research, University of the Punjab, Lahore. North West Educational Assessment Programme. Bureau of Curriculum and Extension Wing, JAMSHORO, Sindh. Primary Education Directorate, QUETTA, 1998
1998
1999
Balochistan. Bureau of Curriculum and Extension Wing, JAMSHORO, Sindh. Test Development Centre, Education Department,
Title I Date
I 1984 National Achievement Tests (Protocol Analysis)
Determinants of Primary Students' Achievement -
(Not known) I
(Not known)
(Not known)
QwunuL. uaaicl uniiia r~aacaa~~iciii -,-I I aniaiai1 waaG uruuy, I I IGIIIG
ED1 Seminar held at Bhurban (February 7-1 0, 1999).
Sponsoring 0 rg an izat ion
Primary Education Proiect
US AID
Primary Education Project
UNICEF
MSU-SAP
Primary Education Project PEDP (NWFP)
SPEDP
BPEDP
SPEDP
Punjab Middle Schooling Project
at
54

ANNEX I (Continued) LEARNING ASSESSMENT RESEARCHES IN PAKISTAN AT PRIMARY LREVEL
Serial No. 12.
13.
14.
15.
16.
17.
18.
19.
Author(s)/Research Organization
Action Aid Pakistan, Islamabad.
Bureau of Curriculum Development and Extension Services, Abbottabad, NWFP.
Punjab Literacy Watch
Curriculum Research and Development Centre, Lahore Academy of Educational Planning and Management, ISLAMABAD. Bureau of Curriculum and Extension Wing, Government of Sindh. Bureau of Curriculum and Exrtension Centre, Quetta, Balochistan.
Directorate of Education, Gilgit.
Title
Comparative Analysis of Public, Private and NGO Schools Learning Achievement of Grade 3 to 5 Children in Rural Primary Schools.
Levels of Pupil Achievement in Primary Schools of Punjab, Pakistan: A Sample Study Learning Achievement of Grade 3 to 5 Children in Rural Primary Schools Measuring Learning Achievement at Primary Level in Pakistan
Base-!ine Survey of Learning Achievement
Learning Achievement of Grade 3 to 5 Children in Rural Primary Schools of District Pishin, Balochistan Baseline Achievement of Class 4 Students in Northern Areas. Pakistan
Date
1999
1999
1999
1999
1999
2000
2000
2000
Sponsoring Organization Action Aid Pakistan, Islamabad.
UNESCO
UNESCO
UNESCO
UNESCO
UNESCO
UNESCO
NAEP
55

Author(s): Prof. Mubarik Hussain Shah
Research Institution: Primary Education Project, Ministry of Education.
Publication Date: July 1984 Sponsors, if any. Primary Education Project, Ministry of Education.
Subject Grade Punjab Science 4 20.1 Mathematics 5 19.8
Sindh N. W.F.P 25.9 16.9 19.3 14.1
56
Subject Grade Punjab Sindh
Science 4 16.7 31.8 16.2 31.6 Mathematics 5 16.7 26.4 12.9 29.4
Lowest Highest Lowest Highest N.W.F.P
Lowest Highest 10.5 22.0 9.1 21.8
Subject Grade Punjab Sindh P Non-P 1 P Non-P
N.W:F.P P Non-P
~
Science 4 22.2 17.0 26.7 24.1 19.3 .*I Mathematics 5 21.4 16.8 20.8 16.4 26.7

1 Conclusions: H Implications for curriculum
Given such low performance one is prompted to ask if one can afford to include peripheral luxuries in the curriculum. The problem faced in primary schools of Pakistan today is not that of selecting appropriate enrichment material and exercises for children. It is rather one of addressing oneself to what are the basic minimum competencies a child must acquire. Item type Children have performed significantly better on multiple-choice items than on completion items. It is important to note that the drop in performance is much less for Mathematics than for Science. This may be because Mathematic completion item rely less heavily than Science completion items upon language. Inter-Provincial differences in performance There are considerable differences in the mean scores of the three provinces. Breakdown of performance on types of items indicates that performance of students from N.W.F.P. and Sindh is much worse on completion items. This leads to the conclusion that language is perhaps the dominant factor.
57

Author(s): Prof. Dr. Munawar Mirza
Research Institution: Dr. Abdul Hameed
Institute of Education and Research, University of the Punjab, Lahore
58
Publication Date:
Sponsors, if any. Primary Education Project, Ministry of Education.
Province
Pun] ab
Sindh
N.W.F.P.
Balochistan
TOTAL
School Type Gender Mosque 2Teacher 5Teacher Primary Primary TOTAL
Male 30 30 30 30 30 150 Female 31 31 30 29 121 Male 15 10 14 4 6 49 Fernale 7 14 4 4 29 Male 10 10 10 10 6 46 Female 10 10 10 3 33 Male 5 5 5 5 5 25 Female 5 5 4 5 19 Male 60 55 59 49 47 270 Female 53 60 48 41 202 TOTAL 60 108 119 97 88 472
PS PS in MS in HS
-
-

Results: Average mean scores of grade 3 and grade 5, which show the effectiveness of
TYPE OF SCHOOL
Mosque 2 Teacher PS 5 Teacher PS
schools in promoting cognitive performance and inculcating desirable behaviour, are presented below:
GROSS ACHIEVEMENT SCORE GROSS BEHAVIOUR SCORE Mean Rank Order Mean Rank Order 53 5 65 5 54 4 75 4 58 2 83 3
Primary with MS Primary with HS
59 1 92 2 57 3 99 1
Conclusions: . . . .
Primary sections of middle schools were most effective in promoting cognitive performance Primary sections of high schools were most effective in mouldings the behaviour of students In terms of cognitive achievement, the five teacher primary schools were the most cost-effective Extremely low correlation between achievement scores and per-student cost shows that student achievement is not a function of per-student cost.
Recommendations: o Existing sub-standard primary schools should be developed into five teacher and
five classroom schools. o Instead of opening new primary schools for small settlements, more seats and
classrooms should be provided in the nearby primary schools.
59

Author: Dr. Muhammad Pervez
Research Institution: Pakistan Psychological Foundation, Quaid-i-Azam University, Islamabad.
60
Publication Date: March 1995 Sponsors, if any. UNICEF (Pakistan)
Provinces
Punjab Sindh N.W.F.P. B aloc hi s tan Pakistan
RURAL URBAN TOTAL Total Girls Boys Total Girls Boys 468 132 336 427 219 208 895 449 48 401 435 175 260 884 140 17 123 266 111 155 406 184 28 156 213 122 91 397 1241 225 1016 1341 627 714 2582

I The results indicate that few 11+ children of Palustan possess basic competencies (obtained 67% of the possible maximum score in each of the four areas of competency). Only 5.7 % children were competent in all the four competencies while about 21% children were competent in any three of the four competencies. Over 12% of 11+ children were found competent in three competencies, even though they did not go to school. Percentages of competent children in specific competencies are given below:
Competencies % of competent children Competencies % of competent children
Life Skills Knowledge 26.1 Writing Letter 18.1 Rote Reading 63.7 Numeracy and Arithmetic 69.6 Reading with Comprehension 26.8 Mental Arithmetic 67.7 Writing from Dictation 6 1.7 Reading of Holy Qur’an 44.2
The competency of writing a letter is the lowest in Pakistani children. This is not an unexpected finding because it involves some originality while most of education in Pakistani schools emphasizes rote memorization and mechanical reproduction. That is why we see many children doing fine on Numeracy and Arithmetic, Rote Reading and Writing from Dictation. Percentage of competent children in Punjab, Sindh, Balochistan and NWFP are 23.2, 22.9, 21.9 and 9.1 respectively. The results indicate that 11.8% of rural children as against 29.2% of urban children are competent. Similarly, gender differences are also quite marked: 28.5% girls as against 16.8% boys are competent.
Conclusions: The most significant finding of this study is that only 20.7% children are competent at levels, which were considered to be basic. This indicates that the society or the school has failed in making a large majority of children competent. The failure of school appears dramatic when we see that only 18.1% children have competency to write a letter. Pakistani schools are only providing rote-memorization-based skills, which children use in a mechanical fashion for the solution of problems. Whatever are the levels of competencies, they are more or less a direct result of schooling. Girls, with the only exception of Numeracy and Arithmetic, are consistently better than boys. Although passing primary school (i.e. class V) is a terminal stage of education for most of Pakistani children, it appears not to be a level of education which could help children continue education. Recornmenda tions : More primary educatjon and better primary education is required in Pakistan. A shift away from the rote memorization and mechanical drill is necessary. Improvement in quality is much more urgently required in rural schools. School must directly respond to community needs and community must find a way to exmess their exDectations from the school.
61

Study No. 4 I Title: Determinants of Primarv Students’ Achievement - National Survev Results
Research Institution: Multi-Donor Support Unit
(Data collection through Accountant General’s Office) For the Social Action Programme.
Author(s):
Sponsors, if any. MSU for SAP
Publication Date: Julv 1995
(b) Sample: The survey focused on students and teachers of class V of government, private commercial and NGORrust schools. In all, 527 schools were covered throughout the country under the survey. The number of teachers and students covered were 914 and 11,563 respectively. However, the data from Sindh province had to be discarded as the results indicated that the test to both students and teachers could not be administered in the true spirit of the survey. The sample was, therefore, reduced to 462 schools, involving 782 teachers and 9,901 students (in the provinces of Punjab, N.W.F.P., and Balochistan, and areas under the control of the Federal Government, e.g. ICT, AJK, FATA and FANA).
The MSU-SAP designed the survey. The Auditor General of Pakistan was responsible for collection of data under third party arrangement.
(c) Survey:
TOTAL Girls I Boys I Total
62.2 I 59.2 I 60.6
62

Conclusions: The survey findings show that the performance of students was satisfactory in terms of composite score, and they did quite well in both general knowledge and comprehension tests. However, their performance was not up to the mark in the mathematics test. While the average scores in comprehension and general knowledge were in most cases above 70 percent, the scores in mathematics were only 47 percent for boys and 44 percent for girls. The students consistently scored significantly less on the narrative problems. The capacity of the primary education system to equip the students with general knowledge seems rather limited. In rural areas, trained teachers accounted for an increase of 12 percentage points in the students score. Generally, the scores of students improved with the higher qualification of teachers. Schools in a mixed setting or with female teachers in rural areas would be conducive to increasing the student performance as students taught by female teachers scored 64 as against 55 by students taught by male teachers. Achievement of students of private schools was consistently better than that of government schools (composite scores of students from government and private schools being 59 and 68 respectively). In terms of total score in the three test components, the general trend was that male teachers scored higher than the female teachers. The trend was, however, significantly opposite in the case of ICT. A vast difference existed in the teachers’ performance across provinces/areas. The highest cumulative score, for rural and urban areas combined, was recorded for Punjab province where the teachers correctly answered 91 percent questions. The lowest score was recorded in FANA where the teachers scored 77 percent. There was a consistent trend of scoring less on narrative questions, compared to the numerical questions, bv both male and female teachers in rural as well as urban areas.
Recommendations: o Qualifications for teachers need to be raised. o Both the content and approach of the programmes of teacher training needs to be
evaluated. o The promotion of mixed schools with mixed teaching arrangements, or with female
teachers, could help to advance students’ achievement.
63

Title: Comparative Analysis of Public, Private and NGO Schools Author(s):
Research Institution: Action Aid Pakistan, UK Sponsored NGO, Islamabad.
Publication Date: 1999 Sponsors, if any.
Purpose of study: To compare the performance of grade 4 students of public, private and NGO schools. Methodology:
(a) Instruments: (i) Learning assessment questionnaires in Mathematics, Urdu and General knowledge for grade 4 students.
(ii) Focal group discussion and interview with community leaders.
NGO schools. The survey covered 50 sample schools and 965 students in public, private and NGO sectors. These schools were sampled from six districts from the four provinces and AJK.
(b) Sample: The survey focused on students of grade 4 of government, private and
Range of Marks I Average 4049% 60-79% 280%
30 20 21 23 26 24 19 39 28 24 28 24
32 28 31 32 21 38 16 27 36 27 26 40
12 26 48 14 24 50 8 20 71 12 23 56
32 31 25 33 24 31 14 37 47 27 31 33
Subjects
Mathematics
School Type
Public NGO
Private ALL SCHOOLS
Public NGO
Private ALL SCHOOLS
Public NGO
Private ALL SCHOOLS
Public NGO
Private ALL SCHOOLS
Urdu
General Knowledge
Composite Score
57 59 66 60
67 68 80 71
71 73 83 75
64 66 75 68
<40 %
29 27 14 24
9 9 1 7
14 12 1 9
12 12 2 9
64

Conclusions: The overall average percent scores were 64 for government schools, 66 got NGO schools and 75 for private schools. Thus students of private school performed better than those in NGO and private schools. The overall difference between NGO and private schools was only marginal and could arise due to sampling. Only 25 per cent students of public schools scored 80 per cent or more as against 31 per cent from NGO schools and 47 per cent from private schools. Similarly, 12 per cent students from both public and NGO schools scored less than 40 per cent marks whereas only two per cent private school students scored that low. O n the whole, students performed better in general knowledge, followed by Urdu and then mathematics. The same was the pattern for students from all the three types of schools. 84 per cent students of private schools scored 60% or more questions correctly as against only 56 per cent students from public and NGO schools. The test results were consistent with opinions expressed during fxus group discussion and interview. Four out of six foc1.is group participants thought that the quality of education in private schools was better than that in public and NGO scl-,001s. The ranking given to the schools in terms of quality of education was: private schools, NGO schools and public schools.
65

iuthor(s): Dr. Habib Khan, Syed Dawood Shah, vlirza Tauhiduddin Ahmad, Nasir Amin, Dr. Humala (halid, and Ahmad Nawaz Malik Research Institution: icademy of Educational Planning and Management, SLAMABAD
Publication Date: 1999 ,
Sponsors, if any. UNESCO, Islamabad
ICT TOTAL
1 4 2 6 69 48 117 28 75 70 145 1411 1383 2794
66
Subject Statistic
Science Mean
Mathematics Mean
Urdu Mean
SD
SD
SD
Urban Rural Boys Girls Total Boys Girls Total 75 78 76 68 69 69 16 14 15 19 18 19 62 62 62 56 52 54 22 23 22 23 25 24 73 79 76 64 71 67 23 22 22 25 24 25

I (c) Subject-wise Performance for Urban and Rural children at Provincial Level (i) Science Urban
Boys Girls National 75 78 Punjab 80 88 Sindh 86 85 NWFP 70 73 Balochistan 68 68 Federal Areas* 67 71
- Total 76 84 85 72 68 69
(ii) Mathematics
National 62 Punjab 70 Sindh 77 NWFP 64 Balochistan 52 Federal Areas* 47
Boys Urban Girls Total 62 62 71 70 82 80 53 57 44 48 50 49
Boys 68 80 86 65 52 60
Rural Girls 69 79 82 71 68 54
Total 69 79 85 68 60 57
Rural Boys Girls Total 56 52 54 63 67 65 82 82 82 58 51 55 41 44 42 41 32 37
(iii) Urdu Urban Rural
National 73 79 76 64 71 67 Punjab 80 88 84 76 84 80 Sindh 87 94 91 85 91 88 NWFP 72 65 68 60 74 66 Balochistan 59 69 64 49 67 58 Federal Areas* 65 67 66 54 52 53 * (FANA, FATA, AJK, and ICT combined)
Boys Girls Total Boys Girls Total
Overall Boys Girls Total 71 74 72 80 84 82 86 84 85 66 72 69 62 68 65 63 60 . 62
Overall Boys Girls Total 59 57 58 66 69 68 79 82 81 59 52 55 48 44 46 44 39 41
Overall Boys Girls Total 68 75 72 78 86 82 86 94 90 62 71 67 55 68 62 58 58 58
Conclusions:
.
.
.
Students demonstrated high performance in Science and Urdu whereas their performance was low in Mathematics. In Science and Urdu, the performance of girls was significantly higher than that of boys whereas in Mathematics, boys had an edge over girls. In all three subjects, urban boys and urban girls out performed their rural counterparts . In all three subjects, the average scores of Sindhi children were the highest followed by those of Punjab and NWFP. Performance of students from FATA, FANA, AJK, Balochistan and NWFP was significantly low as compared to performance of students from Punjab and Sindh.
67

(B) Provincial level researches
Author(s): Charagh Din Arif, Saima Chaudhary and Uzma Gilani Research Institution: Curriculum Research and Development Center, Punjab Education Department, Lahore.
Publication Date: October 1999 Sponsors, if any. UNESCO, Islamabad
Schools Head Teachers LCs Parents Students Teachers Ouestionnaire I Tests
20 20 60 8 60 60 200
68
Class Maths Science
I11 48 47 49 43 40 46 T B G T B G T B G T B G
S. Studies Urdu
28 30 26 43 40 46 IV V
37 37 37 51 48 54 27 30 24 42 42 42 50 49 52 51 50 52 21 24 18 50 52 48

Conclusions: (a) Learning Achievement: Students in all grades obtained lowest marks in social studies. Students in higher grades answered lower percent of questions correctly than students in lower grades. Students of grade 4 obtained lower scores in Mathematics and Urdu, than grade3 children. Learning Coordinators complaip of non co-operation of teachers and parents with them. According to them late coming of teachers is a serious problem. They would like the curricula to be need-based and activity-based. Learning Coordinators suggest that objective-type questions should be included in the question papers. (b) Head Teachers: Majority of the head teachers is not satisfied with standard of teaching. According to head teachers, the teachers often attend classes late. Educated parents do not bother about the progress of their children. Communication is lacking between parents and teachers. Teachers are not regular in attending schools. Students do not respond to teaching and no guidance is provided to students at home. The classes are overcrowded. Audio-Visual aids are not provided to schools. (c) Teachers: Teachers complain of non-cooperation of parents; lack of teaching aids; content in textbooks not being related to the environment; and non-availability of Audio-Visual aids and other basic facilities. Teachers point out the need for training to improve teaching methodology and opportunities for their professional growth. L.C.s visit schools regularly, but supervisor and higher authorities visit very rarely. Teachers attribute the low levels of student motivation to the lack of physical facilities, poor textbooks and inappropriate teaching method. Some of the other reasons being: lack of harmony between parents and teachers, shortage of teachers, teachers’ unfavourable behaviour, and high difficulty level of curricula. (d) Learning Coordinator: Fifty per cent of LCs were not conversant with their fundamental duties and did not perform them. LCs complained of lack of physical facilities; habitual late coming of teachers; poor school administration; and non-cooperation between teachers and community.
Recomrnenda tions : Teachers recommend that they should be trained in teaching methodology and paid according to qualification. Besides, they recommend that the curriculum should be made easier and according to the level of students.
LCs recommend that teachers should be instructed to be polite and sympathetic with students. They recommend that curricula be made need-based and teaching method be activity based.
Remedial teaching material should be developed covering entire curricula. Teachers should be trained in the use and maintenance of Primary Teaching Kit as well as in the development of teaching aids.
69

Study No. 8
Author(s): Prof. Dr. Manzoorul Haque, M. Sharif Kalhoro, Ms. Shoukat Saeed Research Institution: Bureau of Curriculum and Extension Wing, Jamshoro, Government of Sindh.
I Title: Base-line Survey of Learning Achievement
Publication Date: May 2000 Sponsors, if any. UNESCO, Islamabad.
Purpose of study: . . .
To assess the actual learning achievements of grade 3,4 and 5 children in the selected rural Primary Schools. To identify the factors responsible for the low level of learning achievements among the pupils of rural primary schools. To evolve strateges/methodologies for the improvement of learning achievements among the children of rural primary schools and test their effectiveness on a pilot basis.
.
Methodology: (a) Instruments: Two types of instruments were developed; micro-tested and used:
Learning Achievement Tests, Diagnostic survey Instruments
The Learning Achievement Tests were developed for Grade 3, 4 and 5 separately in five subjects: (i) Language: Sindhi (ii) Mathematics, (iii) Science (iv) Social Studies and (v) Islamiyat. Weight to each subject was assigned in the light of scheme of studies for primary classes. (b) Sample: A randomized sample of 20 Primary Schools (10 Male and 10 Female) was selected from the coded list of schools of two sub-divisions of Dadu and Hyderabad districts .
Dadu 5 5 Hyderabad 5 5 Data with achievement tests and diagnostic survey instruments was collected from the following categories of subjects:
Male 150 30 10 7 5 30 10 10 Female 150 30 10 4 4 30 NOTE: Diagnostic survey instrument was also administered to students. Results: (a) Achievement Tests. The mean percent scores are given below: Class/Gender Sindhi Maths Science SStudies Islamiyat [I1 (Male) 40.3 19.8 14.4 19.2 23.4
[V (Male) 44.8 12.0 21.7 21.0 19.3 (Female) 46.4 05.6 14.5 12.5 30.6
V (Male) 44.0 14.5 13.1 22.5 18.7 (Female) 47.4 01.4 06.9 05.4 22.5
Male Schools Female Schools
Students Teachers HeadTeachers SPES Ed.Manager Parent Community Media
(Female) 40.7 20.1 19.7 18.6 34.4
70

I Results (continued): Students of all classes scored consistently high in Sindhi language as compared to other subjects. Thus, while students correctly answered between 40 and 47 percent questions correctly in Sindhi language, they answered correctly between one and 20 percent in Mathematics, between 7 and 22 percent in Science, between 5 and 23 percent in Social Studies, and between 29 and 34 percent in Islamiyat. Girls scored higher than boys in Sindhi language and Islamiyat. Boys scored higher than girls in all other subjects. Achievement level of girls kept decreasing from grade to grade in all subjects except Sjndhi language. Grade 5 boys tend to answer fewer questions correctly in Mathematics and Science than grade 3 and 4 students. On the whole, achievement levels in Mathematics and Science are cause for concern. (b) Head Teacher’s Questionnaire (1) According to head teachers 80 per cent teachers were matric with PTC. (2) Majority of head teachers was not satisfied with the standard of teaching. Teachers often attend the classes late. (3) Communication is lacking between parents and teachers. (4) Supervisors do not visit eighty per cent of schools even once or twice during a year. (5) Only 10 per cent schools had teaching material; only 20 per cent boys schools had library. (c) Teachers’ Questionnaire (1) About 60 per cent male and over 70 per cent female teachers felt the need for further training in lesson planning and teaching methodology. Almost all the teachers reportedly followed question-answer teaching method in their classes. (2) Over 70 per cent male and 58 per cent female teachers reported availability of teaching aids. (3) A higher proportion of female teachers reported weekly or monthly supervisory visit by AEO than male teachers (over 78 per cent against 64 per cent). Similarly, a significantly higher proportion of female teachers than male teachers reported weekly visit to school by LCs (over 65 per cent against 21 per cent). (4) Both male and female teachers perceived lack of physical facilities as the most important reason for poor learner performance. Quality of textbooks and poor school environment are the other two factors. One in three male teachers and one in six female teacher also considered inappropriate teaching method as a factor. (d) Learning Coordinators’ Questionnaire (1) LCs suggest that examinations should cover the whole syllabus. LCs think that objective type questions will improve the examination. (2) LCs identified lack of physical facilities, habitual late coming of teachers, and lack of effective administration in schools, as factors responsible for poor qualj ty of education in schools. Recommendations: LCs recommend that: Guide teachers about teaching methodology. Create teacher awareness about need for sympathy and politeness with students. Improve teacher-training programmes. Improve school physical facilities. Provide teaching learning material. Develop student need- oriented curriculum. Organize co-curricular activities.
71

Title: Learning Achievement of Grade 3 to 5 Children in Rural Primary Schools of District Mansehra. N.W.F.P.
Author(s): Research Team of Bureau of Curriculum Development and Extension Services, NWFP Research Institution: Bureau of Curriculum Development and Extension Services, Abbottabad, N.W.F.P.
Publication Date: December 1999 Sponsors, if any. UNESCO, Islamabad
72

Xesults (Continued): b) Questionnaires:
(i) HeaclTeachers: Expessdnedhxchdibraquanrling material. Physical facilities also needed improvement. A first-aid box is urgently needed. There was no problem of discipline in school according to head teachers. They considered supervision work by LC to be quite useful. Female head teachers reported that whole syllabus was not covered in their schools. They thought that the existing course of study was heavily overloaded for the learner.
(ii) Teachers: Teachers complained of heavy teaching load, lack of facilities, parental non-cooperation, and teacher incompetence. Appraisal of teaching-learning process in schools was going on satisfactorily. Male teachers emphasized role of homework. Female teachers value cumulative achievement for evaluating learner’s achievement.
(iii) Students: Students were satisfied with classroom teaching learning process, but complained about corporal punishment. Students could not complete homework because of domestic duties. They complained about lack of curricular and literary activities in school. The school has playground but no sports goods.
(iv) Parents: Parents were interested in education of their children. They checked homework as well as classwork. They were interested in participating in school activities. According to parents, teachers were poorly educated and could not improve quality.
(v) LearninE Coordinators: LCs supervised the school regularly and constructively. They were not satisfied with the behaviour of head teachers. Course of studies was over loaded and female teachers were unable to complete the syllabus. LCs thought that they had congenial relation with the community and the school.
1. A mechanism for remedial teaching should be evolved and introduced in schools. 2. A package of teacher training based on the principle of remedial teaching should be developed €or the orientation of teachers and LCs. 3. Supplementary reading material should be provided to schools. 4. rooms, drinking water, electric fans, first-aid box, furniture, mini library, material for co-curricular activities. 5. Community should be involved in institutional development. 6. Head teachers need to re-orientate their role in the teaching learning process.
tecommendations:
Arrangement should be made for meeting physical needs including wash- and
73

Author(s): Research Team of Bureau of Curriculum and Extension Centre, Quetta, Balochistan. Research Institution: Bureau of Curriculum and Extension Centre. Ouetta. Balochistan. Purpose of study: (I) To assess actual learning achievement of class 3 - 5 students in Pishin District. (2) To collect the opinion of Learning Coordinators about the physical facilities and teachinglearning process in rural primary schools of Balochistan. (3) To develop and administer tests in Urdu, Social Studies, Mathematics and Science to students of grades 3 to 5 in District Pishin, Balochistan. (4) To analyze and interpret the data in order to draw the findings and conclusions. Methodology: (a) Instruments:
(i) Learning achievement tests for grades 3 - 5 in Urdu, Social Studies, Mathematics, and Science. (ii) Questionnaires for obtaining opinion from teachers, head teachers, students, learning coordinators, and parentskommunity members about different aspect? of school education in their area.
(b) Sample: The sample was drawn from ten boys and ten girls schools from Pishin district as per details below:
Schools Students Teachers Head Teacher LCs Parents Male 10 447 30 20 2 40 Female 10 354 30 20 2 40
Publication Date: July 2000 Sponsors, if any. UNESCO, Islamabad
Results: (a) Achievement Tests. The mean % scores are given below: Class/Gender Mathematics Science S. Studies Urdu I11 (Male) 39 45 49 28
(Female) 21 34 39 34 IV (Male) 54 61 40 28
(Female) 37 47 34 29 V (Male) 40 43 32 28
(Female) 28 35 29 32 Rural boys obtained lowest mean percent scores in Urdu. Rural girls of grades 3 and 5 obtained lowest percent scores in Mathematics and of grade 4 in Urdu. Both rural boys and girls of grade 5 answered fewer questions correctly in almost every subject. Teaching in the terminal grade needs particular attention because of its importance in determining the quality of school output.
74
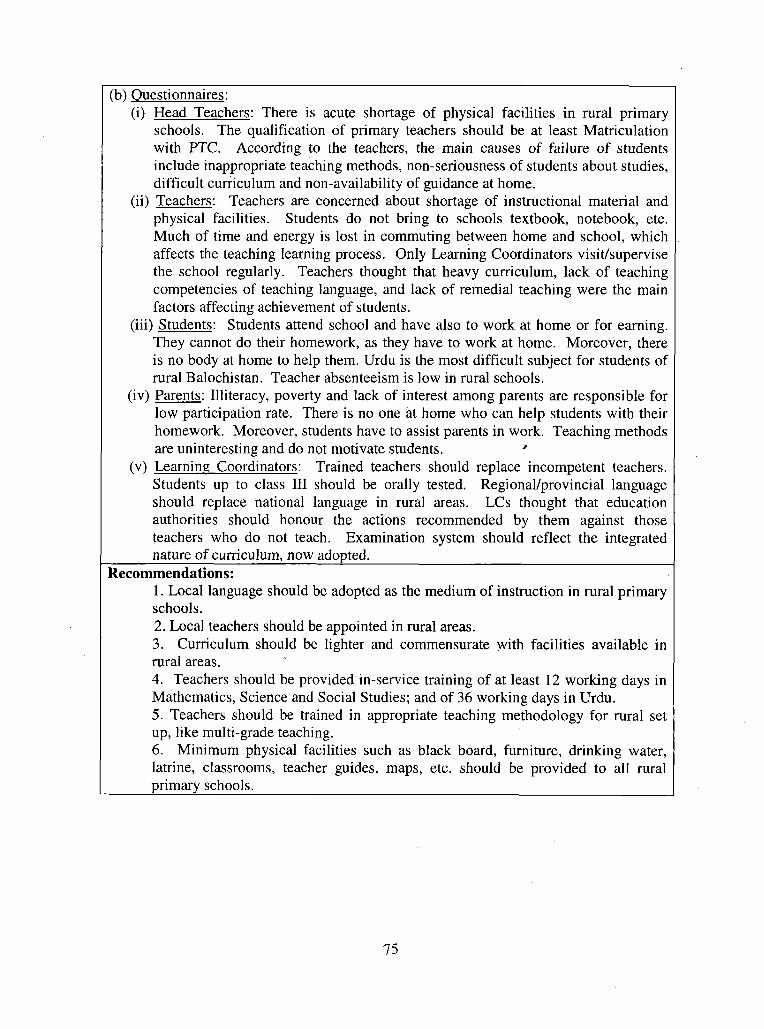
I (b) Questionnaires: (i) Head Teachers: There is acute shortage of physical facilities in rural primary
schools. The qualification of primary teachers should be at least Matriculation with PTC. According to the teachers, the main causes of failure of students include inappropriate teaching methods, non-seriousness of students about studies, difficult curriculum and non-availability of guidance at home.
(ii) Teachers: Teachers are concerned about shortage of instructional material and physical facilities. Students do not bring to schools textbook, notebook, etc. Much of time and energy is lost in commuting between home and school, which affects the teaching learning process. Only Learning Coordinators visithupervise the school regularly. Teachers thought that heavy curriculum, lack of teaching competencies of teaching language, and lack of remedial teaching were the main factors affecting achievement of students.
(iii) Students: Students attend school and have also to work at home or for earning. They cannot do their homework, as they have to work at home. Moreover, there is no body at home to help them. Urdu is the most difficult subject for students of rural Balochistan. Teacher absenteeism is low in rural schools.
(iv) Parents: Illiteracy, poverty and lack of interest among parents are responsible for low participation rate. There is no one at home who can help students with their homework. Moreover, students have to assist parents in work. Teaching methods are uninteresting and do not motivate students.
(v) Learning Coordinators: Trained teachers should replace incompetent teachers. Students up to class I11 should be orally tested. Regional/provincial language should replace national language in rural areas. LCs thought that education authorities should honour the actions recommended by them against those teachers who do not teach. Examination system should reflect the integrated nature of curriculum, now adouted.
J
Recommendations: 1. Local language should be adopted as the medium of instruction in rural primary schools. 2. Local teachers should be appointed in rural areas. 3. Curriculum should be lighter and commensurate with facilities available in rural areas. 4. Teachers should be provided in-service training of at least 12 working days in Mathematics, Science and Social Studies; and of 36 working days in Urdu. 5. Teachers should be trained in appropriate teaching methodology for rural set up, like multi-grade teaching. 6. Minimum physical facilities such as black board, furniture, drinking water, latrine, classrooms, teacher guides, maps, etc. should be provided to all rural urimarv schools.
75

Title: Levels of Pupil Achievement in Primary Schools of Punjab, Pakistan: A SamDle Studv
Author(s):
Research Institution: Punjab Literacy Watch
Publication Date:
Sponsors, if any. UNESCO, Islamabad
October 1999
Methodology: (a) Instruments: Tests in Mathematics and Urdu were constructed for grades 3, 4 and 5 consisting of multiple-choice, fill in blanks and short answer items. The tests covered the complete curriculum but areas not taught in all schools were excluded.
Muz’garh Sialkot
(b) Sample: 822 boys and 549 girls from 31 schools (16 boys, 14 girls and one mixed). All schools were in public sector except for the mixed school. DEOs from two districts in Northern Punjab (Attock and Chakwal), two in Central Punjab (Lahore and Sialkot), and two in Southern Punjab (Muzaffargarh and Layyah) were requested to select equal numbers of good, average and weak schools. A maximum of 15 students were tested in each school to avoid cheating. Results: Average percentage scores by gender, subjects and district.
30 37 21 13 32 21 13 31 25 28 - 27 40 265 27 29 12 6 10 10 14 12 14 6 11 14 13.7
TOTAL I28 128 I20 I17 I24 I16 I26 I26 I27 I34 I27 I29 I 25.1
76

Discussion of Results: Total average score is only 25.1 %. Performance in Urdu was better than in Mathematics. Boys performed better in Mathematjcs and girls in Urdu. The performance of grade 5 was poorer than that of other classes. There is great variation in district scores. The extremely high performance of Layyah schools was mainly due to the fact that teachers rather than students apparently filled out a number of answer sheets.
In Mathematics, students did better in direct sums, separating odd and even numbers, common factors and multiples, simple equations, but poorly in geometry, fractions, decimals and on items involving thinking and the application of knowledge.
In Urdu, children performed well in joining letters into words, making sentences, and comprehension, but were poor in grammar, letter writing, and arrangements in alphabetical order.
Conclusions: The results suggest that the educational system is failing in its primary mandate of teaching children basic skills. The primary reason is, of course, poor teaching. This is itself a consequence of poor education and training of the teacher, and poor management and supervision.
There is no on-going assessment of children in government primary schools. Whatever assessment takes place is sporadic, subjective, and provides little feedback to children for immovement.
Recommendations: To improve the achievement level of primary students in Punjab, a system of on-going assessment of students should be introduced.
Publicize consti tuency-wise results and reward DEOs showing improved level of student achi evemen t .
Assess teachers on the same tests as the children, and provide training in weak areas. Introduce a system of incentives and disincentives.
77

T T I
_I
OD b

REFERENCES
Abideen, Mohammad and Lucy Jone. Baseline Achievement of Class 4 Students in Northern Areas Pakistan. November 2000.
Anastasi, Anne. Psychological Testing. New York, Macmillan, 1982.
BALOCHISTAN. Bureau of Curriculum and Extension Centre. Learning Achievement of Grade 111 to V Children in Rural Primary Schools of District Pishin, Balochistan. December 1 999.
Blaine R. Worthen and James R. Sanders, Educational Evaluation -Alternative Approaches and Practical Guidelines. New York: Longman, 1 987.
Benoliel, Sharon, Chloe O’Gara and Shirley Miske, “Promoting Primary Education for Girls in Pakistan,” USAID’S Center for Development Information and Evaluation, May 1999.
Greaney, Vincent and Thomas Kellaghan, Monitoring the Learning Outcomes of Education Systems. Washington, D.C.: The World Bank, 1996.
Gronlund, Norman E. and Robert L. Linn. Measurement and Evaluation in Teaching. Sixth Edition. New York: Macmillan Publishing Company, 1990.
Inter-Agency Commission for World Conference on Education for All. World Declaration on Education for All and Framework for Action to meet Basic Learning Needs. New York: UNESCO House, April 1990.
International Consultative Forum on Education for All. The Year 2000 Assessment - Technical Guidelines. UNESCO 1 998.
kart, John. Assessing Learning Achievement. Paris: UNESCO, 1992.
Mirza, Munawar and Abdul Hameed, Differential Achievement of Primary Age Students and the Cost Effectiveness by School Type. Primary and Non- Formal Education Wing, Ministry of Education, Undated.
Multi-Donor Support Unit for the Social Action Programme: Determinants of Primary Students Achievement - National Survey Results. Islamabad, July 1995.
79

N.W .F.P. Education Department. Status of Expanded Supervision (An lllumina tive Research Study). 1983.
P r i mary Education P roj ect , Pes h awa r ,
N.W.F.P. Directorate of Primary Education. Multi-Class Study. Primary Education Development Project, Peshawar. September 1991 .
N.W.F.P. Directorate of Primary Education. Kachi-study. Primary Education Development Project, Peshawar. April - September 1991.
N.W.F.P. Bureau of Curriculum Development and Extension Services. Learning Achievement of Grade 111 to V Children in Rural Primary Schools. December 1999.
PAKISTAN. Ministry of Interior. Proceedings of the Pakistan Education Conference held at Karachi from 2fh November to lst December 1947. Islamabad: 1983.
PAKISTAN. Ministry of Education. National Education Policy 1998 -201 0. Islamabad: 1998.
PAKISTAN. Ministry of Education. Education for All - The Year 2000 Assessment, Country Report, January 2000.
PAKISTAN. Ministry of Education (Academy of Educational Planning and Management) . Pakistan School Education Statistics. November 1 999.
PAKISTAN. Ministry of Education (Academy of Educational Planning and Management). Measuring Learning Achievement at Primary Level in Pakistan. Islamabad, 1999.
PAKISTAN, Ministry of Education. Workshop on National Education Assessment System in Pakistan, February 18- 19, 2000, Islamabad. Islamabad 2000.
PAKISTAN, Federal Bureau of Statistics. Pakistan Statistical Year Book, Islamabad, April 2000.
Pervez, Muhammad. Basic Competencies of Children in Pakistan. UNICEF: Islamabad, March 1995.
PUNJAB. Department of Education and Multi-Donor Support Unit. Report of the National Workshop on Elementary Students’ Learning Achievement. 1 997.
PUNJAB. Curriculum Development and Research Centre. Learning Achievement of Grade 111 to V Children in Rural Primary Schools. October 1999.
80

Punjab Literacy Watch: Levels of Pupil Achievement in Primary Schools of Punjab: A Sample Study. UNESCO, October 1999.
Qadir, Syed Fazal, The Impact of Primary Education Project on Students’ Achievement, Supervision and Teaching Practices in the North West Frontier Province. Peshawar, 1990.
Rugh, Andrea B. and others. Teaching Practices to Increase Student Achievement: Evidence from Pakistan. Institute of International Development, Harvard University, 1991.
Shah, Mubarik Hussain, National Achievement Tests (Protocol Analysis). Primary and Non-Formal Educatjon Wing, Ministry of Education. Islamabad, 1984.
SINDH. Bureau of Curriculum Development and Extension Wing, Baseline Survey of Learning. May 2000.
The World Bank. “Theme 3: Basic Skills Assessment - A Pakistan Case Study,” ED1 Seminar on Perspectives on Education Quality: Lessons from Pakistan, Nepal and International Experience, February 7 - 10,1999, Bhurban (Pakistan).
UNESCO. Monitoring Learning Achievement (MLA) Project. UNESCO, May 1999.
Warwich, Donald P. and Fernando Reimers, Hope or Despair? Learning in Pakistan’s Primary Schools. Westport (Connecticut): Praeger, 1995.
World Education Forum. The Dakar Framework for Action. Dakar, Senegal, April 2000.
81