learning demonstration progress report--september 2007
TRANSCRIPT

A national laboratory of the U.S. Department of EnergyOffice of Energy Efficiency & Renewable Energy
National Renewable Energy Laboratory Innovation for Our Energy Future
Learning Demonstration Progress Report – September 2007 K. Wipke, S. Sprik, J. Kurtz, and H. Thomas
Technical Report NREL/TP-560-42264 November 2007
NREL is operated by Midwest Research Institute ● Battelle Contract No. DE-AC36-99-GO10337

National Renewable Energy Laboratory1617 Cole Boulevard, Golden, Colorado 80401-3393 303-275-3000 • www.nrel.gov
Operated for the U.S. Department of Energy Office of Energy Efficiency and Renewable Energy by Midwest Research Institute • Battelle
Contract No. DE-AC36-99-GO10337
Technical Report NREL/TP-560-42264 November 2007
Learning Demonstration Progress Report – September 2007 K. Wipke, S. Sprik, J. Kurtz, and H. Thomas
Prepared under Task No. H270.8100

NOTICE
This report was prepared as an account of work sponsored by an agency of the United States government. Neither the United States government nor any agency thereof, nor any of their employees, makes any warranty, express or implied, or assumes any legal liability or responsibility for the accuracy, completeness, or usefulness of any information, apparatus, product, or process disclosed, or represents that its use would not infringe privately owned rights. Reference herein to any specific commercial product, process, or service by trade name, trademark, manufacturer, or otherwise does not necessarily constitute or imply its endorsement, recommendation, or favoring by the United States government or any agency thereof. The views and opinions of authors expressed herein do not necessarily state or reflect those of the United States government or any agency thereof.
Available electronically at http://www.osti.gov/bridge
Available for a processing fee to U.S. Department of Energy and its contractors, in paper, from:
U.S. Department of Energy Office of Scientific and Technical Information P.O. Box 62 Oak Ridge, TN 37831-0062 phone: 865.576.8401 fax: 865.576.5728 email: mailto:[email protected]
Available for sale to the public, in paper, from: U.S. Department of Commerce National Technical Information Service 5285 Port Royal Road Springfield, VA 22161 phone: 800.553.6847 fax: 703.605.6900 email: [email protected] online ordering: http://www.ntis.gov/ordering.htm
Printed on paper containing at least 50% wastepaper, including 20% postconsumer waste

TABLE OF CONTENTS 1 Learning Demonstration Progress Report – September 2007 ......................................1
1.1 Introduction .....................................................................................................................1 1.2 Approach .........................................................................................................................2 1.3 Key Analysis Accomplishments in FY 2007 ..................................................................3
2 Results.................................................................................................................................4 2.1 Vehicle Results................................................................................................................5 2.2 Infrastructure Results ......................................................................................................9 2.3 Conclusions and Future Directions ...............................................................................12 2.4 Related Publications/Presentations from FY07.............................................................13 2.5 Acronyms ......................................................................................................................14 2.6 Composite Data Products Referenced in Previous Discussion .....................................15
LIST OF FIGURES Figure 1: Photographs of the Four Teams' First-Generation Vehicles with Small Inset Photos
Showing the Second-Generation Vehicles ....................................................................1 Figure 2: Four Types of Hydrogen Production and Refueling Facilities with Examples.............2 Figure 3: Process Flow for Hydrogen Secure Data Center Analysis and Results, Overlaid on
Top of Quantity of Data Received at HSDC.................................................................3 Figure 4: Fuel Cell System Efficiency at ~25% Net Power .......................................................15 Figure 5: Fuel Cell Operating Powers ........................................................................................15 Figure 6: Learning Demonstration Fuel Cell Vehicle Fuel Economy ........................................16 Figure 7: Learning Demonstration Fuel Cell Vehicle Range .....................................................16 Figure 8: Percentage of Theoretical Range Traveled Between Refuelings ................................17 Figure 9: Effective Vehicle Range..............................................................................................17 Figure 10: Fuel Stack Hours Accumulated and Projected Hours to 10% Voltage Degradation ..18 Figure 11: Primary Factors Affecting Learning Demo Fleet Fuel Cell Degradation ...................18 Figure 12: Primary Factors Affecting Learning Demo Team Fuel Cell Degradation ..................19 Figure 13: Driving Start Time – Day............................................................................................19 Figure 14: Driving Start Time – Night .........................................................................................20 Figure 15: Driving by Day of Week .............................................................................................20 Figure 16: Trip Length..................................................................................................................21 Figure 17: Safety Reports – Vehicles ...........................................................................................21 Figure 18: Range of Ambient Temperature during Vehicle Operation ........................................22 Figure 19: Vehicle Operating Hours.............................................................................................22 Figure 20: Number Vehicles vs. Miles Traveled ..........................................................................23 Figure 21: Cumulative Vehicle Miles Traveled............................................................................23 Figure 22: Vehicle Hydrogen Storage Technologies....................................................................24 Figure 23: Hydrogen Quality Index Scatter Plot ..........................................................................24 Figure 24: Hydrogen Impurities Scatter Plot ................................................................................25 Figure 25: Infrastructure Maintenance..........................................................................................25 Figure 26: Infrastructure Safety Reports by Severity and Report Type .......................................26 Figure 27: Primary Factors of Infrastructure Safety Reports........................................................26 Figure 28: Average Refuelings between Infrastructure Safety Reports .......................................27
iii

Figure 29: Type of Infrastructure Safety Report by Quarter ........................................................27 Figure 30: Refueling Times ..........................................................................................................28 Figure 31: Refueling Amounts......................................................................................................28 Figure 32: Refueling Rates ...........................................................................................................29 Figure 33: Compressed and Liquid Hydrogen Tank Cycle Life...................................................29 Figure 34: Compressed and Liquid Hydrogen Tank Weight-Percent ..........................................30 Figure 35: Compressed and Liquid Hydrogen Tank Volumetric Capacity ..................................30 Figure 36: Fueling Rates – Communication and Non-Communication Fills ...............................31 Figure 37: H2 Tank Level at Refueling.........................................................................................31 Figure 38: Refueling Tank Levels – Medains...............................................................................32 Figure 39: Refueling by Time of Day...........................................................................................32 Figure 40: Refueling by Time of Night ........................................................................................33 Figure 41: Refueling by Day of Week..........................................................................................33 Figure 42: Cumulative Hydrogen Produced or Dispensed ...........................................................34 Figure 43: Number and Types of Hydrogen Stations Being Demonstrated .................................34 Figure 44: Number of Stations Online by Quarter........................................................................35
iv

1 Learning Demonstration Progress Report – September 2007
1.1 Introduction This purpose of this report is to document and discuss key results to date from the U.S. Department of Energy’s (DOE) Controlled Hydrogen Fleet and Infrastructure Validation and Demonstration Project, also referred to as the fuel cell vehicle (FCV) and infrastructure learning demonstration. This report serves as one of many mechanisms to help transfer knowledge and lessons learned within various parts of DOE’s hydrogen program, as well as externally to other stakeholders. Other mechanisms have included: briefings to FreedomCAR and Fuels technical teams, presentations at technical conferences, postings of individual results to the National Renewable Energy Laboratory’s (NREL) Web site, presentations at DOE’s Annual Merit Review, and participation in groups such as the California Hydrogen Business Council, US Fuel Cell Council Joint Hydrogen Quality Task Force, and various California Fuel Cell Partnership working groups.
Figure 1: Photographs of the Four Teams' First-Generation Vehicles with Small Inset Photos
Showing the Second-Generation Vehicles
The primary goal of this project is to validate vehicle/infrastructure systems using hydrogen as a transportation fuel for light-duty vehicles. This means validating the use of FCVs and hydrogen refueling infrastructure under real-world conditions using multiple sites, varying climates, and a variety of sources for hydrogen. See Figure 1 for photographs of the first-generation vehicles
1

and logos of the four teams and Figure 2 for photographs representing examples of the four types of hydrogen refueling stations.
Figure 2: Four Types of Hydrogen Production and Refueling Facilities with Examples
By 2009 we will validate hydrogen vehicles with greater than 250-mile range, 2,000-hour fuel cell durability, and $3/gge hydrogen production cost (based on volume production). We are identifying the current status of the technology and tracking its evolution over the five-year project duration, particularly between the first- and second-generation FCVs. NREL’s role in this project is to provide maximum value for DOE and industry from the data produced by this “learning demonstration.” We seek to gain knowledge about the progress toward the technical targets, and provide that data to the Hydrogen Fuel Cells and Infrastructure Technologies (HFCIT) research and development (R&D) activities. This information will allow the program to move more quickly toward cost-effective, reliable hydrogen FCVs and supporting refueling infrastructure.
1.2 Approach NREL’s approach to accomplishing the project’s objectives is structured around a highly collaborative relationship with each of the four industry teams: Chevron/Hyundai-Kia, DaimlerChrysler/BP, Ford/BP, and GM/Shell. We are receiving raw technical data from both the hydrogen vehicles and refueling infrastructure that allows us to perform unique and valuable analyses across all four teams. Our primary objectives are to feed the current technical challenges and opportunities back into the DOE Hydrogen R&D Program and assess the current status and progress toward targets. To protect the commercial value of these data for each company, we established the Hydrogen Secure Data Center (HSDC) to house the data and perform our analysis (Figure 3 shows the flow of data and results, overlaid on top of the quantity of data received at the HSDC). To ensure value is fed back to the hydrogen community, we publish composite data products twice a year at technical conferences. These data products report on the progress of the technology and the project, focusing on the most significant results. Additional composite data products are conceived as additional trends and results of interest are
Hydrogen and Gasoline StationWashington, DC
Mobile Refueler Sacramento, CA
Steam Methane ReformingOakland, CA
DTE/BP Power Park Southfield, MI
Delivered Compressed
H2
Natural Gas On-Site
Reforming
Delivered Liquid H2
Electrolysis
2

identified. We also provide our detailed analytical results (not public) on each individual company’s data back to them to maximize the industry benefit from NREL’s analysis work and obtain feedback on our methodologies.
On-Road Data Received -- Running Totals
40095
149019
0
5000
10000
15000
20000
25000
30000
35000
40000
45000
Sep-04
Dec-04
Mar-05
Jun-0
5
Sep-05
Dec-05
Mar-06
Jun-0
6
Sep-06
Dec-06
Mar-07
Jun-0
7
Sep-07
MB
of D
ata
0
20000
40000
60000
80000
100000
120000
140000
160000
180000
# Tr
ips
Figure 3: Process Flow for Hydrogen Secure Data Center Analysis and Results, Overlaid on Top of
Quantity of Data Received at HSDC
1.3 Key Analysis Accomplishments in FY 2007
• Created and published 41 new or updated composite data products (the fourth such set of public results) representing results from analyzing almost two years of Learning Demonstration data. The results will be presented publicly at the Fuel Cell Seminar, ZERO REGIO, and EVS-23.
• Created a new NREL Web page at http://www.nrel.gov/hydrogen/cdp_topic.html to allow direct public access to the latest composite data products organized by topic, date, and CDP number. This also allowed the results to be indexed directly by search engines.
• Made major improvements to NREL’s Fleet Analysis Toolkit (FAT) for automatically processing and analyzing every vehicle trip file and presenting the results graphically in an interactive manner.
MB of data# trips
Composite Data
Products
Through August 2007: >149,000 individual
vehicle trips 40 GB of on-road data
NRELHSDC
Detailed Data
Products
3

• Received and processed a total of 149,000 individual vehicle trips, amounting to over 40 GB of data, since project inception.
• Created a new MATLAB analysis program to analyze dominant factors affecting fuel cell degradation, including a new graphical user interface for viewing the results in an interactive way.
• Further developed the collaborative technical relationship with all four industry teams by giving presentations to each team, including detailed results from NREL’s analysis of their vehicle and infrastructure data.
2 Results
The results discussed here came from analyzing over two years of vehicle and infrastructure data (through June, 2007), resulting in a total of 41 new or updated composite data products to be presented at technical conferences. To accomplish this, our in-house analysis tool, FAT, continued to undergo improvements and revisions. Since there are now so many technical results from the project, they cannot normally all be discussed during brief 15-20 minute conference presentations. Therefore, in January 2007 NREL launched a new Web page at http://www.nrel.gov/hydrogen/cdp_topic.html to provide the public with direct access to the results. This web site will make current and archived composite data products available to the public. The most recent results are scheduled to be presented publicly at the Fuel Cell Seminar (10/07), ZERO REGIO International Demonstration Workshop (11/07), and the EVS-23 conference in California (12/07) as the set of data called “Fall 2007 Results”. In order to focus on high-level results and conclusions, this report will discuss the results in bullet form, organized by technical topic. The last section includes all of the composite data products referenced.
4

2.1 Vehicle Results • Fuel Cell Efficiency: Researchers measured fuel cell system efficiency from select
vehicles on a vehicle chassis dynamometer at several steady-state points of operation. DOE’s technical target for net system efficiency at ¼-power is 60%. Data from the four Learning Demonstration teams showed a range of net system efficiency from 52.5% to 58.1% (Figure 4), which is very close to the target. These results have not changed in the last year, but we will use baseline testing to evaluate the efficiency of the second-generation systems as soon as they are introduced in the next year.
• Fuel Cell Operating Points: Recent work included an analysis of the amount of time each fleet spent operating their fuel cells within various ranges of power levels. Because we found that fuel cells were operated for such a large percentage of time within the 0% to 5% maximum power range, we chose to use unequal bins in order to present the results. This prevents the values at the higher powers from being washed out by an otherwise large scale. Figure 5 shows these results, with the 20%-40% bin including the ¼ power point previously discussed as having a high efficiency. What this graph shows is that the ¼ power point is important relative to power points higher than 40%, but also that the region at <20% power is also extremely important in establishing an overall high efficiency for an automotive system on-road. It also suggests that implementing idle-off for the fuel cell system could substantially reduce energy consumption, as it has done with most of today’s gasoline-electric hybrids.
• Vehicle Fuel Economy: Vehicle fuel economy was measured from city and highway drive-cycle tests (Figure 6) on a chassis dynamometer using draft SAE J2572 (left blue bar, representing the range of four points, one from each original equipment manufacturer [OEM]). These raw test results were then adjusted according to U.S. Environmental Protection Agency (EPA) methods to create the “window-sticker” fuel economy that consumers see when purchasing the vehicles (0.78 x Hwy, 0.9 x City) (center blue bar). This resulted in an adjusted fuel-economy range of 42 to 56.5 miles/kg hydrogen for the four teams. As with all vehicles sold today, including gasoline hybrids, actual on-road fuel economy is slightly lower than this rated fuel economy (right blue bar). The on-road fuel economy has improved slightly over the last six months as the usage pattern has evolved; it now spans the range of 30 miles/kg H2 to almost 50 miles/kg H2. Note that EPA has adjusted its testing and reporting methodology beginning with model-year 2008 vehicles to try to make the window-sticker fuel economy better reflect on-road driving performance.
• Vehicle Driving Range: Vehicle range was calculated using the fuel economy results discussed above and multiplying them by the usable hydrogen stored onboard each vehicle (Figure 7). Using the EPA-adjusted fuel economy resulted in a range from just over 100 miles up to 190 miles from the four teams. The second-generation vehicles will strive to push this range up to 250 miles to reach the 2009 DOE target. Note that two other composite data products relating to range were also generated. Figure 8 shows a histogram of the distance vehicles actually traveled between refuelings as a percentage of each vehicle’s dyno range. This shows that the majority of the vehicles (80%) travel less than 50% of the dyno range between refuelings. This is due to several factors, but the dominant ones are limited H2 infrastructure, fear of running out of fuel, and actual on-road fuel economy being lower than the dynamometer fuel economy, as has already been
5

discussed. Figure 9 shows the on-road range of the four teams (green bar) as a percentage of their dyno range. The spread of this on-road range has decreased significantly in the last six months. There is the potential for a greater range from the second-generation vehicles due to higher H2 storage pressure (700 bar) and more vehicles that may be designed with storage system limitations in mind. Progress on H2 storage will be reported after second-generation vehicles are introduced.
• Fuel Cell Durability: Fuel cell stacks will need roughly a 5,000 hour life to enter the market for light-duty vehicles. For this demonstration project, targets were set by DOE at 1,000 hours in 2006 and 2,000 hours in 2009. Results were first published one year ago in the fall of 2006. These results were relatively preliminary because most stacks at that time only had a few hundred hours of operation or less accumulated on-road. Since DOE’s target for 2006 was 1,000 hours, NREL developed a methodology for projecting the gradual degradation of the voltage based on the data received to date. This involved creating periodic fuel cell polarization curve fits from the on-road stack voltage and current data, and calculating the voltage under high current. This enabled us to track the gradual degradation of the stacks with time. We then compared these results to the first-generation target of 1,000 hours for 2006. In the past year, many more hours have been accumulated on the fuel cell stacks, and the range of fleet averages is ~200-600 hours, with the range of fleet maximums spanning ~300-900 hours. Therefore, the amount of extrapolation we have to make, using the slope of the voltage degradation method (mV/hour times the 10% voltage drop target), continues to decrease. The projected times to 10% fuel cell stack voltage degradation from the four teams had an average of more than 800 hours with a high projection of more than 1,600 hours from one team, straddling the 1,000-hour DOE target (Figure 10). We anticipate that in the next few months one of the teams will be first in the world to reach 1,000 hours of fuel cell system operation (without stack repair) in real-world operation on a light-duty passenger vehicle. Note that the 10% criterion, which is used for assessing progress toward DOE targets, may differ from the OEM’s end-of-life criterion and does not address “catastrophic” failure modes such as membrane failure. The second-generation stacks introduced in this project beginning in late 2007 will be compared to the 2,000-hour target for 2009.
• Factors Affecting Fuel Cell Durability: We have initiated a multivariate analysis to determine the dominant factors that are affecting the rates of degradation. We started out by creating a database of all of the Learning Demo stacks and various performance attributes. Each individual stack was examined for the hours of data accumulated to date, amount of time in non-DOE vehicles before data was received, and the confidence in the fit of the degradation slope. We then manually removed about one-third of the stacks from the degradation factors analysis to try to have as clean a data set as possible for the analysis. The database included the following key factors:
o Average degradation rate (key dependent variable) o Region of operation (% of time in each) o Temperature (% of time in three bins of cold, moderate, and hot) o Specific refueling stations used o Average number of stack starts/hour o Time between trips (to get at cold start impact) o Trip length
6

o Power levels (% of time in several power bins) o Idle time.
After trying many techniques, we focused on partial least squares regression (PLS) analysis because it was the most direct way of measuring how much of the variance in voltage degradation could be explained by specific groups of factors. We first performed the PLS on the stack data from all four teams to see if there were any overall trends that covered all of the technology involved (Figure 11). The trends were not strong, with only about 39% of the variance able to be explained by the first two groupings of variables. The (+) indicates the variable’s directional relation to high decay rate and a (-) indicates an inverse relation. Next we looked at each team’s data individually and performed the same PLS analysis (Figure 12). The connection between voltage degradation rate and the variables improved significantly, and was able to explain between 61% and 76% of the variance in voltage degradation. It is interesting to note that some teams’ degradation was influenced by two to three key variables, while others had a more complex influence from four to five variables. This analysis effort is not complete, and NREL will work closely with each team to carefully examine the inputs and outputs from this analysis and see if there are valuable lessons that can be fed back into the companies’ research as well as into DOE’s R&D program.
• Time of Day Vehicles Are Driven: Many questions have arisen about whether the Learning Demonstration vehicles are really being used like conventional vehicles, or whether their usage being too “controlled” to match typical driving behavior. To investigate this we looked the time of day people initiated their trips and which day of the week the trips were occurring on. Figure 13 shows a clock-face radial histogram, with the green data representing the time of day when people initiated their trips. Overlaid on top of that we have placed red diamonds to show the national statistics based on the 2001 NHTS Data. What we find is that the Learning Demonstration vehicles are driven at similar times of day to the national statistics, with the exception of the late afternoon between 4 to 6 p.m. when the average person (nationally) is likely either picking up kids from school, driving home from work, or running errands. Since the first-generation Learning Demonstration vehicles are primarily used for professional or fleet activities, it is not surprising that there would be a difference. However, overall the percentage of trips taken between 6 a.m. and 6 p.m. matches extremely closely to the national statistics (80.0% vs. 80.1%). Nighttime driving behavior also matches closely with the national statistics (Figure 14).
• Day of Week Vehicles Are Driven: We examined the days of the week that people drove the Learning Demo FCVs and compared this with the national statistics. Figure 15 shows a bar for each day of the week, beginning with Sunday, and overlays a diamond symbol for the national statistics. We can easily see that nationally the trips are relatively uniform throughout the week (including weekends) but that the Learning Demonstration vehicles are rarely driven on the weekends. Additionally, Learning Demonstration vehicles have significantly more trips Tuesday through Thursday as compared to Monday and Friday, which does not reflect typical national behavior. While the day of the week doesn’t matter to the car’s performance, it might be an indication that some of the weekend types of trips (for example: long trips to mountains or lots of short trips to the hardware store) are not captured in these vehicles’ duty cycles.
7

• Length of Trips: We also examined the length of Learning Demonstration driving trips and compared that to the national statistics. Figure 16 shows that the Learning Demonstration fleet (green curve) has a sharp peak with almost ½ the trips being shorter than two miles. If a large number of starts/hour is one of the major degradation factors, as has been reported at the laboratory scale, then this large number of short driving trips could be prematurely shortening the life of the Learning Demonstration fuel cells. Further investigation is necessary before that linkage can be made based on our analysis of the real-world data. We will also focus additional time on making sure that there are not a large number of bad data files (with essentially no data in them) that could be unduly influencing these trip distance results.
• Vehicle Safety: The Learning Demonstration has had a very strong safety record to date. In accordance with DOE’s safety definitions, there have been no safety incidents or near misses involving the vehicles; they have all been non-events. There was previously an issue with properly setting thresholds for triggering onboard alarms from hydrogen sensors; this has been resolved by the company involved, and Figure 17 shows the updated number of vehicle safety reports by quarter.
• Other Vehicle Metrics: There have been several other vehicle-related composite data products that will be briefly mentioned here. Figure 18 shows the range of ambient temperature during vehicle operation spanning from 1°F-123°F, slightly lower on the cold end of the spectrum than previously reported. So fuel cell vehicles are currently able to operate in extreme temperature conditions, but second-generation vehicle tests will determine their ability to also start from sub-freezing temperatures. Figure 19 shows the distribution of vehicle operating hours, showing a median of about 400-500 hours. Similarly, with vehicle miles traveled (shown in Figure 20), the peak number of vehicles occurs at 7,500 – 10,000 miles. The total number of vehicle miles traveled through June 2007 is 821,518, and Figure 21 shows that after the first few quarters, mileage accumulation has been relatively linear. Figure 22 tracks the total number of Learning Demonstration vehicles deployed by quarter and the on-board hydrogen storage systems that they use.
8
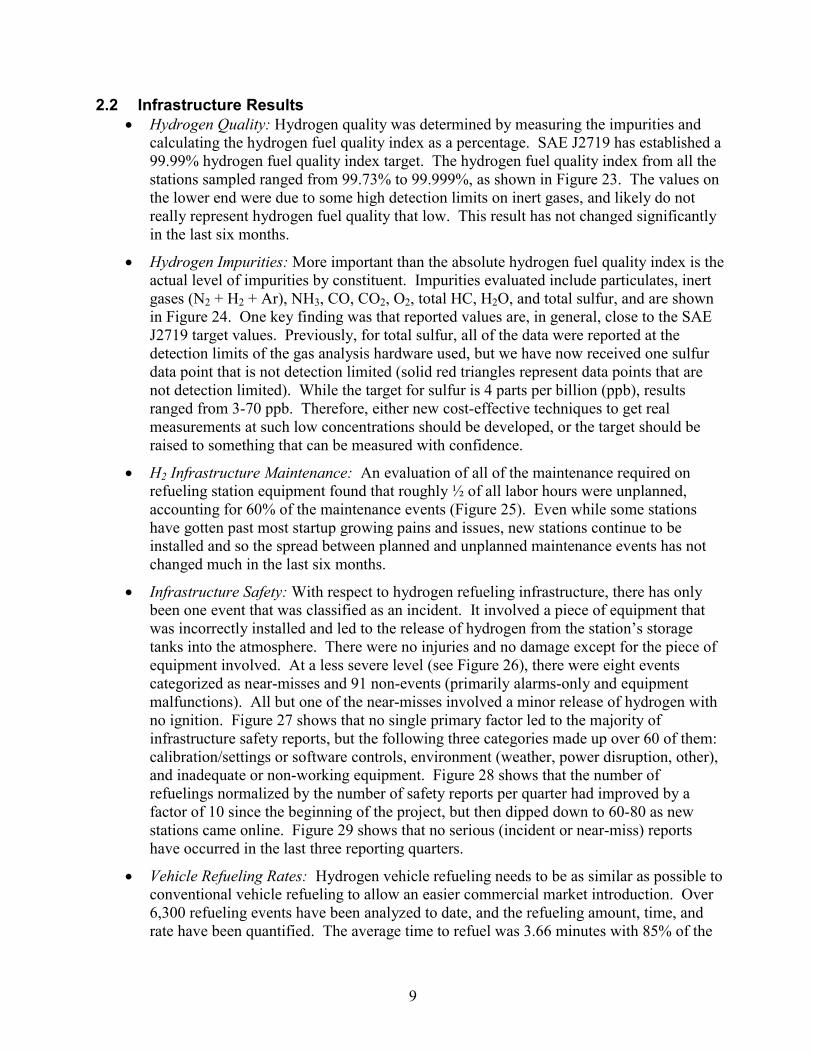
2.2 Infrastructure Results • Hydrogen Quality: Hydrogen quality was determined by measuring the impurities and
calculating the hydrogen fuel quality index as a percentage. SAE J2719 has established a 99.99% hydrogen fuel quality index target. The hydrogen fuel quality index from all the stations sampled ranged from 99.73% to 99.999%, as shown in Figure 23. The values on the lower end were due to some high detection limits on inert gases, and likely do not really represent hydrogen fuel quality that low. This result has not changed significantly in the last six months.
• Hydrogen Impurities: More important than the absolute hydrogen fuel quality index is the actual level of impurities by constituent. Impurities evaluated include particulates, inert gases (N2 + H2 + Ar), NH3, CO, CO2, O2, total HC, H2O, and total sulfur, and are shown in Figure 24. One key finding was that reported values are, in general, close to the SAE J2719 target values. Previously, for total sulfur, all of the data were reported at the detection limits of the gas analysis hardware used, but we have now received one sulfur data point that is not detection limited (solid red triangles represent data points that are not detection limited). While the target for sulfur is 4 parts per billion (ppb), results ranged from 3-70 ppb. Therefore, either new cost-effective techniques to get real measurements at such low concentrations should be developed, or the target should be raised to something that can be measured with confidence.
• H2 Infrastructure Maintenance: An evaluation of all of the maintenance required on refueling station equipment found that roughly ½ of all labor hours were unplanned, accounting for 60% of the maintenance events (Figure 25). Even while some stations have gotten past most startup growing pains and issues, new stations continue to be installed and so the spread between planned and unplanned maintenance events has not changed much in the last six months.
• Infrastructure Safety: With respect to hydrogen refueling infrastructure, there has only been one event that was classified as an incident. It involved a piece of equipment that was incorrectly installed and led to the release of hydrogen from the station’s storage tanks into the atmosphere. There were no injuries and no damage except for the piece of equipment involved. At a less severe level (see Figure 26), there were eight events categorized as near-misses and 91 non-events (primarily alarms-only and equipment malfunctions). All but one of the near-misses involved a minor release of hydrogen with no ignition. Figure 27 shows that no single primary factor led to the majority of infrastructure safety reports, but the following three categories made up over 60 of them: calibration/settings or software controls, environment (weather, power disruption, other), and inadequate or non-working equipment. Figure 28 shows that the number of refuelings normalized by the number of safety reports per quarter had improved by a factor of 10 since the beginning of the project, but then dipped down to 60-80 as new stations came online. Figure 29 shows that no serious (incident or near-miss) reports have occurred in the last three reporting quarters.
• Vehicle Refueling Rates: Hydrogen vehicle refueling needs to be as similar as possible to conventional vehicle refueling to allow an easier commercial market introduction. Over 6,300 refueling events have been analyzed to date, and the refueling amount, time, and rate have been quantified. The average time to refuel was 3.66 minutes with 85% of the
9

refueling events taking less than 5 minutes (Figure 30). The average amount per fill was 2.21 kg, reflecting both the limited storage capacity of these vehicles (~4 kg max) and peoples’ comfort level with letting the fuel gauge get close to empty (see Figure 31 for the shape of the distributions). This will be shown in a separate analysis. DOE’s target refueling rate is 1 kg/minute, and these Learning Demo results indicate an average of 0.76 kg/min, with 23% of the refueling events exceeding 1 kg/minute (Figure 32). Therefore, we can conclude that high-pressure gases are approaching adequate refueling times and rates for consumers; however, the challenge is still in packaging enough high-pressure hydrogen onboard to provide adequate range, or finding alternate advanced hydrogen storage materials that can replace the need for high-pressure tanks. See Figure 33, Figure 34, and Figure 35 for the status of first-generation storage tanks validated, which have not changed since the project was started.
• Communication vs. Non-Communication Fills: The previous refueling histograms included all types of refueling events. There has been much interest from industry and from the codes and standards community about the potential for communication fills to occur at a higher rate and with a more complete fill. Figure 36 shows two curves: the red curve is a spline fit to the normalized histogram for non-communication fills while the blue curve represents the communication fills. There is a group of vehicle/station combinations still doing non-communication fills at the slower rate of ~0.2 kg/min. This rate of fill was established many years ago in California to provide a conservative and safe approach for refueling vehicles before much real-world experience had been gained. There is also a second peak representing vehicles performing non-communication fills at higher than 1 kg/min, at around 1.2 kg/min (higher than DOE’s 2006 target). NREL will seek to understand what protocols some of the non-communication fills are following that allow them to reach such a high fill rate. Looking at communication fills (blue curve) we see that while the peak is at around 0.7 kg/min, a large percentage of the communication fills are higher than 1 kg/min (more than for non-communication fills). In particular, there is a fairly flat and significant number of communication fills at between 1.2 and 1.7 kg/min. So in summary, while communication fills definitely appear to be able to refuel at a higher rate than non-communication, the bulk of data gathered to date actually show the peak for communication fills being lower than the peak for non-communication fills. This will be followed closely as more data are gathered.
• Level in Fuel Tank at Which People Refuel: As previously mentioned, with limited hydrogen refueling infrastructure and limited on-board hydrogen storage, some drivers do not like to let the tank get close to empty for fear of running out of fuel. To investigate this further, NREL used the data submitted in a new and unique way, which was to look at what the fuel level in the tank was just prior to each refueling event. In some cases these data came from on-board data based on the pressure in the tank, and in other cases they came from refueling logs where each fill was assumed to be to the “full” level, allowing a subtraction of the amount fueled to determine the initial tank level. Figure 37 shows the results from this analysis, where a histogram has been placed radially on an image of a fuel gauge to make interpreting the graph as intuitive as possible. The level at which people most commonly refuel the Learning Demonstration vehicles is at just over ¼ full, and covers 14% of the refuelings. While some drivers are letting the tank get even lower than that, few let it get close to being empty. Additionally, we have placed a green needle on the chart which indicates the median tank level at fill (½ above, ½ below),
10

which is a little above ⅜ of a tank (40% of full). Figure 38 shows the collection of medians for each of the 77 vehicles in the Learning Demonstration fleet to show that there is a large spread in when individuals choose to refuel their vehicles, with several vehicles refueling more than half of the time with greater than a half-full tank. In the future, we would like to compare these data results to data from conventional liquid fueled vehicles, if they exist, to see if people are refueling their fuel cell vehicles differently than their conventional vehicles.
• Time of Day When People Refuel: We also looked at the time of day people refueled, in order to understand the usage patterns at the hydrogen refueling stations and better allow new stations to understand the potential demand by time of day. For traditional liquid fuels, with big tanker truck deliveries periodically, the time of day people refuel does not really matter. Instead, the station operator must simply ensure that the next tanker comes before he runs out. For today’s hydrogen fuels, with very limited storage capacity and some sites producing hydrogen throughout the day, it is important to know the time of day that people refuel in order to match the supply (on-site production) with the demand. Figure 39 shows a radial histogram of the time of day Learning Demo vehicles were refueled between 6 a.m. and 6 p.m., with Figure 40 showing the remainder of the time between 6 p.m. and 6 a.m. We found that 86% of the fills occurred between 6 a.m. and 6 p.m., with 14% being done at night. The distribution is relatively uniform with steady usage between 8 a.m. and 4 p.m., and a mild peak at lunchtime with 9% occurring then. The conclusion from this analysis is that with a uniform distribution of when people refuel during the day, a station that has on-site production can either be sized to meet that demand during the day and then essentially shut off at night, or it can be sized (smaller) for the average over a 24-hour period, have a larger on-site hydrogen storage buffer, and run continuously. Finally, we looked at what day of the week people were refueling (Figure 41) and found that the Learning Demonstration vehicles are primarily refueled Monday through Friday, with very few vehicles refueled on the weekend. This is consistent with the days of the week that people are driving the vehicles most.
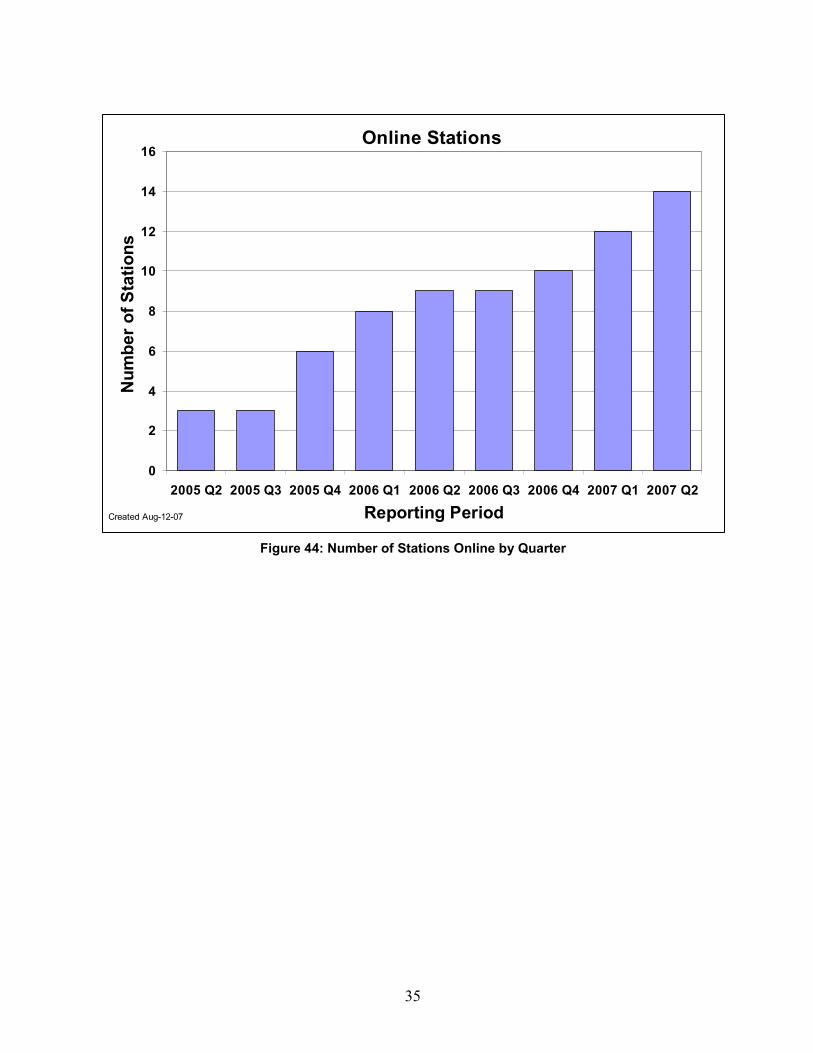
• Other Infrastructure Metrics: The amount of hydrogen produced or dispensed has also been tracked by quarter (blue diamonds) with the number of stations shown on the same graph (green squares) in Figure 42. Note that the amount of hydrogen produced is not the same as the amount dispensed because the project includes a power park at which the unused hydrogen can be converted back into grid electricity during peak utility load periods in the afternoon (due to higher air-conditioning loads) using on-site fuel cells. As discussed in Figure 2, there are four major types of hydrogen refueling stations being demonstrated (shown in Figure 43) and the rate of introduction of these stations is shown in Figure 44.
11

2.3 Conclusions and Future Directions NREL has now analyzed data from over two years of the 5-year project with 77 vehicles now in fleet operation, 14 project refueling stations in use, and no major safety problems encountered. We’ve analyzed data from 149,000 individual vehicle trips covering 821,000 miles traveled and 30,000 kg H2 produced or dispensed. Last fall we supported a September 2006 DOE MYPP milestone to evaluate on-road fuel cell durability by analyzing voltage degradation and comparing the results to the 1,000-hour target. Those results have now been updated with another year of on-road data, and include an individual team-average high of over 1,600 hours with the 4-team average over 800 hours. To answer the question of what is causing the stacks to gradually degrade, NREL initiated work to characterize how each stack is used and then performed multivariate analysis on this dataset to examine dominant variables affecting stack voltage degradation rate. Early results indicate that trends across all four teams may be hard to track, but that individual results for each team should be useful to the teams individually and for feeding back trends into the R&D program. We’ve analyzed fuel cell system efficiency at ¼-power and compared it to the DOE target of 60%; system efficiency results from the four teams ranged between 52.5% and 58.1%. Using new data on communication vs. non-communication fills, we found that while communication fills demonstrated a higher rate of fill than non-communication, the bulk of the communication fills were actually slower than the non-communications fills. We also examined refueling and driving behavior, and found the Learning Demonstration fleet to be representative of national statistics with the exception of fewer late afternoon and weekend trips, and an abundance of short trips. Finally, we’ve now published a total of 41 composite data products to date and made them directly accessible to the public from our H2 Technology Validation Web site.
In the future, we will further explore the correlations of real-world factors influencing fuel cell degradation and strive to separate their interwoven dependencies. We will semi-annually (spring/fall) compare technical progress to program objectives and targets and provide results to the public through participation at technical conferences and writing reports such as this one. Specifically, we will create new and updated composite data products based on data through December 2007, and prepare those new results for publication at the NHA as the “Spring 2008” results. For the second-generation vehicles initially introduced this fall and next year, we will begin evaluating improvements in fuel cell durability, range, fuel economy, and safety, and publish results when there are sufficient second-generation vehicles to mask the companies’ identities. As an important part of the project, we will identify opportunities to feed project findings back into HFCIT Program R&D activities to maintain the project as a “learning demonstration.”
12

2.4 Related Publications/Presentations from FY07 1. Wipke, K., Sprik, S., Kurtz, J., Thomas, H., “Composite Data Products for the Controlled
Hydrogen Fleet and Infrastructure Demonstration and Validation Project,” Golden, CO: National Renewable Energy Laboratory, updated September 2007. (online at http://www.nrel.gov/hydrogen/cdp_topic.html).
2. Wipke, K., Sprik, S., Thomas, H., Welch, C., Kurtz, J., “Learning Demonstration Interim Progress Report – Summer 2007,” National Renewable Energy Laboratory Technical Report NREL/TP-560-41848, July 2007.
3. Wipke, K., “Hydrogen Secure Data Center: Procedures to Protect Technical Data Submitted under the Controlled Hydrogen Fleet and Infrastructure Demonstration and Validation Project,” Golden, CO: National Renewable Energy Laboratory, updated June 2007.
4. Wipke, K., Welch, C., Thomas, H., Sprik, S., “Controlled Hydrogen Fleet and Infrastructure Analysis,” DOE Annual Merit Review Meeting, Washington, DC, May 2007. (presentation)
5. Wipke, K., Welch, C., Thomas, H., Sprik, S., Gronich, S., Garbak, J., Hooker, D., “Fuel Cell Vehicle Learning Demonstration: Spring 2007 Results,” NHA Annual Hydrogen Meeting and Exposition, San Antonio, TX, March 2007. (presentation)
6. Wipke, K., Welch, C., Thomas, H., Sprik, S., Gronich, S., Garbak, J., “Controlled Hydrogen Fleet and Infrastructure Demonstration and Validation Project: Initial Fuel Cell Efficiency and Durability Results,” World Electric Vehicle Association Journal, December 2006. (paper)
7. Wipke, K., Welch, C., Thomas, H., Sprik, S., “Controlled Hydrogen Fleet and Infrastructure Analysis Project,” 2006 DOE HFCIT Program Annual Progress Report, November 2006. (paper)
8. Wipke, K., Welch, C., Thomas, H., Sprik, S., Gronich, S., Garbak, J., “Hydrogen Leaning Demonstration Project: Fuel Cell Efficiency and Initial Durability,” Fuel Cell Seminar, November 2006. (extended abstract and presentation)
9. Wipke, K., presentation of Learning Demonstration results to FreedomCAR Vehicle Systems Analysis Tech Team, July 12, 2006 and Nov. 8, 2006.
10. Wipke, K., presentation of Learning Demonstration results to FreedomCAR Fuel Cell Tech Team, October 18, 2006.
11. Wipke, K., Welch, C., Thomas, H., Sprik, S., Gronich, S., Garbak, J., “Hydrogen Fleet & Infrastructure Demonstration and Validation Project: Fall 2006 Progress Update,” EVS-22, Yokohama, Japan, October 2006. (paper and presentation)
13

12. Wipke, K., Welch, C., Thomas, H., Sprik, S., Gronich, S., Garbak, J., “Hydrogen Fleet & Infrastructure Demonstration and Validation Project: Fall 2006 Progress Update,” CARB ZEV Technology Symposium, September 25, 2006. (presentation)
13. Welch, C., Wipke, K., Thomas, H., Sprik, S., “DOE’s Controlled Hydrogen Fleet and Infrastructure Demonstration and Validation Project: Quarterly Validation Assessment Reports,” (HSDC papers only)
o 3Q 2006, December 2006. o 4Q 2006, March 2007. o 1Q 2007, June 2007. o 2Q 2007, September 2007.
2.5 Acronyms CDP composite data product FAT Fleet Analysis Toolkit (software tool developed at NREL) FCV fuel cell vehicle FY fiscal year gge gallon of gasoline equivalent H2 hydrogen HFCIT Hydrogen, Fuel Cells & Infrastructure Technologies (DOE
program) HSDC Hydrogen Secure Data Center (at NREL) MYPP Multi-Year Program Plan (DOE document) NHA National Hydrogen Association NREL National Renewable Energy Laboratory R&D research and development
14

2.6 Composite Data Products Referenced in Previous Discussion
0
10
20
30
40
50
60
70
All OEMs
Effic
ienc
y (%
) Fuel Cell System1 Efficiency2 at ~25% Net Power.
DOE Target
Created: Aug-29-06 4:09 PM
1 Gross stack power minus fuel cell system auxiliaries, per DRAFT SAEJ2615.
2 Ratio of DC output energy to the lower heating value of the input fuel (hydrogen).Excludes power electronics and electric drive.
Figure 4: Fuel Cell System Efficiency at ~25% Net Power
0-5% Pwr 5-10% Pwr 10-20% Pwr 20-40% Pwr 40-60% Pwr 60-80% Pwr 80-100% Pwr >100% Pwr0
5
10
15
20
25
30
35
40
45
50
% T
ime
at P
ower
Lev
el
% Fuel Cell Power (Gross) of Max
On-Road % Time at Power Levels: DOE Fleet
Created: Sep-10-07 4:31 PM
Figure 5: Fuel Cell Operating Powers
15

Dyno (1) Window-Sticker (2) On-Road (3)(4)0
10
20
30
40
50
60
70
80Fu
el E
cono
my
(mile
s/kg
H2)
Fuel Economy
Created: Aug-23-07 2:48 PM
(3) Excludes trips < 1 mile. One data point for on-road fleet average of each make/model.
(1) One data point for each make/model. Combined City/Hwy fuel economy per DRAFT SAE J2572.
(2) Adjusted combined City/Hwy fuel economy (0.78 x Hwy, 0.9 x City).
(4) Calculated from on-road fuel cell stack current or mass flow readings.
Figure 6: Learning Demonstration Fuel Cell Vehicle Fuel Economy
Dyno Range (2) Window-Sticker Range (3) On-Road Range (4)(5)0
50
100
150
200
250
300
Vehi
cle
Ran
ge (m
iles)
Vehicle Range1
2015 Target2009 Target
Created: Aug-23-07 2:47 PM
(1) Range is based on fuel economy and usable hydrogen on-board the vehicle. One data point for each make/model.(2) Fuel economy from unadjusted combined City/Hwy per DRAFT SAE J2572.(3) Fuel economy from EPA Adjusted combined City/Hwy (0.78 x Hwy, 0.9 x City).(4) Excludes trips < 1 mile. One data point for on-road fleet average of each make/model.(5) Fuel economy calculated from on-road fuel cell stack current or mass flow readings.
Figure 7: Learning Demonstration Fuel Cell Vehicle Range
16

0 10 20 30 40 50 60 70 80 90 1000
1
2
3
4
5
6
7
8
9
10
11
12Range Histogram: All OEMs
Percentage of chassis dyno range1 b/w refuelings
Perc
enta
ge o
f Ref
uelin
gs
0 10 20 30 40 50 60 70 80 90 1000
25
50
75
100
Cum
ulat
ive
Perc
enta
ge
Created: Aug-23-07 3:24 PM
Total refuelings2 = 7966
1. Range calculated using the combined City/Hwy fuel economy from dyno testing (not EPA adjusted) and usable fuel on board.
2. Some refueling events are not detected/reported due to data noise or incompleteness.
Figure 8: Percentage of Theoretical Range Traveled Between Refuelings
0 10 20 30 40 50 60 70 80 90 100
Vehicle Range Factors
Percentage of chassis dyno range1.
All
OEM
s
Win
dow
-Stic
ker
2
On-
Roa
d 3
Dyn
o 1
Created: Aug-23-07 12:39 PM
1. Calculated using the combined City/Hwy fuel economy from dyno testing (non-adjusted) and usable fuel on board.
2. Applying window-sticker correction factors for fuel economy: 0.78 x Hwy and 0.9 x City.
3. Using fuel economy from on-road data (excluding trips > 1 mile, consistent with other data products).3. Using fuel economy from on-road data (excluding trips > 1 mile, consistent with other data products).
Figure 9: Effective Vehicle Range
17

0200
400600
800100012001400160018002000
22002400
2006 Target
2009 Target
Actual Operating Hours Accumulated To-Date Projected Hours to 10% Degradation
Max Hrs Accumulated (1)(2) Avg Hrs Accumulated (1)(3) Projection to 10% Degradation (4)(5)
Tim
e (H
ours
)
DOE Learning Demonstration Fuel Cell Stack Durability:Based on Data Through 2007 Q2
Max ProjectionAvg Projection
Created: Aug-23-07 10:42 AM
(1) Range bars created using one data point for each OEM.(2) Range (highest and lowest) of the maximum operating hours accumulated to-date of any OEM's individual stack in "real-world" operation.(3) Range (highest and lowest) of the average operating hours accumulated to-date of all stacks in each OEM's fleet.(4) Projection using on-road data -- degradation calculated at high stack current. This criterion is used for assessing progress against DOE targets, may differ from OEM's end-of-life criterion, and does not address "catastrophic" failure modes, such as membrane failure.(5) Using one nominal projection per OEM: "Max Projection" = highest nominal projection, "Avg Projection" = average nominal projection. The shaded green bar represents an engineering judgment of the uncertainty due to data and methodology limitations. Projections will change as additional data are accumulated.
Figure 10: Fuel Stack Hours Accumulated and Projected Hours to 10% Voltage Degradation
Power levels (low) (+)High decay rate2
Idle time (+)
Correlation to Decay Rate Data
~10% Decay rate variance explained by a combination of the data variables below1
Trip length (-)
Time between trips (+)
Power levels (high & average) (+)High decay rate2
Starts per hour (+)
Correlation to Decay Rate Data
~29% Decay rate variance explained by a combination of the data variables below1
1. Findings based on a Learning Demonstration Fleet, Partial Least Squares (PLS) regression model. Approximately 39% decay ratevariance explained by the model.
2. As part of the variable combination, a (+) indicates a directional relation to high decay rate and a (-) indicates an inverse relation.Created: Aug-31-07 9:00 AM
Figure 11: Primary Factors Affecting Learning Demo Fleet Fuel Cell Degradation
18

Team 4Team 4
Team 3Team 3 Team 1Team 1
Team 2Team 2
Starts perHour
Trip Length
Time Between Trips
Idle Time
Ambient Temperature
Power Levels
1. Results are from partial least squares (PLS) regression analysis of each team’s fleet of vehicles individually2. First two collections of factors cover ~61%-76% of decay rate variance
Created: Aug-31-07 9:00 AM
Team 4Team 4
Team 3Team 3 Team 1Team 1
Team 2Team 2
Starts perHour
Trip Length
Time Between Trips
Idle Time
Ambient Temperature
Power Levels
1. Results are from partial least squares (PLS) regression analysis of each team’s fleet of vehicles individually2. First two collections of factors cover ~61%-76% of decay rate variance
Created: Aug-31-07 9:00 AM Figure 12: Primary Factors Affecting Learning Demo Team Fuel Cell Degradation
Driving Start Time - Day: DOE Fleet
8%
3
12
9
6
2001 NHTS Data; Only Car, Truck, Van, & SUV trips included in data set shown here
Created: Sep-10-07 3:11 PM
Total Driving3 Events = 103009% of driving trips b/t 6 AM & 6 PM: 80.0%
1. Driving trips between 6 AM & 6 PM
2. The outer arc is set at 10 % total Driving.
3. Some events not recorded/detected due to data noise or incompleteness.
AM PM
% of NHTS trips b/t 6 AM & 6 PM: 80.1%
Source: http://nhts.ornl.gov/download.shtml#2001, ASCII.csv
Figure 13: Driving Start Time – Day
19

Driving Start Time - Night: DOE Fleet
4%
3
12
9
6
2001 NHTS Data; Only Car, Truck, Van, & SUV trips included in data set shown here
Created: Sep-10-07 3:11 PM
Total Driving3 Events = 103009% of driving trips b/t 6 PM & 6 AM: 20.0%
1. Driving trips between 6 PM & 6 AM
2. The outer arc is set at 10 % total Driving.
3. Some events not recorded/detected due to data noise or incompleteness.
PM AM
% of NHTS trips b/t 6 PM & 6 AM: 19.8%
Source: http://nhts.ornl.gov/download.shtml#2001, ASCII.csv
Figure 14: Driving Start Time -- Night
Sunday Monday Tuesday Wednesday Thursday Friday Saturday0
5
10
15
20
Driving Trips by Day of Week: DOE Fleet
% o
f Driv
ing
Trip
s in
a D
ay
Day
2001 NHTS Data; Only Car, Truck, Van, & SUV trips included in data set shown hereCreated: Sep-10-07 3:11 PMSource: http://nhts.ornl.gov/download.shtml#2001, ASCII.csv
Figure 15: Driving by Day of Week
20

0 5 10 15 20 25 300
5
10
15
20
25
30
35
40
45
50
% T
rips
with
in a
mile
age
rang
e
Trip Length (miles)
Trip Length (in miles): DOE Fleet
DOE FleetNHTS Data
Created: Sep-10-07 4:31 PM 2001 NHTS Data; Only Car, Truck, Van, & SUV day trips included in data set shown hereSource: http://nhts.ornl.gov/download.shtml#2001, ASCII.csv
Figure 16: Trip Length
Safety Reports - Vehicle Operation
0
1
2
3
2005
Q2
2005
Q3
2005
Q4
2006
Q1
2006
Q2
2006
Q3
2006
Q4
2007
Q1
2007
Q2
Num
ber o
f Rep
orts
H2 Leak - During FuelingH2 Alarm - StackH2 Alarm - Fuel SystemH2 Alarm - Passenger Compartment
Created: 8/23/07 7:51PM
Figure 17: Safety Reports – Vehicles
21

-30
-20
-10
0
10
20
30
40
50
60
1.4oF
122.9oFD
egre
es C
elsi
us
Ambient Temperature During Operation
All OEMs
Created: Aug-23-07 9:33 AM
Figure 18: Range of Ambient Temperature during Vehicle Operation
Vehicle Hours: All OEMs Combined
0
2
4
6
8
10
12
14
0-100
100-200
200-300
300-400
400-500
500-600
600-700
700-800
800-900>900
Total Vehicle Hours
Num
ber o
f Veh
icle
s
Through 2007 Q2
Created: Aug-23-07
Total Vehicle Hours = 39,748
Figure 19: Vehicle Operating Hours
22

Vehicle Miles: All OEMs Combined
0
2
4
6
8
10
12
0-250
0
2500
-5000
5000
-7500
7500
-10000
1000
0-12500
1250
0-15000
1500
0-17500
1750
0-20000
2000
0-22500
>22500
Total Vehicle Miles
Num
ber o
f Veh
icle
sTotal Miles Traveled = 821,518
Through 2007 Q2
Created: Aug-23-07
Figure 20: Number Vehicles vs. Miles Traveled
Cumulative Vehicle Miles Traveled: All OEMs
-
100,000
200,000
300,000
400,000
500,000
600,000
700,000
800,000
900,000
2005
Q2
2005
Q3
2005
Q4
2006
Q1
2006
Q2
2006
Q3
2006
Q4
2007
Q1
2007
Q2
Vehi
cle
Mile
s Tr
avel
ed
Created: Aug-23-07
Figure 21: Cumulative Vehicle Miles Traveled
23

On-Board Hydrogen Storage Methods
-
10
20
30
40
50
60
70
80
90
2005Q2 2005Q3 2005Q4 2006Q1 2006Q2 2006Q3 2006Q4 2007Q1 2007Q2
# of
Veh
icle
s (A
ll Te
ams)
Liquid H210,000 psi tanks5,000 psi tanks
Created Aug-28-2007 9:29PM
Figure 22: Vehicle Hydrogen Storage Technologies
99.7399.7499.7599.7699.7799.7899.7999.8
99.8199.8299.8399.8499.8599.8699.8799.8899.8999.9
99.9199.9299.9399.9499.9599.9699.9799.9899.99
100
Hyd
roge
n Fu
el Q
ualit
y In
dex
(%)
Hydrogen Fuel Quality Index Sampled from Stations(1)
Data RangeDataSAE J2719
Created: Aug-23-07 11:03 AM(1) Includes sampling from both electrolysis and reforming
Figure 23: Hydrogen Quality Index Scatter Plot
24

0 1 2 3 4 5 6 7 8 9 10
Particulates
μg/L
H2 Impurities
Data Range SAE J2719 Measured Less Than or Equal To (Detection Limited)
0 500 1000 1500 2000 2500 3000
(N2 + He + Ar)
0 5 10 15 20 25 30 35 40
H20 Total HC
O2 CO2 CO
NH3
μmol/mol (ppm)
0 10 20 30 40 50 60 70 80 90 100
Total S*
nmol/mol (ppb)Created: Aug-23-07 11:03 AM *Calculated from SO2, COS, H2S, CS2, and Methyl Mercaptan (CH3SH).
Figure 24: Hydrogen Impurities Scatter Plot
0 20 40 60 80 100 120 140
AdjustmentCheck Only
OtherRepair
Replacement
Maintenance: Average Labor Hours Per Station Since Inception
ScheduledUn-Scheduled
0 5 10 15 20 25
AdjustmentCheck Only
OtherRepair
Replacement
Maintenance: Average Number of Events Per Station Since Inception
0% 10% 20% 30% 40% 50% 60% 70% 80% 90% 100%
# of EventsHours
Comparison of Scheduled/Un-Scheduled Maintenance
Created: Aug-21-07 4:08 PM
Figure 25: Infrastructure Maintenance
25

0 10 20 30 40 50 60 70 80 90 100
Non-Event
Near Miss
Incident
Number of Reports
Seve
rity
Total Infrastructure Safety Reports by Severityand Report Type through 2007 Q2
Alarms OnlyAutomatic System ShutdownElectrical IssueEquipment MalfunctionH2 Release - Minor, NO IgnitionH2 Release - Significant, NO IgnitionNon-H2 ReleaseSystem Trouble, not Alarm
Created: Sep-06-07 7:36 AM
Figure 26: Infrastructure Safety Reports by Severity and Report Type
0 10 20 30 40 50 60 70 80 90 100
Non-Event
Near Miss
Incident
Number of Reports
Seve
rity
Primary Factors of Infrastructure Safety ReportsThrough 2007 Q2
Calibration/Settings/ Software ControlsDesign FlawEnvironment (Weather, Power Disruption, Other)Inadequate/ Non-working EquipmentMaintenance RequiredMischief, Vandalism, SabotageNot Yet DeterminedOperator/Personnel Error
Created: Sep-06-07 7:36 AM
Figure 27: Primary Factors of Infrastructure Safety Reports
26

2005Q2 2005Q3 2005Q4 2006Q1 2006Q2 2006Q3 2006Q4 2007Q1 2007Q20
2
4
6
8
10
12
14
Reporting Period
Num
ber o
f Sta
tions
Infrastructure Safety Trend and Online Stations Thru 2007Q2
Number of Online StationsAvg Refuelings Between Safety Reports
Created: Sep-06-07 7:36 AM
0
20
40
60
80
100
120
140
Num
ber o
f Ref
uelin
gs
713
3440
114
125129
62
82
Figure 28: Average Refuelings between Infrastructure Safety Reports
2005Q2 2005Q3 2005Q4 2006Q1 2006Q2 2006Q3 2006Q4 2007Q1 2007Q20
2
4
6
8
10
12
14
16
18
Reporting Period
Num
ber o
f Rep
orts
Type of Infrastructure Safety Reports by Quarter Through 2007 Q2
IncidentNear MissNon-EventStations OnlineAvg # Reports/Station
Created: Sep-06-07 7:36 AM
Figure 29: Type of Infrastructure Safety Report by Quarter
27

0 2 4 6 8 10 12 14 16 18 200
100
200
300
400
500
600
700
800
900
1000
Time (min)
Num
ber o
f Fue
ling
Even
ts
Histogram of Fueling TimesAll Light Duty Through 2007Q2
Average = 3.66 % <5 = 85
Created: Aug-23-07 1:29 PM
Figure 30: Refueling Times
0 0.5 1 1.5 2 2.5 3 3.5 4 4.5 50
50
100
150
200
250
Amount Fueled (kg)
Num
ber o
f Fue
ling
Even
ts
Histogram of Fueling AmountsAll Light Duty Through 2007Q2
Average = 2.21
Created: Aug-23-07 1:29 PM
Figure 31: Refueling Amounts
28

0 0.2 0.4 0.6 0.8 1 1.2 1.4 1.6 1.8 20
50
100
150
200
250
300
350
400
450
500
Avg Fuel Rate (kg/min)
Num
ber o
f Fue
ling
Even
ts
Histogram of Fueling RatesAll Light Duty Through 2007Q2
5 minute fill of5 kg at 350 bar
3 minute fill of5 kg at 350 bar
Average = 0.76 % >1 = 23
2006 Tech Val Milestone2010 MYPP Adv Storage Materials Target
Created: Aug-23-07 1:29 PM
Figure 32: Refueling Rates
0
2000
4000
6000
8000
10000
12000
All OEMs
Num
ber o
f cyc
les
Hydrogen Tank Cycle Life
2015 DOE MYPP Target1
2010 DOE MYPP Target1
2007 DOE MYPP Target1
Created: 23-Feb-20061Some near-term targets have been achieved with compressed and liquid tanks. Emphasis is on advanced materials-based technologies.
Figure 33: Compressed and Liquid Hydrogen Tank Cycle Life
29

0
1
2
3
4
5
6
7
8
9
All OEMs
Wei
ght P
erce
nt H
ydro
gen
(%)
Weight Percent Hydrogen
2015 DOE MYPP Target1
2010 DOE MYPP Target1
2007 DOE MYPP Target1
Created: 23-Feb-20061Some near-term targets have been achieved with compressed and liquid tanks. Emphasis is on advanced materials-based technologies.
Figure 34: Compressed and Liquid Hydrogen Tank Weight-Percent
0
0.01
0.02
0.03
0.04
0.05
0.06
0.07
0.08
0.09
0.1
All OEMs
Mas
s H
2 pe
r Lite
r (kg
/L)
Mass of Hydrogen Per Liter
2015 DOE MYPP Target1
2010 DOE MYPP Target1
2007 DOE MYPP Target1
Created: 23-Feb-20061Emphasis is on advanced materials-based technologies.
Figure 35: Compressed and Liquid Hydrogen Tank Volumetric Capacity
30

0 0.2 0.4 0.6 0.8 1 1.2 1.4 1.6 1.8 20
0.1
0.2
0.3
0.4
0.5
0.6
0.7
Avg Fuel Rate (kg/min)
Num
ber o
f Eve
nts
(Nor
mal
ized
)
Histogram of Fueling RatesComm vs Non-Comm Fills - All Light Duty Through 2007Q2
5 minute fill of5 kg at 350 bar
3 minute fill of5 kg at 350 bar
CommNon-Comm2006 Tech Val Milestone2010 MYPP Adv Storage Materials Target
Created: Aug-22-07 5:46 PM
Figure 36: Fueling Rates – Communication and Non-Communication Fills
Tank Levels: DOE Fleet
14%
FE
Created: Sep-10-07 3:14 PM
Total refuelings1 = 10303
1. Some refueling events not recorded/detected due to data noise or incompleteness.
Median Tank Level = 40% at Fill
2. The outer arc is set at 20% total refuelings.3. If tank level at fill was not available, a complete fill up was assumed.
Figure 37: H2 Tank Level at Refueling
31

FE
Tank Level Medians: DOE Fleet, All Vehicles
Created: Sep-10-07 3:14 PM
Total refuelings1 = 10303
1. Some refueling events not recorded/detected due to data noise or incompleteness.2. If tank level at fill was not available, a complete fill up was assumed.
Figure 38: Refueling Tank Levels – Medains
Refueling by Time of Day: DOE Fleet
9%
3
12
9
6
Created: Sep-10-07 3:14 PM
Total Fill3 Events = 9070% of fills b/t 6 AM & 6 PM: 86.0%
1. Fills between 6 AM & 6 PM
2. The outer arc is set at 12 % total Fill.
3. Some events not recorded/detected due to data noise or incompleteness.
AM PM
Figure 39: Refueling by Time of Day
32

Refueling by Time of Night: DOE Fleet
5%
3
12
9
6
Created: Sep-10-07 2:33 PM
Total Fill3 Events = 9070% of fills b/t 6 PM & 6 AM: 14.0%
1. Fills between 6 PM & 6 AM
2. The outer arc is set at 12 % total Fill.
3. Some events not recorded/detected due to data noise or incompleteness.
PM AM
Figure 40: Refueling by Time of Night
Sunday Monday Tuesday Wednesday Thursday Friday Saturday0
5
10
15
20
Fills by Day of Week: DOE Fleet
% o
f Fill
s in
a D
ay
DayCreated: Sep-10-07 3:14 PM
Figure 41: Refueling by Day of Week
33

Cumulative Hydrogen Produced or Dispensed Through 2007 Q2
0
5
10
15
20
25
30
35
2005
Q2
2005
Q3
2005
Q4
2006
Q1
2006
Q2
2006
Q3
2006
Q4
2007
Q1
2007
Q2
Calendar Quarter
Mas
s of
Hyd
roge
n (k
g)
(thou
sand
s)
0
2
4
6
8
10
12
14
16
Num
ber
of S
tatio
ns
Cumulative HydrogenNumber of Stations
Created 2007-Sep-07
Figure 42: Cumulative Hydrogen Produced or Dispensed
Infrastructure Hydrogen Production Methods
0
1
2
3
4
5
DeliveredCompressed H2
Natural Gas On-siteReforming
Electrolysis Delivered Liquid H2
Production Technology
# of
Sta
tions
Created Aug-23-07
Figure 43: Number and Types of Hydrogen Stations Being Demonstrated
34
Online Stations
0
2
4
6
8
10
12
14
16
2005 Q2 2005 Q3 2005 Q4 2006 Q1 2006 Q2 2006 Q3 2006 Q4 2007 Q1 2007 Q2
Reporting Period
Num
ber o
f Sta
tions
Created Aug-12-07
Figure 44: Number of Stations Online by Quarter
35

F1147-E(09/2007)
REPORT DOCUMENTATION PAGE Form Approved OMB No. 0704-0188
The public reporting burden for this collection of information is estimated to average 1 hour per response, including the time for reviewing instructions, searching existing data sources, gathering and maintaining the data needed, and completing and reviewing the collection of information. Send comments regarding this burden estimate or any other aspect of this collection of information, including suggestions for reducing the burden, to Department of Defense, Executive Services and Communications Directorate (0704-0188). Respondents should be aware that notwithstanding any other provision of law, no person shall be subject to any penalty for failing to comply with a collection of information if it does not display a currently valid OMB control number. PLEASE DO NOT RETURN YOUR FORM TO THE ABOVE ORGANIZATION. 1. REPORT DATE (DD-MM-YYYY)
November 2007 2. REPORT TYPE
Technical Report 3. DATES COVERED (From - To)
5a. CONTRACT NUMBER
DE-AC36-99-GO10337
5b. GRANT NUMBER
4. TITLE AND SUBTITLE Learning Demonstration Progress Report - September 2007
5c. PROGRAM ELEMENT NUMBER
5d. PROJECT NUMBER NREL/TP-560-42264
5e. TASK NUMBER H2708100
6. AUTHOR(S) K. Wipke, S. Sprik, J. Kurtz, and H. Thomas
5f. WORK UNIT NUMBER
7. PERFORMING ORGANIZATION NAME(S) AND ADDRESS(ES) National Renewable Energy Laboratory 1617 Cole Blvd. Golden, CO 80401-3393
8. PERFORMING ORGANIZATION REPORT NUMBER NREL/TP-560-42264
10. SPONSOR/MONITOR'S ACRONYM(S) NREL
9. SPONSORING/MONITORING AGENCY NAME(S) AND ADDRESS(ES)
11. SPONSORING/MONITORING AGENCY REPORT NUMBER
12. DISTRIBUTION AVAILABILITY STATEMENT National Technical Information Service U.S. Department of Commerce 5285 Port Royal Road Springfield, VA 22161
13. SUPPLEMENTARY NOTES
14. ABSTRACT (Maximum 200 Words) This report documents the key results from the DOE Controlled Hydrogen Fleet and Infrastructure Validation and Demonstration project. This project is also referred to as the fuel cell vehicle and infrastructure learning demonstration.
15. SUBJECT TERMS fuel cell demonstration; vehicle demonstration; hydrogen infrastructure; hydrogen vehicle, fuel cell
16. SECURITY CLASSIFICATION OF: 19a. NAME OF RESPONSIBLE PERSON a. REPORT
Unclassified b. ABSTRACT Unclassified
c. THIS PAGE Unclassified
17. LIMITATION OF ABSTRACT
UL
18. NUMBER OF PAGES
19b. TELEPHONE NUMBER (Include area code)
Standard Form 298 (Rev. 8/98) Prescribed by ANSI Std. Z39.18