learning environments of chinese only children · learning environments of chinese only children...
TRANSCRIPT

Learning Environments of Chinese Only Children
Inaugural-Dissertation
Zur Erlangung des Doktorgrades der Philosophie
an der Ludwig-Maximilians-Universität München
Vorgelegt von
Weiping Liu
aus
China
2010

Referent: Prof. Dr. Thomas Eckert (Erstgutachter)
Korreferent: Prof. Dr. Rudolf Tippelt (Zweitgutachter)
Tag der mündlichen Prüfung: 20. Juli 2010

Acknowledgement
In the end I finish writing my dissertation! From the bottom of my heart, I would like to
express my thanks and appreciation to many special people...
To my supervisor and mentor, Prof. Dr. Thomas Eckert for his great support, guidance
and expertise. I really appreciate his humour, tolerance, wisdom, flexibility, and
encouragement during the process of supervising. I‘m very grateful to him for his step-by-
step supervision and guidance from research proposal, questionnaire design, data-analysis
till his criticism and suggestions for some important change in my dissertation. His timely
recommending me to read some important books is like opening the windows of a dark
room, in which I am in!
To my husband, Hui whose love and great support by sharing more child care work and
doing more housework encouraged me along over the whole process. To my son, Yiyang (3
years old) who was so great in agreeing to be taken care of by papa during this time and
whose love and hug made me forget tiredness and regain strength and energy every time
when I came back home from the library.
To my late grandmother, and to my parents and my brothers for your encouragement and
urging me to finish my PhD study by always remembering asking me when I could finish my
dissertation! Now you get the answer!
To my friends Jie Zhang, Renxiu Liu, Ling Wang and my brother, Weijian who helped me
in getting more contacts for distributing and collecting questionnaires. And many thanks to
Weijian for helping me in data entry as well.
To all the students who participated in my research project. Their willingness to sacrifice
almost one hour time to fill out my questionnaires.
And last, but not least, to Prof. Dr. Rudolf Tippelt (second evaluator) and Prof. Dr. Sabine
Walper (third evaluator) for their criticisms and suggestions to my dissertation.

ii
Table of Contents
Abstract ................................................................................................................................... 1
1. Introduction ........................................................................................................................ 2
1.1. History of Learning Environment Research .................................................................. 2
1.2. China‘s One-Child Policy and Its Impact on Family and Society ................................. 2
1.3. Learning Environment Research Gaps .............................................................................. 6
2. Theoretical Framework...................................................................................................... 8
2.1. Kurt Lewin‘s Field Theory and his Psychological Ecology........................................... 8
2.1.1. Field Theory and Psychological Field ..................................................................... 8
2.1.2. Psychological Ecology ............................................................................................ 9
2.2. Implications of Lewin‘s Field Theory for Study of Learning Environments............... 10
2.2.1. Lewin‘s Definition of Learning ............................................................................. 10
2.2.2. Defining Learning Enviornment ............................................................................ 10
2.3. Bronfenbrenner‘s Ecological Systems Theory ............................................................. 11
2.3.1. Bioecological Systems Theory .............................................................................. 11
2.3.2. Bronfenbrenner‘s structure of environment .......................................................... 12
3. Past Theories and Research Results regarding Only-Children .................................... 15
3.1. Theories ........................................................................................................................ 15
3.2. Research Results about Only Children outside of China: Advantaged or No Difference
............................................................................................................................................. 15
3.3. Research Results about Chinese Only-Children in China: Mixed Results .................. 16
3.4. Summary ...................................................................................................................... 17
4. Family Environment ......................................................................................................... 18
4.1. Parenting Style ............................................................................................................. 18
4.1.1. Diana Baumrind‘s Concept of Parenting Style ...................................................... 18

iii
4.1.2. Third Dimension of Parenting Style ...................................................................... 20
4.1.3. Research Results about Parenting Style ................................................................ 20
4.2. General Family Environment ....................................................................................... 30
4. 2.1. Definition of General Family Environment.......................................................... 31
4. 2.2. Impacts of General Family Relations (cohesion, conflict and expressiveness) ... 32
5. Peer Relations: Peer Group Acceptance and Best Friendship Quality........................ 39
5.1. First Generation (from late 1920s till World War II) ................................................... 39
5.1.1. Investigative Agenda of First Generation: studying the nature of peer groups and
the association between children‘s characteristics and their positions in peer groups .... 39
5.1.2. Research Review in First Generation .................................................................... 39
5.2. Second Generation (from1970s and 1980s) ................................................................. 40
5.2.1. Investigative Agenda: Likely Causes of Peer Rejection and Peer Acceptance,
Types and Functions of Peer Relations ............................................................................ 40
5.2.2. Reasons for Social Skills and Skill Deficits .......................................................... 41
5.2.3. Friendship and Peer Acceptance ............................................................................ 41
5.2.4. Impact of Peer Relations on Children‘s Development .......................................... 41
5.3. Third Generation (1990s and beyond) ......................................................................... 42
5.3.1. Investigative Agenda: Do distinct forms of peer relationships, and the provisions
they afford, differentially affect children‘s development and adjustment? ..................... 42
5.3.2. More about Contributions of Peer Relations ......................................................... 42
5.3.3. Impacts of Friendship, Friendship or Best Friendship Quality and Quantity, and
Peer Acceptance ............................................................................................................... 43
5.3.4. Innovative Areas of Investigation of Third Generation Peer Relations Research . 49
5.3.5. Gender Differences ................................................................................................ 50
5.3.6. Cultural and Ethnic Similarities and Differences .................................................. 51
iv
5.3.7. Summary of Three Generations of Peer Relations Research Results .................... 52
6. Teacher Interpersonal Behavior ...................................................................................... 54
6.1. History of Teacher Interpersonal Behavior as Learning Environment ........................ 54
6.2. Research Results on Teacher Interpersonal Behavior through Perceptions of Students
............................................................................................................................................. 54
6.2.1. International Feature of Research .......................................................................... 54
6.2.2. Theoretical Foundation .......................................................................................... 54
6.2.3. Mostly Studied Research Questions and Answers ................................................ 56
6.2.4. Teacher Interpersonal Behavior in China .............................................................. 57
6.2.5. Trial in Conjunction with Other Aspects of Learning Environment (e.g., Culture or
Ethnicity) ......................................................................................................................... 58
6.2.6. Stability and Change of Teacher-Student Relationships in the Whole Teaching
Career............................................................................................................................... 60
6.2.7. Effects of Eight profiles of teachers in terms of teacher interpersonal behavior on
Cognitive and Affective Outcomes .................................................................................. 60
6.2.8. Teacher-Student Relationships from Perceptions of Different Groups of Students
......................................................................................................................................... 61
6.2.9. Summary ................................................................................................................ 62
7. Research Goals and Hypotheses ...................................................................................... 63
7.1. Why Present Study? ..................................................................................................... 63
7.2. Why chronic self-concept levels are investigated? ...................................................... 63
7.2.1. Sate of the Person .................................................................................................. 63
7.2.2. Individual, Relational, and Collective Levels of Self-Concept ............................. 63
7.2.3. Chronic and Working Self-Concepts ..................................................................... 64
7.2.4. Self-Concept and Prior Social Interactions, Social Context and Cultural Influences

v
......................................................................................................................................... 64
7.3. Research Goal .............................................................................................................. 65
7.3.1. Theoretical Purpose ............................................................................................... 65
7.3.2. To find Whether Uniqueness about Chinese Only Children Exists ....................... 66
7.4. Hypotheses ................................................................................................................... 67
8. Methodology ...................................................................................................................... 68
8.1. Participants ................................................................................................................... 68
8.2. Instrument .................................................................................................................... 68
8.3. Procedure ..................................................................................................................... 73
8.3.1. Back Translation .................................................................................................... 73
8.3.2. Distributing and Collecting Questionnaires .......................................................... 73
9. Analyses and Results ........................................................................................................ 75
9.1. Descriptive Statistics .................................................................................................... 75
9.1.1. Descriptive Statistics and Correlation Coefficients for All Variables.................... 75
9.1.2. Profiles of Chinese Only Children‘s Favourite Teacher and Average Teacher
Interpersonal Behavior .................................................................................................... 79
9.1.3. Career Orientations of Chinese Only Children...................................................... 80
9.1.4 Gender Differences ................................................................................................. 80
9.2. Exploratory Factor Analyses ........................................................................................ 81
9.2.1. Three Components of Favourite Teacher Interpersonal Behavior ......................... 81
9.2.2. Two Components of Average Teacher Interpersonal Behavior ............................. 83
9.2.3. Different Understanding of QTI of Chinese Only Children .................................. 84
9.2.4. One Component of Father or Mother Parenting Styles: New Profile of Parenting
Style of Chinese Parents .................................................................................................. 84
9.2.5. One Component of Chronic Self-Concept Levels: Chinese Cultural Print Still on

vi
There ................................................................................................................................ 86
9.2.6. Two Components of Career Orientation ................................................................ 87
9.3. Hypotheses Testing ...................................................................................................... 88
9.3.1. Testing of Impact of Family Environment and Chronic Self-Concept on Career
Orientation (Hypothesis 1) .............................................................................................. 88
9.3.2. Testing of School Group Differences (Hypothesis 2) ............................................ 92
9.3.3. Testing of Cross-Sex Parenting Effects (Hypothesis 3) ........................................ 93
9.3.4. Impact of Different Matches of Father and Mother‘s Parenting Styles (Hypothesis
4) ...................................................................................................................................... 94
9.3.5. Testing of Direct and Joint Effects of Learning Environments and Self-Concept
Levels on Student Outcomes (Hypothesis 5) .................................................................. 97
9.3.6. Testing of Three Learning Environments‘ Direct and Interaction Effects on
Student Outcomes (Hypothesis 6) ................................................................................. 133
10. Conclusion and Discussion ........................................................................................... 147
10.1. Conclusion ............................................................................................................... 147
10.2. What happened when there were no interactions between the learning environments?
........................................................................................................................................... 153
10.3. Discussion ................................................................................................................ 154
10.3.1. Theoretical Implication ...................................................................................... 154
10.3.2. Practical Implications ........................................................................................ 156
10.3.3. Limitations and Future Research ....................................................................... 159
References ............................................................................................................................ 161
Appendix ............................................................................................................................. 184

1
Abstract
Based on Lewin‘s (1951) Field Theory and Bronfenbrenner‘s (1979) Bioecological Systems
Theory, the author collected data from 405 Chinese only children regarding 3 social
interrelation learning environments, chronic self-concept levels and some outcomes such as
career orientation, academic achievement orientation, social competence and self-esteem
through their own perceptions through questionnaire distributing. On one hand, this research
was designed to see whether there was some uniqueness about Chinese only-children; on the
other hand this research was a theoretically driven research for proof of a theoretical model.
The proposed theoretical model contends that the impacts of learning environments on
students must be studied from a psychological ecological perspective by considering the
direct and joint effects of learning environments and student personality within the macro-
environments of culture, public policy etc. With data analyses such as exploratory factor
analysis, hierarchical multiple regression analysis and ANOVA, hypotheses formulated on
these research purposes were tested to be true and the proved theoretical model coincided
with part of the prediction of Bronfenbrenner‘s Bioecological Systems Theory. Finally, based
on the conclusion of the present study, theoretical and practical implications were discussed.

2
1. Introduction
1.1. History of Learning Environment Research
Commentators often attributed the beginnings of the field of learning environments to the
pioneering independent contributions of two American researchers, Herbert Walberg and
Rudolf Moos, approximately 40 years ago. Walberg developed the Learning Environment
Inventory to assess students‘ perceptions as part of the research and evaluation activities of
Harvard Project Physics (Walberg & Anderson, 1968). Moos (1974) developed
questionnaires to assess nine separate human environments (including hospital wards,
families and work settings), with one of these being the Classroom Environment Scale
(Moos & Trickett, 1974). One of Moos‘ (1974) contributions was to show that the same three
basic types of dimensions characterized diverse human environments: the Relationship
dimension involves the strength and type of personal relationships within an environment
and the extent to which people are involved in the environment and help and support each
other; the Personal Development dimension assesses basic directions along which personal
growth and self-enhancement tend to occur; and the System Maintenance and Change
dimension involves the extent to which the environment is structured and orderly, provides
clear expectations, maintains control, and is responsive to change.
1.2. China‘s One-Child Policy and Its Impact on Family and Society
The One-Child Policy is the population control policy in China. Chinese government
introduced this policy in 1979, in order to alleviate social, economic, and environmental
problems in China due to a large population and an increasing birth rate. It officially restricts
the number of children married urban couples can have to one, although it allows
exemptions for several cases. Of course, this policy has some advantages on a family with
only one child. For example, the family will have less financial pressure, more freedom,

3
more possibility to devote time and energy to the only child, no sibling rivalry, and more
possibility for the mother to realize her career ambition etc.
Meanwhile, this policy also has been bringing immensely other social effects on society
and families. To name but a few, for example, the first effect of the policy is on the size and
structure of Chinese families, which have a long time of tradition of preferring larger size of
families with more children and more grand children. The size of Chinese families tends to
be minimized, and more and more nuclear families have been resulted in. While nuclear
family has already been the most popular form of Chinese families, the traditional large
families including 3 or 4 generations have been disappearing. A nuclear family probably
makes more family cohesion, but at the same time, this leaves the family more vulnerable
and unstable, and more isolated as well.
Second effect is that many parents tend to take new parenting styles. Since they have only
one child in the family and hence are capable to invest more resources and more attention
and patience in their only child. Parenting styles may change from the traditional Chinese
authoritarian style into a permissive or authoritative style.
Thirdly, this policy has also a great impact on Chinese family kinship and on the ratio
between the elderly people and young people in society. To illustrate the effects of China‘s
One-Child Policy on Chinese family kinship, I use an extended family of a fourth generation
only child based on Helle‘s (1988) parent family culture (see Figure 1). In this extended
family, each member in this extended family has been or is the only child of his or her
parents in the former or present nuclear family. The present only child (in the fourth row
from the top) in Figure 1 has 8 great grand parents (the first row from the top), 4
grandparents (the second row from the top) and 2 parents (the third row from the top). But if
this conception of extended family is based on Father Family Culture (Helle, 1988), it would
be like the illustration in Figure 2, but when a married couple have a female child, the family

4
Figure 1. The Extended Family of the Fourth Generation Only Child in a Parent Family
Culture
Note. ―□‖ refers to a male, while ―○‖ refers to a female. And ―□—○‖ refers to a married
couple.
Figure 2. Family Tree in a Father Family Culture
Note. ―□‖ refers to a male, while ―○‖ refers to a female. And ―□—○‖ refers to a married
couple.

5
would come to the end for further development! Probably few people have seen such strange
extended families because they are not developing, but generation after generation
combining and decreasing till disappearing. The number of family members of the last
generation divided by two would be the largest number of the immediate next generation.
This is exactly the goal of the policy makers, that is, to reduce the birth rate at national level.
But if we consider this situation from the long run, we could see that the rapid decrease in
the birth rate, together with stable or improving proportion of elderly people. In China, the
percentage of the population over the age of 65 years old was 5% in 1982 and accounted for
7.5% in 2005, but is expected to rise to more than 15% till 2025 according to World Bank
Health Nutrition and Population Division, Developmental data. (Accessed August 26, 2005,
at http://www.worldbank.org/hnpstats.).
Therefore, the ―4:2:1‖ (or even ―8:4:2:1‖) phenomenon appears. A lack of adequate pension
coverage in China, the underdeveloped social welfare systems and social health insurance
systems mean that financial dependence on offspring is still necessary for approximately
70% of the elderly people because they live in rural areas and have no pensions. In China,
this problem has been named as the ―4:2:1‖ phenomenon, meaning that increasing numbers
of couples will be solely responsible for the care of one child and four parents. Chinese
people have greatly emphasized children‘s roles and duties in the family as part of the larger
Chinese value of filial piety, of which family obligation is one component. The obligation to
the family that is emphasized in Chinese societies includes dimensions such as a belief in the
need to repay parents for their efforts in raising children, a willingness to make sacrifices for
the sake of the family, and a respect for the elderly of the family (Ho, 1996; Huang, 1989;
Yang, 1989). Also according to the law in China, parents shall take the responsibility to bring
up their children, and the children later shall take the obligation to support their parents
when they are old or need help. Therefore, the ―4:2:1‖ phenomenon would create a heavy

6
social and financial burden for the young adults if the government does not make any
improvement in the social health insurance system and other supporting systems. These
heavy burdens might probably make the new generation of Chinese only children have quite
different career orientations to run for practical means, such as money and power.
Finally, the lack of extension of family kinship and the prevailing way of living in a
nuclear family, to some extent, lead to a loss of the basic functions of the family: initial
socialization of children (Parsons, 1955). With this policy, there are to be less relatives and
less closer family kinship relations for each member of the family because it is obvious that
each member in the extended family has no uncles or aunts, no siblings, and no cousins as
well. Probably these Chinese terms, such as uncle, aunt, brother, sister, and cousin, are to be
explained by the later archaeologists and are going to seem new words from a foreign
language to the later generations of only children in China. In a nuclear family, the only-
child could not find the same age children to communicate with and thus may not learn how
to get along well with his peers later in society. Therefore, when they consider themselves,
they may limit to the individual level, instead of a relational and/or collective level, hence
they may lack social competence, have a feeling of loneliness and helplessness, and present
some anxious solitary behaviors.
1.3. Learning Environment Research Gaps
There are at least three learning environment research gaps. First, it is the gap between
Western world and China in learning environment research. Learning environment research
has a history of about 40 years in the West and the researchers from Western world in this
field have accomplished fruitful successes in terms of the variety and validity research
instruments, research design, and research results both about normal population or only
children. But few research results are revealed about Chinese students or Chinese only
children. Therefore, it would be of great importance and of great interest to investigate the

7
learning environments of Chinese only children in such a huge laboratory created by Chinese
government, but based on a quite different culture — a collectivistic culture.
Secondly, there is a research gap on Western research part as well. Since throughout the
learning environment literature, almost all researchers concentrated themselves on one
aspect of learning environments, such as family environment, classroom climate
environment or teacher effectiveness (or teacher interpersonal relations). As learning
environments, researchers should consider them as a whole to study the effects on students.
Thirdly, personal characteristics were mostly ignored by learning environment
researchers. According to Lewin‘s Field Theory (1951), behavior depends on the interaction
of the person and the environment within a psychological field, or life space. That is, when
studying the effects of learning environments, the personal state of the learners should be
considered as well because it is the learners who determine which aspects of the physical and
social learning environments could enter into their psychological learning environment
reality and what they react to the learning environments according to their needs,
expectations, etc.

8
2. Theoretical Framework
As Lewin realized that: ―Without theories it is impossible in psychology, as in any other
science, to proceed beyond the mere collection and description of facts which have no
predictive value. It is impossible to handle problems of conditions or effects without
characterizing the dynamic properties behind the surface of the directly observable
phonotypical properties.‖ (Lewin, 1951, p. 241) Lewin‘s field theory and Bronfenbrenner‘s
(1979) Ecological Systems Theory are applied as the theoretical framework of the present
study.
2.1. Kurt Lewin‘s Field Theory and his Psychological Ecology
2.1.1. Field Theory and Psychological Field
Field theory, defined by Lewin (1951, p. 45) primarily as ―a method of analyzing causal
relations and of building scientific constructs‖. According to Lewin‘s (1951) field theory,
―behavior and development depend upon the state of the person and his environment, B = F
(P, E). In this equation the person (P) and his environment (E) have to be viewed as variables
which are mutually dependent upon each other. In other words, to understand or to predict
behavior, the person and his environment have to be considered as one constellation of
interdependent factors. We call the totality of these interdependent factors the life space
(LSp) of that individual, and write B = F (P, E) = F (LSp). The task of explaining behavior
then becomes identical with (1) finding a scientific representation of the life space (LSp) and
(2) determining the function (F) is what one usually calls a law‖ (p.239-240).
There are six essential features of the field-theoretical approach which distinguish it most
clearly from other theoretical orientations (Lewin, 1951, p. 60): (1) the use of a constructive
rather than classificatory method; (2) dynamic approach: an interest in the dynamic aspects
of events; (3) a psychological rather than physical approach; (4) an analysis which starts
with the situation as a whole; (5) a distinction between systematic and historical problems;

9
(6) a mathematical representation of the field.
What is the ―field‖ then? ―A totality of coexisting facts which are conceived of as
mutually interdependent is called a field. Psychology has to view the life space, including
the person and his environment, as one field.‖ (p.240) Specifically, ―What means are most
appropriate for analyzing and representing scientifically a psychological field have to be
judged on the basis of their fruitfulness for explaining behavior.‖ (p. 240)
Therefore, for Lewin, both the person and the environment are important in studying
behavior and development. Moreover, both aspects of the field should be studied as
interdependent factors when considering their impacts on behavior or development.
2.1.2. Psychological Ecology
With the intention of clarifying what the ―psychological field‖ is, Lewin (1951, p. 57)
noticed that within the realm of facts existing at a given time one can distinguish three areas
in which changes are or might be of interest to psychology:
(1) The ―life space‖; i.e., the person and the psychological environment as it exists for him. We
usually have this field in mind if we refer to needs, motivation, mood, goals, anxiety, ideals.
(2) A multitude of processes in the physical or social world, which do not affect the life space of
the individual at that time.
(3) A ―boundary zone‖ of the life space: certain parts of the physical or social world do affect the
state of the life space at that time.
Lewin (1951, p. 57) continued to emphasize that ―the process of perception, for instance,
is intimately linked with this boundary zone because what is perceived is partly determined
by the physical ‗stimuli‘; i.e., that part of the physical world which affects the sensory organs
at that time. Another process located in the boundary zone is the ‗execution‘ of an action.‖
Then he (Lewin, 1951, p. 59) went further to define ―psychological ecology‖:
Theoretically, we can characterize this task as discovering what part of the physical or social
world will determine during a given period the ―boundary zone‖ of the life space. This task is

10
worth the interest of the psychologists. I would suggest calling it ―psychological ecology.‖
Thus, in Lewin‘s field theory, through the proposal of psychological ecology, some
physical and social environments are as components of psychological investigation. But, in
essence, he meant that all these physical and social environments must appear in the
psychological investigation as psychological, not purely physically objective data, that is,
they must be present ―as they are perceived or known‖ in the psychological field considered.
The most important is that through his proposal of psychological ecology, Lewin essentially
suggests a form a psychological research able to use and to integrate information of a non-
psychological nature for the understanding of psychological phenomena.
2.2. Implications of Lewin‘s Field Theory for Study of Learning Environments
2.2.1. Lewin‘s Definition of Learning
Learning is ―a term with many meanings and a disturbing history‖ as Lewin (1951, p.65)
noted. Under the broad sense of leaning as ―doing something better than before‖, Lewin
distinguished at least the following types of changes: (1) learning as a change in cognitive
structure (knowledge), (2) learning as a change in motivation (learning to like or dislike), (3)
learning as a change in group belongingness or ideology (this is an important aspect of
growing into a culture), (4) learning in the meaning of voluntary control of the body
musculature (this is one important aspect of acquiring skills, such as speech and self-
control).
2.2.2. Defining Learning Enviornment
Thus, we could give a simple definition to learning environment: it is the environment
where learning takes places. Thus the real problem lies in how the ―environment‖ is defined.
As Lewin (1951, p. 57) defined that the ―field‖ is the person in his life space. Therefore, the
study of learning environment become the study of the ―field‖, which includes not only the
life space, that is, the person and the psychological environment as it exists for him, but also

11
those areas of the physical and social world which are part of the life space or which affect
its boundary zone at present.
Lewin (1951, p. 72-74) further suggested that scientific predictions or advice for methods
of change should be based on an analysis of the ―field as a whole,‖ including both its
psychological and nonpsychological aspects. That is, ―One should view the present
situation─ the status quo ─ as being maintained by certain conditions or forces. ...... In other
words, we have to deal, in group life as in individual life, with what is known in physics as
‗quasi-stationary‘ processes.‖ Moreover, ―these processes have to be conceived of as a result
of forces in the organism and its life space, in the group and its setting. The structure of the
organism, of the group, of the setting, or whatever name the field might have in the given
case, has to be represented and the forces in the various parts of the field have to be analyzed
if the processes are to be understood scientifically.‖ Because ―the process is but the
epiphenomenon,‖ while ―the real object of study is the constellation of forces.‖
Therefore, an inference about learning environments is: the study of learning
environments becomes the study of the constellation of forces coming from the learners‘ life
space (such as personality, family, school, community, etc.) and its boundary zone (such as
parents work places, public policy, culture, etc.), which contribute to the learning processes
or outcomes.
2.3. Bronfenbrenner’s Ecological Systems Theory
2.3.1. Bioecological Systems Theory
As many other psychologists, Bronfenbrenner (1979) has been greatly influenced by
Lewin‘s field theory and his proposal of psychological ecology and the proof we could find
in his ecological approach to human development in his Ecological Systems Theory.
Specifically, this theory looks at a child‘s development within the context of relationships
between 5 systems, which are the environments for development. This theory has recently

12
been renamed ―bioecological systems theory‖ (Bronfenbrenner, 2005) to emphasize that a
child‘s own biology is a primary environment for development, which is again a reflection of
the influence from Lewin‘s field theory. The interaction between factors in the child‘s
maturing biology, his immediate family/community environment, and the other social
environments affect the development of the child. Changes or conflict in any one layer will
ripple throughout other layers. To study a child‘s development, we must look not only at the
child and his or her immediate environments, but also at the interaction of the larger
environments as well.
2.3.2. Bronfenbrenner‘s structure of environment
Within Bronfenbrenner‘s Bioecological Systems Theory, five environmental systems are
identified (see Figure 3):
(1) Microsystem: The setting in which the individual lives. Structures in the microsystem
include family, school, neighborhood, or childcare environments. At this level,
relationships have impact in two directions - both away from the child and toward the
child. It is in the microsystem that the most direct interactions with social agents take
place; with parents, peers, and teachers, for example. The individual is not a passive
recipient of experiences in these settings, but someone who helps to construct the
settings. In addition, the person's own biology may be considered part of the
microsystem; thus the theory has recently sometimes been called "Bio-Ecological
Systems Theory."
(2) Mesosystem: Mesosystem refers to relations between microsystems or connections
between contexts. Examples are the relation of family experiences to school
experiences, school experiences to church experiences, and family experiences to peer
experiences. For example, children whose parents have rejected them may have
difficulty developing positive relations with peers.

13
Figure 3. Bronfenbrenner‘s Ecological Systems Theory Model.
(see: http://www.des.emory.edu/mfp/302/302bron.PDF)

14
(3) Exosystem: Exosystem involves links between a social setting in which the individual
does not have an active role and the individual's immediate context in the microsystem.
For example, that a mother has to work longer in her workplace may influence length of
time and quality of reaction between the mother and her child.
(4) Macrosystem: Macrosystem describes the culture in which individuals live. Cultural
contexts include developing and industrialized countries, socioeconomic status, poverty,
and ethnicity. Moreover, the public policy is also categorized into the macrosystem by
Bronfenbrenner (1979).
(5) Chronosystem: Chronosystem encompasses the dimension of time as it relates to a
child‘s environments. Elements within this system can be either external or internal,
such as the patterning of environmental events, social-historical circumstances, and
transitions over the life course, or different development phases due to age increase. For
example, divorce is one transition. Researchers have found that the negative effects of
divorce on children often peak in the first year after the divorce. By two years after the
divorce, family interaction is less chaotic and more stable. As social-historical
circumstances, we might consider decades or hundreds years ago, women had no right to
enter into education world and to pursue their careers, but now they have the rights,
which, in turn, affect the development of their children.
In sum, Bronfenbrenner proposed a theoretical work on human development as regards
methods and results and in particular their possibilities of providing indications for social
changes in the area of social policy. Both Lewin‘s field theory and Bronfenbrenner‘s
bioecological systems theory are to act as theoretical frameworks in present study.
15
3. Past Theories and Research Results regarding Only-Children
3.1. Theories
A child‘s ordinal place in the family has long been thought to have enduring implications
for personality development and psychological well-being. The concept of birth order as a
mechanism to understand children‘s behavior was formally developed by Alfred Adler
(1931), who thought that children‘s positions in the family greatly influence their overall
development and attitude toward life. The pioneering psychologist G. Stanley Hall held that
for a child to develop normally he or she should have siblings and on the basis of a study
with an extremely small sample size of only children, concluded that, ―being an only child is
a disease in itself ‖ (as cited in Fenton, 1928: p. 547). Although Hall‘s conclusion was
questionable, his negative view of the only child launched new interests to study the impact
of the birth order and/or the only children.
Anyway, from a theoretical standpoint, only children do represent a useful and challenging
concept because they do not grow up with siblings and they also provide a natural
comparison group for those who seek to determine what impact siblings have on
development. Only children are also important for both birth order and family size theorists
(Polit & Falbo, 1985).
3.2. Research Results about Only Children outside of China: Advantaged or No Difference
Although some researchers reached mixed results both about only children (e.g., Chen and
Goldsmith, 1991; Doby and others, 1980), advantaged outcomes or no difference outcomes
regarding the comparison of only children and other children were reached by most of the
researchers.
However, negative stereotypes about only children persist. For example, it is commonly
believed that only children are spoiled, selfish, lonely, and maladjusted (Roberts & Blanton,

16
2001). Blake‘s (1981) research also stated that such a negative perception of only children is
common, citing that only children are depicted as self-centered, anxious, domineering, and
quarrelsome. Falbo and Polit (1986) noted that only children are often characterized as
lacking social competence because of the notion that they are deprived of the social
experiences siblings can offer.
But advantaged or no difference results about only children and other children are the
mainstream. Doby and others (1980) conducted an investigation by comparing the
characteristics of only children with children raised in multiple-sibling families. Results
indicated that being reared as only child actually provided a slightly developmental
advantage over those raised with other siblings. But when information was gathered on
background characteristics such as parents' educational levels and prenatal and natal
conditions, they reached similar or no difference outcomes. Rivera and Carrasquill‘s (1997)
research indicated that in level of achievement and intelligence, only-children appear to have
an advantage over children with siblings and that their research on sociability and self-
esteem also revealed positive aspects about only children. Kuersten (2000) also found that
only children did not fit the stereotype of lonely social misfits, and in fact they surpassed
children with siblings both academically and socially. Moreover, a quantitative review
(Falbo and Polit, 1987) of the literature on the personality characteristics of only children
was conducted on 141 studies from16 different personality domains and it was found that
only children scored significantly better than other groups in achievement motivation and
personal adjustment. But it was also found that only children were not substantially different
from other children who were raised with siblings with respect to personality characteristics.
Overall, however, the review indicated that only children were comparable in most
respects to their non-only counterparts.
3.3. Research Results about Chinese Only-Children in China: Mixed Results

17
Mixed research results also existed with Chinese only-Children. For example, except for
differences in academics, some researchers found very few only-child effects in comparing
only children in China and other children with siblings either in China or in the United States
(e.g., Falbo and Poston, 1993; Poston and Falbo, 1990; Tsui, 2005). Furthermore, Falbo and
Poston (1993) and Poston and Falbo (1990) demonstrated in two studies that Chinese only
children outscored children with siblings in academics but showed no differences from other
children in personality outcomes. But Chen and others (1994) examined differences in social
and academic competence between Chinese 8- and 10-year olds with and without siblings.
Unlike previous studies, results indicated no significant differences between the only-child
subjects and those with siblings in the areas of social behavior, peer relationships, school-
related social competence, and academic achievement.
3.4. Summary
The mixture of research results may be caused by a variety of factors. For example, some
selected samples contain groups of only children who are advantaged (e.g., living in a
financially and affectionately happy family), while other selected samples contain groups of
only children who are disadvantaged (e.g., living in a divorced family or in a single parent
family). Besides siblings and birth order, more other factors should be considered as well.
However, despite the mixture of research results concerning only children, most of research
results indicate that the negative stereotypes of only children are not true in reality, that there
are few differences between only children and their peers with siblings, and that to some
degree, only children even have more strengths than non onlies. Therefore, it is of great
importance to know deeper about only children from a same or very similar baseline. In
other part of the world, only children may have some characteristics of being special in
comparison with their peers, but in China, being an only child is no special because his or
her peers mostly are also only children. In China, a similar baseline is being provided.

18
4. Family Environment
Generally, family environment is the first learning environment of a child after his birth.
There are two main research focuses on family environment: one is on the general family
environment closely connected with parents‘ indirect behaviors in the family (e.g., Woos et
al, 1981); the other is the specific family environment, such as parenting style or its relevant
components closely connected with parents‘ direct behaviors in the family.
4.1. Parenting Style
4.1.1. Diana Baumrind‘s Concept of Parenting Style
More than 40 years ago, Baumrind (1967, 1971) noted that preschool children reared by
parents with differing parenting attitudes, or styles, differed in their degrees of social
competence. According to Baumrind, the construct of parenting style is used to capture
normal variations in parents‘ attempts to control and socialize their children (Baumrind,
1991). Parenting style has two dimensions: parental responsiveness and parental
demandingness. Parental responsiveness (or parental warmth or supportiveness) refers to
―the extent to which parents intentionally foster individuality, self-regulation, and self-
assertion by being attuned, supportive, and acquiescent to children‘s special needs and
demands‖ (Baumrind, 1991, p.62). Parental demandingness (or behavioral control) refers to
―the claims parents make on children to become integrated into the family whole, by their
maturity demands, supervision, disciplinary efforts and willingness to confront the child who
disobeys‖ (Baumrind, 1991, p. 61-62). According to whether parents are high or low on
parental demandingness and responsiveness, a typology of four parenting styles is created:
permissive, authoritarian, authoritative, and uninvolved parenting styles. Permissive parents
are more responsive than they are demanding. They are non-traditional and lenient, do not
require mature behavior, allow considerable self-regulation, and avoid confrontation
(Baumrind, 1991, p. 62). Authoritarian parents are highly demanding and directive, but not

19
responsive. They are obedience- and status-oriented, and expect their orders to be obeyed
without explanation (Baumrind, 1991, p. 62). These parents provide well-ordered and
structured environments with clearly stated rules. Authoritative parents are both demanding
and responsive. They monitor and impact clear standards for their children‘s conduct. They
are assertive, but not intrusive and restrictive. Their disciplinary methods are supportive,
rather than punitive. They want their children to be assertive as well as socially responsible,
and self-regulated as well as cooperative (Baumrind, 1991, p. 62). Uninvolved parents are
low in both responsiveness and demandingness. In extreme cases, this parenting style might
encompass both rejecting-neglecting and neglectful parents, although most parents of this
type fall within the normal range. It is further warned that, because parenting style is a
typology, rather than a linear combination of responsiveness and demandingness, each
parenting style is more than and different from the sum of its parts (Baumrind, 1991).
And later, Baumrind‘s theory met challenges in other ethnic groups, for example, in
Chinese group, regarding the positive association of authoritative parenting style with
children‘s positive outcomes, such as academic performance. And even she was asked to
express her attitude to the punitive disciplinary parental practices at several conferences
because such parental practices have been found to be effectual. She (Baumrind, 1996)
clearly expressed that the prudent use of punishment within the context of a responsive,
supportive parent-child relationship is a necessary tool in the disciplinary encounter with
young children. The short- and long-term effects on child outcomes of any disciplinary
practice within the normative range are moderated by cultural and childrearing contexts.
Therefore, developmental and cultural factors must be taken into account for rational debate
to occur concerning desirable child outcomes and consequent childrearing objectives. And
the general conclusion is reached that it is not the specific disciplinary practice but how it is
administered and in what cultural context that determine its efficacy and long-term effects.

20
4.1.2. Third Dimension of Parenting Style
In addition to differing on responsiveness and demandingness, the parenting styles also
differ in the extent to which they are characterized by a third dimension: psychological
control. Psychological control refers to control attempts that intrude into the psychological
and emotional development of the child (Barber, 1996, p. 3296) through using parenting
practices such as guilt induction, withdrawal of love, or shaming. One key difference
between authoritarian and authoritative parenting is in the dimension of psychological
control. Both authoritarian and authoritative parents place high demands on their children
and expect their children to behave appropriately and obey parental rules. Authoritarian
parents, however, also expect their children to accept their judgments, values, and goals
without questioning. In contrast, authoritative parents are more open to give and take with
their children and make greater use of explanations. Thus, although authoritative and
authoritarian parents are equally high in behavioral control, authoritative parents tend to be
low in psychological control, while authoritarian parents tend to be high (Darling, 1999).
4.1.3. Research Results about Parenting Style
Parenting Style and Preschool and Preadolescence Children
Baumrind‘s typological parenting style theory (1971) implied that parenting style had a
major impact on the degree of social competence achieved as well as on the behavioral
adjustment of preschool children (Baumrind, 1991) and preadolescence children. In the
domain of emotion socialization, Chan, Bowes and Wyver (2009) found that Hong Kong
Chinese mothers of 6- to 8-year-old children adopted an authoritative style most often and an
authoritarian style least often, that they valued both relational and individualistic emotional
competence of their children as parental goals but regarded the former as more important
than the latter, and that parental goals mediated the influences of parenting styles on parental
practices. That is, parenting styles played an overarching role in emotion socialization,

21
influencing both parental practices and goals. With a sample consisted of 112 children (6-11
years of age) and both their parents, Dekovic and Janssens (1992) examined relationships
between parents‘ child-rearing style, the child‘s prosocial behavior, and the child‘s
sociometric status. Factor analyses of parental behavior revealed that 2 factors,
Authoritative/Democratic and Authoritarian/Restrictive, can be found in the subsamples of
mothers and fathers. These 2 dimensions of maternal and paternal behavior appeared to be
predictive of both the child‘s prosocial behavior and sociometric status. Another study
reached similar results: to test the theory that preschool children, reared by parents with
differing parenting attitudes or styles, would differ in their degrees of social competence, a
two-year study was conducted by Slicker and Kim (1996). Adding to Baumrind‘s research
result about impacts of parenting style on preschoolers, Paulussen-Hoogeboom et al. (2008)
examined whether the relations between children‘s negative emotionality and problematic
behavior (internalizing and externalizing) were partially mediated by parenting style
(authoritative and authoritarian) in a community sample of 196 3-year-old children and their
mothers. Maternal perception of child negative emotionality and problematic child behavior
was assessed. Their results showed that the relations between child negative emotionality
and internalizing and externalizing behaviors were partially mediated by mothers‘
authoritative parenting style.
Parenting styles played an important role in students‘ self-regulated learning as well. In a
study by Huang and Prochner (2004), the relationship between Chinese parenting style and
children's involvement in self-regulated learning was examined with a sample of 177 grade 4
students and their parents. It was found that authoritative parenting style was significantly
and positively related to students' self-regulated learning, whereas authoritarian parenting
style was significantly and negatively related to students' self-regulated learning.
Parentig Style and Early Adolescents

22
However, most researchers concentrated on adolescents when considering the association
between parenting style and academic, psychological and behavioral outcomes. In school
achievement and attendance, Steinberg & Elmen‘s (1986) results revealed that adolescents
from authoritative households (as opposed to either authoritarian or permissive households)
performed better in school than their peers, even after controlling for social class and
achievement test scores. School grades and attendance records examined one year after the
study suggest that authoritative parenting actually promotes school success among high
school students.
For early adolescents, parenting style, especially maternal concern could act as a predictor of
life satisfaction, social competence. In short-term longitudinal study, the relations among
maternal parenting style, academic competence, and life satisfaction in Chinese early
adolescents in Hong Kong was examined by Leung and McBride-Chang, and Lai (2004).
Results indicated that adolescents‘ perceived maternal concerns and academic competences
significantly predicted life satisfaction over time, whereas perceived maternal restrictiveness
did not. In another study, Rubin et al. (2004) examined parental support, best friendship
quality and psychological functioning in early adolescence and found that perceived parental
support and friendship quality predicted higher global self-worth and social competence and
less internalizing problems, that perceived parental support predicted fewer externalizing
problems, and that paternal (not maternal) support predicted lower rejection and
victimization.
Furthermore, Smith et al. (2008) explored the socialization of adolescents‘ processing of
identity-relevant information by examining perceived parenting dimensions and identity
styles in a sample of middle and late adolescents. Results indicated that an information-
oriented style was positively predicted by parental support; contrary to expectations,
however, an information-oriented style was also positively predicted by psychological

23
control; a normative identity style was positively predicted by support and behavioral
control; in line with expectations, a diffuse-avoidant identity style was positively predicted
by psychological control and negatively by maternal (but not paternal) behavioral control.
Research also found that parenting style has impacts on motivational constructs, such as
academic goal orientation, self-efficacy, autonomy in learning and self-esteem. For example,
Hoang (2007) found that parenting style was related to adolescents‘ academic goal
orientation in maths and autonomy in regulating academic behavior. Specifically, firstly,
authoritative parenting served as the strongest individual predictor of mastery orientation and
permissive parenting also accounted for a significant portion of the variance in adopting a
mastery orientation; secondly, parental behavioral involvement served as the strongest
individual predictor of a performance approach orientation, while permissive parenting and
authoritarian parenting also accounted for significant portions of the variance in adopting a
performance approach orientation; thirdly, parental behavioral involvement served as the
strongest individual predictor of a performance avoidance orientation. But interestingly, the
analyses indicated no significant relation between behavioral involvement and the adoption
of a mastery orientation. Meanwhile, authoritative parenting was found to serve as the
strongest individual predictor of a higher level of autonomy. Reporting a more democratic
parent was predictive of student‘s reporting feeling more autonomous in regulating their
academic behaviors. Another study (Chan and Chan, 2007) examined goal orientations,
perceived parenting styles, and their relationships in a sample of Hong Kong teacher
education students. It was found that their most influential parents to be authoritative and
that perceived parenting styles predicted goal orientations: authoritativeness was
significantly and positively related to learning goals, whereas authoritativeness and
authoritarianism were significantly and positively related to performance goals. In study of
parenting effects on self efficacy and self esteem in late adolescence and how those factors

24
impact adjustment to college, Smith (2007) firstly assessed 203 high school seniors‘ self-
efficacy, self-esteem, and their parents parenting styles approximately three months before
starting college and two weeks after starting college he investigated the students‘
homesickness and adjustment to college. It was found that authoritarian parents had children
with lower self-esteem and self-efficacy, while authoritative parents had children with
higher self-esteem and self-efficacy and that students higher in self-esteem and self-
efficacy experienced less homesickness and showed better emotional and behavioral
adjustment to college. Moreover, Edward and Price (2002) examined the relationship
between perceived parenting style and hope in college students and the results revealed that
authoritative parenting, with its high but balanced levels of nurturance, communication,
control and maturity demands, appeared to consistently be related to positive outcome in
children as well as adolescents.
Significant differences in behavioral adjustment were also been found in early and middle
adolescents reared by parents using the four ―classic‖ parenting styles (Durbin et al., 1993;
Lamborn et al., 1991; Steinberg et al., 1993; Steinberg et al., 1992; Steinberg et al., 1991;
Steinberg et al., 1994 ).
Parenting Style and Older Adolescents and Young Adults
Later the age range in parenting style research was further enlarged to older adolescents
and young adults (Slicker, 1996; Slicker and Kim, 1996). With older adolescents and young
adults, research results persisted in the relations between parenting style and behavior
outcomes. For example, Slicker (1996) investigated graduating high school seniors (HS) and
university freshmen (UF) and searched for relations between their levels of participation in
problem and conventional behaviors and the three parenting dimensions: acceptance,
behavioral control, and democracy (or psychological control). It was found that the
―democracy‖ dimension was not needed to effectively define authoritative parenting after the

25
other two dimensions were considered. Results indicated that parenting style was
significantly related to older adolescent behavioral outcome in problem and conventional
behaviors in the HS sample (ρ<.0001) and in the UF sample (ρ<.05), and that previously
established advantages and disadvantages of the four classic parenting styles persisted even
when they were extended into older adolescents, and that the influence of parenting style
appears to wane with increasing age of older adolescents, especially after a semester of
college. Furthermore, Slicker and Kim (1996) studied the longitudinal relationship of
parenting style and family type to older adolescent (higher school seniors and university
freshmen) problem behaviors in the middle South of USA and the significant results at ―Year
1‖ indicated that, in regard to a variety of problem behavior outcome, authoritative parenting
was superior to permissive and neglectful parenting, and that ―balanced‖ and ―moderately
balanced‖ family types were superior to ―mid-range‖ and ―extreme‖ family types. In ―Year
2‖ (N = 261), significant differences among parenting styles and family types persisted.
Turner, Chandler and Heffer‘s (2009) study indicated that authoritative maternal parenting
continued to influence the academic performance of college students.
There were other aspects of behavioral and psychological outcomes that were reported in
the literature as associated with parenting style, including those in social competence
(Baumrind, 1991; Lamborn et all., 1991; Steinberg, 1990), academic achievement
(Dornbusch et al., 1987; Lamborn et al., 1991; Steinberg et al., 1991; Steinberg et al., 1989),
self-reliance (Steinberg et al., 1991), psychological distress and delinquency (Lamborn et al.,
1991; Steinberg et al., 1991), substance use (Baumrind, 1991), adolescent drinking and
delinquency (Barnes and Farrell, 1992), and peer group selection (Brown et al., 1993) etc.
Impact of Mother-Father Differences in Parenting Style
Very interesting research results were found by Simons & Conger (2007) by linking
mother-father differences in parenting style and adolescent outcomes.Using longitudinal data

26
from a sample of 451 families with a child in eighth grade at the time of study, they found
that regardless of reporter, the most common family parenting styles were those in which
both parents display the same style of parenting, that having two authoritative parents was
associated with the most positive outcomes for adolescents, and that in the absence of this
optimal family parenting style, there was evidence that having one authoritative parent
could, in most cases, buffered a child from the deleterious consequences associated with less
optimal styles of parenting.
Developmental Results of Parenting Style
Adolescence is a critical period of development. In their research review, Cripps and
Zyromski (2009) found that parenting style greatly influenced children‘s development as
well. The authoritative/democratic parenting style influences middle school children, leading
to positive developmental outcomes, positive adolescent self-evaluations, higher levels of
adolescent self-esteem and adjustment, while also positively influencing levels of intrinsic
motivation for learning. In a recent longitudinal study by Williams et al. (2009) examined the
impact of behavioral inhibition and parenting style on internalizing and externalizing
problems from early childhood through adolescence by investigating a sample of 113
children from childhood till adolescence. And results revealed that internalizing problems at
age 4 were greatest among behaviorally inhibited children who also were exposed to
permissive parenting. Furthermore, greater authoritative parenting was associated with less
of an increase in internalizing behavior problems over time and greater authoritarian
parenting was associated with a steeper decline in externalizing problems.
Consequences of Parenting Style
In reviewing the literature on parenting style, it seems there is a lasting consistency with
the benefits of authoritative parenting style regardless of the age range or normal or
abnormal children. Parenting style has been found to predict child well-being in the domains

27
of social competence, academic performance, psychosocial development, and problem
behavior etc. Research consistently found that children and adolescents having authoritative
parents were more socially and instrumentally competent than those whose parents are
nonauthoritative (Baumrind, 1991; Weiss & Schwarz, 1996; Miller et al., 1993); that, in
contract, children and adolescents having uninvolved parents, perform most poorly in all
domains; that, in general, parental responsiveness predicts social competence and
psychosocial functioning, while parental demandingness is associated with instrumental
competence and behavioral control (i.e., academic performance and deviance); that children
and adolescents having authoritarian parents tend to perform moderately well in school and
be uninvolved in problem behavior, but they have poorer social skills, lower self-esteem,
self-efficacy and higher levels of depression; and that children and adolescents having
permissive parents are more likely to be involved in problem behavior and perform less well
in school, but they have higher self-esteem, better social skills, and lower levels of
depression.
Influence of Gender, Ethnicity, or Family Type
As was realized by Darling (1999), it was important to distinguish between differences in
the distribution and the correlates of parenting style in different subpopulations. Although
authoritative parenting is most common among intact, middle-class families of European
descent, the relationship between authoritativeness and child outcomes is quite similar across
groups in this subpopulation. There are some exceptions for some subgroups. For example,
first, in terms of gender differences, Weiss and Schwarz (1996) found that demandingness
seemed not to be so critical to girls than to boys‘ outcomes. Another example of gender
effect is the cross-sex parenting effect, in investigating senior high school students. Richards
et al (1991) found that boys and girls who perceived their cross-sex parent to be warm and
supportive were found to have higher self-esteem. Rubin et al. (2004) also found that having

28
a supportive mother protected boys from the effects of low-quality friendships on their
perceived social competence, and that high friendship quality buffered the effects of low
maternal support on girls' internalizing difficulties. In the study of Chan and Chan (2005), it
was found that the positive relationship between authoritarian parenting style and
performance orientation was significant in male but not in female students. On the contrary,
the positive relationship between authoritative parenting and learning goal was significant
only in female but not in male students.
Secondly, authoritative parenting predicts psychosocial outcomes and problem behaviors
for adolescents in all ethnic groups studied (African-, Asian-, European-, and Hispanic
Americans), but it is associated with academic performance only among European
Americans (Steinberg, Dornbusch, & Brown, 1992; Steinberg, Darling, & Fletcher, 1995).
For instance, Chao (1994) and others (Darling & Steinberg, 1993) have argued that observed
ethnic differences in the association of parenting style with child outcomes may be due to
differences in social context, parenting practices, or the cultural meaning of specific
dimensions of parenting style. And Baumrind (1996) herself also admitted that the
association of parenting style with child outcomes was based on developmental and cultural
factors.
Research Results about Asian-American and Chinese Parenting Style Effects
Researchers reached mixed results about Asian-American parenting style effects. In a
study by Dornbusch, Ritter, Leiderman, Roberts, and Fraleigh (1987), although authoritative
parenting style was consistently and positively related to the school grades of European
American students, this style was unrelated to the school grades of Asian Americans.
Another study by Steinberg, Lamborn, Dornbusch, and Darling (1992) found that for both
European Americans and Asian Americans, authoritative parenting had positive effects on
adolescent‘s school performance. Steinberg, Lamborn, Darling, Mounts, and Dornbusch

29
(1994) tested whether there were ethnic group differences in the effects of parenting style by
estimating interaction terms for ethnicity and parenting style. They noted that authoritative
parenting was relatively more advantageous for European American youth than it was for
Asian American youth, whereas authoritarian parenting was relatively more advantageous
for Asian American youth. But these mixed parenting style effects are reached from the
comparison of European Americans with Asian-American parenting style effect. How about
the effects of Chinese parenting effects on Chinese students then?
Studies of Chinese families in Hong Kong and Mainland China also found different results
about the effects of Chinese parenting style on school performance. Using Dornbusch et al.‘s
(1987) measures of parenting style, Leung, Lau, and Lam (1998) investigated Hong Kong
Chinese high school students, European American and Australian high school students.
Results revealed that the authoritative style was unrelated to the grades of Hong Kong
Chinese, but positively related to the grades of European Americans and Australians, and
that authoritarian parenting was positively related to the grades of Hong Kong Chinese. In
another study of Hong Kong Chinese, McBride-Chang and Chang (1998) found that, on base
of parent self-report, both the authoritative and authoritarian styles were unrelated to
adolescents‘ achievement test scores. In contrast, Chen, Dong, and Zhou (1997), examined
Chinese families in Beijing and found that the authoritative style was positively related to
children‘s school achievement, whereas the authoritarian style was negatively related to
school achievement. As Chao (2001) inferred the possible reasons for Chen, Dong, and
Zhou‘s differing results, in their study, much younger children (i.e., second graders) than the
studies cited above were involved; additionally, there might be important differences in
parenting between Chinese parents from Hong Kong and those from Mainland China.
Therefore, it would be meaningful to examine further the associations between parenting
style and adolescents‘ outcomes in Mainland China with adolescents.

30
Explanations for Mixed Parenting Style Effects on Chinese Students
Chao (1993 and 1994) suggested the different effects of Chinese-American and Chinese
parenting effects may be due to the culture. He argued that the idea of ―training‖ in Chinese
families may contribute to the differences.
Furthermore, Darling and Steinberg (1993) considered parenting style as the emotional
climate between parents and children. Based on this idea, Chao (2001) suggested further that
parenting style might influence adolescent outcomes through its effect on the parent–
adolescent relationship. Therefore, we could take again a step further and suggest that: since
parenting style is realized through parenting practices, but same parenting practices have
different developmental and cultural meanings, thus, different specific family relations, such
as family cohesions, are fostered. Parenting style is thus defined as a global Relationship
construct that is explained by specific relationship qualities (Chao, 2001). This is probably
why same parenting styles have different effects on offspring outcomes in different cultures.
Chao (2001) examined the effects of parent–adolescent relationships on school performance
to provide a clearer understanding of why authoritative parenting does not have as beneficial
effects for Asian Americans as it does for European Americans. Positive effects of both
authoritative parenting and relationship closeness on school performance were found for
European Americans and, to some extent, second-generation Chinese, but not first-
generation Chinese. These effects were also stronger for European Americans than first-
generation Chinese. Through examination of the mediating role of parent–adolescent
relationships, this study also found that among European American families, the beneficial
effects of authoritative parenting are explained through relationship closeness. But what
would be the research results in Mainland China if similar research designs but with only
Chinese adolescents there then?
4.2. General Family Environment

31
4. 2.1. Definition of General Family Environment
Woos et al (1981) believed that family as a general learning environment could be
described and measured, and they designed the Family Environment Scale (FES) to measure
family environment, which composed of 10 subscales underlying three dimensions:
relationship, personal growth (or goal orientation), and system maintenance dimensions. The
Relationship Dimension assesses the degree to which the family members are perceived to
be involved with each other and how openly positive and negative feelings are expressed.
The Relationship Dimension consists of 3 subscales: Cohesion (degree of perceived
commitment, support, and help family members provide for each other), Expressiveness
(degree to which family members are encouraged to express feelings and problems), and
Conflict (amount of openly expressed anger, aggression, and conflict among family
members). The Personal Growth Dimension reflects the family-of-origin‘s goal orientation
or ways the family-of-origin encourages or inhibits an individual‘s personal growth. The
Personal Growth Dimension is made up of the following 5 scales: Independence (extent to
which family members are assertive, make own decisions, and self-sufficient); Achievement
Orientation (extent to which school and work activities are cast as indices of achievement or
areas of competition); Intellectual–Cultural Orientation (degree to which family members
showed interest in political, social, intellectual, and cultural activities); Active–Recreational
Orientation (extent to which family members emphasized participation in social and
recreational activities); and Moral–Religious Emphasis (extent to which family members
emphasized ethical and religious issues and values). Finally, the System Maintenance
Dimensions reflect the degree to which the family emphasizes clear organization, control,
structure, rules, and procedures in running family life. The System Maintenance Dimensions
consists of two subscales: Organization (extent to which the family endorses clear
organization and structure in planning family activities and responsibilities) and Control

32
(extent to which rules and procedures are followed and enforced by family members). The
Relationship and System Maintenance Dimensions reflect more perceived internal family
functioning, whereas the personal growth (or goal orientation) dimension reflects the link
between the family and society.
4. 2.2. Impacts of General Family Relations (cohesion, conflict and expressiveness)
Impact of Family Relations on Career Development
First of all, general family environment has great impact on career development, such as
career goals, career identity, career interest etc. Family relationship, especially
expressiveness, was found to be related to vocational variables. Along with previous
research (Blustein et al., 1991; Kenny, 1990; Kinnier et al., 1990; Lopez, 1989; Penick &
Jepsen, 1992), the results of Johnson, Buboltz, and Nichols‘ study (1999) provided support
to the theoretical contention that family environment plays a role in the career development
process. Specifically, results indicate that each family relationship variable (i.e., conflict,
cohesion, and expressiveness) is related to vocational identity for college students. Although
accounting for only about 3% of the variance, expressiveness appears to be the family
relationship variable most predictive of vocational identity for college students. This finding
supports previous research which indicates that expressiveness is the family relationship
variable with the strongest effect on developmental task attainment for college students
(Johnson & McNeil, 1998; Johnson & Nelson, 1998) and suggests that college-age children
who grew up in families that encouraged direct and open communication between members
may more easily develop a relatively clear and stable picture of their vocational goals and
interests.
Ethnic Differences in the Impact of Family Relations
Ethnic differences were also found in the impact of family environment. With the purpose
to explore the ethnic differences in family dynamics and career interests of European

33
Americans and Chinese Americans and how these dynamics--cohesion, expressiveness, and
conflict--influence one's career interests, Leong, Kao and Lee (2004) found significant ethnic
differences in career interests. The Chinese Americans' highest career interest was
enterprising, whereas the highest for European Americans was social. Ethnic differences in
family dynamics were also found, though opposite from hypothesized; Chinese Americans
reported more family conflict, less cohesion, and less expressiveness than the European
Americans.
Developmental Features of Family Relations Impact
The impact of family environment was found to be developmental. Based on a
developmental contextual perspective advocated by Vondracek, Lerner, and Schulenberg
(1986), Whiston & Keller (2004) provided a comprehensive review of the research published
since 1980 related to family of origin influences on career development and occupational
choice. Influential family contextual factors are identified within four developmental levels
(i.e., children, adolescents, college students/young adults, and adults):
(a)The initial influence of parents includes both their occupations and their occupational
expectations for their children. There is also some indication that children whose mothers are
employed are likely to consider a greater number of occupations, including nontraditional
occupations, than children whose mothers are not employed. Additionally, there is some
evidence that children from non-two-parent homes are more likely to have limited
occupational aspirations than children in two-parent homes.
(b) This review indicated that higher occupational expectations were associated with a
family environment that is supportive and where parents have high expectations for the
adolescents. Family support and parental expectations also influence females‘ career
orientation. Parental support for a certain occupational area or career direction (e.g., entering
the military) seems to have an influence, particularly on older adolescents‘ interests and

34
preliminary career direction. The mother-daughter relationship may be significant in
adolescent girls‘ developing a career orientation and may play a pertinent role in their feeling
about career decision-making. Parental expectations during adolescence also seem to have an
influence on later occupational attainment.
(c) Through review of 32 studies about college students, it was concluded that the family
of origin influences college students‘ career development and maturity, occupational
exploration, vocational identity, assessment of career-related abilities, career commitment or
decidedness, and occupational selection. On the other hand, this review tended to indicate
that families had a less direct influence on college students‘ career decision-making self-
efficacy and career indecision. Although these trends were somewhat tentative, the family
variables that seem most influential were family attitudinal and relational factors. Regarding
family dynamic variables, attachment, emotional support, autonomy support,
encouragement, and boundaries seemed to be more important than other dynamic variables
such as psychological separation. For example, college students‘ career development seemed
to be enhanced by parental emotional support, autonomy support, encouragement, and
warmth. Students who had higher levels of career commitment tended to have higher levels
of parental attachment and fewer conflicts with their families. Furthermore, the influence of
family variables on various career constructs varied depending on the gender of college
students or young adults and the gender of the parent. For example, in terms of vocational
exploration, maternal attachment seemed to have more influence than paternal variables. On
the other hand, paternal relationship variables seemed to be more influential in terms of
females entering a nontraditional career field. This review also indicated that both family
demographic and family dynamic variables influence adults‘ career development.
Interaction Effect among Family Structure Variables and Family Process Variables
Moreover, in the above-mentioned review and in my review of literature, it was found that

35
several studies indicated career outcomes were influenced by an interaction among family
structure variables and family process variables. For example, Hargrove, Creagh, and
Burgess‘ study (2002) explored the family interaction patterns as predictors of vocational
identity and career decision-making self-efficacy of college students. Achievement
orientation in the family was found to be a significant predictor of career identity and a
number of family variables including achievement, intellectual-cultural and moral-religious
emphasis orientations and degree of family conflict and expressiveness were found to be
predictors of career decision-making self-efficacy. Therefore, their findings suggested that
family-of-origin interaction patterns may play small, yet significant roles in the formulation
of clear and stable career goals and the promotion of self-confidence in regard to completing
career planning activities (Hargrove, Inman and Crane, 2005).
Impact of Family Cohesion on Physical and Psychological Well-Being, and Social
Competence
Family cohesion influences physical and psychological well-being. Greenberger, Ellen, &
Chen, Chuansheng (1996) examined perceived parent-adolescent relationships and depressed
mood among early adolescents and college students, all of them being European or Asian
American background. Ethnic differences in depressed mood, not evident in the early
adolescent sample, emerged in the college sample, with Asian Americans reporting more
symptoms. Ethnic differences in depressed mood were reduced to nonsignificance when
quality of parent-adolescent relationships was statistically controlled. And perceived parent-
adolescent relationships accounted for more of the variance in depressed mood in early
adolescence than in late adolescence: 44% to 51% for the junior high samples and about
10% for the college samples. Manzi et al (2006) also found that Family cohesion was
associated with better psychological well-being of adolescents from UK and Italy. It was
found by Behnke et al (2008) that family cohesion strongly mediated most of the relations

36
between stress and parenting behaviors. Important ethnic and gender differences were
evident. In contrast with other groups, Mexican American fathers reported higher levels of
family cohesion when faced with economic pressures. Family cohesion and parental
monitoring exerted even a protective-stabilizing effect on number of illicit drugs used and on
problems with drugs and alcohol (Kliewer et al, 2006). In examining the influence of family
cohesion and adaptability on college students‘ trauma symptoms and psychological well-
being, Uruk et al‘s (2007) study revealed that the family adaptability and cohesion has a
significant unique variance in explaining both trauma symptoms and psychological well-
being. In order to test a model of suicidal ideation with family cohesion, expressiveness,
conflicts, teacher support, teacher-student relationships and peer support as antecedents, and
self-esteem and depression as mediators, Sun and Hui (2006) investigated 433 Hong Kong
Chinese adolescents and found that only family cohesion, conflicts, teacher support and peer
support significantly predicted self-esteem and depression, with depression being a strong
mediator of suicidal ideation. In a second study by Sun and Hui (2007), with the purpose to
investigate the family, school, peer and psychological factors that contribute to adolescent
suicidal ideation with a sample of Hong Kong Chinese adolescents who were divided into
younger (12.3 years, n = 694) and older (15.4 years, n = 664) age groups, the results showed
that family cohesion and sense of school belonging were the core predictors of self-esteem
and depression, and that depression was a strong mediator of suicidal ideation. In the
prediction of suicidal ideation, peer support was significant among girls and younger
adolescents only, whereas peer conflict was significant among older adolescents only.
Family conflict, teacher support and academic pressure did not show any significant
contribution in the prediction. Johnson et al (2001) examined relationship of family cohesion
and interparental conflict with loneliness in late adolescents and found that feelings of
loneliness were related to perceived levels of interparental conflict for males and females,

37
and to decreased family cohesion for females. Feelings of social anxiety and social
avoidance were related to feelings of loneliness. In a longitudinal study (Frank, 2000) of
adolescent health, it was found that adolescent involvement in four types of violent
behaviors was related to race/ethnicity, gender, and family structure. Family cohesion was a
protective factor against all types of violence. Wentzel and Feldman (1996) also found that
the cohesive nature of family relationships affected adjustment more consistently for girls
than boys, whereas family power structures more consistently affected boys' adjustment than
girls'.
Impact of Family Cohesion on Academic Outcomes, Creativity and Leadership
Family cohesion was proved to have impact on academic outcomes, such as school
engagement, GPA, adjustment to college etc. In the study of Annunziata et al (2006), results
showed that both family cohesion and parental monitoring predicted school engagement of
at-risk, inner-city adolescents, but neither family characteristic predicted their GPA.
Important gender differences also emerged. For boys only, the relation between family
cohesion and school engagement was stronger when parental monitoring was high. For girls
only, the effects of cohesion and monitoring on school engagement were additive: girls with
both high family cohesion and high parental monitoring were most likely to be engaged in
school. Lagana (2004) also wanted to determine what factors predicted school dropout, with
particular attention given to family and social support variables. School dropout was
measured by proxy, using group membership as an indirect indicator of risk and the results
indicated that family cohesion, adult support, and peer support were predictors of group
membership. In another investigation of the influence of self-concept and perceived family
environment on psychosocial adjustment among 180 early-entrance college students (ages
range from 14 and 17 years old) by Caplan et al (2002), family cohesion, conflict, and
expressiveness and overall self-concept were found to be predictive of adjustment to college

38
and family cohesion, organization, control, conflict, and overall self-concept were found to
predict first semester grade-point average.
Family cohesion has impact not only on academic outcomes, but also on creativity and
leadership. In Chan‘s (2005) study of family environment and talent development of Chinese
gifted students in Hong Kong, it provided opportunities to challenge a number of conjectures
regarding the relationships between family environmental variables and perceived talents in
academic skills, creativity, and leadership. Accordingly, it was assumed that family cohesion
and parental expectations to achieve academically would favor academic achievement, but
would impede creativity. In contrast, it was assumed that parental encouragement for
independence was connected to the development of creativity. Further, it was assumed that
leadership would be enhanced by parental expectations to achieve and parental
encouragement for independence, as well as by family cohesion. However, the findings did
not fully support these conjectures. Rather, family cohesion and parental expectations to
achieve emerged as significant predictors of perceived academic skills, creativity, and
leadership. Thus, gifted students who perceived their family as more cohesive and their
parents as having high expectations of them also perceived themselves as having more
talents in academic skills, creativity, and leadership.
In the present study, among the three family relation variables, only family cohesion is
considered because in Chinese culture, family expressiveness is traditionally not encouraged
in a family, and family conflict as a negative aspect of family relations normally is deemed
not to be reported.

39
5. Peer Relations: Peer Group Acceptance and Best Friendship Quality
Ladd (1999) did a review of peer relations research and concluded that major periods of
empirical activity and accomplishment in research on peer relations could be divided into
three generations. Each generation had investigative agendas that were dominant or
ascendant during these periods.
5.1. First Generation (from late 1920s till World War II)
5.1.1. Investigative Agenda of First Generation: studying the nature of peer groups and the
association between children‘s characteristics and their positions in peer groups
The first generation of children‘s peer relations emerged in the late 1920s when social
scientists began to study the nature of children‘s peer groups and the association between
children‘s characteristics and their positions in peer groups. Investigations, based on
methodologies, such as observation, sociometry and experimental interventions, addressed to
these topics continued until the outbreak of World War II, after which they fell dormant for
more than a decade (see Renshaw, 1981).
5.1.2. Research Review in First Generation
As Renshaw (1981, p. 1-2) reviewed: The extent of the contribution of the 1930s to
current research on peer interaction and friendship can be appreciated by noting the classic
theoretical works published during that decade. Moreno launched the field of sociometry by
publishing Who Shall Survive in 1934. Sherif initiated a lifetime investigation of groups
with the publication of The Psychology of Social Norms in 1936. Lewin‘s writings on field
theory (Lewin, 1931) and group climates (Lewin, Lippitt, & White, 1939) established the
experimental method as an indispensable tool for studying group phenomena. Piaget (1926,
1932) demonstrated the importance of studying the social cognitive development of children,
and Murphy showed that even young children acted altruistically toward each other

40
(Murphy, 1937).
Renshaw also noted that all these above-mentioned classic studies, however, are only part
of the large body of peer research that was conducted and reported during the era. Other
studies, such as studies by Parten (1932) on children‘s play, by Koch (1933) on popularity,
by Isaacs (1933) on children‘s social development, by Buhler (1930), Bridges (1933),
Shirley(1933), and Maudry and Nekula (1939) on social interaction of children below the
age of 2, are also noteworthy examples of peer relations studies in this era.
5.2. Second Generation (from1970s and 1980s)
5.2.1. Investigative Agenda: Likely Causes of Peer Rejection and Peer Acceptance, Types
and Functions of Peer Relations
The second generation of research on children‘s peer relations was triggered by a series of
discoveries that emerged during the late 1960s and early 1970s. Harlow and colleagues
(1969) found that young rhesus monkeys that were reared by their mothers but deprived of
peer contact failed to develop essential social skills and traversed abnormal developmental
trajectories. However, these investigators also showed that play with younger peers could
compensate for some of the deficits that were attributable to maternal deprivation (see also
Freud & Dann, 1951). Together, the evidence suggested that peers played an essential role in
the socialization of interpersonal competence and that skills acquired in this manner affected
the individual‘s long-term adjustment. This premise was further strengthened by findings
from a series of longitudinal studies (e.g. Cowen et al, 1973, Roff & Sells, 1967). All these
findings and their implications shaped the agendas of the second generation of researchers
(from1970s and 1980s). Through correlations, researchers found support for the conclusion
that whereas antisocial and disruptive behaviors were likely causes of poor peer relations
(e.g. peer rejection), prosocial behaviors led to positive outcomes, such as peer acceptance
(see review by Coie et al 1990). Researchers also found the behavioral antecedents of

41
children‘s friendships: conversational) skills (see Gottman 1983).
5.2.2. Reasons for Social Skills and Skill Deficits
But why some children exhibited social skills in their interactions with peers and other
children manifested skill deficits. Some researchers found reasons from interpersonal
cognitions, such as goals, strategies, outcome expectations, and peer attributions, and/or
from intrapersonal cognitions, such as self-perceptions, perceived competence, and self-
efficacy (Dodge 1986, Ladd & Mize 1983), while other researchers found reasons from early
socialization contexts, such as the family — direct family influences (e.g. parents‘ attempts
to influence children‘s peer relations) and/or indirect family influences (i.e. family processes
with no direct bearing on children‘s peer relations, such as parenting, attachment, or child
abuse) (Parke & Ladd 1992). Results indicated that children with high versus low peer
acceptance tended to construct different types of goals and strategies for peer interactions
(Dodge & Feldman 1990, Ladd & Crick 1989).
5.2.3. Friendship and Peer Acceptance
Researchers in this era began to differentiate the types and functions of peer relations:
friendship and peer acceptance (Berndt & Ladd 1989). In general, friendship was defined as
a voluntary, dyadic form of relationship that often embodied a positive affective tie, whereas
peer acceptance was defined as a child‘s relational status in a peer group, as indicated by the
degree to which they were liked or disliked by group members (see Bukowski & Hoza
1989). Friendship and peer acceptance may offer provisions such as support, intimacy and
companionship etc. (Bukowski & Hoza, 1989; Furman & Robbins 1985).
5.2.4. Impact of Peer Relations on Children‘s Development
By the end of 1980s, researchers began to examine the contributions of peer relationships
on children‘s development. As Berndt & Ladd (1989) concluded that little evidence had
accumulated that could confirm or deny the existence of the functions of peer relationships

42
in children‘s development. Anyway, it was found that children adapted better when in the
presence of friends or familiar peers (see Ladd & Kochenderfer 1996) and that both the
quantity of a child‘s friendships and the quality of those relationships (e.g. variations in
support and closeness) predicted changes in children‘s social perceptions, competence, and
adjustment (Bukowski & Hoza 1989, Ladd 1990).
5.3. Third Generation (1990s and beyond)
5.3.1. Investigative Agenda: Do distinct forms of peer relationships, and the provisions they
afford, differentially affect children‘s development and adjustment?
Further investigations and progress were made by the third generation (1990s and beyond)
researchers in addressing the question of whether distinct forms of peer relationships, and
the provisions they afford, differentially affect children‘s development and adjustment.
5.3.2. More about Contributions of Peer Relations
In addition to distinguishing among the forms and features of children‘s peer relationships,
researchers have acquired more information about the potential contributions of peer
relationships to children‘s adjustment and development. Longitudinal studies conducted in
the 1990s strengthened earlier evidence indicating that peer rejection was a relatively stable
characteristic that predicted both internalizing and externalizing problems as well as
absenteeism during the grade school years (e.g. DeRosier et al 1994; Hymel et al 1990a);
rejection also predicted grade retention and adjustment difficulties during the transition to
middle school (Coie et al 1992). The DeRosier et al findings also showed that the severity of
children‘s internalizing and externalizing problems varies as a function of the proximity and
chronicity of peer rejection. Research results linking peer rejection with loneliness in middle
childhood were replicated with younger samples (Cassidy & Asher 1992), and neglected
peer status was found to be a correlate of adaptive outcomes such as achievement motivation
(Wentzel & Asher 1995). Friendship and the quality of children‘s friendships were found to

43
be important predictors of children‘s emotional well-being (Parker & Asher 1993) and
adjustment trajectories during early and middle grade school (Ladd et al 1996). Considerable
attention was focused on the potential effects of peer victimization on children‘s adjustment,
and findings link abusive peer relations with a number of adjustment difficulties during
childhood, including anxiety, loneliness, depression, and school maladaptation (Boulton &
Underwood 1992, Kochenderfer & Ladd 1996).
5.3.3. Impacts of Friendship, Friendship or Best Friendship Quality and Quantity, and Peer
Acceptance
Initial efforts to investigate differential relationship contributions focused on friendship and
peer acceptance. Research results about adolescent showed that loneliness was more closely
linked with friendship than peer acceptance, and feelings of isolation were more closely tied
to peer acceptance than friendship (see Bukowski & Hoza 1989).
Friendship quality was also found to be very important for adolescents. Veronneau and
Vitaro (2007), after reviewing theoretical and empirical work conducted over the last few
decades on the relations between child and adolescent peer experiences and high school
graduation, concluded that peer acceptance is a correlate of high school graduation, and that
having numerous friends was not, in itself, a very efficient predictor of high school
graduation, because friends might have a positive or a negative influence on school
achievement, depending on their own characteristics, that is, friendship quality may
moderate both the positive and negative effects of friendship on academic adjustment.
Meanwhile, they recommended further research directions: first, all relevant variables (not
only peer experiences) should be systematically included in empirical studies in order to
control for confounding variables; second, the impact of the interplay between different peer
experiences should be investigated; third, variables such as age, chronicity of peer
experiences, and reciprocal effect between independent and dependent variables are also

44
necessary to maximize the validity of empirical research. As a good example, Nelson and
Debacker (2008) investigated associations among perceived peer relationships and
achievement motivation during science class with middle school and high school students.
Results indicated that perceived peer relationship variables explained variance in
achievement motivation. Adolescents who perceived being valued and respected by
classmates were more likely to report adaptive achievement motivation. Reports of adaptive
achievement motivation were also related to having a good quality friendship and a best
friend who values academics. Having a poor quality friendship and perceiving classmates to
be resistant to school norms were related to reports of maladaptive achievement motivation.
Another new cross-sectional study by Woods, Done, and Kalsi (2009) indicated that the
higher quality of friendship was associated with the reduced levels of loneliness in their
sample group.
Flanagan, Erath and Bierman‘s (2008) study examined the unique associations between
social anxiety and peer relations (including positive peer nominations, peer- and self-
reported peer victimization, and self-reported friendship quality) among adolescent students.
The results provided support for the unique contribution made by peer relations to social
anxiety. Research also found support for the role of peer relationships in adjustment to
college (Swenson, Nordstrom & Hiester, 2008) and their results suggested that a close
relationship with a high school friend was beneficial during the first weeks of college, but
later in the first semester there were more benefits to having a close relationship with a new
college friend. Cillessen et al (2005) also found that aggression was associated with self and
partner perceptions of friendship conflict and low positive friendship qualities and that
prosocial behavior was associated with self and partner perceptions of positive friendship
qualities and low conflict. Furthermore, Nelson and Teresa (2007) enlarged the contents of
peer relations as dependent variables and outcome variables of adolescents (middle school

45
and high school students). They assessed peer classroom climate, achievement-related
beliefs and values of a best friend, achievement goals, social goals, and self-efficacy. And
their regression analyses indicated multifaceted impact: (a) Peer class-climate and best friend
variables accounted for significant variance in mastery goals. Significant individual
predictors were grade level (negative), class belongingness (positive), and best friend‘s
academic valuing (positive).(b) Peer class-climate variables accounted for significant
variance in performance-approach goals. Classmates‘ resistance to school norms and
belongingness were significant positive predictors. (c) Peer class-climate variables accounted
for significant variance in performance-avoidance goals, with the only significant individual
predictor being classmates‘ resistance to school norms (positive). (d) Peer class-climate and
best friend variables accounted for significant variance in social intimacy goals. Class
belongingness and friendship quality were significant positive predictors. (e) Peer class-
climate and best friend variables accounted for significant variance in social approval goals.
Classmates‘ resistance to school norms and friendship quality was a unique positive
predictor. (f) Peer class-climate and best friend variables accounted for significant variance
in social responsibility goals. Significant positive predictors were class belongingness, best
friend‘s academic valuing, and friendship quality. (g) Peer class-climate variables accounted
for significant variance in self-efficacy. Grade level was a significant negative predictor and
class belongingness was a unique positive predictor. Adolescents who perceived being
valued and respected by classmates were more likely to report adaptive achievement
motivation. Reports of adaptive achievement motivation were also related to having a good
quality friendship and a best friend who values academics. Having a poor quality friendship
and perceiving classmates to be resistant to school norms were related to reports of
maladaptive achievement motivation.
Among grade school children, Parker and Asher (1993) found that many low-accepted

46
children had best friends and were satisfied with these friendships. However, these children‘s
friendships were lower than those of other children on most dimensions of quality, and that
friendship, friendship quality, and group acceptance made separate contributions to the
prediction of loneliness.
In peer relation research, best friends are seen as a source of interpersonal support as well
as a source of beliefs and values. Having a trusting, caring, and intimate relationship with a
best friend is associated with improved social and emotional adjustment (Buhrmester, 1990;
Parker & Asher, 1993), self-esteem (Keefe & Berndt, 1996; Mannarino, 1980), and
classroom behavior (Berndt & Keefe, 1995). Friends in high-quality relationships are more
likely to share similar beliefs and values than friends in lower quality relationships (Berndt,
Hawkins, & Jiao, 1999; Berndt, Laychak, & Park, 1990; Hallinan, 1983; Hallinan &
Williams, 1990). For example, Agnew (1991) reported that delinquency rates of adolescent
friends increased over time only in high-quality friendships. Likewise, Berndt et al. (1999)
found that behavior problems increased over the course of a school year when students
reported a higher quality relationship with a best friend who had behavioral problems.
Similarly, Vandell and Hembree (1994) found that mutual friendships and peer acceptance
uniquely and additively predicted social competence, self-esteem, and achievement in
elementary school children. In a developmental sense, one study ( National Institute of Child
Health and Human Development Early Child Care Research Network, 2008) investigated the
association of third graders‘ social competence with earlier peer experiences in childcare. The results
indicated that children who had more positive experiences with peers in childcare, had better
social and communicative skills with peers in third grade, were more sociable and co-
operative and less aggressive, had more close friends, and were more accepted and popular;
and that children with more frequent negative experiences with peers in childcare were more
aggressive in third grade, had lower social and communicative skills, and reported having

47
fewer friends. With a total of 238 fifth to eighth graders (boys = 109) participants, Waldrip,
Malcolm and Jensen-Campbell (2008) also examined the unique contributions of peer
acceptance, friendship, and victimization to adjustment and investigated how these relational
systems moderate the influence of one another to influence adjustment. Adolescents who had
lower levels of peer acceptance, number of friends, and friendship quality had greater
teacher-reported maladjustment. Moreover, friendship quality was an important buffer
against adjustment problems when peer acceptance and number of friends were low. In study
of Korean primary school children, Shin (2007) revealed that peer relationships, including
peer acceptance, the number of friends, and positive friendship quality, uniquely contributed
to loneliness. Peer relationships partially mediated between withdrawal and loneliness. Peer
acceptance and friendship quality fully mediated the link between academic functioning and
loneliness. Since childhood social anxiety consistently has been linked with low levels of
peer acceptance, Greco and Morris (2005) investigated factors influencing the link between
social anxiety and peer acceptance of grade school children. Their results revealed that, as
expected, childhood social anxiety was associated with low levels of peer acceptance, that
this relation was mediated in part by social skills difficulties, and that friendship quality (but
not quantity) moderated this process for girls. Interestingly, friendship quantity and positive
friendship quality did not serve a protective function for either boys or girls. In examining
the main and interactive effects of fifth-graders‘ relationships with parents and friends on
their psychosocial functioning, Rubin et al (2004) found that friendship quality predicted
higher global self-worth and social competence and less internalizing problems. Friendship
quality predicted lower rejection and victimization for only girls. High friendship quality
buffered the effects of low maternal support on girls' internalizing difficulties. In comparing
later elementary schoolers with learning disabilities and their typically achieving peers,
Estell et al (2009) conducted a two-year study and their research results indicated that

48
students with learning disabilities were as likely to have a reciprocated best friend and had as
many best friends as their typically achieving peers. However, they retained fewer
friendships over time, and were more likely to have friends who also had learning
disabilities.
As a rare, but valuable example study with children at a transition period, Kingery and
Erdley (2007) examined the role of peer acceptance, number of mutual friends, and
friendship quality in predicting adjustment across the transition from elementary to middle
school and results revealed that there was a significant decrease in the average number of
mutual friendships across time, and that peer acceptance and friendship quality and quantity
play significant yet somewhat different roles in predicting loneliness and school involvement
across the middle school transition. Specifically, the regression models using the peer
variables to predict loneliness and school involvement across the transition were significant,
with peer acceptance emerging as a unique predictor; children with lower peer acceptance
are more likely to experience behavioral, emotional, academic, and peer difficulties; and
these students are at a higher risk for having adjustment difficulties across the middle school
transition; and the friendship quality variable was more highly correlated with school
involvement.
With young children, Ladd (1990) found that friendship and peer acceptance uniquely
predicted changes in kindergartners‘ school attitudes, avoidance, and performance. In
another study (Ladd & Coleman, 1997), which assessed changes over time in kindergarten
children‘s school attitudes and perceptions of peer acceptance and friendships, it was found
that initial levels of peer group acceptance were associated with liking school at both
assessments, while the number of mutual friendships was associated with an increase in
school liking. However, in an investigation in which a broader range of peer relationships
were examined (i.e. friendship, peer acceptance, and peer victimization (Ladd et al 1997), it

49
was found that multiple relational influences played a role in most of the adjustment
outcomes examined and that the adaptive significance of particular forms of relationship (i.e.
presence of unique versus shared linkages) varied across adjustment domains.
Overall, these findings were consistent with the view that peer relationships are
specialized in the types of social provisions they offer children but also diverse in the sense
that some provisions may be found in more than one form of relationship.
5.3.4. Innovative Areas of Investigation of Third Generation Peer Relations Research
As their innovative agendas and areas of investigation, the third generation researchers
explored child behaviors versus peer relationships as potential causes of development and
adjustment. One prominent objective was to examine the relative importance of childhood
aggression and peer group rejection as predictors of subsequent adjustment outcomes. The
evidence accumulated supported the causal model, suggesting that in addition to aggression,
peer rejection increases children‘s risk for maladjustment. This includes evidence from a
short-term longitudinal study (Panak & Garber 1992) in which aggression‘s contribution to
depression was found to be partially mediated by gains in peer rejection. Findings from
longer-term longitudinal studies (e.g. Coie et al 1992, Hymel et al 1990a) suggest that both
aggression and peer rejection in grade school make unique contributions to maladjustment in
early adolescence. In contrast, however, Kupersmidt & Coie (1990) found that the strength
of these linkages varied with the type of adjustment outcome examined: Whereas aggression
in middle childhood best predicted delinquency in adolescence, both aggression and peer
rejection anteceded other types of externalizing problems. Similar results have emerged in
studies where these linkages have been examined concurrently (see Boivin & Hymel 1997).
The question of whether the same model holds for other behavior patterns (e.g. withdrawn
behavior) has been examined, too. Renshaw & Brown (1993) found that withdrawn behavior
and low peer acceptance were additively associated (both concurrently and predicatively)

50
with loneliness in grade school children. A similar pattern of concurrent linkages was also
reported by Boivin & Hymel (1997).
5.3.5. Gender Differences
The construct of gender has been an enduring consideration in the study of children‘s peer
relations. Greater attention has been devoted to gender differences in the study of peer
rejection. As with boys, it has been possible to identify behavioral subtypes of rejected girls
(French 1990), but the behaviors that distinguish the subtypes (i.e. withdrawal, anxiety,
underachievement) are not the same as those that differentiate rejected boys (i.e. aggression),
suggesting that the causes or consequences of peer rejection may be different in boys‘ and
girls‘ peer groups. There is also evidence to suggest that the proximity and chronicity of peer
rejection take a greater toll on boys‘ than girls‘ adjustment (DeRosier et al 1994), although
research of this type has tended to focus on externalizing outcomes, which are more common
among boys.
Gender differences have also received further attention in the study of children‘s
friendships. Friendship networks (Parker & Seal 1996) revealed that boys‘ friendship
networks, in contrast to girls‘, were more likely to become interconnected over time. The
investigators suggested that girls may be more likely than boys to winnow network
affiliations as a means of managing conflicts and rivalries among members. Other evidence
implies that unskilled children, who may be disliked by peers, are more likely to seek
friendships among opposite-sex peers. Kovacs et al (1996) found that although neither grade
school boys nor girls were more likely to have primarily opposite-sex friends, those who did
(as compared with children with primarily same-sex friends or friends of both genders)
tended to have weaker social skills. However, it may also be the case that plays with same-
sex peers is a risk factor for some children. Fabes et al (1997) found that for boys (but not
girls) who were highly arousal, play among same-sex peers increased the likelihood of

51
behavior problems. Additionally, there is further support for the premise that boys and girls
have different relational priorities that shape their interactions and responses to friends or
well liked peers (see Maccoby 1990). In conflicts with friends, Hartup et al (1993) found that
girls were more likely than boys to accompany assertive behaviors with rationales,
suggesting that girls have greater concern for relationship issues whereas boys have greater
concern for mastery and status. Likewise, Whitesell & Harter (1996) found that girls were
more likely than boys to judge a friend‘s misdeeds from a relationship perspective, and
Fabes et al (1996) found that boys were more likely than girls to express anger toward well-
liked peers—a response that may be motivated by concerns about dominance and
competition.
5.3.6. Cultural and Ethnic Similarities and Differences
The third generation researchers of peer relations have also been investigating the cultural
and ethnic similarities and differences in children‘s peer relations and social competence.
Although the study of children‘s peer relations has become a worldwide endeavor,
systematic efforts to explore ethnic and cultural differences have been rare (Krappman
1996). Within North America, investigators have begun to draw of picture of the peer
relations of majority (typically Euro-American) and minority (typically African-American)
children. Kupersmidt et al (1995), for example, found that middle social economic status
neighborhoods appeared to operate as a protective factor against aggressive behavior for
low-income, single-parent African-American children. Schools that enroll children from
diverse backgrounds appear to promote ethnically diverse friendship and peer-interaction
patterns (Howes & Wu 1990). Other studies reveal differences between minority and
majority groups. Kovacs et al (1996) found that African-American children tend to have
more friendships as well as more opposite-sex friendships than do Euro-American children,
and they infer that African-American children may be socialized to develop larger networks

52
or may reside in family systems (e.g. extended families) that nurture broader ties. Other
findings suggest that children who are members of minority groups are more likely to
engage in self-protective, self-esteem-maintaining behaviors. Zakriski & Coie (1996) found
that even though both Euro-American and African-American children were more likely to
recast peer feedback about themselves in self-enhancing ways, self-protective distortions
were more pronounced among African-American children, especially when the feedback was
negative.
Cross-national comparisons of children‘s peer relations are rare. Researchers (Fonzi et al
1997) have argued that variations in cultural values may cause differences in the ways
children interact and maintain friendships. In support of this contention, they found that
friendships tend to be more stable in Italy than in Canada. Likewise, the role of children‘s
social behaviors in determining relationship and adjustment outcomes may also vary by
culture. Chen and colleagues (Chen et al 1992, and 1995) found that even though aggressive
and leadership behaviors predicted similar adjustment outcomes in Canadian and Chinese
samples, shy and sensitive behaviors did not. During childhood (but not adolescence), shy,
sensitive behaviors and peer acceptance and competence were positively correlated for
Chinese children but inversely related for Canadian children.
5.3.7. Summary of Three Generations of Peer Relations Research Results
In summary, with dominant or ascendant investigative agendas, research in peer relations
has been making progresses step by step. Some behaviors lead to peer rejections and others
lead to peer acceptance. Reasons for this are found from interpersonal and intrapersonal
cognition and early socialization contexts. Furthermore, several types of peer relations are
identified and they have different provisions and hence function differently on children‘s
development and adjustment. Finally, with deeper insight into peer relations investigation,
researchers reached fruitful results by innovatively combining children‘s behavior and peer

53
relations to examine the impact of peer relations on children‘s adjustment and development.
Generally speaking, research findings indicated that peer relations have impact on children‘s
academic outcomes, social competence, problem behaviors, psychological and
developmental well-beings etc., but on some outcome variables gender differences, cultural
differences existed.

54
6. Teacher Interpersonal Behavior
6.1. History of Teacher Interpersonal Behavior as Learning Environment
The research program of Wubbels and his colleagues in the Netherlands on teacher–
student relationships using the Questionnaire on Teacher Interpersonal Behavior (QTI) can
be considered one of the second pioneering contributions, which has around 30 years long
history. And simultaneously another pioneering research program based in Australia and
initially involving the use of the individualized classroom environment questionnaire (ICEQ)
(Fraser & Fisher, 1982; Rentoul & Fraser, 1979) was also launched.
6.2. Research Results on Teacher Interpersonal Behavior through Perceptions of Students
6.2.1. International Feature of Research
Research on teacher-student interactions is truly international. Although the research
program on teacher interpersonal behavior originated in the Netherlands, this research has
spread widely in many countries over the last 30 years. The QTI has been translated into and
validated in at least 15 languages.
6.2.2. Theoretical Foundation
The solid theoretical foundation of this research program is built on two theories. First, its
general theoretical basis is the systems theory of communication of Watzlawick, Beavin and
Jackson (1967). Second, Leary‘s (1957) research on the interpersonal diagnosis of
personality was used to create a two-dimensional model of interactional teacher behavior. In
the Leary model, two dimensions are important and Leary called them the Dominance-
Submission axis and the Hostility-Affection axis. While the two dimensions have
occasionally been given other names, they have generally been accepted as universal
descriptors of human interaction. Adapting the Leary Model to the context of education,
Wubbels et al. (1987) used the two dimensions, which they called Influence (describing who

55
is in control in the teacher-student relationship) and Proximity (describing the degree of
cooperation between teacher and students) (see Figure 4). The influence dimension is
characterized by teacher dominance (D) on one end of the spectrum, and teacher submission
(S) on the other end. Similarly, the proximity dimension is characterized by teacher
cooperation (C) on one end, and by teacher opposition (O) on the other. The two dimensions
can be depicted in a two-dimensional plane that can be further subdivided into eight
categories or sectors of behavior: leadership (DC), helpful/friendly behavior (CD),
understanding behavior (CS), giving responsibility/freedom (SC), uncertain behavior (SO),
dissatisfied behavior (OS), admonishing behavior (OD) and strictness (DO) (see Figure 5).
The Model for Interpersonal Teacher Behavior (MITB) also assumes that the eight sectors of
behavior can be represented by two independent dimensions (i.e., Influence and Proximity).
Figure 4 Two-dimensional coordinate system of the model for interpersonal behavior.

56
Figure 5 Model for teacher interpersonal behavior.
6.2.3. Mostly Studied Research Questions and Answers
Researchers on teacher interpersonal behavior investigated mostly associations between
students‘ outcomes and student perceptions of their teacher interpersonal behavior. It was
empirically proved that there was a link between the quality of teacher-student relationships
and student outcomes, especially affective outcomes. Specifically, teacher interpersonal
behavior with high dominance and proximity seemed to be conductive in terms of student
outcomes, including cognitive outcomes and affective outcomes, and studies on non-verbal
behavior and the spatial position of the teacher in the class offered support to the need for
beginning teachers to portray the image of an experienced teacher whenever they address the
class as a group (Wubbels & Brekelmans, 2005). For instance, Henderson, Fischer and
Fraser (2000) investigated associations between students‘ perceptions of their biology
teacher's behavior and their laboratory learning environment with student attitudinal,
performance, and achievement outcomes and results revealed that associations between

57
attitudinal outcomes and learning environment dimensions assessed by the Science
Laboratory Environment Inventory (SLEI) and Questionnaire on Teacher Interaction (QTI)
were stronger than with either achievement or practical outcomes. In another study by Lang,
Wong and Fraser (2005), associations were found between the interpersonal behavior of
chemistry teachers and students' enjoyment of their chemistry lessons. However, through
student perceptions of teacher interpersonal behavior, another study by den Brok,
Brekelmans and Wubbels (2004) examined the effectiveness of secondary education
teachers‘ interpersonal behavior by analyzing data from 2 samples: one study on 45 physics
teachers and their 3rd
-year classes and the other study on 32 English-as-a-Foreign-Language
teachers and their 3rd
-year classes. Results indicated that Influence and Proximity were
positively related to both subject-specific cognitive and affective outcomes and that teacher
interpersonal behavior explained up to more than half of the variance in student outcomes at
the teacher-class level.
6.2.4. Teacher Interpersonal Behavior in China
Research on teacher interpersonal behavior in China is too few (see Wei, den Brok, &
Zhou, 2009) although Chinese versions of QTI existed, but the investigations happened in
Taiwan and Singapore. Trough students‘ perceptions, his study examined the relationship
between English as a Foreign Language (EFL) teachers‘ interpersonal behavior ad students‘
fluency in English in secondary education in secondary education in southwestern China and
results showed that teacher uncertainty was negatively correlated with student achievement,
that the degree of teacher cooperation with students was the only significant predictor for
student achievement, that there was a discrepancy between students‘ perceptions of preferred
and actual teacher interpersonal behavior, and that the tolerant-authoritative profile was the
most common interpersonal style based on Chinese students‘ perceptions. But this study had
not a trace of concentration on affective outcomes. In this aspect, it leaves much more to do
58
for future research.
6.2.5. Trial in Conjunction with Other Aspects of Learning Environment (e.g., Culture or
Ethnicity)
Several comparisons of student perceptions of teacher interpersonal behavior among
different cultures or ethnicities indicated the necessity of integrating culture element in
learning environment studies. Wubbels and Levy (1989) did a comparison of Dutch and
American interpersonal teacher behavior and their results revealed that Dutch and American
teachers displayed the same interpersonal behavior toward their students in many aspects,
that American teachers wanted to be stricter than did their Dutch colleagues, and that Dutch
teachers wanted to give students more responsibility and freedom. This implied that Dutch
teachers emphasized affective outcomes to a greater degree and that American teachers
emphasize cognitive outcomes to a greater degree. Another study by Fisher and his
colleagues (1997) investigated gender and cultural differences in teacher interpersonal
behavior among secondary students in 35 coeducational schools in Western Australia and
Tasmania. Their results indicated that generally, the dimensions of the QTI were found to be
significantly associated with student attitude scores, that in particular, students' attitude
scores were higher in classrooms in which students perceived greater leadership,
helping/friendly, and understanding behaviors in their teachers, that Females perceived their
teachers in a more positive way than did males, and that students from an Asian background
tended to perceive their teachers more positively than those from the other cultural groups
used in the study. Furthermore, in the study by den Brok et al. (2006), secondary teacher
interpersonal behavior in Singapore, Brunei and Australia was examined and results showed
that differences in teacher influence and proximity existed among the countries. Therefore it
is necessary to integrate teacher-student relationships as one aspect of learning environment
to be in conjunction with other aspects of learning environment, for example, culture or

59
ethnicity, in research field.
Through their research, Fisher, Waldrip and den Brok (2005) concluded that teacher–
student relationships are linked to student outcomes both directly and indirectly through
associations with other aspects of the learning environment. In their study, Fisher, Waldrip
and den Brok involved the QTI in conjunction with another instrument called the cultural
learning environment questionnaire (CLEQ) with a large sample of over 3000 Australian
primary school students. They found that, first, scores on the QTI were related to scores on
the CLEQ and, second, QTI and CLEQ scales each have a joint and separate influence on
student outcomes.
Goh and Fraser (1998) reached similar conclusion with primary school students in
Singapore. The QTI was used in conjunction with the My Class Inventory (MCI) in their
study of students‘ achievement in and liking of mathematics. Their analysis revealed that the
QTI and MCI each made a sizeable unique contribution, and a small common contribution,
to the variance in students‘ liking of mathematics. However, for achievement, there was a
relatively large common variance and the QTI accounted for little variance that was unique
of that attributable to the MCI. Therefore, they concluded that their study supports the
usefulness of including the QTI and MCI together in the same study of attitudinal outcomes
but not for a study of achievement outcomes.
In their review, den Brok and Levy (2005) focused on the effects of ethnicity on students‘
perceptions of teacher interpersonal behavior and reviewed research in multicultural classes,
but also included some investigations of differences in students‘ perceptions between
countries. Their results revealed that ethnicity was consistently associated with students‘
perceptions of their teachers, that the way teachers communicated varied according to the
ethnicity of their students, and that teacher interpersonal behavior could be more important
for immigrant minority students‘ outcomes than for their indigenous peers.

60
In short, all these results clearly indicate the necessity for learning environment
researchers to think seriously about including other aspects of learning environments, such
as cultural elements, in their study designs.
6.2.6. Stability and Change of Teacher-Student Relationships in the Whole Teaching Career
Are there any changes in teacher-student relationships across the duration of the teaching
career? By using both longitudinal data and a large cross-sectional sample, Brekelmans,
Wubbels, and van Tartwijk (2005) explored the importance of teacher experience for
building and sustaining teacher–student relationships during the professional career. Results
showed that, on average, teachers‘ ideal perceptions of influence and proximity were rather
stable during the career. Teachers‘ self-perceptions and students‘ perceptions of proximity in
the teacher–student relationship were rather stable as well. Students‘ and teachers‘
perceptions of teacher influence on average grew in the first 6 years of the teaching career,
but mainly the first three years before this stabilized. Influence also seemed to fall off
somewhat towards the end of the career. In contrast, there was negligible change in
proximity behavior throughout the career. Furthermore, Fraser and Walberg (2005)
emphasized that the research by Brekelmans, Wubbels, and van Tartwijk (2005) had
practical implications for the differentiation of the provision of professional development for
teachers at different stages of their careers.
6.2.7. Effects of Eight profiles of teachers in terms of teacher interpersonal behavior on
Cognitive and Affective Outcomes
As reported by Wubbels and Brekelmans (2005), the Brekelmans‘ (1989) study with
physics teachers investigated the relationship between student outcomes and students‘
perceptions of teacher–student relationships. Altogether the study identified eight profiles of
teachers in terms of their patterns teacher–student interaction: authoritative, directive,
drudging, tolerant, repressive, tolerant/authoritative, uncertain/aggressive and

61
uncertain/tolerant. In terms of the interpersonal profiles results showed that, on average, the
teacher with a Repressive profile has the highest achievement outcomes. Teachers with
disorderly classrooms, the Uncertain/Tolerant, Uncertain/Aggressive, and Drudging profiles
reflect relatively low student achievement, whereas Directive, Authoritative and Tolerant
teachers have relatively high outcomes. The Authoritative and Directive teachers have the
highest student attitude scores. Students of the Drudging, Uncertain/Aggressive and
Repressive teachers have the worst attitudes toward physics. This conclusion again provided
practical implications for teacher training.
6.2.8. Teacher-Student Relationships from Perceptions of Different Groups of Students
Most researchers on teacher–student interaction focused on normal students from regular
classes. However, Lapointe, Legault and Batiste (2005) did a study to compare learning
disabled, average and talented students in terms of teacher interpersonal behavior and
student motivation in mathematics in two Quebec schools located in the Quebec city area
(middle to upper-middle social economic class). It was found that at-risk students consider
teachers as more punitive, dissatisfied and uncertain. Gifted students perceived more
leadership and teachers being more friendly, understanding and permissive. Lang, Wong and
Fraser (2005) studied gifted and non-gifted students in separate streams in Singapore and
investigated associations between teacher-student interaction and students' attitudes towards
chemistry. Statistically significant gender differences and stream differences (i.e. gifted vs.
non-gifted) were observed for numerous QTI scales. Associations were found between the
interpersonal behavior of chemistry teachers and students' enjoyment of their chemistry
lessons.
But we should be wise enough to see clearly whether the above mentioned differences
happened within-class or between-class. As Fraser and Walberg (2005) warned: it is
important to note that in different countries, there are different philosophies running in their

62
school systems respectively: streaming or mainstreaming. For example, in French-speaking
Quebec, the philosophy of streaming or setting is applied in that the disabled, average and
talented students are educated in separate classes. Therefore, in interpreting the results of the
comparison of these three groups of students (disabled, average and talented); it should be
alerted that the different groups are in different classes, with different teachers and peer
groups. In contrast, some school systems have a philosophy of ‗mainstreaming‘ or
‗integration‘ in which disabled, average and talented students are educated in the same
classrooms. For example, Orange and Fraser‘s (2004) comparison of disabled and non-
disabled students in integrated classes in Georgia, USA. The differences would be within-
class differences among student perceptions of teacher interpersonal behavior.
6.2.9. Summary
Positive teacher–student relationships are parts of positive classroom learning
environment and should be considered both as a means and as an end (Fraser & Walberg,
2005). When effort is taken to improve positive teacher-student relationships, learning
environments are becoming more positive in terms of promoting positive student outcomes,
especially affective outcomes. In this sense, a means is meant. However, positive teacher-
student relationships could act as an educational goal of making great effort.
It has already been realized that there have been far too few intervention studies in which
teachers use feedback from the actual and ideal forms of the QTI to guide their attempts to
improve teacher–student interpersonal relationships in their classrooms (Wubbels and
Brekelmans, 2005). Meanwhile, as a direction for future research, it has been suggested that
such research could be guided by improvement studies involving the use of other learning
environment instruments.
In terms of research places, China has long been greatly ignored. That is, more research
interests in this line or broader lines in learning environments are hungered.

63
7. Research Goals and Hypotheses
7.1. Why Present Study?
With further enforcement of China's One-Child Policy, the number of nuclear families are
to be increasing. The vast number of new-generation of Chinese only children has become a
primary concern of society. The questions often asked are about their academic and
psychosocial development. Thus, in present study, with Lewin‘s (1951) Field Theory and
Bronfenbrenner‘s (1979) Bioecological Systems Theory as theoretical framework, three sub-
learning environments of social interrelations and chronic self-concept levels are to be
examined in connection with some academic and psychosocial development outcomes
through the perceptions of Chinese only-children.
7.2. Why chronic self-concept levels are investigated?
7.2.1. Sate of the Person
In Lewin‘s field theory, it is emphasized that ―Psychology has to view the life space,
including the person and his environment, as one field.‖ (Lewin, 1951, p.240) Meanwhile in
Bronfenbrenner‘s bioecological systems theory, the biopsychological environment is also
among the microsystem. Self-concept belong to a personality variable and self-concept
levels present trait- and state-like characteristics such as chronic self-concept levels and
working self-concept levels. That is, self-concept levels have between persons and within
persons differences and could act as a state of person-category variables.
7.2.2. Individual, Relational, and Collective Levels of Self-Concept
The self-concept is a multifaceted schema that houses all information relevant to the self
(Lord and Brown, 2004). Furthermore, this schema can be divided into different levels.
Brewer and Gardner (1996) and others (e.g. Lord et al., 1999) have distinguished among
three levels of the self-concept: individual, relational, and collective levels. The individual-
level involves interpersonal comparisons where one‘s sense of uniqueness and self-worth are

64
derived from perceived similarities with and differences from other individuals. At this level,
behavior is driven by self-interest (Brewer and Gardner, 1996; Lord et al., 1999 and Markus
and Kitayama, 1991). The relational-level is based on the extent to which individuals define
themselves in terms of dyadic connections and role relationships with others. At this level,
individuals are motivated by the welfare of the specific other, and appropriate role behavior
regarding a specific person determines self-worth (Brewer and Gardner, 1996 and Markus
and Kitayama, 1991). The collective-level involves self-definition based on one‘s social
group memberships, where favorable intergroup comparisons give rise to self-worth. At this
level, individuals are motivated by the welfare of the groups to which they belong to
(Brewer and Gardner, 1996).
7.2.3. Chronic and Working Self-Concepts
Lord and Brown (2004) argued that self-concept could be activated and self-concept
activation has both trait- and state-like qualities. The chronic self-concept refers to the
relatively time-invariant (i.e., trait-like) accessibility of the individual, relational, and
collective levels for a particular person that occurs because different learning histories
produce stable differences among people‘s self-schemas. The working self-concept refers to
the situation-specific, moment-to-moment (i.e., state-like) activation of one‘s self-concept
levels (Markus and Wurf, 1987) which is produced by priming factors that vary across
situations. Consequently the self-concept level that is currently active will vary across people
and over time, along with the goals, attitudes, and information processing styles associated
with each level.
7.2.4. Self-Concept and Prior Social Interactions, Social Context and Cultural Influences
With respect to the chronic self-concept, the three levels exhibit different levels of
accessibility across different people. For some individuals, one level may even be
chronically accessible. This baseline activation associated with the chronic self-concept is

65
the product of social and cognitive development, especially which is associated with prior
social interactions and cultural influences (Oyserman, 2001). For example, the individual
self-concept may be chronically salient for members of individualistic cultures. In work
contexts, phenomena such as organizational culture and routines contribute to chronic self-
concept activation. Moorman and Blakely (1995) found that individuals with collectivistic
values and norms (indicating chronic collective self-concept activation) are more likely to
perform citizenship behaviors.
However, with respect to the working self-concept, the momentary social context is able
to prime different self-concept levels depending on the cues that are currently present
(Gardner et al., 1999 and Markus and Kunda, 1986). For example, cues within organizations
include aspects of one‘s current work tasks and the performance feedback that is received.
Cues within a social communicational system, such as a family, a peer group or between
students and teachers, may include interactional relationships at the dyadic and group level.
7.3. Research Goal
7.3.1. Theoretical Purpose
This research, first of all, belongs to a theoretically driven research. This investigation was
designed also to prove a theoretical model (see Figure 6) on basis of a psychological
ecological perspective and through the perceptions of the Chinese only-children. This
theoretical model proposed that, when only consider the impact of a separate learning
environment, little variance in the Chinese only-children‘s outcomes could be explained, but
only when considering direct and interaction impacts of the learning environments and
biopsychological environment (here the personality variable chronic self-concept taken as an
example) on the outcomes within the larger settings of culture, public policy, etc., much
more variance could be explained.
Through this theory model, a new way of thinking is provided for learning environment

66
researchers or practitioners in that the specific social context (for example, China‘s One-
Child Policy and Chinese culture) and culture-affected personality together with learning
environments could offer greater explanations and/or contributions in explaining student
outcomes; in that improvement or change of learning environments or even public policy in
practices on basis of student outcomes should be executed from a systems perspective, that is
the another central idea of systems: the circularity. This implies that all aspects of a system
are intertwined and changes in one system will not only affect the others, but will then return
like ripples of water moving between river banks.
Figure 6. Proposed Theoretical Model
7.3.2. To find Whether Uniqueness about Chinese Only Children Exists
China‘s One-Child Policy has been in effect for thirty years, through which incidentally a
huge laboratory has been created for psychologists, educational scientists, and sociologists.
Meanwhile this policy has brought many new topics for education because this policy has
altered some aspects of the immediate settings children living in. Therefore, there is a great
need for more investigations in the actual settings within such a great laboratory to find
whether uniqueness about Chinese only children exists in comparison with previous research
results and whether some planned changes or reforms are necessary for facilitating the
healthy development of this special group.

67
7.4. Hypotheses
Based on literature review and the present research purposes, the following hypotheses are
formulated:
H1: Career orientation would be influenced not only by family environment, but also by
chronic self-concept levels; and individual level of chronic self-concept would be more
closely related to individual-level-like career orientation, while relational and/or
collective levels of self-concept would be more closely related to relational and
collective-level-like career orientation.
H2: The impact of peer relations on social competence would be different due to different
school groups (senior high group and college group).
H3: There would be cross-sex parenting effects on social competence and positive self-
esteem.
H4: Parents parenting style matches in a family would make a difference in determining their
children‘s outcomes.
H5. The three learning environments would alone, but mostly together with students‘ chronic
self-concept levels exert their influences on student outcomes, such as academic
achievement goals, social competence and self-esteem.
H6. These 3 learning environments would not only have direct, but also joint effects on
student outcomes, such as academic achievement goals, social competence and self-
esteem as outcome variables.

68
8. Methodology
8.1. Participants
Participants are from medium-sized cities in middle China and they are 405 Chinese only
children including senior high school students (n = 188) and college students (n = 217),
consisted of 44.7% girls and 55.3% boys. The participants ranged in age from 16 to 26 years
old, with a median of 19 years old. In comparing within their family household‘s community
in their cities, their family economic status belongs to lower (42% of the sample) and middle
class (56.8% of the sample). Most of their parents‘ jobs belong to conventional jobs, such as
ordinary employees in companies, factory workers, farmers or civil servants.
8.2. Instrument
The self-report questionnaire in the current study includes scales designed to measure
three learning environments, student chronic self-concept levels and student outcomes. The
three learning environments were family environment including family cohesion and
parenting style of father and mother‘s; peer relations including peer group acceptance and
best friendship quality; teacher interpersonal behavior. And outcome variables were self-
esteem, social competence, academic achievement orientation and career orientation. Most
of the items in each scale were adapted from published instruments and only part of them
was designed by the author herself. Instruments used in the current study all employed a 5-
point Likert scale ranging from 0 (strongly disagree) to 4 (strongly agree).
Questionnaire on Teacher Interaction. This instrument is a short version of the Questionnaire
on Teacher Interpersonal Behavior (QTI) (Wubbels & Levy (1993) including 48 items and
was used to measure an average teacher and the favorite teacher‘s interpersonal behavior.
QTI is designed to measure 2 dimensions (influence and proximity) or eight categories or
sectors of teacher interpersonal behavior: leadership (DC), helpful/friendly behavior (CD),

69
understanding behavior (CS), giving responsibility/freedom (SC), and uncertain behavior
(SO), dissatisfied behavior (OS), admonishing behavior (OD) and strictness (DO) (for detail,
see Section 6.2.2).
Family Cohesion Scale. This scale included 3 items and was designed to measure one
important aspect of family relations: family cohesion. And it was partly adapted from Moos
and Moos (1981) and partly designed by the author. Here it is:
(a)Family members really help and support one another (adapted from Moos & Moos, 1981).
(b) There is a feeling of togetherness in our family (self-designed).
(c) We are pleased with and proud of being a member in our family (self-designed).
Parenting Authority Questionnaire. This instrument was adopted from Buri (1991) and
altogether 30 items were used to classify parenting styles into Baumrind's (1971) groupings
of authoritarian (e.g., ―My mother felt that wise parents should teach their children early just
who is boss in the family.‖ ), authoritative (e.g., ―As I was growing up I knew what my
mother expected of me in my family, but I also felt free to discuss those expectations with
my mother when I felt that they were unreasonable.‖), and permissive (e.g., ―As I was
growing up, my mother seldom gave me expectations and guidelines for my behavior.‖)
parenting styles. It was used to measure students‘ perceptions of their fathers‘ and mothers‘
parenting styles.
Peer Group Acceptance. This scale was adapted from the Belonging subscale of Voelkl‘s
(1996) Identification with School Questionnaire and it included 7 items. Sample items are
offered here: ―I feel proud of being part of my class; and School is one of my favorite places
to be.‖ It was used to assess the students‘ perceptions of the degree, to which they
themselves felt they belong to their peer groups. It was reported in the coefficient-alpha
reliability for the scores on the subscale belonging was .76 (Voelkl, 1996).
Positive Friendship Quality. This instrument was found from Rose‘s (2002), being adapted

70
from Parker and Asher‘s (1993) Friendship Quality Questionnaire to measure students'
perceptions of their positive relationship qualities with their best friend at school. This scale
included 10 items and the following are sample items: First please write down the name of
your very best friend at school______ and think of this best friend as you complete the
following items: ―helps me so I can get done quicker;‖ ―makes me feel good about my
ideas;‖ and ―We can talk about how to get over being mad at each other‖.
Levels of Chronic Self-Concept Scale. This scale was adapt from Selenta & Lord (2005 )
and was designed to measure the individual, relational, and collective levels of students‘
chronic self-concept (for details, see Section 2.3). Sample items in individual level or
comparative identity subscale are ―I thrive on opportunities to demonstrate that my abilities
or talents are better than others;‖ and ―I often compete with my friends‖. In relational level
or concern for others subscale, sample items are ―If a friend was having a personal problem,
I would help him/her even if it meant sacrificing my time or money‖ and ―Knowing that a
close other acknowledges and values the role that I play in their life makes me feel like a
worthwhile person‖. Regarding collective level or group achievement focus subscale, 2
sample items are shown here: ―Making a lasting contribution to groups that I belong to, such
as my class, is very important to me‖ and ―I feel great pride when my team or group does
well, even if I‘m not the main reason for its success‖. Altogether 15 items, that is, 5 items for
each subscale, are included in this instrument.
Academic achievement goals. This instrument was adapted from Elliot and Church (1997)
and measured performance approach goal (e.g., ―It is important to me to do better than the
other students.‖, and ―My goal in this class is to get a better grade than most of the
students.‖), mastery goal (e.g., ―I want to learn as much as possible from this class.‖ and ―I
hope to have gained a broader and deeper knowledge when I am done with this class.‖), and
performance avoidance goal (e.g., ―I often think to myself, ‗What if I do badly in this class?‘

71
‖ and ―I just want o avoid doing poorly in this class.‖). For assessing each goal, 6 items were
included.
Anxious Solitary Behavior. Anxious solitary behavior was partly adapted from Gazelle‘s
measure (Gazelle & Ladd, 2003; Gazelle & Rudolph, 2004) and partly designed by the
author herself, which consisted of 8 items: I am a person who ―prefers to be alone‖, ―refuses
to talk‖, ―is too fearful or anxious‖, ―is worried‖, ―is nervous, high-strung, or tense‖, ―is self-
conscious or easily embarrassed‖, ―is shy and timid‖, and ―is anxious around peers‖. This
instrument was used to measure whether Chinese only-children hold anxious solitary
behavior since they live in nuclear families and have no siblings and hence later have similar
problems when communicating with their peers and teachers.
General Prosocial Orientation. Prosocial behavioral tendency was measured by a newly
constructed instrument by being adapted from Cheung et al‘s (1998) idea of prosocial
orientation, which included 4 subscales: (1) Helping Behavior—tendency to help others in
various situations (e.g. ―I would spend time and money to help those in need‖); (2) Co-
operation and Sharing—tendency to co-operate with others to share things with others (e.g.
―I welcome other classmates to join in while I am playing‖); (3) Affective Relationship—
tendency to maintain an affective, friendly, and sympathetic relationship with others (e.g. ―I
feel very sad when my family member is sick‖); and (4) Normative Behavior—tendency to
behave in compliance with the social norm (e.g. ―I am very attentive during class lesson‖).
For these 4 subscales, except for the sample items given for the 4 subscales, 24 newly self-
designed items were included as the new Prosocial Orientation Questionnaire. The average
of the scores of the four subscales is a measure of the general tendency to perform prosocial
acts.
Self-Esteem. Self-Esteem was assessed by Rosenberg‘s (1965) Self-Esteem Questionnaire
containing 5 items positively worded (e.g., I feel that I am a person of worth at least on an

72
equal basis with others) and 5 negatively worded (e.g., All in all, I am inclined to feel that I
am a failure). Exploratory factor analysis in present study was conducted on the items of
self-esteem scale and showed that the items fell under two factors and confirmed exactly the
original two factors: positive and negative self-esteem.
Six Broad Vocational Orientations. Holland‘s (1959; 1962; and 1963) Six Broad Vocational
Orientations were used to measure students‘ career orientations, which included the
following 6 career orientations:
(1) Motoric orientation (realistic): These people ―enjoy activities requiring physical strength,
aggressive action, motor coordination and skill‖ (Holland, 1963, p.36)
(2) Intellectual orientation (investigative): These are ―task-oriented people who generally
prefer to 'think through, ' rather then 'act out,' problems. They have marked needs to organize
and understand the world‖ (Holland, 1963, p.36)
(3) Esthetic orientation (artistic): These people ―prefer indirect relations with others. They
prefer dealing with environmental problems through self expression in artistic media. ..They
resemble persons with an intellectual orientation in their intraceptiveness and lack of
sociability‖ (Holland, 1963, p. 37)
(4) Supportive orientation (social): These people ―prefer teaching or therapeutic roles, which
may reflect a desire for attention and socialization in a structured, and therefore sage, setting.
They possess verbal and interpersonal skills‖ (Holland, 1963, p.37)
(5) Persuasive orientation (enterprising): These people ―prefer to use their verbal skills in
situations which provide opportunities for dominating, selling, or leading others. ... They
avoid well-defined language or work situations as well as situations requiring long periods of
intellectual effort‖ (Holland, 1963, p. 37)
(6) Conforming orientation (conventional): These people ―prefer structured verbal and
numerical activities, and subordinate roles. They achieve their goals through conformity‖

73
(Holland, 1963, p.37)
8.3. Procedure
8.3.1. Back Translation
The whole questionnaire was first translated from English into Chinese by the author.
Then a back-translation was done independently by a second translator (who is proficient
both in Chinese and English and whose first mother language is Chinese and second mother
language is English) by translating the questionnaire from Chinese into English. Through
comparison of this translated version in English with the original English version of the
questionnaire, equivalence was reached.
8.3.2. Distributing and Collecting Questionnaires
Then the next step is to prepare for the distribution of the questionnaires. After obtaining
teacher consent and student assent, the questionnaires were administered in a 45-minute
session after students‘ regularly scheduled classes, which is normally used by students and
teachers for asking and answering questions or doing exercises for deeper understanding
what they have learned in regularly scheduled classes. The study was conducted in natural
classes of different senior high schools and universities in middle China from the beginning
of January till end of March 2009. Before the questionnaire was distributed, instructions
were given in emphasizing that ―this questionnaire is not a test, therefore there is no right or
wrong answers and the most important thing is to provide true answers!‖ Instructions about
how to mark their answers are also given. Immediately after instructions, Questionnaires
were distributed by the author herself. Firstly, students were asked to provide some
demographic information about them regarding gender, age, favorite subject, family
economic status, mother and father‘s occupation. And then general information about their
favorite teacher‘s gender, the subject he or she taught, in which stage (e.g., primary school,
junior high, senior high or college) he or she taught and his or her age range at the time of

74
teaching etc. finally, students were asked to answer the questionnaire by marking their
answers with a circle. In the Questionnaire, the contents were presented by following this
order: Questionnaire on Teacher Interpersonal Behavior regarding favorite teacher and an
average teacher (i.e., most of teachers) respectively, Parenting Authority Questionnaire
regarding of father and mother‘s parenting styles, Family Cohesion, Peer Group Acceptance,
Best Friendship Quality, Levels of Chronic Self-Concept Questionnaire, Academic
Achievement Goals, Anxious Solitary Behavior, General Prosocial Orientation, Self-Esteem
and Six Broad Vocational Orientations. The author was present during the process of student
answering question in case there were questions or need of explanations. In about 50 minutes
all questionnaires were collected.

75
9. Analyses and Results
9.1. Descriptive Statistics
9.1.1. Descriptive Statistics and Correlation Coefficients for All Variables
The descriptive statistics and correlation coefficients for all variables are presented in
Table 1, Table 2 and Table 3. For intercorrelations between independent variables and
dependent variables, see data reported in tables of Appendix I. As it is observed in Table 1,
almost all of the measures had acceptable levels of reliability with the values of coefficient
alpha ranging from .59 and .85, except for one of the subscales of prosocial orientation, i.e.,
normative behavior (α = .44). Since prosocial orientation or prosocial behavior consisted of
helping behavior, sharing and cooperative behavior, affective relations and normative
behavior and the coefficient alpha of prosocial behavior was .85, it was determined that the
items included in normative behavior subscale were not to be removed, but in hypotheses
testing, normative behavior were not considered. Therefore it could be concluded that
generally the measures used in present study had a quite good reliability.
Meanwhile, an item-by-item analysis was performed to determine if the coefficient alpha
could be improved by removing items. The item-total statistics showed that most of the
corrected item-total correlations range from .25 to .60. The values of ―alpha if item deleted‖
showed that, if items 12, 13 and 38 in QTI were removed, the coefficient alpha of the
subscales such as favourite teacher and average teacher‘s leadership, admonishing and
student responsibility/freedom could be improved; that, if items 13, 21, and 28 in Parental
Authority Questionnaires for father and mother were removed, subscales of father
permissive parenting style and mother permissive parenting style could be improved; and
that, if item 3 and 6 in the scale of peer group acceptance were deleted, the scale of peer
group acceptance could be improved. Therefore all the scale reliabilities were calculated on
basis of the improved instrument by deleting the above-mentioned items.

76
Table 1 Descriptive Statistics
Variables Number of items α M SD
FT Leadership behavior 5 .68 3.47 .57
FT Understanding behavior 6 .74 3.47 .60
FT Uncertain behavior 6 .68 .88 .73
FT Admonishing behavior 5 .72 .71 .82
FT Helpful/Friendly behavior 6 .73 3.43 .61
FT Student Responsibility/Freedom behavior 5 .64 2.99 .73
FT Dissatisfied behavior 6 .78 .98 .80
FT Strict behavior 6 .59 2.32 .66
AT Leadership behavior 5 .73 2.51 .72
AT Understanding behavior 6 .76 2.50 .75
AT Uncertain behavior 6 .68 1.39 .74
AT Admonishing behavior 5 .76 1.50 .90
AT Helpful/Friendly behavior 6 .78 2.34 .77
AT Student Responsibility/Freedom behavior 5 .65 2.15 .72
AT Dissatisfied behavior 6 .79 1.76 .83
AT Strict behavior 5 .60 2.32 .62
Permissive parenting style of father 7 .71 2.24 .74
Authoritarian parenting style of father 10 .71 2.16 .65
Authoritative parenting style of father 10 .82 2.53 .78
Permissive parenting style of mother 7 .70 2.24 .73
Authoritarian parenting style of mother 10 .69 2.15 .63
Authoritative parenting style of mother 10 .83 2.54 .77
Family cohesion 3 .83 3.19 .84
Peer group acceptance 5 .67 2.63 .70
Best friendship quality 10 .83 2.98 .64
Individual level of self-concept 5 .68 2.29 .75
Relational level of self-concept 5 ..73 3.38 .59
Collective level of self-concept 5 .82 3.28 .67
Performance academic achievement goal 6 .80 2.44 .80
Mastery academic achievement goal 6 .76 3.20 .64
Avoidance academic achievement goal 6 .79 1.98 .95
Anxious solitary behavior 8 ..84 1.96 .88
Prosocial behavior 18 .85 2.87 .56
Helping behavior 5 .71 2.90 .71
Sharing and cooperation behavior 4 .78 2.95 .75
Affective relationship 4 .62 3.00 .70
Normative behavior 5 .44 2.65 .58
Positive self-esteem 5 .76 2.85 .71
Negative self-esteem 5 .71 1.87 .86
Realistic career orientation 1 2.03 1.23
Investigative career orientation 1 2.64 1.12
Artistic career orientation 1 2.23 1.15
Social career orientation 1 2.51 1.08
Enterprising career orientation 1 2.59 1.10
Conventional career orientation 1 1.80 1.24
Note. Because of missing data, N ranged from 398 to 405. FT = favourite teacher; AT = average teacher

77
Table 2 Zero-Order Correlations between Independent Variables
Variable 1 2 3 4 5 6 7 8 9 10 11 12 13
1. father parenting style -
2. mother parenting style .78** -
3. family cohesion .33** .35** -
4. peer group acceptance .21** .13* .28** -
5. best friendship quality .28** .27** .34** .42** -
6.individual level of self-concept .08 .10* .10* .15** .05 -
7.relational level of self-concept .20** .24** .34** .26** .50** .19** -
8.collective level of self-concept .23** .25** .40** .47** .50** .13** .60** -
9. FT cooperative behavior .16** .13** .25** .20** .39** .12** .40** .40** -
10. FT opposition behavior .06 .04 -.18** -.12* -.24** .08 -.25** -.23** -.47** -
11. FT strict .18** .20** .06 .06 -.04 .15** .01 .03 .01 .20** -
12. AT cooperative behavior .06 .06 .23** .28** .16** .10* .14** .26** .19** -.10* .01 -
13. AT opposition behavior .17** .18** -.11* -.17* -.06 .12* -.05 -.12* -.02 .39** .27** -.43** -
Note: Because of missing data, N ranged from 398 to 405. FT = favourite teacher; AT = average teacher; ** ρ < .01 (2-tailed); * ρ < .05
(2-tailed)

78
Table 3 Zero-Order Correlations between Dependent Variables
variable 1 2 3 4 5 6 7 8 9 10 11 12
1. performance academic achievement goal -
2. mastery academic achievement goal .18** -
3. avoidance academic achievement goal .24** -.17** -
4. anxious solitary behavior .20** -.11* .43** -
5. prosocial behavior .00 .64** -.14** -.21** -
6. helping behavior .01 .58** -.11* -.11* .88** -
7. sharing and cooperation behavior -.06 .58** -.18** -.31** .86** .67** -
8. affective relationship .06 .46** .03 -.06 .77** .57** .57** -
9. positive self-esteem .08 .47** -.14** -.25** .59** .45** .55** .44** -
10. negative self-esteem .08 -.21** .42** .47** -.22** -.16** -.25** -.05 -.35** -
Note: Because of missing data, N ranged from 398 to 405. FT = favourite teacher; AT = average teacher; ** ρ < .01 (2-tailed); * ρ < .05 (2-
tailed)

79
9.1.2. Profiles of Chinese Only Children‘s Favourite Teacher and Average Teacher Interpersonal
Behavior
Moreover, on basis of the descriptive statistics of favourite teacher and average teacher, the
profiles of favourite teacher and average teacher interpersonal behavior were illustrated in
Figure7 and 8. In comparison with the two figures, it was obvious that Chinese only children‘s
favourite teachers were characterized with very high level of cooperative behavior and high level
of strict behavior, but very low level uncooperative behavior, such as admonishing, dissatisfied
and uncertain behavior when interacting with their students, while their average teachers, that is,
most of their teachers had a profile of middle level of cooperative behavior and strict behavior,
but relatively higher levels of uncooperative behavior such as admonishing, dissatisfied and
uncertain behavior when interacting with their students. Thus a general conclusion could be
reached about Chinese only children: It seemed that the dimension of control was not so
important as the dimension of proximity because their differentiation of favourite teachers and
average teachers was mainly based on whether they were cooperative or oppositional. And the
dimension of control seemed to have been ignored by Chinese only children. Later in the section
of exploratory factor analyses seemed proved this point.
Fig. 7. Interpersonal profile of Favourite Teacher Fig. 8. Interpersonal profile of average teacher
O
S
D
C C
D
O
S

80
9.1.3. Career Orientations of Chinese Only Children
From descriptive statistics in Table 1, a general picture of Chinese only children is that the
most welcome career orientations are investigative (M = 2.64, SD = 1.12), enterprising (M =
2.59, SD = 1.10), and social (M = 2.51, SD = 1.08) career orientations ; and that the least
welcome are conventional (M = 1.80, SD = 1.24), realistic (M = 2.03, SD = 1.23) and artistic
(M = 2.23, SD = 1.15) career orientations.
9.1.4 Gender Differences
Table 4. Gender differences
Dependent variable Gender group M SD F
Individual level of self-concept Male n=181 2.38 .72 4.23*
Female n=224 2.22 .77
Relational level of self-concept Male n=181 3.32 .63 4.20*
Female n=224 3.44 .56
Collective level of self-concept Male n=181 3.21 .74 3.94*
Female n=224 3.34 .60
Prosocial behavior Male n=178 2.69 .60 37.83***
Female n=223 3.02 .48
Helping behavior Male n=178 2.73 .72 18.71***
Female n=223 3.03 .67
Sharing and cooperation behavior Male n=178 2.77 .81 21.52***
Female n=223 3.11 .67
Affective relationship Male n=178 2.77 .70 38.16***
Female n=223 3.18 .65
Positive self-esteem Male n=181 2.74 .76 7.83**
Female n=224 2.94 .65
Investigative career orientation Male n=181 2.87 1.06 15.38***
Female n=224 2.44 1.13
Social career orientaion Male n=181 2.36 1.11 5.84*
Female n=224 2.63 1.05
Note: Because of missing data, N ranged from 398 to 405. *ρ<.05. **ρ<.01. ***ρ<.001.
As usual, gender differences were also examined and results (see Table 4) indicated that

81
gender differences existed in all chronic self-concept levels: male students have significantly
higher individual level of self-concept (F(1, 403) = 4.23, ρ<.05), but significantly lower
relational level (F(1, 403) = 4.20, ρ<.05) and collective level of self-concept (F(1, 403) =
3.94, ρ<.05) than female students; in both general prosocial orientation (F(1, 399) = 37.83,
ρ<.001) and specific prosocial behavior, such as helping behavior (F(1, 399) = 18.71,
ρ<.001), sharing cooperative behavior (F(1, 399) = 21.52, ρ<.001) , affective relations (F(1,
399) = 38.16, ρ<.001) , male students have very significantly lower levels of prosocial
behavior than female students; in positive self-esteem, male students have also very
significantly lower positive self-esteem than female students (F(1, 403) = 7.83, ρ<.01); and
in career orientation, male students have very significantly higher investigative (F(1, 403) =
15.38, ρ<.001), but significantly lower social career orientations (F(1, 403) = 5.84, ρ<.05)
than female students. It seemed that Chinese female only-children are more socially oriented.
9.2. Exploratory Factor Analyses
9.2.1. Three Components of Favourite Teacher Interpersonal Behavior
For the purposes to see whether some constructs hold the same meaning for this Chinese
sample and to simplify data analysing, a few separate exploratory factor analyse was
conducted on items regarding favourite teacher interpersonal behavior, average teacher
interpersonal behavior, father parenting style, mother parenting style and chronic self-
concept levels, using principle component analyses and varimax rotation.
The first two principle component analyses were conducted on the 48 items of favourite
teacher interpersonal behavior and average teacher interpersonal behavior respectively with
varimax rotation. The Kaiser-Meyer-Olkin measure verified the sampling adequacy for the
analyses. For all items of favourite teacher interpersonal behavior, KMO value = .73, and all
KMO values for individual items ranged from .50 and .79. Bartlett‘s Test of sphericity χ2
(28) = .001, ρ = .000, indicated that correlations between items were sufficiently large for

82
principle component analysis. An initial analysis was run to obtain Eigen values for each
component in the data. Three components had Eigen values over Kaiser‘s criterion of 1 and
in combination explained 76.19% of the variance in favourite teacher interpersonal behavior.
Table 5 showed the factor loadings after rotation. The items that cluster on the same
components suggest that component 1 represents favourite teacher cooperative behavior,
component 2 favourite teacher opposition behavior, component 3 favourite teacher strict
behavior. The favourite teacher cooperative behavior and opposition behavior subscales had
high reliabilities (Cronbach‘s α were .87 and .70 respectively). However, favourite teacher
strict behavior subscale had relatively low
Table 5 Factor loadings (>.30) for favourite teacher interpersonal behavior using principle
component analysis and varimax rotation
Scale Item Topics
Factor Loadings
Communality Factor1:
FT cooperative
Factor 2:
FT opposition
Factor 3:
FT strict
FT-Student Responsibility/
Freedom .87 .81
FT Helpful/Friendly .83 .74
FT Understanding .78 -.37 .75
FT Leadership .57 -.39 .52 .74
FT Uncertain .87 .82
FT Admonishing -.34 .76 .77
FT Dissatisfied -.39 .66 .67
FT Strict .88 .80
Eigen values 3.48 1.25 1.36 6.09
Percent of Variance 32.99 26.56 16.64 76.19
α .82 .75 .59
Note: Because of missing data, N ranged from 398 to 405. *ρ<.05. **ρ<.01. ***ρ<.001. FT
= favourite teacher
reliability (Cronbach‘s α = .59). In comparison with this measure‘s original design (Wubbels

83
& Levy, 1993), there are only two dimensions: influence and proximity. But here in the
present study. It seemed that favorite teacher strict behavior did not fall into these two
dimension and was independent to be a third component, but with a relatively low scale
reliability.
9.2.2. Two Components of Average Teacher Interpersonal Behavior
However, for all items of average teacher interpersonal behavior, KMO value = .82,
Bartlett‘s Test of sphericityχ2 (28) = .0015, ρ= .000. And all KMO values for individual
items ranged from .50 and .84. Two components were reached and in combination explained
66.43% of the variance in average teacher interpersonal behavior. Table 6 showed the factor
loadings after rotation. The items that cluster on the same components suggested that compo-
Table 6 Factor loadings (>.30) for average teacher interpersonal behavior using principle
component analysis and varimax rotation
Scale Item Topics Factor Loadings Communality
Factor 1:
AT cooperative
Factor 2:
AT opposition
AT Leadership .85 .77
AT Understanding .83 .78
AT helpful/Friendly .83 .74
AT Student
Responsibility/Freedom .72 .53
AT Dissatisfied .82 .73
AT Admonishing .42 .76 .75
AT Uncertain .64 .47
AT Strict .46 .59 .56
Eigen values 3.84 1.47 5.31
Percent of Variance 48.03 18.40 66.43
α .87 .70
Note: Because of missing data, N ranged from 398 to 405. *ρ<.05. **ρ<.01. ***ρ<.001. AT
= average teacher

84
-nent 1 represented average teacher cooperative behavior, component 2 average teacher
opposition behavior. The average teacher cooperative behavior and opposition behavior
subscales had high reliabilities (Cronbach‘s α were .82 and .70 respectively). Meanwhile, an
item-by-item analysis showed that, if items regarding average teacher strict behavior were
removed, the subscale average teacher opposition behavior could reach higher reliability
(Cronbach‘s α = .78).
9.2.3. Different Understanding of QTI of Chinese Only Children
Firstly, it seemed that in Chinese students‘ understanding of teacher interpersonal behavior,
only the dimension of proximity was felt, but the dimension of control, only in favourite
teacher interpersonal behavior: strict behavior has a trait of being distinct.
Secondly, when the results of the above two principle component analyses regarding strict
behavior were considered in combination with the descriptive statistics in Table 1 and the
intercorrelation table in regression part regarding strict behavior of favourite teacher and
average teacher, it seemed that there were culturally different understanding of teachers‘
strict behavior and that Chinese students considered teachers‘ strict behavior as a positive
aspect of teacher interpersonal behavior.
9.2.4. One Component of Father or Mother Parenting Styles: New Profile of Parenting Style
of Chinese Parents
Another two principle component analyses were run on all the items of father and mother
parenting styles respectively. For all items of favourite (KMO value = .50. Bartlett‘s Test of
sphericity χ2 (3) = 253.013, ρ= .000) and average teacher interpersonal behavior (KMO
value = .51. Bartlett‘s Test of sphericity χ2 (3) = 262.806, ρ= .000), one component was
reached respectively and only items of permissive and authoritative parenting styles loaded
on this component, which explained 56.77% and 57.53% of the variance in father parenting
style and mother parenting style respectively (see Table 7 and Table 8). Since permissive and

85
authoritative parenting style items cluster on one component and the component was named
as permissive-authoritative parenting. The father permissive-authoritative parenting style
scale and mother permissive-authoritative parenting style scale had high reliabilities
(Cronbach‘s α were .80 and .81respectively).
Table 7 Factor loadings (>.30) for father parenting style (PSF) using principle component
analysis and varimax rotation
Scale Item Topics Factor loading Communality
Factor 1:
Father parenting
style
Authoritative PSF .91 .83
Permissive PSF .90 .80
Authoritarian PSF .07
Eigen values 1.70 1.70
Percent of Variance 56.77 56.77
α .80 .80
Note: Because of missing data, N ranged from 398 to 405. *ρ<.05. **ρ<.01. ***ρ<.001.
Table 8 Factor loadings (>.30) for mother parenting style (PSM) using principle component
analysis and varimax rotation
Scale Item Topics Factor loading Communality
Factor 1:
Mother
parenting style
Authoritative PSM .91 .83
Permissive PSM .90 .81
Authoritarian PSM .09
Eigen values 1.73 1.73
Percent of Variance 57.53 57.53
α .81 .81
Note: Because of missing data, N ranged from 398 to 405. *ρ<.05. **ρ<.01. ***ρ<.001.

86
The above analyses revealed that the parenting styles of Chinese only children‘s parents
were not authoritarian parenting style or authoritative parenting style as previous literature
concluded, but a new kind of parenting style: permissive-authoritative parenting style.
If we turn to the three theoretical dimensions (i.e., demanding, responsive and
psychological control) on which the typology of permissive, authoritative and authoritarian
parenting styles were named, it was obvious that the permissive-authoritative parenting style
of these Chinese only children‘s parents were exerting a parenting style of high
responsiveness, low psychological control and a level of demandingness, which is lower to
some degree than the demandingness of the usual authoritative parenting style. In plain
words, compared with authoritative parenting style, this permissive-authoritative parenting
style is like an authoritative parenting style but with less behavioral control or more freedom
given. This change of parenting style probably is a reflection of an impact of China‘s One-
Child Policy happening in Chinese culture.
9.2.5. One Component of Chronic Self-Concept Levels: Chinese Cultural Print Still on There
Another principle component analysis was conducted on all items of chronic self-concept
levels and one component was reached (see Table 9), loaded on by relational level, collective
level and individual level of self-concept with loadings .88, .86, and .41 respectively (KMO
value = .53, Bartlett‘s Test of sphericity χ2 (3) = 195.347, ρ= .000.), which explained 57.53%
of variance in chronic self-concept levels. Since individual level of self-concept‘s loading was
very small (only .41) and its communality was .17, this component was named as relational-
collective self-concept levels and had a high reliability (Cronbach‘s α= .75).
Since the relational and collective levels of chronic self-concept loaded mostly on the scale
of relational-collective chronic self-concept, it could be inferred that the impact of Chinese
culture was still great on Chinese only-children‘s chronic self-concept. But how about Chinese
only-children‘s career orientations? Are they still more relational and/or collective like or, to

87
be exact, more socially oriented? (See Regression part).
Table 9 Factor loadings (>.30) for chronic self-concept levels using principle component
analysis and varimax rotation
Scale Item Topics Factor loading Communality
Factor 1:
Relational-collective
chronic self-concept
level
Relational level .88 .77
Collective level .86 .74
Individual level .41 .17
Eigen values 1.68 1.68
Percent of Variance 55.88 55.88
α .75 .75
Note: Because of missing data, N ranged from 398 to 405. *ρ<.05. **ρ<.01. ***ρ<.001.
9.2.6. Two Components of Career Orientation
The final principle component analysis was conducted on all items of chronic self-concept
levels and two components were reached (see Table 10). Artistic, Investigative, and
Conventional Career Choices loaded on the first component (loadings were .71, .65, and .61
respectively), named as individual-level-like career orientation; and Enterprising, Social, and
Realistic Career Choices loaded on the second component (loadings were .71, .63, and .63
respectively), named as relational and collective-level-like career orientation (KMO value = .52,
Bartlett‘s Test of sphericity χ2 (3) = 104.092, ρ= .000.). These two components explained 46.00
% of variance in the whole concept of career orientation. But these two components did not have
high reliabilities (Cronbach‘s α= .41 for individual-level-like career orientation; Cronbach‘s α=
.34 for relational and collective-level-like career orientation). This result was used only in one of
the hypotheses testing in the next section: Career orientation would be influenced not only by
family environment, but also by chronic self-concept levels.

88
Table 10 Factor loadings (>.30) for career orientation (CO) using principle component
analysis and varimax rotation
Scale Item Topics Factor Loadings Communality
Factor 1: CO1 Factor 2:
CO2
CO Artistic .71 .51
CO Investigative .65 .43
CO Conventional .61 .38
CO Enterprising .71 .58
CO Social .63 .47
CO Realistic .63 .39
Eigen values 1.47 1.29 2.76
Percent of Variance 24.43 21.57 46.00
α .41 .34
Note: Because of missing data, N ranged from 398 to 405. *ρ<.05. **ρ<.01. ***ρ<.001.
9.3. Hypotheses Testing
9.3.1. Testing of Impact of Family Environment and Chronic Self-Concept on Career
Orientation (Hypothesis 1)
Hypothesis 1 predicted that career orientation would be influenced not only by family
environment, but also by chronic self-concept levels and even interactions between family
environment and chronic self-concept levels; and individual level of chronic self-concept would
be more closely related to individual-level-like career orientation, while relational and/or
collective levels of self-concept would be more closely related to relational and collective-level-
like career orientation. Two multiple hierarchical regression analyses were run respectively with
individual-level-like career orientation and relational and collective-level-like career orientation
as dependent variables and with the following 3 blocks of variables as independent variables:
family environment variables such as family cohesion, father parenting style and mother
parenting style (1st step), 3 chronic self-concept levels, i.e., individual level, relational level and

89
collective level (2nd
step), interactions between family environment variables and 3 chronic self-
concept levels (3rd
step).
In the regression model with individual-level-like career orientation as dependent variable
(see Table 11), among the family environment variables, only family cohesion acted as a
significant predictor (ß = .12, ρ = .02) in the 1st step (∆R
2 = .02, ρ = .049) ; in the 2
nd step, only
individual level of chronic self-concept (ß = .14, ρ = .007; ∆R2 = .02, ρ = .038); and in the 3
rd
step, only correlation between family cohesion and relational level of chronic self-concept (ß = -
1.24, ρ = .01; ∆R2 = .04, ρ = .045 ) acted as significant predictors of individual-level-like career
orientation. The overall model was significant as well (F (15, 389) = 2.29, R2 = .08, ρ < .01).
In the regression model with individual-level-like career orientation as dependent variable
(see Table 11), among the family environment variables, only family cohesion acted as a
significant predictor (ß = .12, ρ = .02) in the 1st step (∆R
2 = .02, ρ = .049) ; in the 2
nd step, only
individual level of chronic self-concept (ß = .14, ρ = .007; ∆R2 = .02, ρ = .038); and in the 3
rd
step, only correlation between family cohesion and relational level of chronic self-concept (ß = -
1.24, ρ = .01; ∆R2 = .04, ρ = .045 ) acted as significant predictors of individual-level-like career
orientation. The overall model was significant as well (F (9, 389) = 1.943, R2 = .08, ρ < .05).
Therefore, it could be concluded that family cohesion, individual level of chronic-self-concept,
and the interaction between family cohesion and relational level of chronic self-concept were
important in predicting individual-level-like career orientation.
Meanwhile, in the regression model with relational and collective-level-like career
orientation as dependent variable (see Table 11), it was shown that among the family
environment variables, only father parenting style acted as a significant predictor (ß = .20, ρ =
.01) in the 1st step (∆R
2 = .07, ρ = .000) ; in the 2
nd step, only collective level of chronic self-
concept (ß = .12, ρ = .047; ∆R2 = .04, ρ = .000); and in the 3
rd step, no significant R
2 change
was reached. Therefore, the regression model only include two steps of results in

90
Table 11 Regression of career orientation on family environment variables and self-concept levels
Step
Predictor
Individual-level-like CO Relational and collective-level-like CO
B SE B β B SE B β B SE B β B SE B β B SE B β
1 feco .35 .15 .12* .30 .16 .11 1.51 .85 .53 .03 .14 .01 -.18 .15 -.07
father_PS .05 .14 .00 -.01 .14 -.00 -.06 .88 -.04 .32 .13 .20* .32 .12 .19*
mother_PS -.21 .14 -.12 -.22 .14 -.13 .53 .90 .31 .11 .13 .06 .05 .13 .03
2 sclindiv .43 .16 .14** -.59 .71 -.19 .23 .14 .08
sclrelat -.22 .25 -.06 .57 1.26 .14 .41 .23 .11
sclcollect .23 .23 .06 2.02 1.05 .58 .41 .21 .12*
3 feco X sclindiv .16 .21 .20
feco X sclrelat -.79 .31 -1.24*
feco X sclcollect .32 .29 .53
father_PS X sclindiv .15 .18 .32
father_PS X sclrelat .09 .31 .23
father_PS X sclcollect -.17 .28 -.44
mother_PS X sclindiv -.06 .19 -.12
mother_PS X sclrelat .23 .30 .59
mother_PS X sclcollect -.42 .25 -1.09
∆ R2 .02* .02* .04* .07*** .04***
R2 .02 .04 .08 .07 .11
Note: Because of missing data, N ranged from 398 to 405. *ρ<.05. **ρ<.01. ***ρ<.001. CO = career orientation.

91
Table 12 Regression of social competence on peer relations and different school groups
Step
Predictor
prosocial behavior Sharing Cooperation behavior Helping
B SE
B
β B SE
B
β B SE
B
β B SE
B
β B SE
B
β B SE
B
β
1 PGA .14 .04 .17*** .07 .06 .09 .22 .05 .20*** .07 .08 .07 .09 .05 .09 .10 .08 .10
BFQ .38 .04 .43*** .40 .06 .46*** .42 .06 .36*** .53 .08 .46*** .47 .05 .43*** .45 .08 .40***
School group .14 .05 .13** .01 .25 .01 .16 .07 .11* .12 .34 .08 .20 .06 .14** .13 .33 .09
2 BFQ X school
group
.01 .08 -.13 -.20 .11 -.42 .04 .11 .09
PGA X school
group
.11 .08 .26 .25 .10 .46* -.02 .10 -.04
∆ R2 .28*** .00 .23*** .01* .23*** .00
R2 28 .28 23 .24 23 .23
Note. Because of missing data, N ranged from 400 and 405; *** ρ<.001. ** ρ< .01. * ρ<.05; PGA = peer group acceptance; BFQ = best
friendship quality; here reference group is college group.

92
Table 11 and this two-step regression model was significant as well (F(6, 398) = 8.19, R2 =
.11, ρ < .001). Therefore, it could be concluded that father parenting style, and collective
level of chronic-self-concept were capable to predict relational and collective-level-like
career orientation. In a word, Hypothesis 1 was proved.
9.3.2. Testing of School Group Differences (Hypothesis 2)
Hypothesis 2 was about school group differences in the impact of peer relations and it
predicted that the impact of peer relations on social competence would be different due to
different school groups (senior high group and college group) because senior high group
students mostly stay together as classmates longer (at least three years) than college group
students. Several multiple hierarchical regression analyses were conducted with social
competence variables as dependent variables and with peer relations, school groups (college
group as reference group) and interactions between peer relations and school groups as
independent variables. School group and peer relations variables such as peer group
acceptance and best friendship quality were entered in the first step; and in the second step,
interactions between peer group acceptance and school group, and between best friendship
qualities were entered.
Analyses indicated that except for affective relations, Hypothesis 2 was true with other
social competence variables such as prosocial behavior, helping behavior, and sharing and
cooperation behavior (see Table 12). Specifically, as the results in Table 12 illustrated: firstly,
in the regression model of prosocial behavior on peer relations and school groups, peer
group acceptance (ß = .17, ρ < .001), best friendship quality (ß = .43, ρ <.001), and school
group (ß = .13, ρ < .01) acted as significant predictors in the 1st step (∆R
2 = .28, ρ <.001) ;
but when the interaction variables in the 2nd
step were considered, the model was not
significant (∆R2 = .00, ρ >.05); secondly, in the regression model of sharing cooperation
behavior on peer relations and school groups, peer group acceptance (ß = .20, ρ <.001), best

93
friendship quality (ß = .36, ρ <.001) and school group (ß = .11, ρ <.05) were significant
predictors in the first step (∆R2 = .23, ρ <.001), and in the second step (∆R
2 = .01, ρ <.05),
interaction between peer group acceptance and school group acted as significant predictor (ß
= .46, ρ <.05) and the overall model was significant as well (F(5, 397) = 25.73, R2 = .24, ρ <
.001); finally, in the regression model of helping behavior on peer relations and school
groups, best friendship quality (ß = .43, ρ <.001) and school group (ß = .14, ρ <.01) acted as
significant predictors in the first step (∆R2 = .23, ρ <.001), but the second step contributed
not significantly to the model (∆R2 = .00, ρ >.05). However, in affective relations‘ regression
model on peer relations and school groups, among the two steps, only in the first step, best
friendship quality was found to be significant predictor (ß = .34, ρ <.001) and explained
about 13% variance in affective relations (∆R2 = .13, ρ <.001), but school group contributed
not significantly to the model either in direct or joint effect-forms. Hence, the conclusion is
that not only peer relations influence students‘ social competence, but also being a student of
senior high group or college group would make great difference in predicting the social
competence such as prosocial behavior, helping behavior and sharing cooperation behavior,
but not affective relations. Senior high students have higher tendency than college students
to behave prosocially, to help others, to share and cooperate with others. Moreover, results
also revealed that the impact of peer group acceptance had greater impact on sharing
cooperation behavior of senior high group students than on that of college group students.
9.3.3. Testing of Cross-Sex Parenting Effects (Hypothesis 3)
Hypothesis 3 predicted that there would be cross-sex parenting effects on social
competence and positive self-esteem. Multiple regression analyses were run on social
competence variables and positive self-esteem respectively with father parenting style,
mother parenting style, gender of students (reference group is male student group), and
interaction terms such as ―father parenting style X gender‖ and ―mother parenting style X

94
gender‖ as independent variables entered with forced entry method. Results indicated that
(see Table 13): Firstly, the regression model of prosocial behavior showed that father
parenting style (ß = .29, ρ < .01), mother parenting style (ß = .35, ρ < .01), student gender (ß
= .89, ρ < .001), and the interaction between father parenting style and student gender (ß = -
.52, ρ < .05) were significant predictors and the model is significant as well (F(5, 395) =
35.20, R2 = .31, ρ < .001). Secondly, the regression model of positive self-esteem revealed
that father parenting style (ß = .37, ρ < .01) and student gender (ß = .54, ρ < .01) were
significant predictors and the model was significant as well (F (5, 399) = 16.79, R2 = .17, ρ <
.001). However, the interactions between parenting style and student gender were not
significant predictor. Therefore, different from previous literature, for this Chinese only-
children sample, cross-sex parenting effect existed only on prosocial behavior.
Table 13 Regression Results of Cross-Sex Parenting Effects
predictor prosocial behavior positive SE
B SE B β B SE B β
PSF .12 .05 .29** .19 .06 .37**
PSM .14 .04 .35** 07 .06 .14
gender 1.00 .18 .89*** .77 .25 .54**
PSF X gender .19 .06 -.52* -.03 .08 -.12
PSM X gender -.03 .06 -.15 -.09 .08 -.34
R2 .31*** .17***
Note. Because of missing data, N ranged from 401 and 405. ***.ρ<.001, **.ρ<.01, *. ρ<.05;
reference group is male student group. PSF = parenting style of father; PSM = parenting
style of mother.
Specifically, father parenting style had significantly greater impact on male students than on
family students‘ prosocial behavior (ß = -.52, ρ < .05; and male student group as reference
group).
9.3.4. Impact of Different Matches of Father and Mother‘s Parenting Styles (Hypothesis 4)
Hypothesis 4 posited that parents or at least one parent in a family should have authoritative
PS if they hope their children to have better outcomes in academic achievement goals, social

95
competence, or self-esteem. In order to test this hypothesis, with mother and father matching
group variable as independent variable, several ANOVAs were conducted with social
competence variables, academic achievement goals, positive and negative self-esteem, and
career orientation (individual-level-like career orientation and relational and collective-level-
like career orientation) as independent variables respectively. As it is known, through
exploratory factor analyses, father and mother parenting styles loaded on one factor (father
permissive-authoritative PS and mother permissive-authoritative PS). In order to create a
mother-father-matched-parenting-style group variable (in short: mofa), first of all, mother
parenting style group (in short: mother_group) and father parenting style group (in short:
father_group) variables were created according to the factor scores by giving a value of ―1‖ to
the first half of students having lower permissive-authoritative scores, and giving a value of ―2‖
to the other half having higher permissive-authoritative scores; secondly, based on these mother
and father parenting style group variables, another new variable was created to represent the
mother-father-matched-parenting-style group variable. Then with ANOVA (GLM) analyses, the
newly coded variable representing for the matched father and mother parenting style was
entered as independent variable, and with different dependent variables separately, very
significant differences were found on prosocial behavior (F(3, 397) = 20.84, ρ<.001, η2 = .14),
helping behavior (F(3, 398) = 18.80, ρ<.001, η2 = .12), sharing cooperation behavior (F(3, 400)
= 12.90, ρ<.001, η2 = .09), affective relationship (F(3, 401) = 7.48, ρ<.001, η
2 = .06), mastery
goal (F(3, 401) = 10.89, ρ<.001, η2 = .08), positive self-esteem (F(3, 401) = 13.18, ρ<.001, η
2 =
.09), and relational and collective-level like career orientation (F(3, 401) = 6.12, ρ<.001, η2 =
.04); and significant difference was found on negative self-esteem (F(3, 401) = 3.73, ρ<.05, η2 =
.03) (see Table 14). From descriptive statistics in Table 14, it was obvious that, if both parents in
a family held authoritative parenting styles but with more freedom given to their only child, best
outcomes were reached in comparison with other subgroups. Therefore

96
Table 14 Impact of Matches of Father and Mother Parenting Style on Children‘s Outcomes
Outcome/father and mother PS matches
M
SD
F
η2
Prosocial behavior
A. both parents authoritarian 2.61 .04 20.84*** .14
B. mother authoritarian, father
permissive-authoritative 2.96 .08
C. mother permissive-authoritative,
father authoritarian 2.96 .08
D. both parents permissive-authoritative 3.06 .04
Helping
A 2.58 .05 18.80*** .12
B 3.09 .11
C 3.01 .10
D 3.11 .05
Sharing and cooperation
A 2.68 .06 12.90*** .09
B 3.08 .12
C 3.00 .11
D 3.17 .06
Affective relationship
A 2.81 .06 7.48*** .06
B 2.98 .11
C 3.02 .10
D 3.17 .05
Mastery goal
A 3.00 .05 10.89*** .08
B 3.23 .10
C 3.25 .09
D 3.38 .05
Positive Self-Esteem
A 2.63 .05 13.18*** .09
B 2.87 .11
C 2.72 .10
D 3.09 .05
Negative Self-Esteem
A 2.03 .07 3.73* .03
B 1.72 .14
C 1.97 .13
D 1.74 .07
Relational and collective-level-like
career orientation
A 2.18 .06 6.12*** .04
B 2.48 .12
C 2.43 .11
D 2.52 .06
Note. Because of missing data, N ranged from 401 and 405, for group A , n ranged from 153
and 156, for B, n = 39, for C, n ranged from 42 and 43, and for D, n = 167; *** ρ<.001, **
ρ<.01, * ρ<.05

97
Hypothesis 4 proved to be true in that, when both parents in a family held authoritative parenting
style but with more freedom given to their child, best children outcomes were produced; when
both parents presented authoritarian parenting style, worst children outcomes were resulted in;
when one parent figure held authoritarian, the other held authoritative but with more freedom
given to their child, children outcomes produced were in the middle, that is, between the best and
worst outcomes.
9.3.5. Testing of Direct and Joint Effects of Learning Environments and Self-Concept Levels on
Student Outcomes (Hypothesis 5)
Hypothesis 5 predicted that the three learning environments would alone, but mostly together
with students‘ chronic self-concept levels exert their impacts on student outcomes, such as
academic achievement goals, social competence and self-esteem. In order to test this hypothesis,
a series of multiple hierarchical regression analyses were conducted respectively with academic
achievement goals, social competence and self-esteem as dependent variables and with the
following 3 blocks of variables as independent variables: corresponding learning environment
variables (1st block), individual level, relational level and collective level of self-concept (2
nd
block), and interaction terms between each learning environment variable and self-concept
levels (3rd
block). Results about these multiple hierarchical regression analyses are presented in
corresponding tables.
Effects on Academic Achievement Goals
Table 15 showed the results about regression of academic achievement goals on peer relations
and self-concept levels. Firstly, in the regression model of performance goal on peer relations
and self-concept levels, peer group acceptance acted as a significant predictor (ß = .13, ρ < .05)
in the 1st step (∆R
2 = .02, ρ < .01); in the 2
nd step, only individual level of chronic self-concept
(ß = .56, ρ < .001; ∆R2 = .31, ρ < .001) was a significant predictor; and in the 3
rd step, no
significant R2
change was reached. Therefore, data reported included only the first two steps in

98
Table 15 and the regression model with these 2 steps was significant as well (F(5, 399) = 39.03,
R2 = .33, ρ < .001). Secondly, in the regression model of mastery goal on peer relations and self-
concept levels, peer group acceptance (ß = .12, ρ <.05) and best friendship quality (ß = .35, ρ
<.001) were significant predictors in the first step (∆R2 = .17, ρ <.001); in the second step (∆R
2
= .21, ρ <.001), significant predictors were individual level (ß = .10, ρ <.05), relational level (ß =
.27, ρ <.001) and collective level (ß = .34, ρ <.001) of self-concept; the interaction between peer
group acceptance and collective level of self-concept (ß = .80, ρ <.05)were significant predictors
in the third step (∆R2 = .04, ρ <.001), and the overall regression model was also significant
(F(12, 392) = 24.37, R2 = .43, ρ < .001). Finally, in the regression model of avoidance goal on
peer relations and self-concept levels, peer group acceptance (ß = .11, ρ <.05) was significant
predictor in the first step (∆R2 = .02, ρ <.05); individual level of self-concept (ß = .25, ρ <.001)
were significant predictors in the second step (∆R2 = .02, ρ <.05); and in the 3
rd step, no
significant R2
change was reached. Therefore, data reported included only the first two steps in
Table 15 and the regression model with these 2 steps was significant as well (F(5, 399) = 7.16,
R2 = .08, ρ < .001). A conclusion could be reached that peer relations and chronic self-concept
levels exert their impacts on student academic achievement goals mainly through their direct
effects, while interaction effect between peer relations and chronic self-concept levels (peer
groups acceptance X collective level of self-concept) was found only in the impact on mastery
goal. Furthermore, more attention should be given to the greater impact of self-concept levels in
comparison with the impact of peer relations as a learning environment on academic
achievement goals (orientation).
Table 16 showed the results about regression of academic achievement goals on favourite
teacher interpersonal behavior and self-concept levels. Due to no significant interaction effects
on academic achievement goals in the analyses in the third step, data in the third step were not
reported in this table. Firstly, in the regression model of performance goal on favourite teacher

99
9
9
Table 15 Regression of Academic Achievement Goals on Peer Relations and Self-Concept Levels
Predictor Perform goal Mastery goal Avoidance goal
Step 1 Step 2 Step 1 Step 2 Step 3 Step 1 Step 2
B SE
B
β B SE
B
β B SE
B
β B SE
B
β B SE
B
β B SE
B
β B SE
B
β
PGA .15 .06 .13* .07 .06 .06 .11 .05 .12* -.02 .04 -.02 -.72 .28 -.80** -.15 .07 -.11* -.17 .08 -.12*
BFQ .05 .07 .04 .06 .06 .05 .35 .05 .35*** .10 .05 .10* .24 .29 .25 -.06 .08 -.04 .03 .09 .02
sclindiv .60 .05 .56*** .09 .03 .10* .32 .17 .37 .32 .06 .25***
sclrelat .03 .07 .03 .29 .06 .27*** .31 .21 .29 -.11 .10 -.07
sclcollect -.05 .07 -.04 .32 .05 .34*** .04 .19 .04 -.09 .10 -.07
PGA X
sclindiv
-.09 .05 -.38
PGA X
sclrelat
.05 .09 .24
PGA X
sclcollect
.15 .07 .80*
BFQ X
sclindiv
.00 .06 .01
BFQ X
sclrelat
-.08 .08 -.42
BFQ X
sclcollect
-.01 .07 -.06
∆ R2 .02** .31*** .17*** .21*** .04*** .02* .06***
R2 .33 .38 .43 .08
Note. Because of missing data, N ranged from 398 and 405. ***.ρ<.001, **.ρ<.01, *. ρ<.05. PGA = peer group acceptance, BFQ = best friendship
quality, sclindiv = individual level of self-concept, sclrelat = relational level of self-concept, sclcollect = collective level of self-concept.

100
1
0
0
Table 16 Regression of Academic Achievement Goals on Favourite Teacher Interpersonal Behavior and Self-Concept Levels
step predictor Performance goal Mastery goal Avoidance goal
B SE
B
β B SE
B
β B SE
B
β B SE
B
β B SE
B
β B SE
B
β
1 FT cooperative .06 .02 .15* .01 .02 .03 .10 .02 .32*** .03 .02 .08 .01 .03 .03 .02 .03 .05
FT opposition .03 .02 .08 .00 .02 -.00 -.03 .02 -.10 -.02 .02 -.07 .10 .03 .20*** .08 .03 .16**
FT strict .01 .06 .01 -.07 .05 -.06 .10 .05 .10* .07 .04 .07 .11 .07 .08 .08 .07 .06
2 sclindiv .61 .05 .56*** .08 .04 .09* .26 .06 .21***
sclrelat .04 .07 .03 .29 .06 .27*** -.06 .10 -.04
sclcollect -.01 .06 -.01 .31 .05 .33*** -.16 .09 -.11
∆ R2 .02* .31*** .15*** .25*** .05*** .05***
R2 .33 .40 .10
Note: Because of missing data, N ranged from 398 to 405. *ρ<.05. **ρ<.01. ***ρ<.001. It was found that there were no interaction effects
between favourite teachers‘ interpersonal behavior and self-concept, therefore the result table only show the results of the first two steps. FT =
favourite teacher; sclindiv = individual level of self-concept; sclrelat = relational level of self-concept; sclcollect = collective level of self-
concept.

101
interpersonal behavior and self-concept levels, favourite teacher cooperative behavior acted as a
significant predictor (ß = .15, ρ < .05) in the 1st step (∆R
2 = .02, ρ <.05); in the 2
nd step, only
individual level of chronic self-concept (ß = .56, ρ < .001; ∆R2 = .31, ρ < .001) and the
regression model with these 2 steps was significant as well (F(6, 398) = 32.30, R2 = .33, ρ <
.001). Secondly, in the regression model of mastery goal on favorite teacher interpersonal
behavior and self-concept levels, favorite teacher cooperative behavior (ß = .32, ρ <.001) and
favorite strict behavior (ß = .10, ρ <.05) were significant predictors in the first step (∆R2 = .15, ρ
<.001); in the second step (∆R2 = .25, ρ <.001), individual level (ß = .09, ρ <.05), relational level
(ß = .27, ρ <.001) and collective level (ß = .33, ρ <.001) of self-concept acted as significant
predictors and the regression model including these two steps of favorite teacher interpersonal
behavior and self-concept levels was also significant (F(6, 398) = 43.12, R2 = .40, ρ < .001).
Finally, in the regression model of avoidance goal on favourite teacher interpersonal behavior
and self-concept levels, favourite teacher opposition behavior (ß = .20, ρ <.001) was significant
predictor in the first step (∆R2 = .05, ρ <.001); individual level of self-concept (ß = .21, ρ <.001)
was also a significant predictor in the second step (∆R2 = .05, ρ <.001) and the model including
two steps was also significant (F(6, 398) = 7.15, R2 = .10, ρ < .001). A conclusion again could be
reached that some aspects of favourite teacher interpersonal behavior and chronic self-concept
levels exert impacts on student academic achievement goal orientation through their direct
effects. It was obvious that chronic self-concept levels contribute more than or at least equally
with (e.g., on avoidance goal) favourite teacher interpersonal behavior in terms of the variance
explained in academic goals.
In comparison with the effect of favourite teacher interpersonal behavior and self-concept
levels, table 17 revealed the results about regression of academic achievement goals on average
teacher interpersonal behavior and self-concept levels. Firstly, in the regression model of
performance goal on average teacher interpersonal behavior and self-concept levels, average

102
teacher cooperative behavior (ß = .18, ρ < .01) and average teacher opposition behavior (ß = .15,
ρ < .01) acted as significant predictors in the 1st step (∆R
2 = .03, ρ <.01); in the 2
nd step, only
individual level of chronic self-concept (ß = .55, ρ < .001; ∆R2 = .30, ρ < .001); in the third step,
no significant R2 was reached. Anyway, the regression model with the first 2 steps was
significant as well (F (5, 399) = 38.87, R2 = .33, ρ < .001). Secondly, in the regression model of
mastery goal on average teacher interpersonal behavior and self-concept levels, average teacher
cooperative behavior (ß = .19, ρ <.01) was a significant predictor in the first step (∆R2 = .03, ρ
<.01); in the second step (∆R2 = .35, ρ <.001), individual level (ß = .08, ρ <.05), relational level
(ß = .30, ρ <.001) and collective level (ß = .36, ρ <.001) of self-concept acted as significant
predictors; in the third step (∆R2 = .02, ρ <.05) and the overall model was significant as well (F
(5, 399) = 49.06, R2 = .40, ρ < .001). Finally, in the regression model of avoidance goal on
average teacher interpersonal behavior and self-concept levels, average teacher opposition
behavior (ß = .22, ρ <.001) was a significant predictor in the first step (∆R2 = .05, ρ <.001);
individual level of self-concept (ß = .22, ρ <.001) was also a significant predictor in the second
step (∆R2 = .06, ρ <.001); in the third step (∆R
2 = .03, ρ <.05), interaction terms AT (average
teacher) cooperative behavior X individual level (ß = -.54, ρ <.05) and AT opposition behavior X
individual level (ß = -.54, ρ <.05) were significant predictors and the overall model was
significant as well (F(11, 393) = 5.40, R2 = .14, ρ < .001). A conclusion again could be reached
that some aspects of average teacher interpersonal behavior and chronic self-concept levels exert
impacts on student academic achievement goal orientation through their direct effects and
interaction effects and again chronic self-concept levels contribute more than average teacher
interpersonal behavior in terms of the variance explained in academic goals. Furthermore,
average teacher interpersonal behavior seemed to have more interactions with student chronic
self-concept levels than favourite teacher interpersonal behavior.
In Table 18, results were revealed about the regression of academic achievement goals on

103
Table 17 Regression of Academic Achievement Goals on Average Teacher Interpersonal Behavior and Self-Concept Levels
Step
Predictor
Performance goal Mastery goal
B SE
B
β B SE
B
β B SE
B
β B SE
B
β B SE
B
β
1 AT cooperative .06 .02 .18** .03 .02 .08 .05 .01 .19** .01 .01 .03 -.05 .07 -.21
AT opposition .21 .08 .15** .05 .07 .04 .10 .06 .08 .07 .05 .07 .56 .27 .49*
2 sclindiv .59 .05 .55*** .07 .04 .08* .25 .20 .30
sclrelat .06 .07 .04 .33 .05 .30*** -.24 .36 -.22
sclcollect -.02 .06 -.01 .34 .05 .36*** .91 .31 .95**
3 AT cooperative X
sclindiv
-.02 .01 -.30
AT cooperative X
sclrelat
.07 .02 1.17**
AT cooperative X
sclcollect
-.04 .02 -.71
AT opposition X
sclindiv
-.01 .06 -.02
AT opposition X
sclrelat
-.03 .11 -.10
AT opposition X
sclcollect
-.11 .09 -.38
∆ R2 .03** .30*** .03** .35*** .02*
R2 .33 .38 .40

104
(Continued)
step predictor Avoidance goal
B SE B β B SE B β B SE B β
1 AT cooperative .00 .02 -.00 -.00 .02 -.01 .26 .13 .69*
AT opposition .36 .09 .22*** .29 .09 .17** -.24 .49 -.14
2 sclindiv .27 .06 .22*** 1.21 .35 .96**
sclrelat -.10 .10 -.06 -.30 .63 -.19
sclcollect -.14 .09 -.10 -.20 .56 -.14
3 AT cooperative X sclindiv -.05 .02 -.54*
AT cooperative X sclrelat -.04 .04 -.47
AT cooperative X sclcollect .00 .04 .02
AT opposition X sclindiv -.25 .11 -.54*
AT opposition X sclrelat .31 .19 .72
AT opposition X sclcollect .01 .17 .02
∆ R2 .05*** .06*** .03*
R2 .11 .14
Note: Because of missing data, N ranged from 398 to 405. *ρ<.05. **ρ<.01. ***ρ<.001; AT = average teacher; sclindiv = individual level of
self-concept, sclrelat = relational level of self-concept, sclcollect = collective level of self-concept; AT cooperative = average teacher
cooperative behavior; AT opposition = average teacher opposition behavior

105
Table 18 Regression of Academic Achievement Goals on Family Environment and Self-Concept Levels
Step
Predictor
Performance goal Avoidance goal
B SE B β B SE B β B SE B β B SE B β
1 feco .08 .05 .08 .03 .05 .03 .01 .06 .01 .06 .06 .08
father_PS .07 .05 .11 .06 .04 .11 .01 .06 .01 .01 .05 .01
mother_PS -.06 .05 -.10 -.08 .04 -.14* -.01 .06 -.02 -.01 .05 -.01
2 sclindiv .60 .05 .56*** .30 .06 .24***
sclrelat .06 .07 .04 -.11 .10 -.07
sclcollect -.00 .06 -.00 -.20 .09 -.14*
3 feco X sclindiv
feco X sclrelat
feco X sclcollect
father_PS X sclindiv
father_PS X sclrelat
father_PS X sclcollect
mother_PS X sclindiv
mother_PS X sclrelat
mother_PS X sclcollect
∆ R2 .01 .32*** .00 .07***
R2 .33 .07

106
(Continued)
Step
Predictor
Mastery goal
B SE B β B SE B β B SE B β
1 feco .11 .04 .14** -.06 .03 -.07 -.53 .18 -.70**
father_PS .05 .04 .11 .05 .03 .10 -.04 .19 -.09
mother_PS .08 .04 .17* .05 .03 .10 .42 .19 .91*
2 sclindiv .07 .03 .09* .07 .15 .08
sclrelat .31 .05 .29*** .46 .27 .42
sclcollect .33 .05 .35*** .19 .22 .20
3 feco X sclindiv -.02 .05 -.10
feco X sclrelat .03 .07 .15
feco X sclcollect .14 .06 .85*
father_PS X sclindiv -.01 .04 -.07
father_PS X sclrelat .08 .07 .70
father_PS X sclcollect -.04 .06 -.42
mother_PS X sclindiv .02 .04 .19
mother_PS X sclrelat -.12 .06 -1.09
mother_PS X sclcollect -.01 .05 -.14
∆ R2 .12*** .29*** .03*
R2 .41 .44
Note: Because of missing data, N ranged from 398 to 405. *ρ<.05. **ρ<.01. ***ρ<.001. father_PS = father parenting style; mother_PS =
mother parenting style; feco = family cohesion. sclindiv = individual level of self-concept, sclrelat = relational level of self-concept, sclcollect =
collective level of self-concept.

107
family environment (i.e., family cohesion, father and mother parenting styles) and self-concept
levels. Firstly, in the regression model of performance goal on family environment and self-
concept levels, the model with the first step (∆R2 = .01, ρ >.05) was not significant, in the second
step (∆R2 = .32, ρ <.001), significant predictors were found to be mother parenting style (ß = -
.14, ρ < .05) and individual level of self-concept (ß = .56, ρ < .001), and the third step did not
reach a significant R2 change (ρ >.05), but the regression model including the first two steps was
significant as well (F(6, 398) = 32.82, R2 = .33, ρ < .001). Secondly, in the regression model of
mastery goal on family environment and self-concept levels, family cohesion (ß = .14, ρ <.01)
and mother parenting style (ß = .17, ρ <.05) were significant predictors in the first step (∆R2 =
.12, ρ <.001); in the second step (∆R2 = .29, ρ <.001), individual level (ß = .09, ρ <.05), relational
level (ß = .29, ρ <.001) and collective level (ß = .35, ρ <.001) of self-concept acted as significant
predictors; in the third step (∆R2 = .03, ρ <.05), family cohesion (ß = -.70, ρ <.01), mother
parenting style (ß = .91, ρ <.05), and interaction between family cohesion and collective level of
self-concept (ß = .85, ρ <.05) were significant predictors and the overall model was significant as
well (F (15, 389) = 19.81, R2 = .44, ρ < .001). Finally, in the regression model of avoidance goal
on family environment and self-concept levels, the first step and third step did not reach a
significant R2 change, and only the second step reached a significant model (F (3, 398) = 10.60,
R2 = .07, ρ <.001) and significant predictors were individual level (ß = .24, ρ <.001) and
collective level (ß = -.14, ρ <.05) of self-concept. In summary, family environment variables
seemed to have no contribution to performance goal and avoidance goal, but family environment,
especially family cohesion and mother parenting style explained 12% of variance in mastery
goal. Still chronic self-concept contributed much more than family environment to all the three
academic achievement goals respectively.
In sum, in terms of the direct effects of each of the three learning environments on academic
goal orientation, almost all of them (except family environment on avoidance goal) made little

108
contribution to the explanation of the variance in either performance goal or avoidance goal
(explaining variance ranging from 2% and 5%), but on mastery goal, peer relations, favourite
teacher interpersonal behavior and family environment had great impact (explaining variance
ranging from 12% and 15%). In terms of the direct effects of chronic self-concept on academic
orientation, greater impacts were found on performance goal and mastery goal (explaining
variance ranging from 21% and 35%), while on avoidance goal, the impact was relative much
smaller (about around 5% of variance explained). Finally, except for favourite teacher
interpersonal behavior, the interaction effects between chronic self-concept and each of the 3
learning environments existed mainly on mastery goal and avoidance goal, but the effect size was
quite small although significant (around 2 or 3% of variance explained).
Effects on Social Competence
Table 19 presented results of regression of social competence on peer relations and chronic
self-concept levels. Firstly, in the regression model of anxious solitary behavior on peer relations
and self-concept levels, peer group acceptance acted as a significant predictor (ß = -.25, ρ <
.001) in the 1st step (∆R
2 = .09, ρ < .001); in the 2
nd step (∆R
2 = .03, ρ < .01), peer group
acceptance kept to be a significant predictor (ß = -.23) and new predictor was individual level of
chronic self-concept (ß = .16, ρ < .01); and in the 3rd
step, no significant R2
change was reached.
Therefore, data reported included only the first two steps in Table 19 and the regression model
with the first 2 steps was significant as well (F(5, 399) = 11.04, R2 = .12, ρ < .001). Secondly, in
the regression model of prosocial behavior on peer relations and self-concept levels, peer group
acceptance (ß = .16, ρ <.01) and best friendship quality (ß = .42, ρ <.001) were significant
predictors in the first step (∆R2 = .26, ρ <.001); in the second step (∆R
2 = .15, ρ <.001), best
friendship quality kept to be significant predictor (ß = .21, ρ <.001) and new significant
predictors were relational level (ß = .27, ρ <.001) and collective level (ß = .26, ρ <.001) of self-
concept; relational level of self-concept (ß = -.49, ρ <.05) and the interaction between peer

109
Table 19 Regression of Social Competence on Peer Relations and Self-Concept Levels
Step
predictor anxious solitary behavior prosocial behavior
B SE
B
β B SE B β B SE
B
β B SE
B
β B SE B β
1 PGA -.31 .07 -.25*** -.29 .07 -.23*** .13 .04 .16** .05 .04 .07 -.46 .24 -.57
BFQ -.13 .07 -.09 -.05 .08 -.04 .37 .04 .42*** .18 .04 .21*** -.06 .26 -.07
2 sclindiv .19 .06 .16** -.02 .03 -.03 .24 .15 .32
sclrelat -.04 .09 -.02 .26 .05 .27*** -.47 .18 -.49*
sclcollect -.15 .09 -.12 .22 .05 .26*** .02 .17 .03
3 PGA X
sclindiv
-.03 .04 -.17
PGA X sclrelat .16 .08 .90*
PGA X sclcollect .05 .07 .29
BFQ X
sclindiv
-.05 .05 -.25
BFQ X sclrelat .11 .07 .63
BFQ X sclcollect .04 .06 .21
∆ R2 .09*** .03** .26*** .15*** .03**
R2 .12 .41 .44

110
(Continued)
Step
predictor helping sharing and cooperation
B SE B β B SE B β B SE B β B SE B β B SE B β
1 PGA .08 .05 .08 .00 .05 .00 -.56 .33 -.56 .21 .05 .20*** .12 .05 .12*
BFQ .46 .05 .42*** .26 .06 .23*** -.00 .35 -.00 .41 .06 .35*** .20 .06 .17**
2 sclindiv -.05 .04 -.05 .38 .21 .41 -.06 .04 -.06
sclrelat .27 .07 .23*** -.62 .25 -.51* .26 .07 .20***
sclcollect .23 .06 .22*** -.08 .23 -.07 .27 .07 .24***
3 PGA X BFQ -.07 .08 -.31
PGA X sclindiv -.00 .06 -.01
PGA X sclrelat .18 .11 .81
PGA X sclcollect .04 .09 .20
BFQ X sclindiv -.13 .07 -.52*
BFQ X sclrelat .15 .10 .67
BFQ X sclcollect .08 .09 .38
∆ R2 .21*** .10*** .03** .22*** .10***
R2 .31 .34 .32

111
Continued
Step
Predictor Affective relationship
B SE B β B SE B β B SE B β
1 PGA .04 .05 .04 -.04 .05 -.04 -.79 .34 -.80*
BFQ .37 .06 .34*** .15 .06 .14** -.22 .35 -.20
2 sclindiv .07 .04 .07 .32 .21 .34
sclrelat .38 .07 .32*** -.53 .26 -.45*
sclcollect .14 .06 .14* .08 .23 .08
3 PGA X BFQ .00 .08 .02
PGA X sclindiv -.02 .06 -.09
PGA X sclrelat .16 .11 .70
PGA X sclcollect .08 .09 .38
BFQ X sclindiv -.05 .07 -.22
BFQ X sclrelat .18 .10 .86
BFQ X sclcollect -.04 .09 -.18
∆ R2 .13*** .13*** .03**
R2 .26 .29
Note. Because of missing data, N ranged from 398 to 405. *ρ<.05. **ρ<.01. ***ρ<.001. PGA = peer group acceptance, BFQ = best friendship
quality, sclindiv = individual level of self-concept, sclrelat = relational level of self-concept, sclcollect = collective level of self-concept

112
group acceptance and relational level of self-concept (ß = .90, ρ <.05) were significant predictors
in the third step (∆R2 = .03, ρ <.01), and the overall regression model was significant as well
(F(12, 388) = 25.66, R2 = .44, ρ < .001). Thirdly, in the regression model of helping behavior on
peer relations and self-concept levels, best friendship quality (ß = .42, ρ <.001) was significant
predictor in the first step (∆R2 = .21, ρ <.001); best friendship quality (ß = .23, ρ <.001) kept to
be significant predictor and new predictors were relational level (ß = .23, ρ <.001) and collective
level (ß = .22, ρ <.001) of self-concept in the second step (∆R2 = .10, ρ <.001); and in the 3
rd step
(∆R2 = .03, ρ <.01), relational level kept to be a significant predictor (ß = -.51, ρ <.05) and new
predictor was the interaction between best friendship quality and individual level of self-concept
(ß = -.52, ρ <.05), and the overall model was significant as well (F(12, 389) = 16.93, R2 = .34, ρ
< .001). Fourthly, in the regression model of sharing and cooperation behavior on peer relations
and self-concept levels, peer group acceptance (ß = .20, ρ < .001) and best friendship quality (ß =
.35, ρ < .001) acted as significant predictors in the 1st step (∆R
2 = .22, ρ < .001); in the 2
nd step
(∆R2 = .10, ρ < .001), peer group acceptance (ß = .12, ρ < .05) and best friendship quality (ß =
.17, ρ < .01) kept to be significant predictors and new predictors were relational level (ß = .20, ρ
< .001) and collective level (ß = .24, ρ < .001) of chronic self-concept; in the 3rd
step, no
significant R2
change was reached. Therefore, data reported included only the first two steps in
Table 19 and the regression model with the first 2 steps was significant as well (F(5, 398) =
37.65, R2 = .32, ρ < .001). Finally, in the regression model of affective relationship on peer
relations and self-concept levels, best friendship quality (ß = .34, ρ <.001) was a significant
predictor in the first step (∆R2 = .13, ρ <.001); in the second step (∆R
2 = .13, ρ <.001), best
friendship quality kept to be significant predictor (ß = .14, ρ <.01) and new significant predictors
were relational level (ß = .32, ρ <.001) and collective level (ß = .14, ρ <.05) of self-concept; in
the third step ((∆R2 = .03, ρ <.01)) peer group acceptance (ß = -.80, ρ <.05) and relational level
of self-concept (ß = -.45, ρ <.05) were significant predictors and the interactions between peer

113
relations and self-concept levels were no significant predictors, and the overall regression model
was significant as well (F(11, 393) = 14.88, R2 = .29, ρ < .001). Since it is said in China that a
teacher has two tasks: one is to transmit knowledge and to show the way about how to gain and
reflect knowledge and the other is to educate his students to act prosocially. In that sense, teacher
interpersonal behavior may exert influence on students‘ social competence. Next task is to test a
sub-hypothesis of Hypothesis 5: Alone or together with students‘ chronic self-concept levels,
favourite teacher interpersonal behavior would also influence students‘ social competence and
especially they would have more impact on students‘ prosocial behavior.
Table 20 showed the results of regression of social competence on favourite teacher
interpersonal behavior and self-concept levels. Firstly, in the regression model of anxious
solitary behavior on favourite teacher interpersonal behavior and self-concept levels, favourite
teacher opposition behavior (ß = .15, ρ < .01) and favorite teacher strict behavior (ß = .15, ρ <
.01) acted as significant predictors in the 1st step (∆R
2 = .06, ρ <.001); the 3
rd step did not reach a
significant R2
change and results were not reported. The regression model only including the
first two steps was significant as well (F (6, 398) = 8.40, R2 = .12, ρ <.001). Secondly, in
regression model of prosocial behavior on favorite teacher interpersonal behavior and self-
concept levels, favorite teacher cooperative behavior (ß = .26, ρ <.001) and favorite teacher
strict behavior (ß = .15, ρ <.01) were significant predictors in the first step (∆R2 = .11, ρ <.001);
in the second step (∆R2 = .28, ρ <.001), favorite strict behavior (ß = .14, ρ <.01), relational level
(ß = .32, ρ <.001) and collective level (ß = .34, ρ <.001) of self-concept acted as significant
predictors; in the third step (∆R2 = .04, ρ <.01), significant predictors were favorite teacher
opposition behavior (ß = .70, ρ <.05), interaction between favorite teacher cooperative behavior
and individual level of self-concept (ß = -.88, ρ <.01), and interaction between favorite teacher
strict behavior and relational level of self-concept (ß = -.81, ρ <.05) and the overall regression
model was significant as well (F(15, 385) = 19.48, R2 = .43, ρ < .001). Thirdly, in regression

114
Table 20 Regression of Social Competence on Favourite Teacher Interpersonal Behavior and Self-Concept Levels
step predictor Anxious solitary behavior prosocial behavior
B SE
B
β B SE
B
β B SE
B
β B SE
B
β B SE
B
β
1 FT cooperative -.01 .02 -.03 .02 .03 .04 .07 .02 .26*** .01 .01 .02 .07 .06 .24
FT opposition .07 .03 .15** .05 .03 .11* -.03 .02 -.09 -.01 .01 -.03 .20 .09 .70*
FT strict .20 .07 .15** .20 .07 .15** .13 .04 .15** .12 .04 .14** .30 .24 .35
2 sclindiv .12 .06 .10* -.04 .03 -.05 .46 .26 .62
sclrelat -.01 .09 -.01 .31 .05 .32*** .34 .41 .36
sclcollect -.32 .08 -.24*** .29 .04 .34*** .46 .37 .55
3 FT cooperative X
sclindiv
-.04 .02 -.88**
FT cooperative X
sclrelat
.04 .03 .84
FT cooperative X
sclcollect
-.03 .02 -.66
FT opposition X
sclindiv
-.02 .02 -.16
FT opposition X
sclrelat
-.05 .03 -.57
FT opposition X
sclcollect
-.00 .03 -.02
FT strict X sclindiv .05 .04 .24
FT strict X sclrelat -.17 .08 -.81*
FT strict X
sclcollect
.09 .07 .43
∆ R2 .06*** .06*** .11*** .28*** .04**
R2 .12 .39 .43

115
(Continued)
Step Predictor Helping Sharing and cooperation
B SE B β B SE
B
β B SE
B
β B SE
B
β B SE
B
β
1 FT cooperative .08 .02 .22*** .01 .02 .02 .12 .09 .35 .08 .02 .22*** .01 .02 .02
FT opposition -.02 .02 -.06 -.00 .02 -.01 .33 .12 .89** -.05 .02 -.14* -.03 .02 -.09
FT strict .13 .05 .12* .12 .05 .11* .16 .33 .15 .14 .06 .13* .13 .05 .12**
2 sclindiv -.08 .04 -.08 .13 .35 .13 -.06 .04 -.06
sclrelat .35 .07 .29*** .75 .56 .63 .30 .07 .23***
sclcollect .30 .06 .28*** .54 .51 .51 .37 .06 .33***
3 FT cooperative X
sclindiv
-.03 .02 -.45
FT cooperative X
sclrelat
.03 .04 .41
FT cooperative X
sclcollect
-.04 .03 -.73
FT opposition X
sclindiv
-.01 .02 -.04
FT opposition X
sclrelat
-.10 .04 -.86*
FT opposition X
sclcollect
.00 .04 .04
FT strict X sclindiv .08 .06 .29
FT strict X sclrelat -.18 .11 -.67
FT strict X sclcollect .12 .10 .46
∆ R2 .08*** .21*** .04* .10*** .20***
R2 .29 .33 .30

116
(Continued)
Step Predictor Affective relationship
B SE B β B SE B β B SE B β
1 FT cooperative .09 .02 .25*** .02 .02 .06 .09 .09 .26
FT opposition .01 .02 .02 .02 .02 .05 .28 .12 .78*
FT strict .15 .05 .14** .12 .05 .12** .11 .33 .10
2 sclindiv .03 .04 .03 .59 .36 .64
sclrelat .43 .07 .37*** .42 .56 .36
sclcollect .16 .06 .15** .26 .51 .25
3 FT cooperative X sclindiv -.05 .02 -.79*
FT cooperative X sclrelat .02 .04 .36
FT cooperative X sclcollect -.01 .03 -.15
FT opposition X sclindiv -.03 .02 -.26
FT opposition X sclrelat -.09 .04 -.83*
FT opposition X sclcollect .04 .04 .34
FT strict X sclindiv .07 .06 .26
FT strict X sclrelat .00 .11 .01
FT strict X sclcollect -.05 .10 -.18
∆ R2 .08*** .19*** .04*
R2 .27 .31
Note. Because of missing data, N ranged from 398 to 405. *ρ<.05. **ρ<.01. ***ρ<.001. FT = favourite teacher; sclindiv = individual level of self-
concept, sclrelat =relational level of self-concept, sclcollect = collective level of self-concept

117
model of helping behavior on favorite teacher interpersonal behavior and self-concept levels,
favorite teacher cooperative behavior (ß = .22, ρ <.001) and favorite teacher strict behavior (ß =
.12, ρ <.05) were significant predictors in the first step (∆R2 = .08, ρ <.001); in the second step
(∆R2 = .21, ρ <.001), favorite strict behavior (ß = .11, ρ <.05), relational level (ß = .29, ρ <.001)
and collective level (ß = .28, ρ <.001) of self-concept acted as significant predictors; in the third
step (∆R2 = .04, ρ <.05), significant predictors were favorite teacher opposition behavior (ß =
.89, ρ <.01), and interaction between favorite teacher opposition behavior and relational level of
self-concept (ß = -.86, ρ <.05) and the overall regression model was significant as well (F(15,
386) = 12.27, R2 = .33, ρ < .001). Fourthly, in the regression model of sharing and cooperation
behavior on favourite teacher interpersonal behavior and self-concept levels, favourite teacher
cooperative behavior (ß = .22, ρ <.001), opposition behavior (ß = -.14, ρ <.05) and strict
behavior (ß = .13, ρ <.05) were significant predictors in the first step (∆R2 = .10, ρ <.001);
favorite teacher strict behavior kept to be a significant predictor (ß = .12, ρ <.01) and relational
level (ß = .23, ρ <.001) and collective level of self-concept (ß = .33, ρ <.001) were also
significant predictors in the second step (∆R2 = .20, ρ <.001); the third step did not reach a
significant R2
change; and the model including the first two steps was also significant (F(6, 397)
= 28.50, R2 = .30, ρ < .001). Finally, in regression model of affective relationship on favorite
teacher interpersonal behavior and self-concept levels, favorite teacher cooperative behavior (ß
= .25, ρ <.001) and favorite teacher strict behavior (ß = .14, ρ <.01) were significant predictors
in the first step (∆R2 = .08, ρ <.001); in the second step (∆R
2 = .19, ρ <.001), favorite strict
behavior (ß = .12, ρ <.01), relational level (ß = .37, ρ <.001) and collective level (ß = .15, ρ
<.01) of self-concept acted as significant predictors; in the third step (∆R2 = .04, ρ <.05),
significant predictors were favorite teacher opposition behavior (ß = .78, ρ <.05), interaction
between favorite teacher cooperative behavior and individual level of self-concept (ß = -.79, ρ
<.05) and interaction between opposition behavior and relational level of self-concept; and the

118
Table 21 Regression of Social Competence on Average Teacher Interpersonal Behavior and Self-Concept Levels
step predictor Anxious solitary behavior Prosocial behavior
B SE
B
β B SE
B
β B SE
B
β B SE
B
β B SE
B
β B SE
B
β
1 AT cooperative -.04 .02 -.12* -.03 .02 -.09 .24 .12 .68* .03 .01 .12* -.00 .01 -.02 -.21 .06 -.95**
AT opposition .22 .08 .14** .18 .08 .12* .38 .45 .24 .13 .06 .13* .13 .05 .13** .88 .24 .87***
2 sclindiv .15 .06 .13** .63 .33 .53 -.04 .03 -.05 .10 .17 .13
sclrelat -.04 .09 -.03 -.14 .59 -.09 .31 .05 .33*** .16 .31 .17
sclcollect -.27 .08 -.20 .32 .52 .24 .32 .04 .38*** .27 .27 .33
3 AT cooperative X
sclindiv
-.00 .02 -.03 -.01 .01 -.18
AT cooperative X
sclrelat
-.02 .04 -.22 .06 .02 1.10**
AT cooperative X
sclcollect
-.06 .04 -.79 .01 .02 .19
AT opposition X
sclindiv
-.25 .10 -.58* -.02 .05 -.08
AT opposition X
sclrelat
.14 .18 .35 -.19 .09 -.74*
AT opposition X
sclcollect
-.04 .16 -.10 -.02 .08 -.06
∆ R2 .05*** .06*** .03* .02* .37*** .05***
R2 .11 .14 .39 .44

119
(Continued)
step predictor helping Sharing and cooperation
B SE
B
β B SE
B
β B SE
B
β B SE
B
β B SE
B
β B SE
B
β
1 AT cooperative .04 .02 .16** .01 .01 .05 -.17 .08 -.61* .03 .02 .09 -.01 .01 -.03 -.35 .09 -1.16***
AT opposition .21 .07 .17** .22 .06 .17*** 1.14 .32 .90*** .10 .07 .07 .11 .06 .09 .78 .34 .58*
2 sclindiv -.09 .04 -.09* .04 .23 .04 -.07 .04 -.07 .03 .24 .03
sclrelat .36 .06 .30*** .17 .42 .14 .32 .07 .25*** -.29 .44 -.23
sclcollect .32 .06 .30*** .48 .37 .46 .42 .06 .37*** .47 .39 .42
3 AT cooperative X sclindiv -.01 .02 -.11 -.01 .02 -.13
AT cooperative X sclrelat .08 .03 1.15** .10 .03 1.42**
AT cooperative X
sclcollect
-.02 .03 -.30 .01 .03 .09
AT opposition X sclindiv -.03 .07 -.09 -.00 .07 -.01
AT opposition X sclrelat -.26 .13 -.78* -.15 .13 -.43
AT opposition X
sclcollect
.00 .11 .01 -.04 .12 -.12
∆ R2 .03** .27*** .04** .00 .29*** .05***
R2 .30 .34 .29 .34

120
(Continued)
step predictor Affective relationship
B SE B β B SE B β
1 AT cooperative .01 .02 .05 -.02 .01 -.06
AT opposition .16 .07 .13* .15 .06 .12*
2 sclindiv .05 .04 .05
sclrelat .43 .06 .36***
sclcollect .21 .06 .20***
3 AT cooperative X
sclindiv
AT cooperative X
sclrelat
AT cooperative X
sclcollect
AT opposition X
sclindiv
AT opposition X
sclrelat
AT opposition X
sclcollect
∆ R2 .01 .26***
R2 .27
Note. Because of missing data, N ranged from 398 to 405. *ρ<.05. **ρ<.01. ***ρ<.001. AT =
average teacher; sclindiv = individual level of self-concept, sclrelat = relational level of
self-concept, sclcollect = collective level of self-concept
Overall regression model was significant as well (F (15, 389) = 11.13, R2 = .31, ρ < .001).
In comparison with the effect of favourite teacher interpersonal behavior and self-concept
levels, table 21 revealed the results about regression of social competence on average teacher
interpersonal behavior and self-concept levels. Firstly, in the regression model of anxious
solitary behavior on average teacher interpersonal behavior and self-concept levels, average
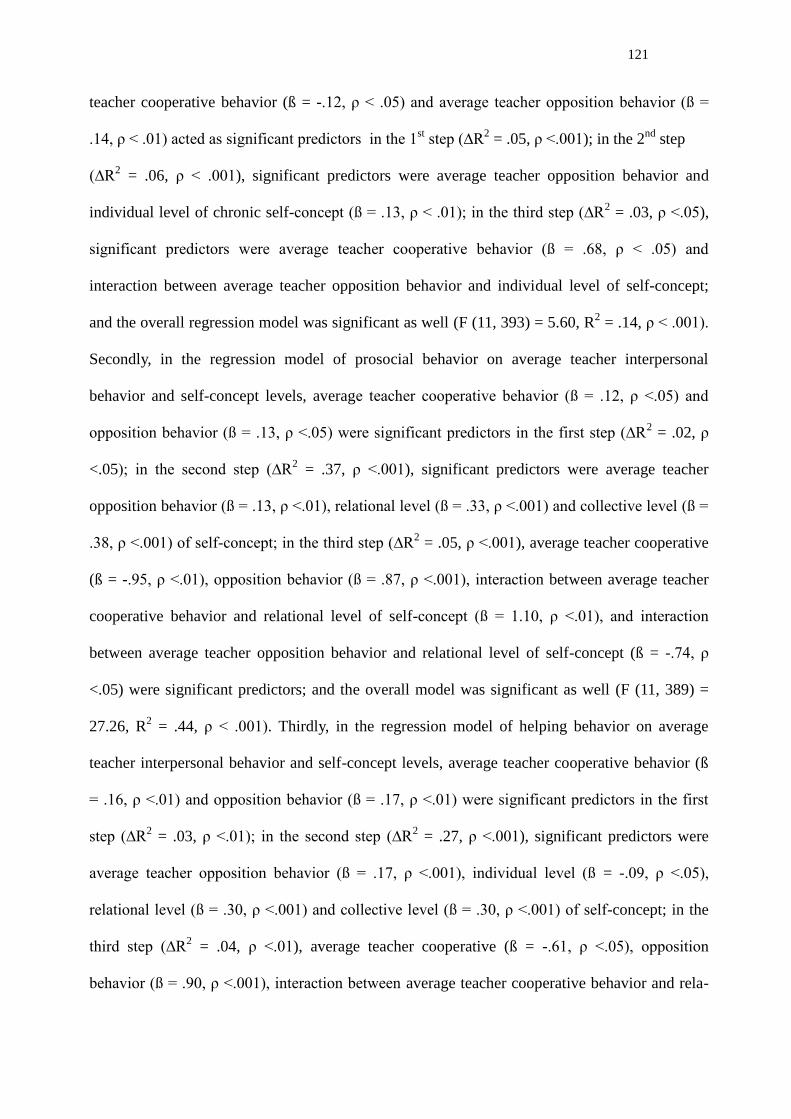
121
teacher cooperative behavior (ß = -.12, ρ < .05) and average teacher opposition behavior (ß =
.14, ρ < .01) acted as significant predictors in the 1st step (∆R
2 = .05, ρ <.001); in the 2
nd step
(∆R2 = .06, ρ < .001), significant predictors were average teacher opposition behavior and
individual level of chronic self-concept (ß = .13, ρ < .01); in the third step (∆R2 = .03, ρ <.05),
significant predictors were average teacher cooperative behavior (ß = .68, ρ < .05) and
interaction between average teacher opposition behavior and individual level of self-concept;
and the overall regression model was significant as well (F (11, 393) = 5.60, R2 = .14, ρ < .001).
Secondly, in the regression model of prosocial behavior on average teacher interpersonal
behavior and self-concept levels, average teacher cooperative behavior (ß = .12, ρ <.05) and
opposition behavior (ß = .13, ρ <.05) were significant predictors in the first step (∆R2 = .02, ρ
<.05); in the second step (∆R2 = .37, ρ <.001), significant predictors were average teacher
opposition behavior (ß = .13, ρ <.01), relational level (ß = .33, ρ <.001) and collective level (ß =
.38, ρ <.001) of self-concept; in the third step (∆R2 = .05, ρ <.001), average teacher cooperative
(ß = -.95, ρ <.01), opposition behavior (ß = .87, ρ <.001), interaction between average teacher
cooperative behavior and relational level of self-concept (ß = 1.10, ρ <.01), and interaction
between average teacher opposition behavior and relational level of self-concept (ß = -.74, ρ
<.05) were significant predictors; and the overall model was significant as well (F (11, 389) =
27.26, R2 = .44, ρ < .001). Thirdly, in the regression model of helping behavior on average
teacher interpersonal behavior and self-concept levels, average teacher cooperative behavior (ß
= .16, ρ <.01) and opposition behavior (ß = .17, ρ <.01) were significant predictors in the first
step (∆R2 = .03, ρ <.01); in the second step (∆R
2 = .27, ρ <.001), significant predictors were
average teacher opposition behavior (ß = .17, ρ <.001), individual level (ß = -.09, ρ <.05),
relational level (ß = .30, ρ <.001) and collective level (ß = .30, ρ <.001) of self-concept; in the
third step (∆R2 = .04, ρ <.01), average teacher cooperative (ß = -.61, ρ <.05), opposition
behavior (ß = .90, ρ <.001), interaction between average teacher cooperative behavior and rela-

122
Table 22 Regression of Social Competence on Family Environment and Self-Concept Levels
Step
Predictor
Anxious solitary behavior Prosocial behavior
B SE B β B SE B β B SE B β B SE B β
1 feco -.14 .06 -.14* -.07 .06 -.07 .07 .03 .11* -.06 .03 -.09*
father_PS -.04 .05 -.06 -.03 .05 -.05 .04 .03 .11 .04 .02 .10
mother_PS .02 .05 .03 .03 .05 .04 .13 .03 .32*** .10 .02 .25***
2 sclindiv .17 .06 .14** -.03 .03 -.05
sclrelat -.02 .09 -.02 .28 .05 .30***
sclcollect -.29 .08 -.22*** .28 .04 .33***
∆ R2 .02* .06*** .21*** .25***
R2 .08 .46
Continued
Step
Predictor
Helping behavior Sharing and cooperation
B SE B β B SE B β B SE B β B SE B β
1 feco .11 .04 .13* -.03 .04 -.03 .10 .04 .11* -.06 .04 -.07
father_PS .08 .04 .15* .07 .03 .14* .05 .04 .09 .04 .04 .08
mother_PS .12 .04 .24** .09 .03 .18** .13 .04 .24** .10 .04 .18**
2 sclindiv -.07 .04 -.08 -.07 .04 -.07
sclrelat .32 .06 .26*** .29 .07 .23***
sclcollect .27 .06 .25*** .37 .06 .33***
∆ R2 .18*** .17*** .14*** .20***
R2 .35 .34

123
Continued
Step
Predictor
Affective relationship
B SE
B
β B SE
B
β
1 feco .00 .04 .00 -.14 .04 -.17***
father_PS .01 .04 .02 .01 .03 .01
mother_PS .15 .04 .29*** .11 .03 .22**
2 sclindiv .05 .04 .05
sclrelat .42 .06 .36***
sclcollect .19 .06 .18**
∆ R2 .10*** .21***
R2 .31
Note: Because of missing data, N ranged from 398 to 405. *ρ<.05. **ρ<.01. ***ρ<.001. feco
= family cohesion, father_PS = father parenting style, mother_PS = mother parenting style,
sclindiv = individual level of self-concept, sclrelat = relational level of self-concept,
sclcollect = collective level of self-concept
relational level of self-concept (ß = 1.15, ρ <.01), and interaction between average teacher
opposition behavior and relational level of self-concept (ß = -.78, ρ <.05) were significant
predictors; and the overall model was significant as well (F (11, 390) = 17.69, R2 = .34, ρ < .001).
Fourthly, in the regression model of sharing and cooperation behavior on average teacher
interpersonal behavior and self-concept levels, average teacher interpersonal behavior did not
contribute to the explanation of variance in sharing and cooperative behavior in the first step
(∆R2 = .00, ρ >.05); in the second step (∆R
2 = .29, ρ <.001), significant predictors were relational
level (ß = .25, ρ <.001) and collective level (ß = .37, ρ <.001) of self-concept; in the third step
(∆R2 = .05, ρ <.001), average teacher cooperative (ß = -1.16, ρ <.001), opposition behavior (ß =
.58, ρ <.05), and interaction between average teacher cooperative behavior and relational level of
self-concept (ß = 1.42, ρ <.01) were significant predictors; and the overall model was significant
as well (F (11, 392) = 18.23, R2 = .34, ρ < .001). Finally, in the regression model of affective

124
relationship on average teacher interpersonal behavior and self-concept levels, first step and third
step regression did not reach a significant R2
change (ρ >.05); only in the second step (∆R2 = .26,
ρ <.001), significant predictors were found to be average teacher opposition behavior (ß = .12, ρ
<.05), relational level (ß =.36, ρ <.001) and collective level of self-concept (ß = .20, ρ <.001);
and the regression model including the first two steps was significant as well (F(5, 399) = 29.65,
R2 = .27, ρ < .001).
In Table 22, results were revealed about the regression of social competence on family
environment (i.e., family cohesion, father and mother parenting styles) and self-concept levels.
Since in all the regression models of social competence variables, third step did not reach a
significant R2 change, data were not reported in the Table 22. Firstly, in the regression model of
anxious solitary behavior on family environment and self-concept levels, family cohesion was a
significant predictor in the first step (∆R2 = .02, ρ <.05); in the second step (∆R
2 = .06, ρ <.001),
significant predictors were found to be collective level (ß = -.22, ρ < .001) and individual level
of self-concept (ß = .14, ρ < .01); the third step did not reach a significant R2 change (ρ >.05),
but the regression model including the first two steps was significant as well (F(6, 398) = 5.82,
R2 = .08, ρ < .001). Secondly, in the regression model of prosocial behavior on family
environment and self-concept levels, family cohesion (ß = .11, ρ <.05) and mother parenting
style (ß = .32, ρ <.001) were significant predictors in the first step (∆R2 = .21, ρ <.001); in the
second step (∆R2 = .25, ρ <.001), family cohesion (ß = -.09, ρ <.05), mother parenting style (ß =
.25, ρ <.001), relational level (ß = .30, ρ <.001) and collective level (ß = .33, ρ <.001) of self-
concept acted as significant predictors; in the third step no significant R2
change was reached,
but the regression model including the first two steps was significant as well (F (6, 394) = 56.52,
R2 = .46, ρ < .001). Thirdly, in the regression model of helping behavior on family environment
and self-concept levels, family cohesion (ß = .13, ρ <.05), father parenting style (ß = .15, ρ <.05)
and mother parenting style (ß = .24, ρ <.01) were significant predictors in the first step (∆R2 =

125
.18, ρ <.001); father parenting style (ß = .14, ρ <.05), mother parenting style (ß = .18, ρ <.01),
relational level (ß = .26, ρ <.001) and collective level (ß = .25, ρ <.001) were significant
predictors in the second step (∆R2 = .17, ρ <.001); the third step did not reach a significant R
2
change, but the regression model including only the first two steps was significant as well (F (6,
395) = 35.46, R2 = .35, ρ <.001). Fourthly, the regression model of sharing and cooperation
behavior on family environment and self-concept levels, family cohesion (ß = .11, ρ <.05) and
mother parenting style (ß = .24, ρ <.01) were significant predictors in the first step (∆R2 = .14, ρ
<.001); mother parenting style (ß = .18, ρ <.01), relational level (ß = .23, ρ <.001) and collective
level (ß = .33, ρ <.001) were significant predictors in the second step (∆R2 = .20, ρ <.001); the
third step did not reach a significant R2 change, but the regression model including only the first
two steps was significant as well (F (6, 397) = 33.47, R2 = .34, ρ <.001). Finally, in the
regression model of affective relationship on family environment and self-concept levels, mother
parenting style (ß = .29, ρ <.001) was a significant predictor in the first step (∆R2 = .10, ρ
<.001); family cohesion (ß = -.17, ρ <.001), mother parenting style (ß = .22, ρ <.01), relational
level (ß = .36, ρ <.001) and collective level (ß = .18, ρ <.01) were significant predictors in the
second step (∆R2 = .31, ρ <.001); the third step did not reach a significant R
2 change, but the
regression model including only the first two steps was significant as well (F (6, 398) = 28.75,
R2 = .31, ρ <.001).
In sum, in terms of the direct effects of each of the three learning environments, although all of
them have direct effect on anxious solitary behavior (∆R2 ranging between .02 and .09), peer
relations and teacher interpersonal behavior had larger effect than family effect; while on
prosocial behaviors, peer relations were largest contributor (∆R2 ranging between .13 and .26),
the second contributor was family environment (∆R2 ranging between .10 and .21), the third
was favourite teacher interpersonal behavior (∆R2 ranging between .06 and .11) and average
teacher interpersonal behavior was least contributor (∆R2 ranging between .00 and .05). Chronic

126
self-concept levels contributed not much directly to anxious solitary behavior (∆R2 ranging
between .03 and .06) and contributed much directly to prosocial behaviors (∆R2 ranging
between .10 and .37). Finally, interaction effects between chronic self-concept levels and
learning environments such as teacher interpersonal behaviors and peer relations existed on
prosocial behaviors, but on anxious solitary behavior existed only interaction effect between
average teacher interpersonal behavior and chronic self-concept levels.
Effects on Self-Esteem
Table 23 showed the results about regression of self-esteem on peer relations and self-concept
levels. Firstly, in the regression model of positive self-esteem on peer relations and self-concept
levels, peer group acceptance (ß = .23, ρ < .001) and best friendship quality (ß = .34, ρ < .001)
acted as significant predictors in the 1st step (∆R
2 = .23, ρ < .001); in the 2
nd step (∆R
2 = .05, ρ <
.001), peer group acceptance (ß = .18, ρ < .001) and best friendship quality (ß = .22, ρ < .001)
kept to be significant predictors and one new significant predictor was found to be relational
level of chronic self-concept (ß = .19, ρ < .01); in the 3rd
step, no significant R2
change was
reached. Therefore, data reported included only the first two steps in Table 23 and the regression
model with these 2 steps was significant as well (F(5, 399) = 31.55, R2 = .28, ρ < .001).
Secondly, in the regression model of negative self-esteem on peer relations and self-concept
levels, peer group acceptance (ß = -.27, ρ <.001) was significant predictor in the first step (∆R2 =
.09, ρ <.001); in the second step (∆R2 = .04, ρ <.01), peer group acceptance (ß = -.29, ρ <.001)
kept to be significant predictor and one new significant predictor was individual level (ß = .19,
ρ<.001); in the third step (∆R2 = .04, ρ <.01), best friendship quality (ß = .79, ρ <.05) kept to be
significant predictor; and the overall regression model was also significant (F(12, 392) = 6.56,
R2 = .17, ρ < .001).
Table 24 showed the results about regression of self-esteem on favourite teacher interpersonal
behavior and self-concept levels. Firstly, in the regression model of negative self-esteem on

127
Table 23 Regression of Self-Esteem on Peer Relations and Self-Concept Levels
Step
Predictor Positive Self-Esteem Negative Self-E
B SE B β B SE B β B SE B β B SE B β B SE B β
1 PGA .23 .05 .23*** .18 .05 .18*** -.33 .06 -.27*** -.35 .07 -.29*** .13 .45 .11
BFQ .38 .05 .34*** .24 .06 .22*** -.09 .07 -.07 -.02 .08 -.02 1.06 .47 .79*
2 sclindiv .05 .04 .05 .21 .06 .19*** .25 .28 .22
sclrelat .23 .07 .19** -.15 .09 -.10 .25 .34 .17
sclcollect .10 .06 .09 -.02 .08 -.02 .09 .31 .07
3 PGA X BFQ -.16 .11 -.58
PGA X sclindiv .06 .08 .20
PGA X sclrelat -.04 .15 -.14
PGA X sclcollect -.01 .12 -.02
BFQ X sclindiv -.07 .09 -.24
BFQ X sclrelat -.10 .14 -.39
BFQ X sclcollect -.06 .12 -.22
∆ R2 .23*** .05*** .09*** .04** .04**
R2 .28 .13 .17
Note: Because of missing data, N ranged from 398 to 405. *ρ<.05. **ρ<.01. ***ρ<.001. PGA = peer group acceptance, BFQ = best friendship
quality, sclindiv = individual level of self-concept, sclrelat = relational level of self-concept, sclcollect = collective level of self-concept

128
Table 24 Regression of Self-Esteem on Favourite Teacher Interpersonal Behavior and Self-Concept Levels
step predictor Negative self-esteem Positive self-esteem
B SE B β B SE B β B SE B β B SE B β B SE B β
1 FT cooperative .02 .02 .05 .05 .03 .12 .10 .02 .28*** .04 .02 .11* .04 .09 .12
FT opposition .10 .03 .23*** .09 .03 .20** .00 .02 .01 .01 .02 .04 .29 .12 .77*
FT strict .04 .07 .03 .03 .06 .03 .13 .05 .12* .11 .05 .11* .59 .34 .55
2 sclindiv .14 .06 .13* .03 .04 .03 .07 .37 .08
sclrelat -.12 .09 -.08 .28 .07 .24*** .43 .59 .36
sclcollect -.21 .08 -.16** .24 .06 .22*** .66 .53 .62
3 FT cooperative X sclindiv -.01 .02 -.07
FT cooperative X sclrelat .06 .04 .93
FT cooperative X sclcollect -.06 .03 -.98
FT opposition X sclindiv .00 .02 .02
FT opposition X sclrelat -.07 .04 -.59
FT opposition X sclcollect -.02 .04 -.16
FT strict X sclindiv .01 .06 .03
FT strict X sclrelat -.28 .11 -1.05*
FT strict X sclcollect .14 .11 .54
∆ R2 .05*** .05*** .09*** .14*** .04*
R2 .10 .23 .27
Note: Because of missing data, N ranged from 398 to 405. *ρ<.05. **ρ<.01. ***ρ<.001. FT = favourite teacher, sclindiv = individual level of
self-concept, sclrelat = relational level of self-concept, sclcollect = collective level of self-concept

129
Table 25 Regression of Self-Esteem on Average Teacher Interpersonal Behavior and Self-Concept Levels
Step Predictor Positive self-esteem Negative self-esteem
B SE
B
β B SE
B
β B SE
B
β B SE
B
β B SE
B
β
1 AT cooperative .02 .02 .08 -.01 .01 -.04 -.17 .09 -.59 -.01 .02 -.04 -.00 .02 -.01
AT opposition .19 .07 .15** .18 .06 .14** 1.27 .33 1.01*** .23 .08 .15** .18 .08 .12*
2 sclindiv .04 .04 .04 .28 .24 .30 .16 .06 .14**
sclrelat .30 .07 .25*** .21 .43 .17 -.14 .09 -.09
sclcollect .29 .06 .28*** .44 .38 .42 -.18 .08 -.14*
3 AT cooperative X sclindiv -.02 .02 -.28
AT cooperative X sclrelat .06 .03 .97*
AT cooperative X
sclcollect
-.01 .03 -.09
AT opposition X sclindiv -.03 .07 -.09
AT opposition X sclrelat -.25 .13 -.77
AT opposition X sclcollect -.05 .12 -.16
∆ R2 .02* .22*** .04** .03** .05***
R2 .24 .28 .08
Note: Because of missing data, N ranged from 398 to 405. *ρ<.05. **ρ<.01. ***ρ<.001. AT = average teacher, sclindiv = individual level of
self-concept, sclrelat = relational level of self-concept, sclcollect = collective level of self-concept

130
Table 26 Regression of Self-Esteem on Family Environment and Self-Concept Levels
Step
Predictor
Positive self-esteem Negative self-esteem
B SE
B
β B SE
B
β B SE
B
β B SE
B
β B SE
B
β B SE
B
β
1 feco .08 .04 .09 -.05 .04 -.06 -.53 .22 -.63* -.10 .05 -.09 -.04 .06 -.04 .33 .30 .32
father_PS .16 .04 .32*** .16 .04 .31*** .30 .22 .58 -.06 .05 -.10 -.06 .05 -.09 .43 .31 .69
mother_PS .02 .04 .04 -.01 .04 -.02 .21 .23 .41 -.03 .05 -.05 -.02 .05 -.04 -.17 .31 -.27
2 Sclindiv .04 .04 .05 .17 .18 .18 .19 .06 .17** -.07 .25 -.06
sclrelat .28 .07 .23*** .45 .32 .37 -.11 .09 -.07 -.02 .44 -.01
sclcollect .23 .06 .22*** .05 .27 .05 -.17 .08 -.13* .69 .37 .54
3 fecoXsclindiv -.06 .05 -.24 -.03 .07 -.09
feco Xsclrelat .12 .08 .65 -.05 .11 -.22
fecoXsclcollect .07 .07 .36 -.05 .10 -.22
father_PS X
sclindiv
-.11 .05 -.78* .13 .06 .78*
father_PS X
sclrelat
.13 .08 1.08 -.13 .11 -.87
father_PS X
sclcollect
-.11 .07 -.92 -.10 .10 -.74
mother_PS X
sclindiv
.12 .05 .85* -.07 .07 -.40
mother_PS X
sclrelat
-.24 .08 -1.99** .13 .10 .94
mother_PS X
sclcollect
.10 .06 .86 -.05 .09 -.35
∆ R2 .15*** .14*** .04** .04** .05*** .05*
R2 .29 .33 .09 .14
Note: Because of missing data, N ranged from 398 to 405. *ρ<.05. **ρ<.01. ***ρ<.001. feco = family cohesion, father_PS = father parenting
style, mother_PS = mother parenting style, sclindiv = individual level of self-concept, sclrelat = relational level of self-concept, sclcollect =
collective level of self-concept

131
favourite teacher interpersonal behavior and self-concept levels, favourite teacher opposition
behavior acted as a significant predictor (ß = .23, ρ < .001) in the 1st step (∆R
2 = .05, ρ <.001); in
the 2nd
step (∆R2 = .05, ρ <.001), favorite teacher opposition behavior (ß = .20, ρ < .01) kept to
be one of the significant predictors and new significant predictors were individual level (ß = .13,
ρ < .05) and collective level (ß = -.16, ρ < .01) of chronic self-concept; due to no significant
interaction effects on negative self-esteem in the analysis in the third step, data in the third step
were not reported in Table 24; and the regression model with the first 2 steps was significant as
well (F(6, 398) = 7.16, R2 = .10, ρ < .001). Secondly, in the regression model of positive self-
esteem on favorite teacher interpersonal behavior and self-concept levels, favorite teacher
cooperative behavior (ß = .28, ρ <.001) and favorite strict behavior (ß = .12, ρ <.05) were
significant predictors in the first step (∆R2 = .09, ρ <.001); in the second step (∆R
2 = .14, ρ
<.001), favorite teacher cooperative behavior (ß = .11, ρ <.05) and favorite strict behavior (ß =
.11, ρ <.05) kept to be significant predictors and new predictors were relational level (ß = .24, ρ
<.001) and collective level (ß = .22, ρ <.001) of self-concept; in the third step (∆R2 = .04, ρ
<.05), favorite teacher opposition behavior (ß = .77, ρ <.05) and the interaction between favorite
teacher strict behavior and relational level of self-concept (ß = -1.05, ρ <.05) were significant
predictors; and the overall regression model was significant as well (F(15, 389) = 9.56, R2 = .27,
ρ < .001).
In comparison with the effect of favourite teacher interpersonal behavior and self-concept
levels, table 25 revealed the results about regression of self-esteem on average teacher
interpersonal behavior and self-concept levels. Firstly, in the regression model of positive self-
esteem on average teacher interpersonal behavior and self-concept levels, average teacher
opposition behavior (ß = .15, ρ < .01) acted as significant predictor in the 1st step (∆R
2 = .02, ρ
<.05); in the 2nd
step (∆R2 = .22, ρ <.001), average teacher opposition behavior (ß = .14, ρ < .01),
relational level (ß = .25, ρ < .001) and collective level (ß = .28, ρ < .001) of chronic self-concept

132
were significant predictors; in the third step (∆R2 = .04, ρ <.01), significant predictors were
average teacher opposition behavior (ß = 1.01, ρ < .001), and interaction between average teacher
cooperative behavior and relational level of self-concept (ß = .97, ρ < .05); and the overall
regression model was significant as well (F(11, 393) = 13.62, R2 = .28, ρ < .001). Secondly, in
the regression model of negative self-esteem on average teacher interpersonal behavior and self-
concept levels, average teacher opposition behavior (ß = .15, ρ <.01) was a significant predictor
in the first step (∆R2 = .03, ρ <.01); in the second step (∆R
2 = .05, ρ <.001), average teacher
opposition behavior (ß = .12, ρ < .05), individual level (ß = .14, ρ <.01) and collective level (ß = -
.14, ρ <.05) of self-concept acted as significant predictors; in the third step, no significant R2
change was reached and data were not reported in Table 25; and the regression model including
the first 2 steps was significant as well (F (5, 399) = 7.02, R2 = .08, ρ < .001).
In Table 26, results were revealed about the regression of self-esteem on family environment
(i.e., family cohesion, father and mother parenting styles) and self-concept levels. Firstly, in the
regression model of positive self-esteem on family environment and self-concept levels, in the
first step (∆R2 = .15, ρ <.001), father parenting style was significant predictor (ß = .32, ρ <.001);
in the second step (∆R2 = .14, ρ <.001), significant predictors were found to be father parenting
style (ß = .31, ρ < .001), relational level (ß = .23, ρ < .001)and collective level of self-concept (ß
= .22, ρ < .001); in the third step (∆R2 = .04, ρ <.01), significant predictors were family cohesion
(ß = -.63, ρ < .05), interaction between father parenting style and individual level of self-concept
(ß = -.78, ρ < .05), interaction between mother parenting style and relational level of self-concept
(ß = -1.99, ρ < .01), and interaction between mother parenting style and individual level of self-
concept (ß = .85, ρ < .05); and the overall regression model was significant as well (F(15, 389) =
12.75, R2 = .33, ρ < .001). Secondly, in the regression model of negative self-esteem on family
environment and self-concept levels, in the first step (∆R2 = .04, ρ <.01); in the second step (∆R
2
= .05, ρ <.001), individual level (ß = .17, ρ <.01) and collective level (ß = -.13, ρ <.05) of self-

133
concept acted as significant predictors; in the third step (∆R2 = .05, ρ <.05), the significant
predictor was the interaction between father parenting style and individual level of self-concept
(ß = .78, ρ <.05); and the overall regression model was significant as well (F (15, 389) = 3.92, R2
= .14, ρ < .001).
In short, in terms of significant direct effects of the learning environments, peer relations (∆R2
= .23), family environment (∆R2
= .15) and favourite teacher interpersonal behavior (∆R2
= .09)
had greatest impacts on positive self-esteem while average teacher (∆R2
= .02) interpersonal
behavior had least impacts on positive self-esteem; on negative self-esteem, peer relations,
favourite teacher interpersonal behavior, family environment and average teacher interpersonal
behavior contributed no much (∆R2 ranging between .03 and .09); chronic self-concept levels
contributed more greatly on positive self-esteem than on negative self-esteem. Interaction effects
between chronic self-concept levels and the three learning environments existed on positive self-
esteem while on negative self-esteem, only interaction between chronic self-concept levels and
peer relations and family environment existed.
9.3.6. Testing of Three Learning Environments‘ Direct and Interaction Effects on Student
Outcomes (Hypothesis 6)
Hypothesis 6 posited that These 3 learning environments would not only have direct, but also
joint effects on student outcomes, such as academic achievement goals, social competence and
self-esteem as outcome variables. Hierarchical multiple regression analyses were conducted with
respectively academic achievement goals, social competence, and self-esteem as dependent
variables, and with two steps variables entered as independent variables: in the first step, 3
learning environments variables including peer group acceptance, best friendship quality,
favourite teacher cooperative behavior, favourite teacher opposition behavior, favourite teacher
strict behavior, average teacher cooperative behavior, average teacher opposition behavior,
family cohesion, father parenting style and mother parenting style entered into the first block;

134
and in the second step, two way interactions variables between these three learning
environments entered into the second block. Please note that only two-way interactions are
considered here!
Table 27 showed the results about regression of academic achievement goals on three learning
environments. Firstly, in the regression model of performance goal, peer group acceptance (ß =
.11, ρ < .05), average teacher cooperative behavior (ß = .14, ρ < .05) and average teacher
opposition behavior (ß = .16, ρ < .05) acted as significant predictors in the 1st step (∆R
2 = .06, ρ
< .01); in the 2nd
step (∆R2 = .18, ρ < .001), significant predictors were family cohesion (ß =
1.86, ρ < .01), average teacher cooperative behavior (ß = 1.02, ρ < .01), interaction terms such as
―AT (average teacher) cooperative behavior X family cohesion‖ (ß = -.99, ρ < .05), ―AT
opposition behavior X father parenting style‖ (ß = -1.35, ρ < .05), ―AT opposition behavior X
family cohesion‖ (ß = -.72, ρ < .05), ―BFQ (i.e., best friendship quality) X father parenting
style‖ (ß = 1.35, ρ < .05), ―BFQ X FT (i.e., favorite teacher) strict behavior‖ (ß = -.91, ρ < .05),
―father parenting style X FT strict behavior‖ (ß = 1.50, ρ < .01), ―family cohesion X FT
opposition behavior‖ (ß = -.74, ρ < .01), ―family cohesion X FT strict behavior‖ (ß = -.67, ρ <
.05), ―FT opposition X mother parenting style‖ (ß = .95, ρ < .05); and the overall regression
model was significant as well (F(40, 364) = 2.85, R2 = .24, ρ < .001). Secondly, in the regression
model of mastery goal, significant predictors were best friendship quality (ß = .20, ρ <.001),
mother parenting style (ß = .17, ρ <.01), FT cooperative behavior (ß = .17, ρ <.01) and FT
opposition behavior (ß = -.13, ρ <.05) in the first step (∆R2 = .28, ρ <.001); in the second step
(∆R2 = .11, ρ <.01), significant predictors were family cohesion (ß = 1.24, ρ <.05), FT strict
behavior (ß = -.69, ρ <.05), AT cooperative behavior (ß = 1.11, ρ <.01), AT opposition behavior
(ß = .75, ρ <.05), and interaction terms such as ―AT cooperative behavior X BFQ‖ (ß = -.94, ρ
<.05), ―AT cooperative behavior X family cohesion‖ (ß = -1.10, ρ <.01), ―father parenting style
X FT strict behavior‖ (ß = .99, ρ <.05) and ―family cohesion X FT cooperative behavior‖ (ß =

135
Table 27 Regression of Academic Achievement Goals on Three Learning Environments
Step
Predictor
Performance goal Mastery goal Avoidance goal
B SE
B
β B SE
B
β B SE
B
β B SE
B
β B SE
B
β B SE
B
β
1 PGA .13 .07 .11* .53 .57 .46 .08 .05 .09 -.33 .41 -.36 -.14 .08 -.10 .27 .69 .20
BFQ .02 .08 .01 .51 .65 .41 .20 .05 .20*** .67 .47 .67 -.03 .09 -.02 -1.87 .78 -1.27*
cohesion .04 .05 .04 1.77 .56 1.86** -.01 .04 -.01 .94 .40 1.24* .11 .06 .10 .63 .67 .56
father_PS .03 .05 .06 -.46 .48 -.80 .03 .03 .06 -.37 .35 -.80 -.00 .05 -.00 -.35 .58 -.51
mother_PS -.06 .05 -.10 -.15 .52 -.26 .08 .03 .17** .29 .37 .62 -.05 .06 -.07 1.57 .62 2.29*
FTcooperative .03 .02 .06 -.04 .13 -.10 .05 .02 .17** .12 .09 .38 .01 .03 .03 -.06 .16 -.13
FTopposition .01 .03 .02 -.08 .16 -.20 -.04 .02 -.13* -.00 .12 -.01 .07 .03 .14* .15 .19 .29
FTstrict -.03 .06 -.02 .44 .39 .36 .05 .05 .05 -.67 .28 -.69* .09 .08 .06 .34 .47 .23
ATcooperative .04 .02 .14* .33 .12 1.02** .02 .01 .06 .28 .08 1.11** -.00 .02 -.01 .11 .14 .30
ATopposition .23 .09 .16* .51 .51 .36 .06 .06 .06 .84 .37 .75* .24 .11 .15* -.72 .61 -.43
2 ATcooperative
X BFQ
.01 .03 .09 -.06 .02 -.94* .05 .04 .50
ATcooperative
X father_PS
.02 .02 .43 -.02 .02 -.57 -.04 .03 -.70
ATcooperative
X cohesion
-.06 .03 -.99* -.06 .02 -1.10** .02 .04 .28
ATcooperative
X mother_PS
-.04 .02 -.93 .03 .02 .81 -.02 .03 -.44
ATcooperative
X PGA
.01 .03 .08 .02 .02 .36 -.01 .03 -.14
ATopposition
X BFQ
-.15 .16 -.39 -.16 .12 -.51 .44 .19 .97*
ATopposition
X father_PS
-.27 .10 -1.35* -.08 .07 -.47 -.12 .12 -.52
ATopposition
X cohesion
.26 .12 .72* .03 .09 .10 .05 .14 .12

136
(Continued)
Step
Predictor
Performance goal Mastery goal Avoidance goal
B SE
B
β B SE
B
β B SE
B
β B SE
B
β B SE
B
β B SE
B
β
Atopposition
X mother_PS
.14 .11 .71 -
.02
.08 -.15 .10 .13 .41
Atopposition
X PGA
.02 .14 .06 .05 .10 .13 -.16 .17 -.31
BFQ X
father_PS
.19 .09 1.35* .05 .07 .50 -.07 .11 -.46
BFQ X
Ftopposition
.08 .05 .58 -
.03
.04 -.27 .09 .06 .54
BFQ X
Ftcooperative
.01 .04 .07 .02 .03 .35 .08 .05 .94
BFQ X
Ftstrict
-.30 .12 -.91* .08 .08 .32 .06 .14 .15
BFQX
mother_PS
-.15 .09 -1.10 -
.06
.07 -.57 -.08 .11 -.50
father_PS X
Ftopposition
-.02 .03 -.33 -
.01
.02 -.08 .04 .04 .47
father_PS X
Ftcooperative
-.01 .03 -.18 .00 .02 .13 .08 .03 1.82*
father_PS X
Ftstrict
.24 .08 1.50** .13 .06 .99* .09 .09 .46
father_PS X
PGA
-.05 .08 -.35 .08 .05 .70 -.09 .09 -.53
cohesion X
Ftopposition
-.10 .04 -.74** .03 .03 .24 -.06 .04 -.41
cohesion X
Ftcooperativ
-.05 .03 -.93 -
.05
.02 -1.01* -.03 .04 -.48
cohesion X
Ftstrict
-.18 .09 -.67* -
.04
.06 -.20 -.16 .10 -.53

137
(Continued)
Step
Predictor
Performance goal Mastery goal Avoidance goal
B SE
B
β B SE
B
β B SE
B
β B SE
B
β B SE
B
β B SE
B
β
cohesion X
PGA
-.11 .08 -.46 .07 .06 .40 .08 .10 .28
FTopposition
X mother_PS
.07 .03 .95* .00 .02 -.02 -.08 .04 -.93*
FTopposition
X PGA
-.04 .04 -.29 -.00 .03 -.04 .03 .05 .16
FTcooperativ
X mother_PS
.03 .03 .84 .01 .02 .26 -.09 .04 -2.12*
FTcooperativ
X PGA
.03 .03 .44 -.02 .03 -.36 .01 .04 .15
FTstrict X
mother_PS
.01 .08 .09 -.06 .06 -.48 .01 .09 .04
mother_PS X
PGA
.01 .07 .05 -.08 .05 -.67 .04 .09 .25
FTstrictX
PGA
-.10 .10 -.30 .09 .07 .36 -.12 .12 -.33
∆ R2 .06** .18*** .28*** .11** .08*** .13**
R2 .24 .39 .21
Note: Because of missing data, N ranged from 398 to 405. *ρ<.05. **ρ<.01. ***ρ<.001. PGA = peer group acceptance, BFQ = best friendship
quality, FT = favourite teacher, AT = average teacher, feco = family cohesion, mother_PS = mother parenting style, father_PS = father parenting
style.

138
Table 28 Regression of social competence on Three Learning Environments
Predictor
Anxious solitary
behavior
Prosocial behavior
helping
Step 1 Step 1 Step 2 Step 1 Step 2
B SE B β B SE
B
β B SE
B
β B SE
B
β B SE
B
β
PGA -.28 .07 -.23*** .13 .04 .17*** -.34 .33 -.42 .07 .05 .07 -.72 .44 -.72
BFQ -.06 .08 -.04 .26 .04 .30*** .89 .37 1.02* .34 .06 .31*** 1.14 .50 1.03*
cohesion -.02 .06 -.02 -.02 .03 -.04 .41 .32 .61 .01 .04 .01 .68 .43 .81
father_PS -.02 .05 -.04 .01 .03 .03 .10 .27 .23 .05 .04 .09 .20 .37 .39
mother_PS -.03 .05 -.04 .12 .03 .30*** -.26 .29 -.64 .10 .04 .20** -.57 .40 -1.11
FTcooperative .02 .03 .05 .02 .01 .07 .09 .07 .32 .01 .02 .02 .11 .10 .31
FTopposition .05 .03 .12* -.04 .02 -.12* .03 .09 .12 -.04 .02 -.12* .07 .13 .18
FTstrict .23 .07 .17** .07 .04 .08 -.04 .22 -.04 .06 .05 .06 -.35 .30 -.32
ATcooperative -.03 .02 -.08 -.01 .01 -.03 .07 .07 .31 .01 .01 .04 .15 .09 .53
ATopposition .06 .10 .04 .07 .05 .07 .39 .29 .38 .15 .07 .12* .39 .39 .31
ATcooperative X BFQ -.02 .02 -.42 -.02 .03 -.35
ATcooperative X
father_PS
-.01 .01 -.19 -.03 .02 -.75
ATcooperative X cohesion -.04 .02 -.79* -.07 .02 -1.17**
ATcooperative X
mother_PS
.03 .01 1.13** .06 .02 1.71***
ATcooperative X PGA -.01 .02 -.20 -.01 .02 -.16
ATopposition X BFQ -.01 .09 -.03 -.09 .13 -.26
ATopposition X father_PS -.06 .06 -.40 -.11 .08 -.61
ATopposition X cohesion .07 .07 .27 .03 .09 .11
ATopposition X
mother_PS
-.01 .06 -.08 .09 .08 .48
ATopposition X PGA -.07 .08 -.22 .01 .11 .03

139
(Continued)
Predictor
Anxious solitary
behavior
Prosocial behavior
helping
Step 1 Step 1 Step 2 Step 1 Step 2
B SE B β B SE
B
β B SE
B
β B SE
B
β B SE
B
β
BFQ X father_PS -.03 .05 -.31 .03 .07 .21
BFQ X FTopposition -.04 .03 -.43 -.04 .04 -.34
BFQ X FTcooperative -.01 .02 -.25 -.02 .03 -.30
BFQ X FTstrict -.11 .07 -.47 -.15 .09 -.52
BFQ X mother_PS .05 .05 .49 .02 .07 .19
father_PS X FTopposition .01 .02 .11 .01 .02 .10
father_PSX FTcooperative .00 .02 .04 .00 .02 .01
father_PS X FTstrict -.03 .04 -.30 .02 .06 .15
father_PS X PGA .07 .04 .66 .04 .06 .34
cohesion X FTopposition .02 .02 .20 .04 .03 .34
cohesion X FTcooperativ -.03 .02 -.62 -.02 .02 -.47
cohesion X FTstrict .02 .05 .13 .02 .07 .09
cohesion X PGA .01 .05 .05 .03 .06 .12
FToppositionXmother_PS -.01 .02 -.16 -.02 .03 -.33
FTopposition X PGA .00 .02 .02 -.01 .03 -.09
FTcooperativXmother_PS .00 .02 .11 -.00 .03 -.04
FTcooperativ X PGA .01 .02 .19 .01 .03 .23
FTstrict X mother_PS .00 .04 .04 -.00 .06 -.02
mother_PS X PGA -.03 .04 -.31 -.03 .06 -.19
FTstrict X PGA .18 .06 .79** .26 .08 .91**
∆ R2 .15*** .39*** .11*** .31*** .11***
R2 .15 .50 .42

140
(Continued)
Step
Predictor
Sharing and cooperation Affective relationship
Step 1 Step 2 Step 1 Step 2
B SE B β B SE B β B SE B β B SE B β
1 PGA .22 .05 .21*** -.65 .46 -.61 .07 .05 .07 -.09 .49 -.09
BFQ .29 .06 .25*** 1.14 .52 .97* .29 .06 .27*** .39 .55 .36
cohesion -.03 .04 -.04 .69 .45 .78 -.08 .04 -.10 .30 .47 .37
father_PS .01 .04 .01 -.07 .39 -.13 -.03 .04 -.05 .27 .41 .54
mother_PS .13 .04 .24** -.03 .42 -.06 .13 .04 .26*** -.07 .44 -.15
FTcooperative .02 .02 .05 .21 .11 .57* .05 .02 .14* .15 .11 .45
FTopposition -.07 .02 -.17** .06 .13 .16 -.00 .02 -.00 .13 .14 .35
FTstrict .07 .05 .07 -.17 .32 -.15 .11 .05 .10* .35 .33 .33
ATcooperative -.01 .02 -.05 .07 .09 .24 -.02 .02 -.07 .01 .10 .04
ATopposition .09 .07 .07 .51 .41 .39 .05 .07 .04 -.03 .43 -.03
2 ATcooperative X BFQ -.01 .03 -.19 -.02 .03 -.26
ATcooperative X father_PS -.02 .02 -.48 .01 .02 .37
ATcooperative X cohesion -.06 .02 -.94* -.02 .03 -.34
ATcooperative X mother_PS .04 .02 1.11* .02 .02 .41
ATcooperative X PGA .01 .02 .13 -.02 .02 -.36
ATopposition X BFQ -.06 .13 -.16 .10 .14 .30
ATopposition X father_PS -.02 .08 -.10 -.01 .09 -.07
ATopposition X cohesion .10 .10 .29 .04 .10 .11
ATopposition X mother_PS -.10 .09 -.55 .03 .09 .16
ATopposition X PGA .02 .11 .05 -.17 .12 -.46
BFQ X father_PS .00 .07 .01 -.11 .08 -.91
BFQ X FTopposition -.08 .04 -.58* -.05 .04 -.39
BFQ X FTcooperative -.04 .03 -.59 .01 .03 .21
BFQ X FTstrict -.03 .09 -.09 -.07 .10 -.24
BFQ X mother_PS .02 .08 .14 .10 .08 .95*

141
(Continued)
Step
Predictor
Sharing and cooperation Affective relationship
Step 1 Step 2 Step 1 Step 2
B SE B β B SE B β B SE B β B SE B β
father_PS X FTopposition -.01 .03 -.10 -.01 .03 -.11
father_PS X FTcooperative .01 .02 .30 -.00 .02 -.05
father_PS X FTstrict .02 .06 .10 -.12 .07 -.96*
father_PS X PGA .04 .06 .26 .08 .06 .62
cohesion X FTopposition .04 .03 .35 -.01 .03 -.06
cohesion X FTcooperativ -.04 .02 -.82 -.01 .02 -.25
cohesion X FTstrict .02 .07 .09 .01 .07 .04
cohesion X PGA .03 .07 .15 -.04 .07 -.21
FTopposition X mother_PS -.01 .03 -.13 -.00 .03 -.03
FTopposition X PGA .02 .03 .13 .03 .03 .24
FTcooperativ X mother_PS -.00 .03 -.10 -.02 .03 -.77
FTcooperativ X PGA .01 .03 .07 .01 .03 .16
FTstrict X mother_PS -.05 .06 -.33 .03 .07 .22
mother_PS X PGA .02 .06 .14 -.01 .06 -.07
FTstrict X PGA .14 .08 .47 .14 .08 .49
∆ R2 .32*** .12*** .22*** .08**
R2 .44 .22 30
Note: Because of missing data, N ranged from 398 to 405. *ρ<.05. **ρ<.01. ***ρ<.001. PGA = peer group acceptance, BFQ = best friendship
quality, FT = favourite teacher, AT = average teacher, feco = family cohesion, mother_PS = mother parenting style, father_PS = father parenting
style.

142
-1.01, ρ <.05); and overall regression model was significant as well (F (40, 364) = 5, 66, R2 =
.39, ρ < .001). Finally, in the regression model of avoidance goal, significant predictors were FT
opposition behavior (ß = .14, ρ <.05) and AT opposition behavior (ß = .15, ρ <.05) in the first
step (∆R2 = .08, ρ <.001); in the second step (∆R
2 = .13, ρ <.001), significant predictors were
BFQ (ß = -1.27, ρ <.05), mother parenting style (ß = 2.29, ρ <.05), interaction terms such as ―AT
opposition behavior X BFQ‖ (ß = .97, ρ <.05), ―father parenting style X FT cooperative
behavior‖ (ß = 1.82, ρ <.05), ―FT opposition behavior X mother parenting style‖ (ß = -.93, ρ
<.05), and ―FT cooperative behavior X mother parenting style‖(ß = -2.12, ρ <.05); and overall
regression model was significant as well (F(40, 364) = 2.51, R2 = .21, ρ < .001).
Table 28 showed the results about regression of social competence on three learning
environments. Firstly, in the regression model of anxious solitary behavior, peer group
acceptance (ß = -.23, ρ < .001), FT opposition behavior (ß = .12, ρ < .05) and FT strict behavior
(ß = .17, ρ < .01) acted as significant predictors in the 1st step (∆R
2 = .15, ρ < .001); in the 2
nd
step (∆R2 = .06, ρ > .05), there were no significant interaction effects. And the regression model
was significant (F (40, 364) = 3.59, R2 = .15, ρ < .001). Anxious solitary behavior as a negative
student outcome might be resulted in by no interactions or no exchange of information among
the learning environments, such as between parents and teachers, between peer relations and
parents and between peer relations and teachers, etc. Secondly, in the regression model of
prosocial behavior, significant predictors were peer group acceptance (ß = .17, ρ < .001), BFQ (ß
= .30, ρ < .001), mother parenting style (ß = .30, ρ < .001), and FT opposition behavior (ß = -.12,
ρ < .05) in the first step (∆R2 = .39, ρ < .001); in the second step (∆R
2 = .11, ρ < .001),
significant predictors were found to be BFQ (ß = 1.02, ρ < .05), and interaction terms such as
―AT cooperative behavior X family cohesion‖ (ß = -.79, ρ < .05), ―AT cooperative behavior X
mother parenting style‖ (ß = 1.13, ρ < .01) and ―FT strict behavior X peer group acceptance‖ (ß
= .79, ρ < .01); and the overall regression model was significant as well (F(40, 360) = 9.16, R2 =

143
.50, ρ < .001). Thirdly, in the regression model of helping behavior, significant predictors were
BFQ (ß = .31, ρ < .001), mother parenting style (ß = .20, ρ < .01), FT opposition behavior (ß = -
.12, ρ < .05) and AT opposition behavior (ß = .12, ρ < .05) in the first step (∆R2 = .31, ρ < .001);
in the second step (∆R2 = .11, ρ < .001), significant predictors were BFQ (ß = 1.03, ρ < .05),
interaction terms such as ―AT cooperative behavior X family cohesion‖ (ß = -1.17, ρ < .01), ―AT
cooperative behavior X mother parenting style‖ (ß = 1.71, ρ < .001) and ―FT strict behavior X
peer group acceptance‖ (ß = .91, ρ < .01); and the overall regression model was significant as
well (F(40, 361) = 6.58, R2 = .42, ρ < .001). Fourthly, in the regression model of sharing and
cooperation behavior, significant predictors were peer group acceptance (ß = .21, ρ <.001), best
friendship quality (ß = .25, ρ <.001), mother parenting style (ß = .24, ρ <.01), FT opposition
behavior (ß = -.17, ρ <.01) in the first step (∆R2 = .32, ρ <.001); in the second step (∆R
2 = .12, ρ
<.001), significant predictors were BFQ (ß = .97, ρ <.05), FT cooperative behavior (ß = .57, ρ
<.05), and interaction terms such as ―AT cooperative behavior X family cohesion‖ (ß = -.94, ρ
<.05), ―AT cooperative behavior X mother parenting style‖ (ß = 1.11, ρ <.05), and ―FT
opposition behavior X BFQ‖ (ß = -.58, ρ <.05); and the overall regression model was significant
as well (F(40, 363) = 6.98, R2 = .44, ρ < .001). Finally, in the regression model of affective
relationship, significant predictors were BFQ (ß = .27, ρ <.001), mother parenting style (ß = .26,
ρ <.001) and FT cooperative behavior (ß = .14, ρ <.05) and FT strict behavior (ß = .10, ρ <.05)
in the first step (∆R2 = .22, ρ <.001); in the 2
nd step (∆R
2 = .08, ρ < .01), significant predictors
were interaction terms such as ―BFQ X mother parenting style‖ (ß = .95, ρ < .05) and ―FT strict
behavior X father parenting style‖ (ß = -.96, ρ < .05); and the overall regression model was
significant (F(40, 364) = 3.51, R2 = .30, ρ < .001).
Results about regression of self-esteem on the three learning environments were reported in
Table 29. Firstly, in the regression model of positive self-esteem, significant predictors were peer
group acceptance (ß = .24, ρ < .001), BFQ (ß = .25, ρ < .001), father parenting style (ß .21, ρ <

144
.01) and FT cooperative behavior (ß = .10, ρ < .05) in the 1st step (∆R
2 = .33, ρ <.001); in the 2
nd
step (∆R2 = .11, ρ <.001), significant predictors were father parenting style (ß = 1.68, ρ < .05),
average teacher opposition behavior (ß = .86, ρ < .01) and interaction terms such as ―AT
opposition behavior X mother parenting style‖ (ß = -.91, ρ < .05), ―FT opposition behavior X
mother parenting style‖ (ß = .98, ρ < .01) and ―FT cooperative behavior X mother parenting
style‖ (ß = 1.89, ρ < .05); and the regression model was significant as well (F(40, 364) = 7.04,
R2 = .44, ρ < .001). Secondly, in the regression model of negative self-esteem, peer group
acceptance (ß = -.26, ρ <.001), FT cooperative behavior (ß = .12, ρ < .05) and favorite
opposition behavior (ß = .21, ρ <.01) were significant predictors in the first step (∆R2 = .16, ρ
<.001); in the second step no significant R2 was reached (∆R
2 = .06, ρ >.05). There were no
interaction effects on negative self-esteem, which reflected that without interactions between the
learning environments, there would be problems.
In sum, if we consider the direct and joint effects of the three learning environments, more
fruitful results were accomplished in terms of the variance explained in the outcome variables.
Specifically, as was seen, direct effects of the three learning environments existed on every
outcome variable (∆R2 ranging between .06 and .39), but if the interaction effects between these
three learning environments were considered, except on anxious solitary behavior and negative
self-esteem, the interaction effects existed on performance goal (∆R2 = .18), mastery goal (∆R
2 =
.11), avoidance goal (∆R2 = .13), prosocial behaviors (∆R
2 ranging between .08 and .12) and
positive self-esteem (∆R2 = .11).

145
Table 29 Regression of Self-Esteem on Three Learning Environments
Step
Predictor
Positive Self-Esteem Negative Self-Esteem
B SE B β B SE B β B SE B β
1 PGA .24 .05 .24*** .16 .44 .16 -.32 .07 -.26***
BFQ .28 .06 .25*** .66 .49 .60 -.02 .08 -.02
cohesion -.03 .04 -.03 .38 .43 .45 .01 .05 .01
father_PS .11 .04 .21** .86 .37 1.68* -.05 .05 -.08
mother_PS .02 .04 .03 -.73 .39 -1.42 -.07 .05 -.11
FTcooperative .04 .02 .10* -.01 .10 -.03 .05 .03 .12*
FTopposition -.01 .02 -.04 -.02 .12 -.06 .09 .03 .21**
FTstrict .07 .05 .07 -.25 .30 -.23 .09 .07 .07
ATcooperative -.02 .01 -.08 .14 .09 .50 .00 .02 .01
ATopposition .11 .07 .09 1.08 .39 .86** .09 .09 .06
2 ATcooperative X BFQ -.04 .03 -.53
ATcooperative X father_PS -.00 .02 -.04
ATcooperative X cohesion -.04 .02 -.63
ATcooperative X mother_PS .01 .02 .29
ATcooperative X PGA .01 .02 .18
ATopposition X BFQ -.19 .12 -.55
ATopposition X father_PS .00 .08 .00
ATopposition X cohesion .17 .09 .55
ATopposition X mother_PS -.16 .08 -.91*
ATopposition X PGA -.02 .11 -.04
BFQ X father_PS -.10 .07 -.80
BFQ X FTopposition .02 .04 .14
BFQ X FTcooperative .04 .03 .59
BFQ X FTstrict .11 .09 .38
BFQ X mother_PS -.01 .07 -.12
father_PS X FTopposition -.04 .02 -.69

146
(Continued)
Step
Predictor
Positive Self-Esteem Negative Self-Esteem
B SE B β B SE B β B SE B β
father_PS X FTcooperative -.04 .02 -1.11
father_PS X FTstrict .04 .06 .29
father_PS X PGA .02 .06 .17
cohesion X FTopposition -.02 .03 -.17
cohesion X FTcooperativ -.04 .02 -.73
cohesion X FTstrict .06 .07 .26
cohesion X PGA .02 .06 .10
FTopposition X mother_PS .07 .03 .98**
FTopposition X PGA -.04 .03 -.32
FTcooperativ X mother_PS .06 .03 1.89*
FTcooperativ X PGA -.03 .03 -.53
FTstrict X mother_PS -.11 .06 -.76
mother_PS X PGA .08 .06 .58
FTstrict X PGA .03 .08 .10
∆ R2 .33*** .11*** .16***
R2 .44 .16
Note: Because of missing data, N ranged from 398 to 405. *ρ<.05. **ρ<.01. ***ρ<.001. PGA = peer group acceptance, BFQ = best friendship
quality, FT = favourite teacher, AT = average teacher, feco = family cohesion, mother_PS = mother parenting style, father_PS = father parenting
style

147
10. Conclusion and Discussion
10.1. Conclusion
From gender difference analyses, it seems that Chinese female only-children are more
socially oriented than Chinese male only-children when considering their chronic self-
concept levels, prosocial orientation and specific prosocial behavior, and career orientation.
From the exploratory factor analysis results, a series of conclusion could be reached as
follows. The Questionnaire on Teacher Interpersonal Behavior, which was developed in
Western world, was differently understood by Chinese only-children since 3 factors were
reached for favourite teacher interpersonal behavior and 2 factors for average teacher
interpersonal behavior while the original theoretical model, on which this questionnaire was
developed, has two dimensions: control and proximity. But for Chinese only-children, it
seems only one dimension, proximity existed obviously. Moreover, Chinese only-children‘s
understanding of the strict behavior subscale showed typical deviation from the original
meaning in that strict behavior was perceived by them as a very positive aspect of teacher
interpersonal behavior, especially of favourite teacher interpersonal behavior in terms of the
impact on student outcomes. The factor analyses of Parenting Authority Questionnaire
produced only one factor with only permissive and authoritative parenting style loading on
both for father and mother parenting styles of Chinese only-children. This result was totally
different from the previous research results about Chinese students because it proved that the
parenting styles held by Chinese only-children‘s parents were not authoritarian parenting
style, but a mixture of authoritative and permissive parenting style. It could be inferred that
probably due to the effects of China‘s One-Child Family Planning Policy, Chinese parents‘
parenting style in Mainland China have been altered from the traditional authoritarian
parenting style into a parenting style of authoritative parenting style but with more freedom
given to their children. Furthermore, the factor analyses of chronic self-concept levels and

148
career orientation scales revealed that, although China‘s One-Child Policy as a public policy
has been implementing for 30 years, the chronic self-concept levels of these Chinese only-
children still bear a deep print of Chinese culture influence; but that their career orientations
reflected the impacts from not only Chinese culture, but also China‘s One-Child Policy
because Chinese only-children had not only individual-level-like, but also relational and
collective-level-like career orientations.
As previous literature, the present study found the impact of family environment on career
orientation. But one new result is worthy of note. On career orientations of Chinese only-
children, their chronic self-concept levels played a role as well. Specifically the conclusions
regarding this aspect were that family cohesion, individual level of chronic self-concept, and
the interaction between family cohesion and relational level of chronic self-concept were
important in predicting individual-level-like career orientation; and that father parenting
style, and collective level of chronic-self-concept were capable to predict relational and
collective-level-like career orientation.
Concerning school group differences, senior high students were found to have higher
tendency than college students to behave prosocially, to help others, to share and cooperate
with others. Moreover, results also revealed that the impact of peer group acceptance had
greater impact on sharing cooperation behavior of senior high group students than on that of
college group students. Explanation may be found from time length of being classmates
and/or the developmental stage.
Different from previous literature, for this Chinese only-children sample, cross-sex
parenting effect existed not on positive self-esteem, but only on prosocial behavior.
The analysis of parenting style match of father‘ and mother‘s indicated that if the best
children outcomes were expected, both parents in a family should hold the authoritative
parenting styles but with less behavioral control on their children.

149
Through testing of the effects and interaction effects of each learning environments and
chronic self-concept levels on student outcomes, the following three conclusions were
reached.
Firstly, from the regression models of academic achievement goals respectively on the
three learning environments and self-concept levels, it was obviously observed that, chronic
self-concept levels had greater impact than any individual learning environment on academic
achievement orientation; that, although the three learning environments contributed very
little in explaining the variances in performance goal and avoidance goal, they explained
relatively much greater variances in mastery goal and very significant predictors were best
friendship quality, favourite teacher cooperative behavior, and family cohesion and
significant predictors were peer group acceptance, favourite teacher strict behavior and
mother parenting style among the variables of these three learning environments; that among
student chronic self-concept levels, individual level had much greater impact on performance
goal and avoidance goal, while relational level and collective level only had great impact on
mastery goal and individual level exert only a small effect on mastery goal; that interaction
effects between learning environment and chronic self-concept levels existed not extensively
on students‘ academic achievement orientation. One point should be noted was the little
contribution of average teacher interpersonal behavior to academic achievement orientation.
Secondly, from the regression models of social competence on the three learning
environments and self-concept levels, it was obviously observed that mostly, chronic self-
concept levels had greater impact than favourite teacher and average teacher interpersonal
behavior, and family environment, but less impact than peer relations, on social competence.
That is, as a learning environment, peer relations were more important contributors to
student social competence than family environment and favourite and average teacher
interpersonal behavior; that, in terms of direct effects of learning environments on anxious

150
solitary behavior, peer group acceptance, average teacher cooperative behavior, and family
cohesion were negatively associated with anxious solitary behavior, while favourite teacher
opposition behavior, favourite teacher strict behavior, and average teacher opposition
behavior were positively associated with anxious solitary behavior; in terms of main effects
of the three learning environments on prosocial behavior from the greatest to least effects,
the three learning environments should be ordered like this: peer relations, family
environment, favourite teacher interpersonal behavior and then average teacher personal
behavior; that to anxious solitary behavior, peer group acceptance was more important than
best friendship quality, while to prosocial behavior, best friendship quality was more
important than peer group acceptance; that on prosocial behavior, mother parenting style was
more important than family cohesion, while family cohesion was more important than father
parenting style; that on prosocial behavior, favourite teacher cooperative behavior was more
important then favourite teacher strict behavior, and the latter was more important than
favourite teacher opposition behavior; that among student chronic self-concept levels,
individual level contributed positively to anxious solitary behavior, while relational level and
collective level contributed greatly to prosocial behavior; that interaction effects between
learning environment and chronic self-concept levels existed not on every aspect of student
social competence.
Thirdly, from the regression models of self-esteem on the three learning environments and
self-concept levels, it was apparent that mostly, chronic self-concept levels had greater
impact than favourite teacher and average teacher interpersonal behavior, and family
environment, but less impact than peer relations, on self-esteem. That is, as a learning
environment, peer relations were more important contributors to student self-esteem than
family environment and favourite and average teacher interpersonal behavior; that after peer
relations, family environment and favourite teacher interpersonal behavior were the second

151
greatest contributors to positive self-esteem, while to negative self-esteem, peer relations
were also the greatest contributor; very significant predictors to positive self-esteem were
best friendship quality, peer group acceptance, FT cooperative behavior, FT strict behavior,
AT opposition behavior and father parenting style; that significant predictors to negative self-
esteem were peer group acceptance, FT opposition behavior and AT opposition behavior;
that among student chronic self-concept levels, individual level contributed positively and
collective level negatively to negative self-esteem, while relational level and/or collective
level contributed positively to positive self-esteem; that interaction effects between learning
environment and chronic self-concept levels existed not on every aspect of student self-
esteem.
In summary, the three learning environments studied and student chronic self-concept
levels all had main effects on student outcomes, but interaction effects between each learning
environment and student chronic self-concept existed not on every student outcome variable
chosen in this study.
Through testing of the mainly effects and the interaction effects of the three learning
environments on student outcomes, the following 3 conclusions were reached.
Firstly, results about regression of academic achievement orientation on the three learning
environments showed that, in terms of main effects, only peer group acceptance, average
teacher interpersonal behavior acted as significant predictors of performance goal, the
significant predictors of avoidance goal were favourite teacher and average teacher
opposition behaviors, and the significant predictors of mastery goal were best friendship
quality, mother parenting style, favourite teacher cooperative behavior and favourite teacher
opposition behavior. In a word, one aspect of peer relations (i.e., peer group acceptance) and
average teacher interpersonal behavior had direct influence on students to take performance
goal in academic achievement; favourite teacher and average teacher opposition behaviors

152
had direct impact on students to take avoidance goals in academic achievement; and in
promoting mastery goal in academic achievement, best friendship quality (another aspect of
peer relations), mother parenting style (authoritative parenting style plus more freedom
giving), and favourite teacher cooperative and opposition behavior made direct and
significant contributions. Among all the above mentioned predictors, except favourite
teacher opposition behavior associating negatively with mastery goal, all the other predictors
associated positively with the academic goals. Moreover, interaction effects among the three
learning environments on student academic achievement goals existed as well. What‘s more,
the interaction effects on performance and avoidance goals were much greater than the main
effects of the three learning environments, while on mastery goal, the main effects were
much greater than the interaction effects of the three learning environments.
Secondly, results about regression of social competence on the three learning
environments showed that, in terms of main effects, peer group acceptance, favourite teacher
opposition behavior and strict behavior have direct impacts on anxious solitary behavior.
That is, these Chinese only-children felt lonely and anxious when they have low peer group
acceptance in class and when their favourite teachers showed opposition and strict
interpersonal behaviors in communication; in contrast, their family environment had no
direct impact on their anxious solitary behavior. On prosocial behavior or its three subscales
such as helping, sharing and cooperation behavior, and affective relationship, peer group
acceptance, best friendship quality, mother parenting style, favourite teacher opposition
behavior and average opposition behavior have direct impacts. That is all three learning
environments have direct contributions to prosocial behavior. Moreover, in terms of
interaction effects among the three learning environments on student social competence
existed on every aspect of prosocial behavior, but not on anxious solitary behavior. What‘s
more, the interaction effects on every prosocial behavior variable were less than the main
153
effects of the three learning environments.
Thirdly, results about regression of self-esteem on the three learning environments showed
that peer group acceptance, best friendship quality, father parenting style and favourite
teacher cooperative behavior had direct impacts on positive self-esteem. That is, the three
learning environments all had main effects on the positive self-esteem of these Chinese only-
children. Moreover, interaction effects between the three learning environments on student
positive self-esteem existed as well and the interaction effects were much less than the main
effects of the three learning environments. Meanwhile, on negative self-esteem, the main
effects came from peer group acceptance, favourite teacher cooperative behavior and
favourite teacher opposition behavior and interaction effects did not exist. However, there
were no direct effects from family environment.
In summary, living in the greater social cultural environment affected by Chinese culture
and the 30-year old public policy, that is, China‘s One-Child Policy, the outcomes of these
Chinese only-children‘s (they are already either older adolescents or young adults) were
influenced, first, directly by the three learning environments, such as family environment,
peer relations, and average and favourite teacher interpersonal behaviors, second, directly by
their chronic self-concept levels, third, partly by the interactions between their chronic self-
concept levels and the three learning environments, and finally, by the interactions between
the three learning environments.
10.2. What happened when there were no interactions between the learning environments?
In present study, only on anxious solitary behavior and negative self-esteem, there were no
interaction effects between the three learning environments. Hence we could infer that
between these learning environments, there should be an exchange of information and
cooperation, otherwise negative student outcomes would come out, such as problems of
anxious solitary behavior and high level of negative self-esteem.

154
10.3. Discussion
10.3.1. Theoretical Implication
According to the standard proposed by Lewin (1951), ―What means are most appropriate
for analyzing and representing scientifically a psychological field have to be judged on the
basis of their fruitfulness for explaining behavior.‖ (p. 240) In the present study, the
proposed theoretical model was proved in that, when only consider the impact of a separate
learning environment, little variance in the outcomes could be explained, but only when
considering together the direct and especially the interaction impacts of the learning
environments and the personality variable chronic self-concept on the outcomes within the
larger atmosphere of culture and public policy, much more variance could be explained. And
in turn, with the responding levels of student outcomes, in one way, it proved the impacts of
learning environment, biopsychological environments and culture and public policy while in
the other way, it provided some ideas about how to improve positive outcomes but avoid
negative outcomes by changing the learning environments, biopsychological environment
(such as by activating the right working self-concept levels), or even the public policy etc.
This theoretical model in present study coincides with part of the prediction of
Bronfenbrenner‘s Ecological Systems Theory (1979):
The interaction between factors in the child‘s maturing biology, his immediate
family/community environment, and the other social environments affect the development of
the child. Changes or conflict in any one layer will ripple throughout other layers. To study a
child‘s development, we must look not only at the child and his or her immediate
environments, but also at the interaction of the larger environments as well. .
From a perspective of psychological ecology of human development, the ecological
environment is conceived as a set nested structure, each inside the next. Altogether five
environmental systems ranging from fine-grained inputs of direct interactions with social

155
agents to broad-based inputs of culture encompass microsystem, mesosystem, exosystem,
macrosystem and chronosystem (see Figure 3).
In line with the definitions of each system, we could find a position for each component
of the proposed theoretical model in present study and see where the coincidence of
predictions lies. Microsystem refers to the settings in which an individual lives including
family, peers, school, and neighbourhood etc, which have most direct interactions with the
developing individual. And biopsycholigical environment of the individual is also an
important part of the microsystem. Obviously, self-concept levels and the 3 sub-learning
environments are representatives of microsystem. Mesosystem refers to relations between
microsystems or connections between contexts. Therefore, interactions between self-concept
levels and 3 sub-learning environments and interactions between sub-learning environments
belong to mesosystem. Exosystem refers to experiences in a social setting in which an
individual does not have an active role but which nevertheless influence experience in an
immediate context. But in present proposed theoretical model, there is no representatives
there. Macrosystem is identified with attitudes and/or ideologies of the culture in which
individuals live and accordingly, public policy is also a part of macrosystem. Thus Chinese
culture and China‘s One-child Policy considered in present study belong to macrosystem.
The final system is chronosystem and refers to the patterning of environmental events and
transitions over the life course, that is, the effects created by time or critical periods in
development. Here in present study, the period of older adolescence and young adulthood
could act as chronosystem.
There are several points worthy of note. First of all, a very important thesis of this theory
is that what matters for behavior and development is the environment as it is perceived rather
than as it may exist in ―objective‖ reality. Secondly, this theory emphasizes using rigorously
designed naturalistic and planned experiments for studying development in the actual

156
environments, both immediate and more remote, in which people live. Thirdly, it also
emphasizes that the evolving reciprocal relation between person and environment through
life is conceptualized and operationalized in systems terms and that a child‘s own biology is
a primary environment as well. Finally, the theory contends that behavior and development
should be examined as a joint function of the characteristics of the person and of the
environment. The former includes both biological and psychological attributes (e.g., an
individual‘s genetic heritage and personality). The latter consists of the physical, social, and
cultural features of the immediate settings in which human beings live (e.g., the society and
times into which an individual is born). The key to this theory is the interaction of structures
within a layer and interactions of structures between layers.
10.3.2. Practical Implications
If the theoretical model in present study was considered under the background of Lewin‘s
Field Theory and Bronfenbrenner‘s Ecological Systems Theory, great practical implications
were to be offered for people and institutions of all levels: parents, teachers, school
administrators, extended family, mentors, work supervisors, legislators, and government etc.
For instance, after the implementation of China‘s One-Child Policy, women have more
chance to enter into full employment. Hence the so-called equality between women and men
in employment world brought more work to Chinese women besides the housework at home
and an increasing divorce rate to Chinese household. Due to mother‘s full employment, their
only-children do not have the constant mutual interaction with their mothers, which is
necessary for development of children. According to the ecological theory, if the
relationships in the immediate microsystem break down, the child will not have the tools to
explore other parts of his environment (Bronfenbrenner, 1979). And apparently, parents
could also do something in exosystem to help their children. For example, the mother could
try to find a job requiring less work hours on weekdays and find more time to increase their

157
own interactions with their children to create more opportunities for their children to interact
with others etc. within a microsystem, parents at least could, through their direct (e.g.,
appropriate parenting style) and indirect (e.g. providing a general family environment with
high family cohesion) interpersonal behavior, exert their impact; they could also encourage
their only-children to increase interactions with their peers and teachers to improve the dyad
quality, say, a primary dyad; and meanwhile increase their own interpersonal behaviors with
teachers to get more information about other systems in order to decide in time what to do to
help their children. Finally, in a macrosystem, parents could do something for their children‘s
rights to express their opinions to some institutions. For example, although it has been
realized that there is necessity for the continuity of China‘s One-Child Policy and there are
less social relations of the family due to the impact of this policy, the only-children need
peers, other extended family members and even other adults. As parents, they could ask the
government to make it a law that each community shall establish some play grounds for
children and create more microsystems for children to interact with their peers, make use of
the characteristics of Chinese culture (relational and collective culture) to develop relations
with other families with similar aged children and improve social contact with extended
family members and other adults such as grandparents and their friends.
Great implications for the practice of teaching are offered as well. Knowing about the
breakdown occurring within children‘s homes, it is possible for our educational system to do
some mending work to some degree. As the result in present study showed, teachers,
especially favourite teacher interpersonal behavior had great impact on mastery goal,
positive self-esteem, and social competence as well. And, of course, teachers and schools
could try to create some ways or occasions to help increase the interactions or
communications between students and their parents.
And government could improve the macrosystem or create favourable macrosystem with

158
public policies and new laws. For example, to ease the social burdens brought by China‘s
One-Child Policy and the accelerating aging process of the population, Chinese government
could have taken some measures earlier in health insurance systems.
Not only people and institutions at all levels should create more interpersonal structures
for these only-children, but also they should attend to the quality of these interactions. As
Bronfenbrenner (1979) noticed that dyads (or other n+2 system) had different qualities,
such as observational dyads, joint activity dyads and primary dyads and the quality of dyads
could be improved through improving reciprocity and affective relations, and controlling
balance of power (p. 56-59). In present study, for example, peer group acceptance and best
friendship quality both as peer relations had different importance to different outcomes and
they also interact differently with other systems.
Since different systems or interactions between different systems might have different
effects on different outcomes, to solve different behavior or development problems, there
should be different concentrations on systems. For example, in present study, father
parenting style and best friendship quality had great impact on positive self-esteem, but no
impact on negative self-esteem. Therefore, when there is problem with an only child on
negative self-esteem, solutions should be found in systems like peer group acceptance,
favourite teacher cooperative behavior and favourite teacher opposition behavior
More attention should be given to biopsychological environment. Since there existed
interactions between the learning environments and between student chronic self-concept
levels and the learning environment, this emphasized the great importance of increasing
interactions between the learning environments by interpersonal behavior, exchange and
sharing of information between Microsystems. And in learning environments, adjustments in
interpersonal behaviors are necessary on base of student different chronic self-concept
levels. That is, to different students, same interpersonal behavior might function differently.

159
The present study also implied the great impact of a macrosystem, that is, the Chinese
culture. Although the direct and interaction effects of Chinese culture were not tested
through data analyses, chronic self-concept levels of these Chinese only-children expressed
the print of Chinese culture, with relational level and collective level loaded most but
individual level loaded least. Probably due to this cultural impact in that they could turn to
others easily, on anxious solitary behavior, Chinese only-children did not record high
although they have fewer extended family relatives and have no siblings or cousins in the
family or extended family. This implied again that for the development of Chinese only-
children, turning to macrosystem for help really functioned as well. On the other hand, other
factors in macrosystem might disturb the development of children. To some degree, China‘s
One-Child Policy is an example. As mentioned before, chronic self-concept of Chinese only-
children still concentrated on relational and collective levels of self-concept, but how come
they could have an individual-level-like career orientation. Probably this phenomenon is a
reflection of the helpless souls because on the one hand, together with this public policy, the
government has not taken complementary measures in time; on the other hand, Chinese
only- children felt helpless and had no other choice, but to take the heavy social burdens on
them alone.
In short, the present research has great implications to parents, teachers, educational
researchers, as well as to policy-makers and practitioners in terms of finding a more
integrated theoretical model, improving student outcomes, and creating better series of
systems ranging from microsystem, mesosystem, exosystem, macrosystem and
chronosystem.
10.3.3. Limitations and Future Research
There are limitations in present study. For example, due to the capacity of this research
project, no experiences in exosystem, such as those from parents‘ work places were

160
considered in research design. Secondly much was ignored in family environment, such as
other aspects of family relations, family conflict and family expressiveness; and other
dimensions of general family environment. Thirdly, school-level learning environment and
more limited student outcomes, such as the academic orientations of the school and social
orientations of students in school, etc. were not studied as well. Fourthly, the impact of
community or neighbourhood is not considered in this study, too, but actually it is very
important because in a collective culture such as in China, reputation and fear of losing face
in neighbourhood actually has been influencing behavior and development of individuals
much more than other cultures. However, these limitations left much room for future
research.

161
References
Adler, A. (1931). What life should mean to you. New York: Perigree Books.
Agnew, R. (1991). The interactive effects of peer variables on delinquency. Criminology, 29,
47–72.
Annunziata, Diane; Hogue, Aaron; Faw, Leyla & Liddle, Howard A. (2006). Family
functioning and school success in at-risk, inner-city adolescents. Journal of Youth and
Adolescence, v35 n1 p100-108 Feb 2006.
Baker, J. A. (1999). Teacher-Student interaction in urban at-risk classrooms: Differential
behavior, relationship quality, and student satisfaction with school. The Elementary
School Journal, 100, 57–70.
Barber, B. K. (1996). Parental psychological control: Revisiting a neglected construct. Child
Development, 67(6), 3296-3319. EJ 545 015.
Barnes, G., & Farrell, M. (1992). Parental support and control as predictors of adolescent
drinking, delingquency, and related problem behaviors. Journal of Marriage and Family,
54, 763-776.
Baumrind, D. (1967). Child care practices anteceding three patterns of preschool behavior.
Genetic Psychology Monograph, 75, 43-88.
Baumrind, D. (1971). Current patterns of parental authority. Developmental Psychology
Monographs, 4 (2, Pt.2).
Baumrind, D. (1989). Rearing competent children. In W. Damon (Ed.), Child Devolopment
Today and Tommorrow (pp. 349-378). San Francisco: Jossey-Bass.
Baumrind, D. (1991). The influence of parenting style on adolescent competence and
substance use. Journal of Early Adolescence, 11(1), 56-95.
Baumrind, D. (1996). The discipline controversy revisited. Family Relations, 45, 405-411.
Behnke, Andrew O.; Macdermid, Shelley M.; Coltrane, Scott L.; Parke, Ross D.; Duffy,
Sharon; & Widaman, Keith F. (2008). Family cohesion in the lives of Mexican American
and European American parents. Journal of Marriage and Family, v70 n4 p1045-1059 Nov
2008
Bell, K. L., Allen, J. P., Hauser, S. T.,&O‘Connor, T. G. (1996). Family factors and young
adult transitions: Educational attainment and occupational prestige. In J. A. Graber & J.
Brooks-Gunn (Eds.), Transitions through adolescence: Interpersonal domains and context
(pp. 345-366). Mahwah, NJ: Lawrence Erlbaum.
Berndt, T. J., Hawkins, J. A., & Jiao, Z. (1999). Influences of friends and friendships on
adjustment to junior high school. Merrill-Palmer Quarterly, 45, 13–41.

162
Berndt, T. J., & Keefe, K. (1995). Friends‘ influence on adolescents‘ adjustment to school.
Child Development, 66, 1312–1329.
Berndt T. J., Ladd G. W. (1989). Peer Relationships in Child Development. New York: Wiley
Berndt, T. J., Laychak, A. E., & Park, K. (1990). Friends‘ influence on adolescents‘ academic
achievement motivation: An experimental study. Journal of Educational Psychology, 82,
664–670.
Blake, J. (1981). The only child in America: Prejudice versus performance Population and
Development in Review, 1, 43–54.
Blustein, D. L., Walbridge, M. M., Friedlander, M. L., & Palladino, D. E. (1991).
Contributions of psychological separation and parental attachment to the career
development process. Journal of Counseling Psychology, 38, 39-50.
Boivin M. & Hymel S. (1997). Peer experiences and social self-perceptions: a sequential
model. Developmental. Psychology, 33, 135-45.
Bollen, K. A. (1989). Structural equations with latent variables. New York: Wiley.
Borich, G. D. (1988). Effective teaching methods, Columbus, Merrill.
Borich, G. D. and Klinzing, G. (1984). Some assumptions in the observation of classroom
process with suggestions for improving low inference measurement, Journal of Classroom
Interaction, 20, pp.36-44.
Boulton M. J. & Underwood K. (1992). Bully/victim problems among middle school
children. British Journal of Educational Psychology, 62, 73-87.
Bratcher, W. E. (1982). The influence of the family on career selection: A family systems
perspective. Personnel and Guidance Journal, 61, 87-91.
Brekelmans, M., Wubbels, T. & Creton, H. A. (1990). A study of student perceptions of
physics teacher behavior. Journal of Research in Science Teaching, 27 (4), 335-350.
Brekelmans, M., Wubbels, T. & van Tartwijk, J. (2005). Teacher-student relationships across
the teaching career. International Journal of Educational Research, 43, 55-71.
Brekelmans, Mieke; And Others (1992). Changes in Teacher Communication Styles during
the Professional Career. Journal of Classroom Interaction, v27 n1 p13-22 1992.
Brewer, M. B. & Gardner, W. (1996). Who is this ―we‖? Levels of collective identity and
self-representations, Journal of Personality and Social Psychology 71, pp. 83–93.
Bridges, K. (1933). A study of social development in early infancy. Child Development, 4,
36-49.
Bronfenbrenner, U. (1979). (Ed.). The Ecology of Human Development: Experiment by
Nature and Design. Cambridge, MA: Harvard University Press.

163
Bronfenbrenner, U. (2005) (Ed.). Making Human Beings Human: Bioecological Perspectives
on Human Development. Sage Publications, Inc.
Brown, B., Mounts, N., Lamborn, S., & Steinberg, L. (1993). Parenting practices and peer
group affiliation in adolescence. Child Development, 64, 467-482.
Buhler, C. The first year of life. New York: John Day, 1930.
Buhrmester, D. (1990). Intimacy of friendship, interpersonal competence, and adjustment
during preadolescence and adolescence. Child Development, 61, 1101–1111.
Bukowski WM, Hoza B. 1989. Popularity and friendship: issues in theory, measurement, and
outcome. See Berndt&Ladd 1989, pp. 15-45.
Campbell, Pam & Siperstein, Gary N. (1994). Improving Social Competence: A Resource
for Elementary School Teachers. N/A from ERIC (ED412018).
Caplan, Sheryl M.; Henderson, Craig E.; Henderson, John; & Fleming, Donna L. (2002).
Socioemotional factors contributing to adjustment among early-entrance college students.
Gifted Child Quarterly, v46 n2 p124-34 Spr 2002.
Carnap, Rudolph, Introducation to Semantics. Cambridge: Harvard University Press, 1943.
Cassidy J., Asher S. R. (1992). Loneliness and peer relations in young children. Child
Development, 63, 350-65.
Chan, David W. (2005). Family environment and talent development of Chinese gifted
students in Hong Kong. Gifted Child Quarterly, v49 n3 p211 Sum 2005.
Chan, Siu Mui; Bowes, Jennifer & Wyver, Shirley (2009). Parenting Style as a Context for
Emotion Socialization. Early Education and Development, 20(4), 631-656.
Chan, Kwok-wai & Chan, Siu-mui (2005). Perceived Parenting Styles and Goal
Orientations: A Study of Teacher Education Students in Hong Kong. Research in
Education, v74 p9-21 Nov 2005.
Chan, K.-W. & Chan, S.-M. (2007). Hong Kong teacher education students' goal orientations
and their relationship to perceived parenting styles, Educational Psychology, 27, 2, pp.
157-172.
Chao, R. K. (1993). Clarification of the authoritarian parenting style and parental control:
Cultural concepts of Chinese child rearing. Conference paper presented at the Biennial
Meeting of the Society for Research in Child Development (60th
, New Orleans, LA,
March 25-28, 1993).
Chao, R. K. (1994). Beyond parental control and authoritarian parenting style:
Understanding Chinese parenting through the cultural notion of training. Child
Development, 65(4), 1111-1119. EJ 491 656.

164
Chao, Ruth K. (2001). Extending Research on the Consequences of Parenting Style for
Chinese Americans and European Americans. Child Development, v72 n6 p1832-43 Nov-
Dec 2001.
Chen, X., Dong, Q., & Zhou, H. (1997). Authoritative and authoritarian parenting practices
and social and school performance in Chinese children. International Journal of
Behavioral Development, 21, 855–873.
Chen X., Rubin K. H., Li Z. (1995). Social functioning and adjustment in Chinese children:
a longitudinal study. Developmental Psychology, 31, 531-39.
Chen X., Rubin K. H., Sun Y. (1992). Social reputation and peer relationships in Chinese and
Canadian children: a cross-cultural study. Child Development, 63, 1336-43.
Chen, Jie-Qi & Goldsmith, Lynn T (1991). Social and Behavioral Characteristics of Chinese
Only Children. Journal of Research in Childhood Education, v5 n2 p127-39 Spr-Sum
1991.
Chen, Xinyin; and others (1994). Only Children and Sibling Children in Urban China: A
Reexamination. International Journal of Behavioral Development, v17 n3 p413-21 Sep
1994.
Cheung, P. C., Ma, H. K., & Shek, Daniel T. L. (1998). Conceptions of success: their
correlates with prosocial orientation and behavior in Chinese adolescents. Journal of
Adolescence, 21, 31-42
Coie J. D., Dodge K.A., Kupersmidt J.B. (1990). Peer group behavior and social status. See
Asher & Coie 1990, pp. 17-59.
Coie J. D., Lochman J. E., Terry R., & Hyman C. (1992). Predicting early adolescent
disorder from childhood aggression and peer rejection. J. Consult. Clin. Psychol, 60, 783-
92.
Cowen E. L., Pederson A., Babijian H., Izzo L., & Trost M. A. (1973). Long-term followup
of early detected vulnerable children. Journal of Consulting and Clinical Psychology,
41:438.46.
Cripps, K. & Zyromski, B. (2009). Adolescents‘ psychological well-being and perceived
parental involvement: Implications for parental involvement in middle schools. Research
in Middle Level Education, 33(4), 1-13.
Darling, N. (1999). Parenting style and its corrlates. ERIC Digest. ERIC Clearinghouse on
Elemantary and Early Childhood Education Champaign IL.
Darling, N., & Steinberg, L. (1993). Parenting style as context: An integrative model.
Psychological Bulletin, 113(3), 487-496.

165
Dekovic, Maja & Janssens, Jan M . A . M. (1992). Parents' Child-Rearing Style and Child's
Sociometric Status. Developmental Psychology, v28 n5 p925-32 Sep 1992.
den Brok, Perry J.; Levy, Jack; Rodriguez, Rely & Wubbels, Theo (2002). Perceptions of
Asian-American and Hispanic American Teachers and Their Students on Teacher
Interpersonal Communication Style. Teaching and Teacher Education, v18 n4 p447-67
May 2002.
den Brok, P., Brekelmans, M., & Wubbels, T. (2004). Interpersonal teacher behavior and
student outcomes. School Effectiveness and School Improvement, 15(3-4), 407-442.
den Brok, Perry & Levy, Jack (2005). Teacher-Student Relationships in Multicultural
Classes: Reviewing the Past, Preparing the Future, Chapter 5. International Journal of
Educational Research, v43 n1-2 p72-88 2005.
den Brok, P., Fisher, D., Wubbels, T., Brekelmans, M. & Richards, T. (2006). Secondary
teacher‘s interpersonal behavior in Singapore, Brunei and Australia: A cross-national
comparison. Asia Pacific Journal of Education, 26(1), 79-95.
DeRosier M. E., Kupersmidt J. B. & Patterson C. J. (1994). Children‘s academic and
behavioral adjustment as a function of the chronicity and proximity of peer rejection.
Child Development, 65, 1799-1813.
Dillard, J. M., & Campbell, N. J. (1981). Influences of Puerto Rican, Black, and Anglo
parents‘ career behavior on their adolescent children‘s career development. The Vocational
Guidance Quarterly, 30, 139-148.
Doby, John T.; And Others (1980). An Empirical Investigation into the Intellectual, Physical,
Psychological, and Social Consequences of Being Reared an Only Child. Final Report.
238 pp. (ED211198).
Dodge K. A. (1986). A social information processing model of social competence in
children. See Perlmutter 1986, pp. 77-125.
Dodge K. A. , Feldman E. (1990). Issues in social cognition and sociometric status. See
Asher & Coie 1990, pp. 17-59.
Dorman, J.P. (2003). Cross-National Validation of the What Is Happening in This Class
(WIHIC) questionnaire using confirmatory factor analysis. Learning Environments
Research, 6, 231-245.
Dorman, J. P., Fraser, B. J. & McRobbie, C. J. (1997). Relations between school-level and
classroom-level environments in secondary schools. Journal of Educational
Administration, 35, 74-91.
Dornbusch, S., Ritter, P., Leiderman, P., Roberts, D., & Fraleigh, M. (1987). The Relation of

166
Parenting Style to Adolescent School Performance. Child Development, v58 n5 p1244-
1257.
Durbin, D., Darling, N., Steinberg, L., & Brown, B. (1993). Paretig style and peer group
membership among European-American adolescents. Journal of Research in Adolescence,
3, 87-100.
Edwards, L. M. & Price, G. E. (2002). The relationship between perceived parenting style
and hope in college students. Paper presented at the Annual Conference of the American
Psychological Association (109th
, San Francisco, CA, August 24-28, 2001).
Elias, Maurice J. & Haynes, Norris M. (2008). Social Competence, Social Support, and
Academic Achievement in Minority, Low-Income, Urban Elementary School Children.
School Psychology Quarterly, v23 n4 p474-495 Dec 2008.
Elliot, A., & Church, M. (1997). A hierarchical model of approach and avoidance
achievement motivation. Journal of personality and social psychology, 72 (1), 218-232.
Emery, R. E. (1988). Marriage, divorce, and children‘s adjustment. Newbury Park, CA:
Sage.
Esposito, C. (1999). Learning in urban blight: School climate and its effect on the school
performance of urban, minority, low-income children. School Psychology Review, 28,
365–377.
Estell, David B.; Jones, Martin H.; Pearl, Ruth & Van Acker, Richard (2009). Best
Friendships of Students with and without Learning Disabilities across Late Elementary
School. Exceptional Children, v76 n1 p110-124 Fall 2009.
Fabes R. A., Eisenberg N. A., Smith M. C. & Murphy B. C. (1996). Getting angry at peers:
associations with liking of the provocateur. Child Development, 67, 942-56.
Fabes R. A., Shepard S. A., Guthrie I. K. & Martin C. L. (1997). Roles of temperamental
arousal and gender-segregated play in young children‘s social adjustment. Developmental
Psychology, 33, 693-702.
Falbo, T., & Polit, D. (1986). Quantitative review of the only-child literature: Research
evidence and theory development. Psychological Bulletin, 100, 176–189.
Falbo and Polit (1987) Polit, Denise F. & Falbo, Toni (1987). Only Children and Personality
Development: A Quantitative Review, Journal of Marriage and the Family, 49 (May
1987): 309-325.
Falbo, T., & Poston, D. (1993). The academic, personality, and physical outcomes of only
children in China. Child Development, 64, 18–35.
Felsman, D. E., & Blustein, D. L. (1999). The role of peer relatedness in late adolescent

167
career development. Journal of Vocational Behavior, 54, 279-295.
Fenton, N. (1928). The only child. Journal of Genetic Psychology, 35, 546–556.
Fincham, F. D. (1994). Understanding the association between marital conflict and child
adjustment: An overview. Journal of Family Psychology, 8, 123-127.
Fisher, D. L. and others (1997). Gener and cultural differences in teacher-student
interpersonal behavior. From ERIC.
Fisher, T. A.,& Padmawidjaja, I. (1999).Parental influences on career development perceived
by African American and Mexican American college students. Journal of Multicultural
Counseling and Development, 27, 136-152.
Fisher, Darrell; Waldrip, Bruce & den Brok, Perry (2005). Students' Perceptions of Primary
Teachers' Interpersonal Behavior and of Cultural Dimensions in the Classroom
Environment, Chapter 2. International Journal of Educational Research, v43 n1-2 p25-38
2005.
Flanders, N. A. (1970). Analyzing teacher behavior, Reading, MA, Addison-Wesly. Getzels,
J. W. and Jackson, P. W. (1963). The teacher's personality and characteristics, in Gage, N.
L. (Ed.) Handbook of Research on Teaching, Chicago, Rand McNally and Company, pp.
506-82.
Flanagan, Kelly S.; Erath, Stephen A. & Bierman, Karen L. (2008). Unique Associations
between Peer Relations and Social Anxiety in Early Adolescence. Journal of Clinical
Child and Adolescent Psychology, v37 n4 p759-769 Oct 2008.
Fonzi A., Schneider B. H., Tani F. & Tomada G. (1997). Predicting children‘s friendship
status from their dyadic interaction in structured situations of potential conflict. Child
Development, 68, 496-506.
Frank, Todd Michael (2000). Adolescent violent behavior: An analysis across and within
racial/ethnic groups. Journal of Multicultural Social Work, 8(1-2), 47-70.
Fraser, B. J. (1986). Classroom Environment, London, Croom Helm.
Fraser, B. J. (1994). Research on classroom and school climate. In D. Gabel (Ed.), Handbook
of research on science teaching and learning (pp. 493-541). New York: Macmillan.
Fraser, B. J. (1998). Science learning environments: Assessment, effects and determinants. In
B. J. Fraser, & K. G. Tobin (Eds.), International handbook of science education (pp. 527–
564). Dordrecht, The Netherlands: Kluwer.
Fraser, B. J., & Fisher, D. L. (1982). Predicting students‘ outcomes from their perceptions of
classroompsychosocial environment. American Educational Research Journal, 19, 498–
518.

168
Fraser, B. J. & Rentoul, A. J. (1982). Relationship between school-level and classroom-level
environment. Alberta Journal of Educational Research, 28, 212-225.
Fraser, B. J., & Walberg, H. J. (2005). Research on teacher-student relationships and learning
environments: Context, retrospect and prospect. Educational Research 43, 103-109.
French D. (1990). Heterogeneity of peer rejected girls. Child Development, 61, 2028-31.
Furman W., Robbins P. (1985). What‘s the point? Issues in the selection of treatment
objectives. In Children.s Peer Relations: Issues in Assessment and Intervention, (ed.) B.
Schneider, K. H. Rubin, J. E. Ledingham, pp. 41.54. New York: Springer-Verlag
Freud A & Dann S. (1951). An experiment in group upbringing. In The Psychoanalytic Study
of the Child, ed. RS Eisler, A Freud, H Hartmann, E Kris, 6:127.68. New York: Int. Univ.
Press.
Fuligni, Andrew, J. & Zhang, Wenxin (2004). Attitudes Toward Family Obligation Among
Adolescents in Contemporary Urban and Rural China Child Development, 74(1), pp. 180
– 192.
Gamble, Wendy C. & Ramakumar, Sri; Diaz, Abel (2007). Maternal and Paternal
Similarities and Differences in Parenting: An Examination of Mexican-American Parents
of Young Children. Early Childhood Research Quarterly, v22 n1 p72-88 2007.
Gardner, W.L., Gabriel, S., & Lee, A.Y. (1999). ―I‖ value freedom but ―we‖ value
relationships: Self-construal priming mirrors cultural differences in judgment,
Psychological Science 10, pp. 321–326.
Gazelle, H., & Ladd, G. W. (2003). Anxious solitude and peer exclusion: A Diathesis-stress
model of internalizing trajectories in childhood. Child Development, 74, 257-278.
Gazelle, H., & Rudolph, K. D. (2004). Moving toward and away from the world: Social
approach and avoidance trajectories in anxious solitary youth. Child Development, 75,
829-849.
Goh, S. C., & Fraser, B. J. (1998). Teacher interpersonal behavior, classroom environment
and student outcomes in primary mathematics in Singapore. Learning Environment
Research, 1, 199-229.
Gottman J.M. (1983). How children become friends. Monogr. Soc. Res. Child Dev. 48: 1-85.
Greco, Laurie A. & Morris, Tracy L. (2005). Factors Influencing the Link between Social
Anxiety and Peer Acceptance: Contributions of Social Skills and Close Friendships during
Middle Childhood. Behavior Therapy, v36 n2 p197-205 Spr 2005.
Greenspan, Stephen (2006). Rethinking "Harmonious Parenting" Using a Three-Factor
Discipline Model. Child Care in Practice, v12 n1 p5-12 Jan 2006.

169
Hall, A, D., and Frgen, R. E., (1956). ―Definition of System.‖ General Systems Yearbook, 1:
18-28.
Hallinan, M. T. (1983). Commentary: New directions for research on peer influence. In J.
Epstein & N. Karweit (Eds.), Friends in school: Patterns of selection and influence in
secondary schools (pp. 219–231). New York: Academic Press.
Hallinan, M. T., & Williams, R. A. (1990). Students‘ characteristics and the peer-influence
process. Sociology of Education, 63, 122–132.
Hargrove, Byron K., Creagh, Maureen G., & Burgess, Brian L. (2002). Family interaction
patterns as predictors of vocational identity and career decision-making self-efficacy.
Journal of Vocational Behavior, 61, 185-201.
Hargrove, B. K.; Inman, A. G.; & Crane, R. L. (2005). Family interaction patterns, career
planning attitudes, and vocational identity of high school adolescents, Journal of Career
Development, 31, 4, pp.263-278.
Hartup W. W., French D. C., Laursen B., Johnston M. K., & Ogawa J. R. (1993). Conflict
and friendship relations in middle childhood: behavior in a closed-field situation. Child
Development, 64, 445-54.
Helle, Horst Jürgen, (1988). Types of Religious Values and Family Culture, pp. 343-354. In:
Darwin L. Thomas (ed.), The Religion and Family Connection: Social Science
Perspectives. Provo, Utah: Brigham Young University. Distributed by Bookcraft, Inc. ,
Salt Lake City, Utah.
Helmke, A., Schneider, W., and Weinert, F. E. (1986). Quality of instruction and classroom
learning outcomes; the German contribution to the IEA Classroom Environment Study,
Teaching and Teacher Education, 2, 1, pp. 1-18.
Henderson, D.; Fischer, D.; Fraser, B. J. (2000). Interpersonal behavior, laboratory learning
environments, and student outcomes in senior biology classes. Journal of Research in
Science Teaching, 37(1), 26-43.
Hickman, Gregory P. ; Toews, Michelle L. & Andrews, David W. (2001). The Differential
Influence of Authoritative Parenting on the Initial Adjustment of Male and Female
Traditional College Freshmen. Journal of the First-Year Experience & Students in
Transition, v13 n1 p23-46 Spr 2001.
Hill, Nancy E. (1995). The Relationship between Family Environment and Parenting Style:
A Preliminary Study of African American Families. Journal of Black Psychology, v21 n4
p408-23 Nov 1995.
Ho, D. (1996). Filial piety and its psychological consequences. In M. H. Bond (Ed.), The

170
handbook of Chinese psychology (pp. 155 – 165). Hong Kong: Oxford University Press.
Hoang, Thienhuong N. (2007). The Relations between Parenting and Adolescent Motivation.
International Journal of Whole Schooling, v3 n2 p1-21 Sep 2007.
Holland, J. L. (1959). A theory of vocational choice. Journal of Counselling Psychology,
6(1), 35-45.
Holland, J. L. (1962). Some explorations of a theory of vocational choice: I. One- and two-
year longitudinal studies. Psychological Monographs: General and Applied, 76, 1- 49.
Holland, J. L. (1963). Explorations of a theory of vocational choice and achievement: II. A
fouryear prediction study. Psychological Reports, 12, p.547-594
Howes C. & Wu F. (1990). Peer interactions and friendships in an ethnically diverse school
setting. Child Development, 61, 537-41.
Huang, Juan & Prochner, Larry (2004). Chinese Parenting Styles and Children's Self-
Regulated Learning. Journal of Research in Childhood Education, v18 n3 p227 Spr 2004.
Huang, J. H. (1989). Practice of filial piety in modern life. In K. S. Yang (Ed.), The
psychology of Chinese (pp. 25 – 38). Taibei: Guiguan Press.
Hymel S., Rubin K. H., Rowden L., LeMare L. (1990). Children‘s peer relationships:
longitudinal prediction of internalizing and externalizing problems from middle to late
childhood. Child Development, 61, 2004-21.
Isaacs, S. (1931). The experimental construction of an environment optimal for mental
growth. In C. Murchison (Ed.), Handbook of Child Psychology. Worcester, Mass.: Clark
University Press.
Jacobson, Michael G. & Lombard, Robert H. (1992). Effective School Climate: Roles for
Peers, Practitioners, and Principals. Rural Research Report, v3 n4 Spr 1992.
Jegede, O. J., Fraser, B. J. & Okebukola, P. A. (1994). Altering socio-cultural beliefs
hindering the learning of science. Instructional Science, 22, 137-152.
Jia, Yueming; Way, Niobe; Ling, Guangming; Yoshikawa, Hirokazu; Chen, Xinyin; Hughes,
Diane; Ke, Xiaoyan & Lu, Zuhong (2009).. The Influence of Student Perceptions of
School Climate on Socioemotional and Academic Adjustment: A Comparison of Chinese
and American Adolescents. Child Development, v80 n5 p1514-1530 Sep-Oct 2009.
Jiao, Shulan; Ji, Guiping; & Jing, Qicheng (1996). Cognitive Development of Chinese Urban
Only Children and Children with Siblings. Child Development, 1996, 67, 387-395.
Johnson, H. Durell, LaVoie, Joseph C.; & Mahoney, Molly (2001). Interparental conflict and
family cohesion: Predictors of loneliness, social anxiety, and social avoidance in late
adolescence. Journal of Adolescent Research, v16 n3 p304-18 May 2001.

171
Johnson, P., & McNeil, K. (1998). Predictors of developmental task attainment for young
adults from divorced families, Contemporary Family Therapy, 20, 237-250.
Johnson, P., & Nelson, M. D. (1998). Parental divorce, family functioning, and college
student development: An intergenerational perspective, Journal of College Student
Development, 39, 355-363.
Johnson, Patrick; Buboltz, Walter C. & Nichols, Cassandra N. (1999). Parental divorce,
family functioning, and vocational identity of college students. Journal of Career
Development, Vol. 26(2), Winter 1999, pp. 137-146.
Keefe, K., & Berndt, T. J. (1996). Relations of friendship quality to self-esteem in early
adolescence. Journal of Early Adolescence, 16, 110–129.
Kenny, M. E. (1990). College seniors‘ perceptions of parental attachments: The value and
stability of family ties. Journal of College Student Development, 31, 39-46.
Ketterson, T. U., & Blustein, D. L. (1997). Attachment relationships and the career
exploration process. The Career Development Quarterly, 46, 167-178.
Kim, Kyoungho & Rohner, Ronald P. (2002). Parental Warmth, Control, and Involvement in
Schooling: Predicting Academic Achievement among Korean American Adolescents.
Journal of Cross-Cultural Psychology, v33 n2 p127-40 Mar 2002.
Kingery, Julie Newman & Erdley, Cynthia A. (2007). Peer Experiences as Predictors of
Adjustment across the Middle School Transition. Education and Treatment of Children,
v30 n2 p73-88 May 2007.
Kinner, R. T., Brigman, S. L., & Noble, F. C. (1990). Career indicision and family
enmeshment. Journal of Counseling & Development, 68, 309-312.
Kliewer, Wendy; Murrelle, Lenn; Prom, Elizabeth; Ramirez, Melva; Obando, Patricia; Sandi,
Luis & Karenkeris, Maria del Carmen (2006). Violence exposure and drug use in Central
American youth: Family cohesion and parental monitorig as protective factors. Journal of
Research on Adolescence, v16 n3 p455-478 Sep 2006.
Koch, H. L. (1933). Popularity among preschool children: Some related factors and a
technique for its measurement. Child Development, 4, 164-175.
Kochenderfer B., Ladd G. W. (1996). Peer victimization: cause or consequence of school
maladjustment? Child Development, 67:1305-17
Kotrlik, J.W.,&Harrison, B. C. (1989). Career decision patterns of high school seniors in
Louisiana. Journal of Vocational Education, 14, 47-65.
Kovacs D. M., Parker J. G. & Hoffman L. W. (1996). Behavioral, affective, and social
correlates of involvement in cross-sex friendship in elementary school. Child

172
Development, 67, 2269-86.
Krappman L. (1996). Amicitia, drujba, shin-yu, philia, Freundshaft, friendship: on the
cultural diversity of a human relationship. See Bukowski et al (1996), pp. 19-40.
Kuersten, Joan (2000). Only the Lonely? Refuting the Stereotypes Associated with Only
Children. Our Children, v25 n6 p10-12 Mar 2000.
Kupersmidt J. B. & Coie J. D. (1990). Preadolescent peer status, aggression, and school
adjustment as predictors of externalizing problems in adolescence. Child Development,
61, 1350-62.
Kupersmidt J. B., Griesler P. C., DeRosier M. E., Patterson C. J. & Davis P. W. (1995).
Childhood aggression and peer relations in the context of family and neighborhood
factors. Child Development, 66, 360-75.
Kyriakides, Leonidas (2005). Drawing from Teacher Effectiveness Research and Research
into Teacher Interpersonal Behavior to Establish a Teacher Evaluation System: A Study on
the Use of Student Ratings to Evaluate Teacher Behavior. Journal of Classroom
Interaction, v40 n2 p44-66 Win 2005.
Ladd Gary W. (1990). Having friends, keeping friends, making friends, and being liked by
peers in the classroom: predictors of children‘s early school adjustment? Child
Development, 61, 1081-1100.
Ladd, Gary W. (1999). Peer relationships and social competence during early and middle
childhood. Annual Review Psychology, 50, 333-359.
Ladd, Gary W. & Coleman, Cynthia C. (1997). Children's Classroom Peer Relationships and
Early School Attitudes: Concurrent and Longitudinal Associations. Early Education and
Development, v8 n1 p51-66 Jan 1997.
Ladd Gary W., & Crick N. R. (1989). Probing the psychological environment: children.s
cognitions, perceptions, and feelings in the peer culture. In Advances in Motivation and
Achievement, (ed.). C Ames, M Maehr, pp. 1-44. Greenwich, CT: JAI
Ladd G. W. & Kochenderfer B. J. (1996). Linkages between friendship and adjustment
during early school transitions. See Bukowski et al (1996), pp. 322-45.
Ladd G. W., Kochenderfer B. J., Coleman C. C. (1996). Friendship quality as a predictor of
young children‘s early school adjustment. Child Development, 67, 1103-18.
Ladd Gary W., & Mize J. (1983). A cognitive-social learning model of social skill training.
Psychol. Rev. 90, 127-57.
Lagana, Maureen T. (2004). Protective factors for Inner-City Adolescents at Risk of School
Dropout: Family factors and social support. Children & Schools, 26(4), 211-220.

173
Lamborn, S., Mounts, N., Steinberg, L., and Dornbusch, S. (1991). Patterns of competence
and adjustment among adolescents from authoritative, authoritarian, indulgent, and
neglectful families. Child Development, 62, 1049-1065.
Lang, Q. C.; Wong, A.. F. L. & Fraser, B. J. (2005). Teacher-student interaction and gifted
students‘ attitudes toward chemistry in laboratory classrooms in Singapore. Journal of
Classroom Interaction, 40(1), 18-28.
Lansford, Jennifer E. (2004). Links between Family Relationships and Best Friendships in
the United States and Japan. International Journal of Aging and Human Development, v59
n4 p287-304 Apr 2004.
Lapointe, J. M.; Legault, F. & Batiste, S. J. (2005). Teacher Interpersonal Behavior and
Adolescents' Motivation in Mathematics: A Comparison of Learning Disabled, Average,
and Talented Students, Chapter 3. International Journal of Educational Research, v43 n1-2
p39-54 2005.
Leary, T. (1957). An interpersonal diagnosis of personality. New York: Ronald Press
Company.
Leong, Frederick T. L.; Kao, Erika Ming-Chu; & Lee, Szu-Hui (2004). The relationship
between family dynamics and career interests among Chinese Americans and European
Americans. Journal of Career Assessment, 12(1), 65-84.
Leung, K., Lau, S., & Lam, W. L. (1998). Parenting styles and achievement: A cross-cultural
study. Merrill-Palmer Quarterly, 44, 157–172.
Leung, C. Y.-W., McBride-Chang, C., & Lai, B. P.-Y. (2004). Relations among maternal
parenting style, academic competence, and life satisfaction in Chinese Early Adolescents.
The Journal of Early Adolescence, 24(2), 113-143.
Lewin, K. (1931). Environmental forces in child behavior and development. In C. Murchison
(Ed.), Handbook of Child Psychology. Worcester, Mass.: Clark University Press.
Lewin, K. (1951) Field theory in social science; selected theoretical papers. D. Cartwright
(ed.). New York: Harper & Row.
Lewin, K., Lippitt, R. & White, R. (1939). Patterns of aggressive behavior in experimentally
created social climates, Journal of Social Psychology, 10, pp.271-91.
Linden-Andersen, S., Markiewicz, D. & Doyle, A.-B. (2009). Perceived similarity among
adolescent friends: The role of reciprocity, friendship quality, and gender. Journal of Early
Adolescence, 29(5), p617-637.
Lopez, F. G. (1989). Current family dynamics, trait anxiety, and academic adjustment: Test
of a family-based model of vocational identity. Journal of Vocational Behavior, 35, 76-87.

174
Lord, R. G. & Brown (2004). Leadership processes and follower self-identity, Lawrence
Erlbaum, Mahwah, NJ.
Lord, R.G.,Brown, D.J., & Freiberg, S.J. (1999). Understanding the dynamics of leadership:
The role of follower self-concepts in the leader/follower relationship, Organizational
Behavior and Human Decision Processes 78, pp. 167–203.
Maccoby E. E. (1990). Gender and relationships. American Psychologist, 45, 513-21.
Maccoby, E. E., & Martin, J. A. (1983). Socialization in the context of the family: Parent-
child interaction. In P. H. Mussen (Ed.) & E. M. Hetherington (Vol. Ed.), Handbook of
Child Psychology: Vol. 4. Socialization, Personality, and Social Development (4th ed., pp.
1-101). New York: Wiley.
Maehr, M. L. (1984). Meaning and motivation: Toward a theory of personal investment. In
C. Ames & R. Ames (Eds), Research on motivation in education: Student motivation (Vol.
1, pp.115-144). New York: Academic Press.
Mancillas, Adriean (2006). Challenging the Stereotypes about Only Children: A Review of
the Literature and Implications for Practice. Journal of Counselling and Development, 84,
268-275.
Mannarino, A. P. (1980). The development of children‘s friendships. In H. C. Foot, A. J.
Chapman, & J. R. Smith (Eds.), Friendship and social relations in children (pp. 45–63).
New York: Wiley.
Manzi, Claudia; Vignoles, Viaian L.; Regalia, Camillo; & Scabini, Eugenia (2006). Cohesion
and enmeshment revisited: Differentiation, identity, and well-being in two European
cultures. Journal of Marriage and Family, v68 n3 p673-689 Aug 2006.
Marjoribanks, K. (1991). Families, schools, and students‘ educational outcomes. In B. J.
Fraser & H. J. Walberg (eds.), Educational Environments: Evaluation, Antecedents and
Consequences, Pergamon, London, 75-91.
Markus, H. & Kitayama, S. (1991). Culture and the self: Implications for cognition, emotion,
and motivation, Psychological Review 98, pp. 224–253.
Markus, H., & Kunda, Z. (1986). Stability and malleability in the self-concept, Journal of
Personality and Social Psychology 51, pp. 858–866.
Markus, H. & Wurf, E. (1987). The dynamic self-concept: A social psychological
perspective, Annual Review of Psychology 38, pp. 299–337.
Mary E. Gifford-Smith & Celia A. Brownell (2003). Childhood peer relationships: social
acceptance, friendships and peer networks. From ERIC.
Maudry, M., & Nekula, M. (1939). Social relations between children of the same age during

175
the first two years of life. Journal of Genetic Psychology, 54, 193-215.
Moreno, J. L. (1934). Who shall survive?: A new approach to the problem of human
interrelations. Washington, D. C.: Nervous and Mental Disease Publishing Co.
McBride-Chang, C., & Chang, L. (1998). Adolescent-parent relations in Hong Kong:
Parenting styles, emotional autonomy, and school achievement. Journal of Genetic
Psychology, 159, 421–436.
Miller, N. B., Cowan, P. A., Cowan, C. P., & Hetherington, E. M. (1993). Externalizing in
preschoolers and early adolescents: A cross-study replication of a family model.
Developmental Psychology, 29(1), 3-18. EJ 461 700.
Moorman, R.H. & Blakely, G.L. (1995). Individualism–collectivism as an individual
difference predictor of organizational citizenship behavior, Journal of Organizational
Behavior 16, pp. 127–142.
Moos, R. H. (1974). The social climate scales: An overview. Palo Alto, CA: Consulting
Psychologists Press.
Moos, R. H., & Trickett, E. J. (1974). Classroom Environment Scale manual. Palo Alto, CA:
Consulting Psychologists Press.
Moos, R. H. (1979). Evaluating educational environments: procedures, measures, findings
and policy implications. San Francisco: Jossey-Bass.
Moos, R. H. (1991). Connections between school, work, and family settings. In In B. J.
Fraser & H. J. Walberg (eds.), Educational Environments: Evaluation, Antecedents and
Consequences, Pergamon, London, 29-53.
Moos, R. H., & Moos, B. S. (1981). Family Environment Scale Manual. Palo Alto, CA:
Consulting Psychologists Press.
Morris, Charles W., Foundations of the Theory of Signs. In Otto Neurath, Rudolf Carnap,
and Charles W. Morris, eds., International Encyclopaedia of Unified Science, Volume 1,
No. 2. Chicago: University of Chicago Press, 1938, pp. 77-137.
Morrow, M. (1995). The influence of dysfunctional family behaviors on adolescent career
exploration. The School Counsellor, 42, 311-316.
Murdock, Tamera B. (1999). The social context of risk: Status and motivational predictors of
alienation in middle school. Journal of Educational Psychology, Vol. 91(1), 62-75.)
Murphy, L. B. (1937). Social behavior and child psychology: An exploratory study of some
roots of sympathy. New York: Columbia University Press.
National Institute of Child Health and Human Development Early Child Care Research
Network (2008). Social Competence with Peers in Third Grade: Associations with Earlier

176
Peer Experiences in Childcare. Social Development, v17 n3 p419-453 Aug 2008.
Nelson, R. Michael; DeBacker & Teresa K. (2007). Achievement Motivation in Adolescents:
The Role of Peer Climate and Best Friends. Journal of Experimental Education, v76 n2
p170-189 Win 2008.
Orange, M. B., & Fraser, B. J. (2004). Learning environment, attitudes, and achievement
among disabled students in integrated and separate science classrooms. Paper presented at
the annual meeting of the American Educational Research Association, San Diego, CA.
Oyserman, D. (2001). Self-concept and identity. In: A. Tesser and N. Schwarz, Editors,
Blackwell handbook of social psychology: Intraindividual processes, Blackwell, Oxford,
UK, pp. 499–517.
Panak W. F. & Garber J. (1992). Role of aggression, rejection, and attributions in the
prediction of aggression in children. Development and Psychopathology, 4, 145-65.
Park, Hae-Seong & Bauer, Scott (2002). Parenting Practices, Ethnicity, Socioeconomic
Status and Academic Achievement in Adolescents. School Psychology International, v23
n4 p386-96 Nov 2002.
Parke RD, Ladd GW. 1992. Family-Peer Relations: Modes of Linkage. Hillsdale, NJ:
Erlbaum.
Parker, Jeffrey G.; & Asher, Steven, R. (1993). Friendship and friendship quality in middle
childhood: links with peer group acceptance and feelings of loneliness and social
dissatisfaction. Developmental Psychology, 29(4), 611-621.
Parker J. G. & Seal J. (1996). Forming, losing, renewing, and replacing friendships: applying
temporal parameters to the assessment of children‘s friendship experiences. Child
Development, 67, 2248-68.
Parsons, T. A & Bales R. F. (1955) : Family, Socialization and Interaction Process. Illinois,
Glencoe. Pp.3-33.
Parten, M. B. (1932). Social participation among preschool children. Journal of Abnormal
and Social Psychology, 27, 243-269.
Paulussen-Hoogeboom, M. C., Stams, G. J. J. M., Hermanns, J. M.A., Peetsma, T. T. D., &
van den Wittenboer, G. L. H. (2008). Parenting style as a mediator between children‘s
negative emotionality and problematic behavior in early childhood. The Journal of
Genetic Psychology, 2008, 169(3), 209-226.
Penick, N. I., & Jepsen, D. A. (1992). Family functioning and adolescent career
development. Career Development Quarterly, 40, 208-222.
Piaget, J. (1926). The language and thought of the child. London: Kegan, Paul.

177
Piaget, J. (1932). The moral judgment of the child. New York: Harcourt, Brace.
Pipp, Sandra & Robinson, Julianne D. (1985). Adolescents' Constructs of Self, Parents and
Peers. N/A, Reports - Research; Speeches/Meeting Papers from ERIC (ED270704)
Pittman, Laura D.; Chase-Lansdale, P. Lindsay (2001). African American Adolescent Girls in
Impoverished Communities: Parenting Style and Adolescent Outcomes. Journal of
Research on Adolescence, v11 n2 p199-224 2001.
Polit, Denise F. & Falbo, Toni (1985). Siblings and Child Development: Evidence from a
Meta-Analysis of the Literature on Only Children. Paper presented at the Biennial
Meeting of the Society for Research in Child Development (Toronto, Ontario, Canada,
April 25-28, 1985). ED256510 from ERIC.
Poole, M. E., Langan-Fox, J., Ciavarella, M.,& Omodei, M. (1991).A contextual model of
professional attainment: Results of a longitudinal study of career paths ofmen and women.
The Counseling Psychologist, 19, 603-624.
Poston, D., & Falbo, T. (1990). Academic performance and personality traits of Chinese only
children: ―Onlies‖ versus others.American Journal of Sociology, 96, 433–451.
Radke-Yarrow, M., Zahn-Waxler, C. (1986). The role of familial factors in the development
of prosocial behavior: Research findings and questions. In D. Olweus, J. Block, & M.
Radke-Yarrow (Eds.), Developmental of antisocial and prosocial behavior: Research,
theories and issues (pp. 207-233). San Diego, CA: Academic Press.
Renshaw P. D. (1981). The roots of current peer interaction research. In The Development of
Children‘s Friendships, ed. SR Asher, JM Gottman, pp. 1-25. New York: Cambridge Univ.
Press.
Renshaw P. D. & Brown P. J. (1993). Loneliness in middle childhood: concurrent and
longitudinal predictors. Child Development, 64, 1271-84.
Rentoul, A. J., & Fraser, B. J. (1979). Conceptualization of enquiry-based or open classroom
learning environments. Journal of Curriculum Studies, 11, 233–245.
Rivera, Maida; Carrasquillo, Jeanette (1997). Spoiled or Spectacular? A Look at the Only
Child.15 pp. (ED415981), Database: ERIC.
Roberts, L., & Blanton, P. (2001). ―I always knew mom and dad loved me best‖:
Experiences of only children. Journal of Individual Psychology, 57, 125–140.
Roff M, Sells SB. 1967. Juvenile delinquency in relation to peer acceptance-rejection and
socioeconomic status. Psychol. Sch. 5:3-18.
Roopnarine, Jaipaul L.; Krishnakumar, Ambika; Metindogan, Aysegul; & Evans, Melanie
(2006). Links between Parenting Styles, Parent-Child Academic Interaction, Parent-

178
School Interaction, and Early Academic Skills and Social Behaviors in Young Children of
English-Speaking Caribbean Immigrants. Early Childhood Research Quarterly, v21 n2
p238-252 2006.
Rose, Amanda J. (2002). Co-Rumination in the friendships of girls and boys. Child
Development, 73(6), 1830-1843.)
Rosen, L. D., Cheever, N. A., & Carrier, L. M. (2008). The association of parenting style and
child age with parental limit setting and adolescent MySpace behavior. Journal of Applied
Developmental Psychology, 29, 459-471.
Rosenberg, M. (1965). Society and adolescent self-image. Princeton, NJ: Princeton
University Press.
Rubin, Kenneth H.; Dwyer, Kathleen M.; Booth-LaForc, Cathryn; Kim, Angel H.; Burgess,
Kim B. & Rose-Krasnor, Linda (2004). Attachment, Friendship, and Psychosocial
Functioning in Early Adolescence. Journal of Early Adolescence, v24 n4 p326-256 Nov
2004.
Ryans, D. G. (1960). Characteristics of teachers, Washington, American Council on
Education.
Ryan, N. E., Solberg,V. S.,&Brown, S. D. (1996). Family dysfunction, parental attachment,
and career search self-efficacy among community college students. Journal of Counseling
Psychology, 43, 84-89.
Scott, D. J., & Church, A. T. (2001). Separation/attachment theory and career decidedness
and commitment: Effects of parental divorce. Journal of Vocational Behavior, 58, 328-
347.
Schwarz, J. C., Barton-Henry, M. L., & Pruzinsky, T. (1985). Assessing child-rearing
behaviors: A comparison of ratings made by mother, father, child, and sibling on the
CRPBI. Child Development, 56(2), 462-479. EJ 315 787.
Selenta, C., & Lord, R. G. (2005). Development of the levels of self-concept scale:
Measuring the individual, relational, and collective levels. Unpublished manuscript.
Sherif, M. (1936). The Psychology of Social Norms. New York: Harper.
Shin, Yoolim (2007). Peer Relationships, Social Behaviors, Academic Performance and
Loneliness in Korean Primary School Children. School Psychology International, v28 n2
p220-236 2007.
Shirley, M. (1933). The first two years: A study of twenty-five babies (Vo., 2). Minneapolis:
University of Minnesota Press.
Simons, Leslie Gordon & Conger, Rand D. (2007). Linking Mother-Father Differences in

179
Parenting to a Typology of Family Parenting Styles and Adolescent Outcomes. Journal of
Family Issues, v28 n2 p212-241 2007.
Slicker, E. K. (1996). Parenting style and family environment as they relate to academic
achievement and problem behaviors in older adolescents. Paper presented at the Annual
Convention of the National Association of School Psychologists (Atlanta, GA, March 12-
16, 1996).
Slicker, E. K. (1998). Relationship of parenting style to behavioral adjustment in graduating
high school seniors. Journal of Youth and Adolescence, 27(3), 345-372.
Slicker, Ellen K. & Kim, Jwa K. (1996). Parenting Style and Family Type Revisited:
Longitudinal Relationship to Older Adolescent Behavioral Outcome. Reports Research;
Speeches/Meeting Papers from ERIC (ED418350).
Smith, G. J. (2007). Parenting efects on self efficacy and self esteem in late adolescence and
how those factors impact adjustment to college. Paper presented at the Annual Meeting of
the Eastern Psychological Association Philadelphia, PA, March 23-25, 2007.
Smith, I., Soenens, B., Luyckx, K. & Duriez, B. (2008). Perceived parenting dimensions and
identity styles: Exploring the socialization of adolescents‘ processing of identity-relevant
information. Journal of Adolescence, 31, 151–164.
Steinberg, L. (1990). Autonomy, conflict,and harmony in the family relationship. In
Feldman, S., & Elliott, G. (Eds.),. At the Threshold: The Developing Adolescent. Harvard
University, Cambridge, MA.
Steinberg, L., & Elmen, J. D. (1986). Authoritative parening promotes adolescent school
achievement and attendance. From ERIC.
Steinberg, L., Fegley, S., & Dornbusch, S. (1993). Negative impact of part-timne work on
adolescent adjustment: Evidence from a longitudinal study. Developmental Psychology,
29, 171-180.
Steinberg, L., Lamborn, S., Darling, N., Mounts, N., & Dornbusch, S. (1994). Over-time
changes in adjustment and competence among adolescents from authoritative,
authoritarian, indulgent, and neglectful familes. Child Development, 65, 754-770.
Steinberg, L., Mounts, N., Lamborn, S., & Dornbusch, S. (1991). Authoritative parenting and
adolescent adjustment across various ecological niches. Journal of Research in
Adoloscence, 1, 19-36.
Steinberg, L., Lamborn, S., Dornbusch, S., and Darling, N. (1992). Impact of parenting
practices on adolescent achievement: Authoritative parenting, school involvement, and
encouragement to succeed. Child Development. 63, 1266-1281.

180
Steinberg, L., Darling, N., & Fletcher, A. C. (1995). Authoritative parenting and adolescent
adjustment: An ecological journey. In P. Moen, G. H. Elder, Jr., & K. Luscher (Eds.),
Examining Lives in Context: Perspectives on the Ecology of Human Development(pp.
423-466). Washington, DC: American Psychological Assn.
Steinberg, L., Dornbusch, S. M., & Brown, B. B. (1992). Ethnic differences in adolescent
achievement: An ecological perspective. American Psychologist, 47(6), 723-729.
Steinberg, L., Elmen, J., & Mounts, N. (1989). Authoritative parenting, psychosocial
maturity, and academic success among adolescents. Child Development, 60, 1424-1436.
Sun, Rachel C. F. & Hui, Eadaoin (2006). Towards a model of suicidal ideation for Hong
Kong Chinese adolescents. Journal of Adolescence, v29 n2 p209-224 Apr 2006.
Sun, Rachel C. F. & Hui, Eadaoin K. P. (2007). Psychosocial factors contributing to
adolescent suicidal ideation. Journal of Youth and Adolescence, v36 n6 p775-786 Aug
2007.
Swenson, Lisa A.; Nordstrom, Alicia & Hiester, Marnie (2008). The Role of Peer
Relationships in Adjustment to College. Journal of College Student Development, v49 n6
p551-567 Nov-Dec 2008.
Trusty, J., Watts, R. E., & Erdman, P. (1997). Predictors of parents‘ involvement in their
teens‘ career development. Journal of Career Development, 23, 189-201.
Tsui, Ming (2005). Family Income, Home Environment, Parenting, and Mathematics
Achievement of Children in China and the United States. Educational and Urban Society,
Vol. 37 No. 3, May 2005, 336-355.
Turner, Erlanger A.; Chandler, Megan & Heffer, Robert W. (2009). The Influence of
Parenting Styles, Achievement Motivation, and Self-Efficacy on Academic Performance
in College Students. Journal of College Student Development, 50(3), 337-346, May-Jun
2009.
Uruk, Ayse C.; Sayger, Thomas V. & Cogdal, Pamela A. (2007). Examining the influence of
family cohesion and adaptability on trauma symptoms and psychological well-being.
Journal of College Student Psychotherapy, v22 n2 p51-63.
Vandell DL, Hembree SE. 1994. Peer social status and friendship: independent contributors
to children.s social and academic adjustment. Merrill-Palmer Q. 40, 461-77.
Veronneau, M.-H., & Vitaro, F. (2007). Social experiences with peers and high school
graduation: a review of theoretical and empirical research, Educational Psychology, 27, 3,
pp.419-445.
Voelkl, Kristin E. (1996). Measuring students' identification with school. Educational and

181
Psychological Measurement, Vol. 56(5), 760-770.
Vondracek, F.W., Lerner, R. M., & Schulenberg, J. M. (1986). Career development: A life
span approach. Hillsdale, NJ: Lawrence Erlbaum.
Walberg, H. J. (1979). Educational environments and effects: evaluation, policy, and
productivity. Berkely: McCutchan.
Walberg, H. J., & Anderson, G. J. (1968). Classroom climate and individual learning. Journal
of Educational Psychology, 59, 414–419.
Waldrip, Amy M.; Malcolm, Kenya T. & Jensen-Campbell, Lauri A. (2008). With a Little
Help from Your Friends: The Importance of High-Quality Friendships on Early
Adolescent Adjustment. Social Development, v17 n4 p832-852 Nov 2008.
Walker, Joan M. T. (2008). Looking at Teacher Practices through the Lens of Parenting Style.
Journal of Experimental Education, v76 n2 p218-240.
Watzlawick, P., Beavin, J. H. & Jackson, D. (1967). The pragmatics of human
communication, New York, Norton.
Wei, M., den Brok, P., & Zhou, Y. (2009). Teacher interpersonal behavior and student
achievement in English as a Foreign Language classrooms in China. Learning
Environments Research, 12, 157-174.
Weiss, L. H., & Schwarz, J. C. (1996). The relationship between parenting types and older
adolescents' personality, academic achievement, adjustment, and substance use. Child
Development, 67(5), 2101-2114. EJ 539 840.
Wentzel K. R., & Asher S. R. (1995). The academic lives of neglected, rejected, popular, and
controversial children. Child Development, 66, 754-63.
Wentzel, Kathryn R. & Feldman, S. Shirley (1996). Relations of Cohesion and power in
family dyads to social and emotioal adjustment during early adolescence. Journal of
Research on Adolescence, 6(2), 225-244.
Whitesell N. R., & Harter S. (1996). The interpersonal context of emotion: anger with close
friends and classmates. Child Development, 67, 1345-59.
Williams, L. R., Degnan, K.A., Perez-Edgar, K. E., Henderson, H. A., Rubin, K. H., Fine, D.
S., Steinberg, L. & Fox, N. A. (2009). Impact of behavioral inhibition and parenting style
on internalizing and externalizing problems from early childhood through adolescence.
Journal of Abnormal Child Psychology, 37, 1063-1075.
Winne, P. H., and Marx, R. W. (1977). Reconceptualizing research on teaching, Journal of
Teacher Education, 39, 2, pp.53-60.
Wintre, Maxine Gallander & Yaffe, Mordechai (2000). First-Year Students' Adjustment to

182
University Life as a Function of Relationships with Parents. Journal of Adolescent
Research, v15 n1 p9-37 Jan 2000.
Whiston, Susan C. & Keller, Briana K. (2004). The influences of the family of origin on
career development: A Review and Analysis. The Counselling Psychologist, Vol. 32 No.4,
July 2004, p. 493-568.
Wise, Richard A. & King, Alan R. (2008). Family Environment as a Predictor of the Quality
of College Students' Friendships. Journal of Family Issues, v29 n6 p828-848 2008.
Woods, Sarah; Done, John; Kalsi, Hardeep (2009). Peer Victimisation and Internalising
Difficulties: The Moderating Role of Friendship Quality. Journal of Adolescence, v32 n2
p293-308 Apr 2009.
Wubbels, T., Brekelmans, M., & Hermans, J. (1987). Teacher behavior: an important aspect
of the learning environment? The Study of Learning Environments, 3, 10–25.
Wubbels, T., & Levy, J. (1989). A comparison of Dutch and American interpersonal teacher
behavior. In ERIC
Wubbels, Theo; & Levy, Jack (Ed.) (1993). Do you know what you look like? Interpersoal
relationships in education. The Falmer Press. PP. 25-26.
Wubbels, T., & Levy, J. (1993). Do you know what you look like?---Interpersonal
Relationships in Education. London, The Falmer Press.
Wubbels, T., Brekelmans, M., & Hooymayers, H. P. (1991). Interpersonal teacher behavior
in the classroom. In B. J. Fraser., & H. J. Walberg. (Eds.), Educational environments and
effects: Evaluation, antecedents and consequences (pp. 141–160). London, UK: Pergamon
Press.
Wubbels, T., Brekelmans, M. & Hooymayers, H. (1993). Chapter 6 Comparison of teachers‘
and students‘ perceptions of interpersonal teacher behavior. In: Wubbels, T. & Levy, J.
(1993) (Ed.) Do You Know What You Look Like? The Falmer Press.
Wubbels, T., & Brekelmans, M. (1998). The teacher factor in the social climate of classroom.
In B. J. Fraser, & K. G. Tobin (Eds.), International Handbook of Science Education (pp.
565-580). London: Kluwer Academic Publishers.
Wubbels, T., & Brekelmans, M. (2005). Two decades of research on teacher-student
relationships in class. International Journal of Educational Research 43, 6-24.
Wubbels, T., Creton, H.A. & Hooymayers, H. P. (1987). A school-based teacher inducaiton
programme. European Journal of Teacher Education, 10, 81-94.
Wubbels, T., & Levy, J. (1991). A comparison of interpersonal behavior of Dutch and
American teachers. International Journal of Intercultural Relations, 15, 1-18.

183
Wubbels, T. & Levy, J. (1993) (Ed.) Do You Know What You Look Like? The Falmer Press.
Xie, Qing; And Others (1996). Parenting Style and Only Children's School Achievement in
China. Reports Research; Speeches/Meeting Papers from ERIC, ED396819.
Yang, K. S. (1989). Conceptual analysis of the Chinese filial piety. In G. S. Yang (Ed.), The
psychology of Chinese (pp.39 – 73). Taibei: Guiguan Press.
Zakriski A. L. & Coie J. D. (1996). A comparison of aggressive-rejected and nonaggressive-
rejected children‘s interpretations of self-directed and other-directed rejection. Child
Development, 67, 1048-70.

184
Appendix
Table 30 Intercorrelations (one-tailed) between predictor varibles (peer relations, self-concept levels and interactions between them) and
outcome variables
Predictor performence
goal
mastery
goal
avoidance
goal
anxious
socitary
behavior
prosocial
behavior
helping sharing and
cooperation
Affective
relatinship
Positive
SE
Negative
SE
PGA .15** .27*** -.13** -.29*** .34*** .25*** .34*** .18*** .37*** -.30***
BFQ .10* .40*** -.09* -.20*** .49*** .45*** .44*** .36*** .44*** -.18***
sclindiv .57*** .20*** .21*** .11* .08 .03 .04 .15** .14** .12**
sclrelat .15** .54*** -.09* -.14** .54*** .46*** .45*** .48*** .41*** -.16**
sclcollect .10* .55*** -.13** -.24*** .55*** .46*** .49*** .39*** .41*** -.20***
PGA X
sclindiv
.48*** .27*** .09* -.10* .24*** .16** .22*** .21*** .29*** -.09*
PGA X
sclrelat
.18*** .46*** -.15** -.29*** .53*** .43*** .49*** .38*** .48*** -.32***
PGA X
sclcollect
.15** .47*** -.17*** -.32*** .50*** .40*** .48*** .33*** .45*** -.32***
BFQ X
sclindiv
.51*** .34*** .13* -.03 .30*** .24*** .24*** .30*** .31*** -.00
BFQ X
sclrelat
.13** .51*** -.11* -.21*** .60*** .54*** .51*** .48*** .49*** -.22***
BFQ X
sclcollect
.11* .56*** -.14** -.25*** .61*** .54*** .54*** .44*** .48*** -.24***
Note: Because of missing data, N ranged from 398 to 405. *ρ<.05. **ρ<.01. ***ρ<.001. PGA = peer group acceptance, BFQ = best friendship
quality, sclindiv = individual level of self-concept, sclrelat = relational level of self-concept, sclcollect = collective level of self-concept

185
Table 31 Intercorrelations (one-tailed) between predictor variables (favourite teacher behavior variables, self-concept level variables,
interactions between them) and outcome variables
Predictor AAGperf AAGmast AAGavoid anxsolita prosocialbehv helping sharcooper affrelat posse negse
FT cooperative .11* .36*** -.06 -.10* .30*** .25*** .28*** .24*** .28*** -.06
FT opposition .01 -.23*** .20*** .19*** -.18*** -.14** -.22*** -.08 -.10* .21***
FT strict .03 .09* .12** .18*** .14** .11* .10* .14** .13** .08
sclindiv .57*** .20*** .21*** .11* .08 .03 .04 .15** .14** .12**
sclrelat .15** .54*** -.09* -.14** .54*** .46*** .45*** .48*** .41*** -.16**
sclcollect .10* .55**** -.13*** -.24*** .55*** .46*** .49*** .39*** .41*** -.20***
FT cooperative X sclindiv .54*** .30**** .16** .04 .16*** .11* .12** .21*** .22*** .08
FT cooperative X sclrelat .14** .54*** -.09* -.16** .51*** .44*** .44*** .44*** .42*** -.14**
FT cooperative X
sclcollect
.12* .56*** -.12** -.22*** .53*** .44*** .47*** .40*** .41*** -.18***
FT opposition X sclindiv .21*** -.11* .25*** .21*** -.12** -.10* -.16** -.01 -.03 .22***
FT opposition X sclrelat .05 -.08* .18*** .15** -.05 -.03 -.09* .04 -.00 .18***
FT opposition X sclcollect .04 -.06 .16*** .11* -.01 .00 -.05 .05 .02 .17***
FT strict X sclindiv .40*** .19*** .23*** .18*** .14** .09* .08 .19*** .17*** .14**
FT strict X sclrelat .09* .35*** .06 .08 .38*** .32*** .30*** .36*** .30*** -.00
FT strict X sclcollect .07 .38*** .02 .00 .42*** .35*** .36*** .33*** .33*** -.05
Note: Because of missing data, N ranged from 398 to 405. *ρ<.05. **ρ<.01. ***ρ<.001. FT = favourite teacher, sclindiv = individual level of
self-concept, sclrelat = relational level of self-concept, sclcollect = collective level of self-concept

186
Table 32 Intercorelations (one-tailed) between predictor varibles (average teacher behavior variables, self-concept levels and their interactions)
and outcome variables
Predictor AAGperf AAGmast AAGavoid anxsolita prosocialbehv helping sharcooper affectivrelat posse negse
AT cooperative .12** .15** -.09* -.18*** .07 .09* .06 -.01 .02 -.10*
AT opposition .07 .00 .22*** .19*** .08 .10* .04 .11* .11* .16***
sclindiv .57*** .20*** .21*** .11* .08 .03 .04 .15** .14** .12**
sclrelat .15** .54*** -.09* -.14** .54*** .46*** .45*** .48*** .41*** -.16**
sclcollect .10* .55*** -.13** -.24*** .55*** .46*** .49*** .39*** .41*** -.20***
AT cooperative X sclindiv .46*** .21*** .08 -.03 .09* .07 .05 .10* .09* .03
AT cooperative X sclrelat .15** .38*** -.13** -.22*** .33*** .30*** .28*** .23*** .22*** -.17***
AT cooperative X sclcollect .12** .38*** -.14** -.27*** .34*** .30*** .31*** .19*** .22*** -.18***
AT opposition X sclindiv .42*** .13** .27*** .17*** .09* .07 .04 .16** .15** .18***
AT opposition X sclrelat .13** .26*** .16** .10* .31*** .29*** .24*** .32*** .28*** .07
AT opposition X sclcollect .10* .30*** .12** .03 .36*** .33*** .30*** .31*** .31*** .04
Note: Because of missing data, N ranged from 398 to 405. *ρ<.05. **ρ<.01. ***ρ<.001. AT = average teacher, sclindiv = individual level of
self-concept, sclrelat = relational level of self-concept, sclcollect = collective level of self-concept

187
Table 33 Intercorrelations (one-tailed) between predictor variables (family environment variables, self-concept levels and interactions between
them) and outcome variables
AAGper
f
AAGma
st
AAGavo
id
anxsolita prosocial helping sharcoope
r
affectivrelat positivse negtivse
feco .09* .24*** .00 -.15** .26*** .26*** .22*** .11* .21*** -.14**
father_PS .06 .30*** -.00 -.09* .40*** .37*** .32*** .25*** .38*** -.16***
mother_PS .02 .31*** -.01 -.07 .44*** .40*** .35*** .31*** .32*** -.16***
sclindiv .57*** .20*** .21*** .11* .08 .03 .04 .15** .14** .12**
sclrelat .15** .54*** -.09* -.14** .54*** .46*** .45*** .48*** .41*** -.16***
sclcollect .10* .55*** -.13** -.24*** .55*** .46*** .49*** .39*** .41*** -.20***
feco X sclindiv .47*** .27*** .17*** -.01 .20*** .17*** .14** .17*** .21*** .01
feco X sclrelat .11* .43*** -.05 -.19*** .45*** .42*** .38*** .31*** .36*** -.20***
feco X sclcollect .09* .45*** -.07 -.23*** .46*** .42*** .41*** .27*** .35*** -.21***
father_PS X sclindiv .45*** .31*** .16*** .02 .28*** .24*** .21*** .25*** .30*** .01
father_PS X sclrelat .11* .48*** -.05 -.14** .55*** .51*** .46*** .41*** .48*** -.22***
father_PS X sclcollect .08* .49*** -.08 -.20*** .57*** .51*** .49*** .38*** .48*** -.25***
mother_PS X sclindiv .43*** .32*** .15** .03 .31*** .25*** .23*** .29*** .28*** .01
mother_PS X sclrelat .07 .48*** -.05 -.12** .58*** .51*** .47*** .45*** .42*** -.20***
mother_PS X sclcollect .05 .50*** -.08* -.18*** .60*** .53*** .51*** .42*** .43*** -.23***
Note: Because of missing data, N ranged from 398 to 405. *ρ<.05. **ρ<.01. ***ρ<.001. feco = family cohesion, father_PS = father parenting
style, mother_PS = mother parenting style, sclindiv = individual level of self-concept, sclrelat = relational level of self-concept, sclcollect =
collective level of self-concept