learning from roadway lighting research by david m. keith october 2002
TRANSCRIPT

Learning fromLearning fromRoadway Lighting Roadway Lighting
ResearchResearchBy
David M. Keith
October 2002

© 2002 Marshall Design, Inc.
Basic QuestionsBasic Questions• What is roadway lighting?
– illumination on roadways for safety– design criteria: IESNA or AASHTO or ?– a lighting system made up of components:
• lamps & their associated maintenance characteristics• luminaires and their photometric distribution• mounting: height, overhang, spacing and layout
• Why roadway lighting?• What can be learned?
© 2002 Marshall Design, Inc.
Why Roadway Lighting?Why Roadway Lighting?
• Lighting for Public Safety with Public Money• Simplest conditions
– flat continuous surface – repeating cycle, only need a “typical
calculation”
• Complete set of criteria– average, uniformity and veiling luminance
• Lighting System– complex and contradictory interactions

© 2002 Marshall Design, Inc.
Why Roadway Lighting?Why Roadway Lighting?
• Lighting for Public Safety with Public Money– adequate and appropriate roadway lighting
improves public safety• what is adequate and appropriate?• criteria set by IESNA Roadway Lighting Committee• and/or AASHTO • and/or ?
– Public Money - so should be “efficient”– goal: adequate performance for minimum costs
© 2002 Marshall Design, Inc.
Why Roadway Lighting?Why Roadway Lighting?
• Simplest conditions– flat continuous surface
• idealized • likely to be worse in “real life”
– repeating cycle, only need a “typical calculation”• calculation conditions specified in IESNA RP-8-00• one standard calculation grid layout• five“luminaire cycles”, before and after the calc.
grid• “typical” becomes the basis for further calculations
© 2002 Marshall Design, Inc.
Roadway Typical LayoutRoadway Typical Layout
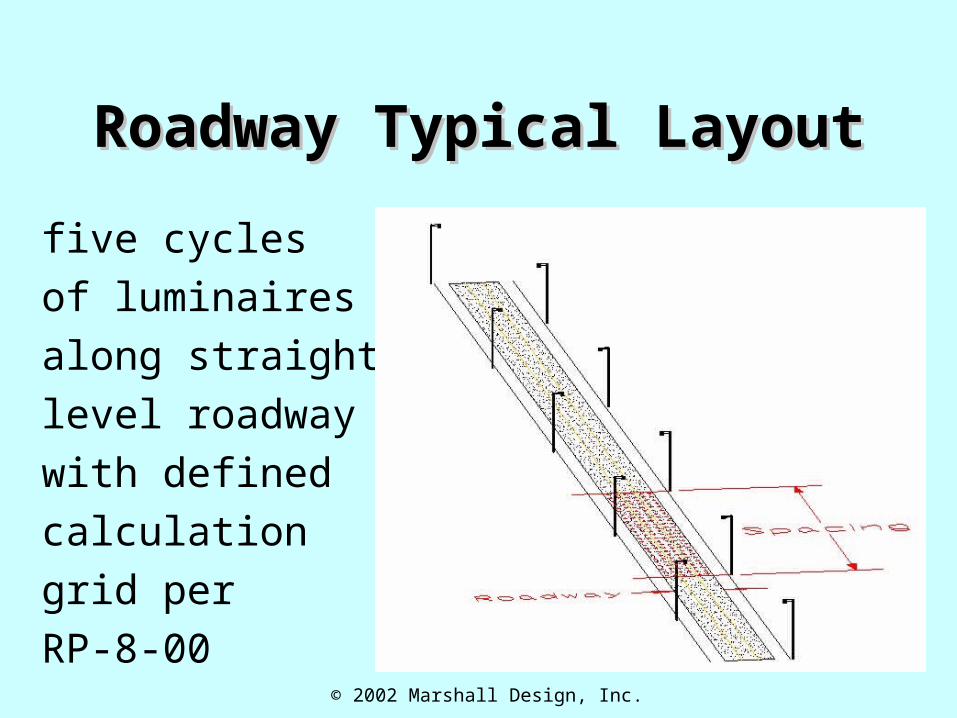
five cyclesof luminairesalong straightlevel roadwaywith definedcalculationgrid perRP-8-00

© 2002 Marshall Design, Inc.
Why Roadway Lighting?Why Roadway Lighting?
• Complete set of criteria– must meet entire set of criteria simultaneously– average, uniformity and veiling luminance/glare
• average & uniformity over the defined calculation grid• veiling luminance is the first metric relating to glare
– details of criteria depend on design method• choice of documents: IESNA or AASHTO or ?• different methods lead to different designs

© 2002 Marshall Design, Inc.
Why Roadway Lighting?Why Roadway Lighting?
• Lighting System– system built from many related-but-
independent components including:• lamps• luminaires• poles, mast arms and foundations• maintenance operations
– complex and contradictory interactions• interactions of any two are complex enough . .
.

© 2002 Marshall Design, Inc.
What can be learned?What can be learned?
• How to do roadway lighting more effectively– meet the requirements for adequate lighting &– reduce costs by reducing equipment
• initial and operating costs • less equipment - from lamps to poles & foundations• less watts - lower electricity charges• less maintenance - less service required
– reduce energy use & associated pollution• thermal, chemical and visual/light

© 2002 Marshall Design, Inc.
What can be learned?What can be learned?
• How to do lighting more effectively– trade-offs
• between competing requirements• between improvement(s) & system performance
– compare available opportunities for improvement(s)
– investigate standard practices & “rules-of-thumb”
– the more similar the lighting, the more valid ...

© 2002 Marshall Design, Inc.
Intermediate QuestionsIntermediate Questions• What exactly are
– roadways– roadway lighting systems?– roadway lighting design criteria?
• What are appropriate metrics for evaluating roadway lighting system performance?– money– pole spacing– unit power density

© 2002 Marshall Design, Inc.
What are roadways?What are roadways?
• Described by IESNA and/or AASHTO by:– surface type (asphalt or concrete)– number of lanes (“traveled way”, no shoulders)
• road width = number of lanes * width of each lane
– traffic classification: Local to Major to Freeway• based on relationships with surroundings and roads
– pedestrian classification: Low, Medium or High• based on potential for conflict with vehicles

© 2002 Marshall Design, Inc.
What are What are Roadway Lighting Roadway Lighting
Systems?Systems?
• a “Roadway Lighting System” includes:– lamps (source type & wattage) and luminaires
• reflect operation and maintenance characteristics• include photometric and electrical characteristics
– geometry of pattern, spacing, height & overhang• setback is considered “negative overhang”
– design criteria to be met• different criteria relate to different lighting systems

© 2002 Marshall Design, Inc.
Roadway Typical LayoutRoadway Typical Layout
five cyclesof luminairesalong straightlevel roadwaywith definedcalculationgrid perRP-8-00

© 2002 Marshall Design, Inc.
Roadway System Roadway System GeometryGeometry

© 2002 Marshall Design, Inc.
Why Roadway Lighting Why Roadway Lighting Systems?Systems?
• NOT limited to evaluating a component's individual characteristics– lamp and source - “white light” or “long life”– luminaire shape or materials– photometric distributions or cutoff categories
• allows comparative evaluation(s) of the associated costs and benefits from potential improvements and/or restrictions

© 2002 Marshall Design, Inc.
What are Roadway What are Roadway Lighting Design Criteria?Lighting Design Criteria?
• American National Standard Practice for Roadway Lighting– ANSI/IESNA RP-8-00, revised in 2000– three separate design methods
• Illuminance• Luminance• Small Target Visibility (STV)
• An Informational Guide to Roadway Lighting– AASHTO 1984 based on ANSI/IESNA RP-8-83

© 2002 Marshall Design, Inc.
Design Methods: Design Methods: IlluminanceIlluminance
• Illuminance method– classical - 1928– lighting system alone
• lamp, luminaire and photometry• system geometry
– one uniformity criterion: average to minimum• no constraint on Emax
– now includes veiling luminance criterion• constrains Lvmax, from luminance calculation

© 2002 Marshall Design, Inc.
Design Methods: Design Methods: LuminanceLuminance
• Luminance method – recent - 1983– roadway and lighting system interaction
• lamp, luminaire and photometry• system geometry• roadway surface
– two uniformity criteria• average to minimum, maximum to minimum
– ”moving observer” & glare calculations
© 2002 Marshall Design, Inc.
Design Methods: STVDesign Methods: STV
• Small Target Visibility method (STV)– brand new in 2000 document– unfamiliar and complex metric VL
• uses luminance, both horizontal and vertical• contrast weighted over entire roadway• veiling luminance included
– extension of luminance calculations– radically different design techniques
• is this suitable for optimization?

© 2002 Marshall Design, Inc.
Roadway Lighting CriteriaRoadway Lighting Criteria Classifications Eavg Eavg / Lavg Lavg / Lmax / Lveil /Roadway Area R3 Emin Lmin Lmin Lavg
(lux) (cd/m2) Major High 17.0 1.20 Med 13.0 3.0 0.90 3.00 5.0 0.3 Collector Med 9.0 4.0 0.60 3.50 6.0 0.4 Local Med 7.0 6.0 0.50 6.00 10.0 0.4
Source: ANSI/IESNA RP-8-00
all system calculations meet entire set(s) of criteria – average(s), uniformities & glare
© 2002 Marshall Design, Inc.
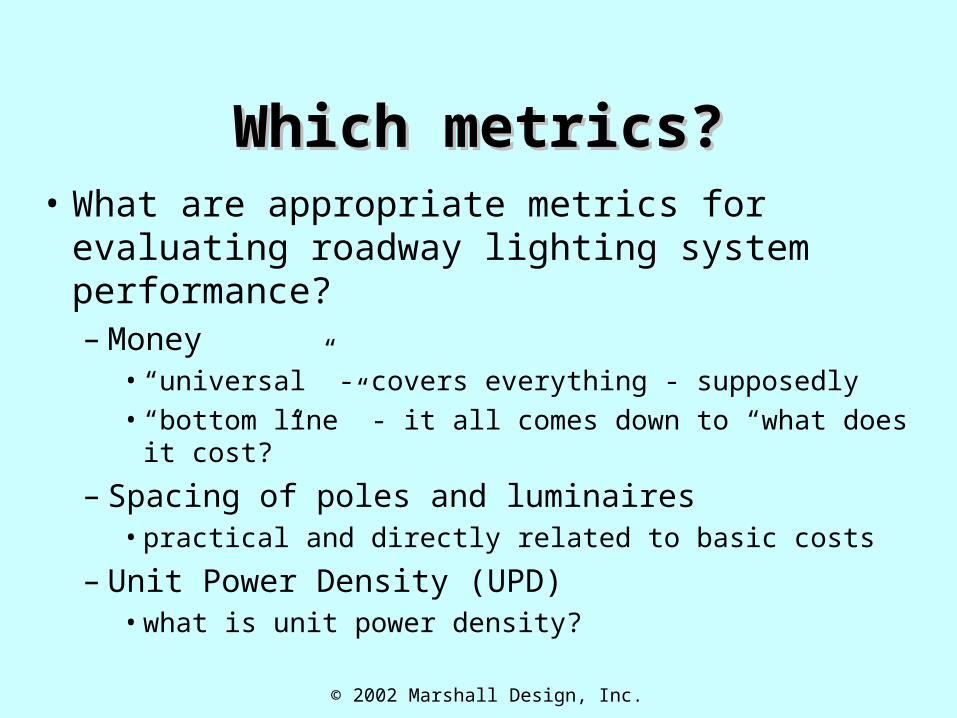
Which metrics?Which metrics?• What are appropriate metrics for evaluating
roadway lighting system performance?– Money
• “universal” - covers everything - supposedly• “bottom line” - it all comes down to “what does it
cost?”
– Spacing of poles and luminaires• practical and directly related to basic costs
– Unit Power Density (UPD)• what is unit power density?

© 2002 Marshall Design, Inc.
What is Unit Power What is Unit Power Density?Density?
• Unit Power Density (UPD) is
the energy for lighting
-------------------------------- divided by
the area of the roadway
• units: Watts / square foot or Watts / square meter
(W/ft2) (W/m2)

© 2002 Marshall Design, Inc.
Which metrics?Which metrics?
• UPD is more appropriate than using Money– UPD is a less complex, more stable evaluation – UPD focuses on lighting system performance
• independent of special or “aesthetic” expenses• does not reflect specific utility costs• does not reflect “the cost of money”
– UPD is less specific, more generally useful to public• suitable for guidelines, legislation and/or ordinances
© 2002 Marshall Design, Inc.
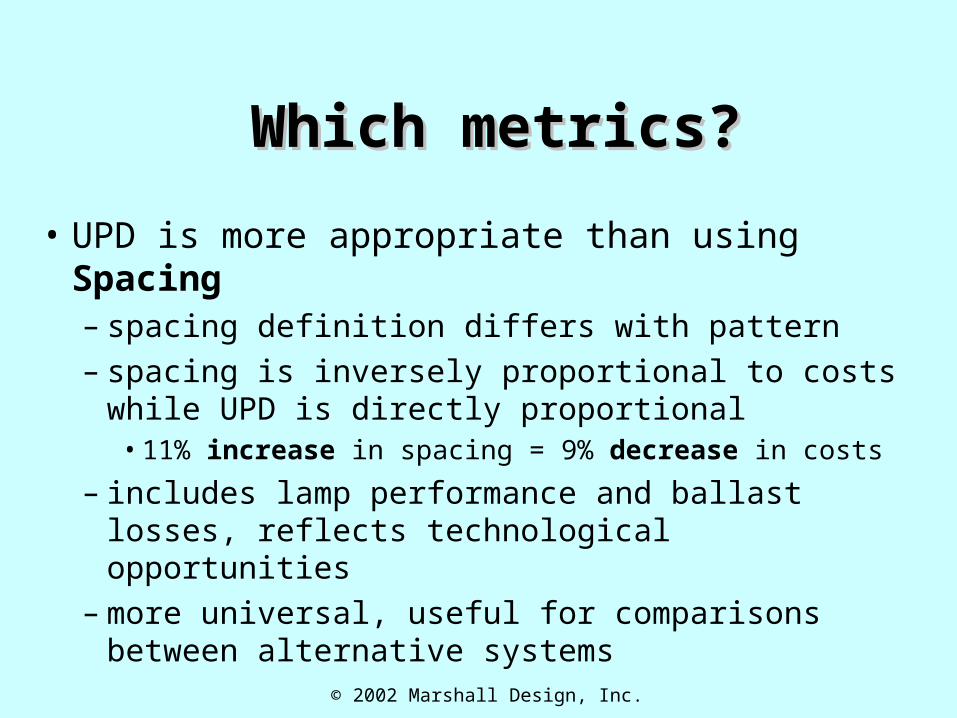
Which metrics?Which metrics?
• UPD is more appropriate than using Spacing– spacing definition differs with pattern– spacing is inversely proportional to costs while
UPD is directly proportional• 11% increase in spacing = 9% decrease in costs
– includes lamp performance and ballast losses, reflects technological opportunities
– more universal, useful for comparisons between alternative systems

© 2002 Marshall Design, Inc.
Which metrics? UPD!Which metrics? UPD!
• applies to lighting systems (not components!)• corresponds in direct proportion to relative costs in
– energy & pollution– installation & equipment– operation & maintenance
• evaluation of relative performance and savings through comparisons
• less valid comparing different wattages or sources– some important aspects of lighting systems not included
• leads to the metric of Unit Uplight Density (UUD)

© 2002 Marshall Design, Inc.
What is Unit Uplight What is Unit Uplight Density?Density?
• Unit Uplight Density (UUD) is
the uplight from lighting
-------------------------------- divided by
the area of the roadway
• units: lumens/square foot or lumens/square meter
(lms/ft2) (lms/m2)

© 2002 Marshall Design, Inc.
Which metrics? UPD & Which metrics? UPD & UUD!UUD!
• Unit Uplight Density (UUD) is closely related to UPD but measures the overall contribution from the lighting system to light pollution in terms of “uplight”– developed from the presentation made to the IESNA
Roadway Lighting Committee by JF Laporte– “uplight” is the total light going up from:
• the luminaire - all flux above horizontal (from “all” luminaires)• the roadway - all flux onto the roadway times the reflectance
of the roadway• the rest of the world - all downward flux which does not land
on the roadway times the reflectance of “the world”
– UUD is the total uplight divided by the same area as UPD

© 2002 Marshall Design, Inc.
Preliminary Research Preliminary Research ScopeScope
• Optimize designs (minimum UPD) over:– a range of roadways
• local, collector or major classification, 1 to 6 lanes
– a range of design criteria• depending on optimization software
– a variety of system components• lamp type - HPS or MH - and wattage• luminaire photometrics: IESNA cutoff classifications
• Compare results and determine next step(s)

© 2002 Marshall Design, Inc.
OptimizationOptimization
• For each combination of “photometry & roadway”– Find the geometry with the maximum spacing
• spacing is indirectly proportional to UPD
– Over a range of mounting heights• overhang set to zero, luminaire over edge of roadway
– Meeting entire set of appropriate criteria– Result is “optimum” for combination (min. UPD)
• but may be impractical
© 2002 Marshall Design, Inc.
Preliminary Research:Preliminary Research:Roadway and Lamp Roadway and Lamp
WattageWattage Roadway Class
---------------------------------------------------------------------
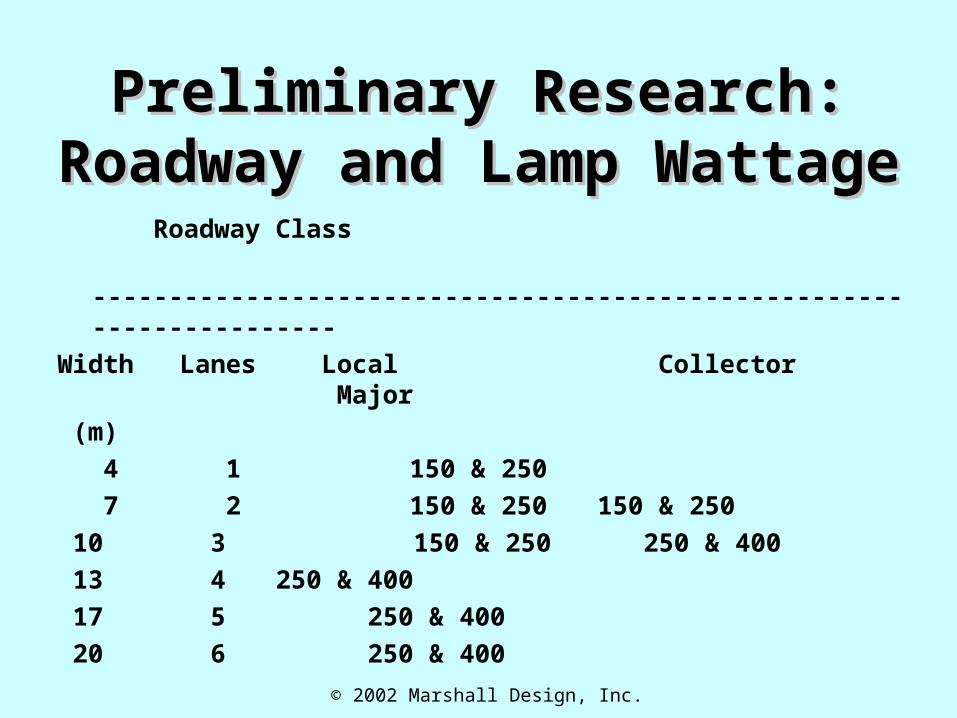
Width Lanes Local Collector Major
(m) 4 1 150 & 250 7 2 150 & 250 150 & 250 10 3 150 & 250 250 & 400 13 4 250 & 400 17 5 250 & 400 20 6 250 & 400
© 2002 Marshall Design, Inc.
Preliminary Research:Preliminary Research:SourcesSources
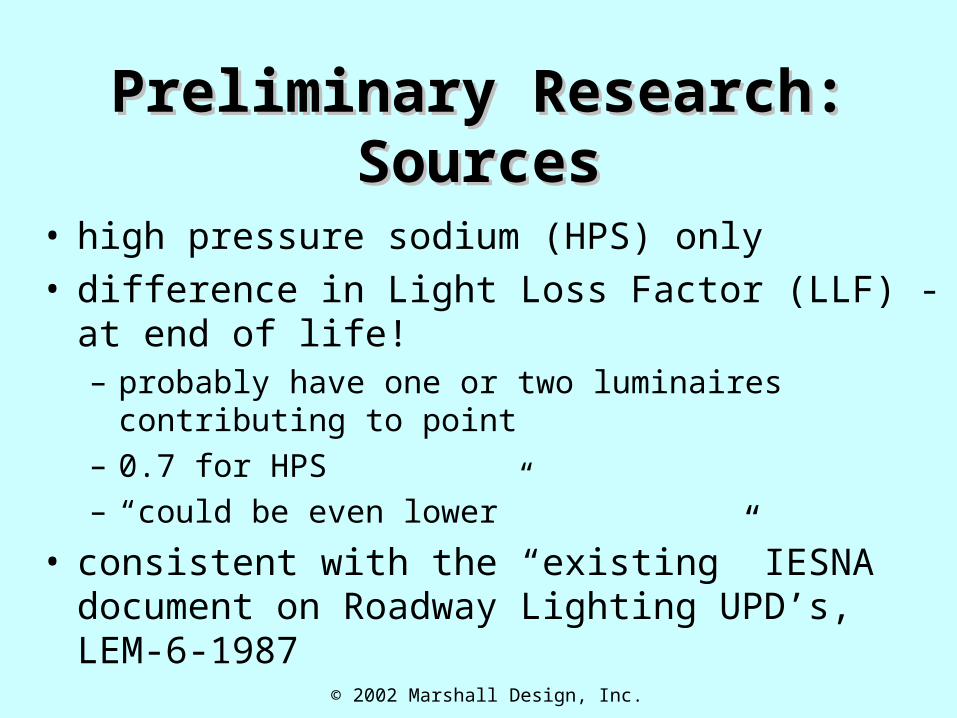
• high pressure sodium (HPS) only• difference in Light Loss Factor (LLF) - at end of
life!– probably have one or two luminaires contributing
to point– 0.7 for HPS– “could be even lower”
• consistent with the “existing” IESNA document on Roadway Lighting UPD’s, LEM-6-1987

© 2002 Marshall Design, Inc.
Preliminary Research:Preliminary Research:Lamp and Luminaire DataLamp and Luminaire DataLamp Wattage Rated Lumens Input Watts
LLF HPS 150 16,000 166
0.70 250 27,500 295
0.70 400 50,000 460
0.70

© 2002 Marshall Design, Inc.
Preliminary Research:Preliminary Research:Photometric FilesPhotometric Files
Lamp Wattage All FC CO SC
HPS 150 18 2 7 9 250 17 5 6 6 400 38 8 16 14 All 73 20% 40% 40%

© 2002 Marshall Design, Inc.
Cutoff ClassificationsCutoff Classifications• values are relative to lamp lumen rating• intensitintensityy limits in two separate zones!!!two separate zones!!!
– “just below horizontal” and “anywhere above horizontal”
FC CO SC

© 2002 Marshall Design, Inc.
UPD CalculationUPD Calculation• UPD =
#Luminaire * (1.15*Watts/luminaire) -----------------------------------------------------(LumCycle * #Lanes * Width of each lane)
• #Luminaire = 2 for staggered arrangement• 1.15 factor to match previous work in
IESNA publication LEM-6-1987
© 2002 Marshall Design, Inc.
UUD CalculationUUD Calculation
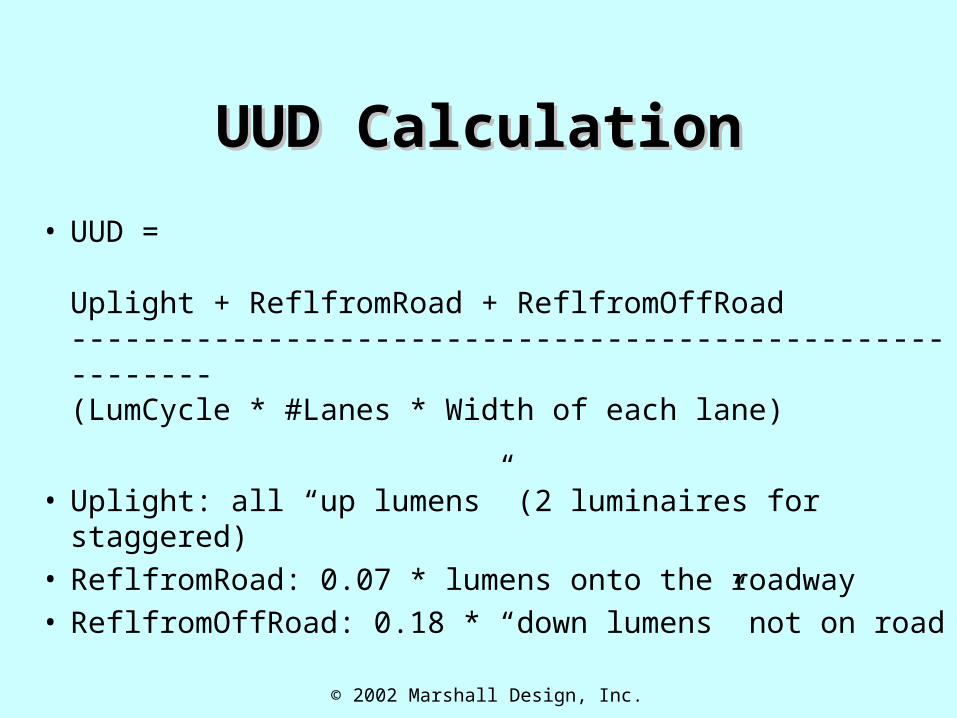
• UUD =
Uplight + ReflfromRoad + ReflfromOffRoad ---------------------------------------------------------(LumCycle * #Lanes * Width of each lane)
• Uplight: all “up lumens” (2 luminaires for staggered)
• ReflfromRoad: 0.07 * lumens onto the roadway• ReflfromOffRoad: 0.18 * “down lumens” not on
road
© 2002 Marshall Design, Inc.
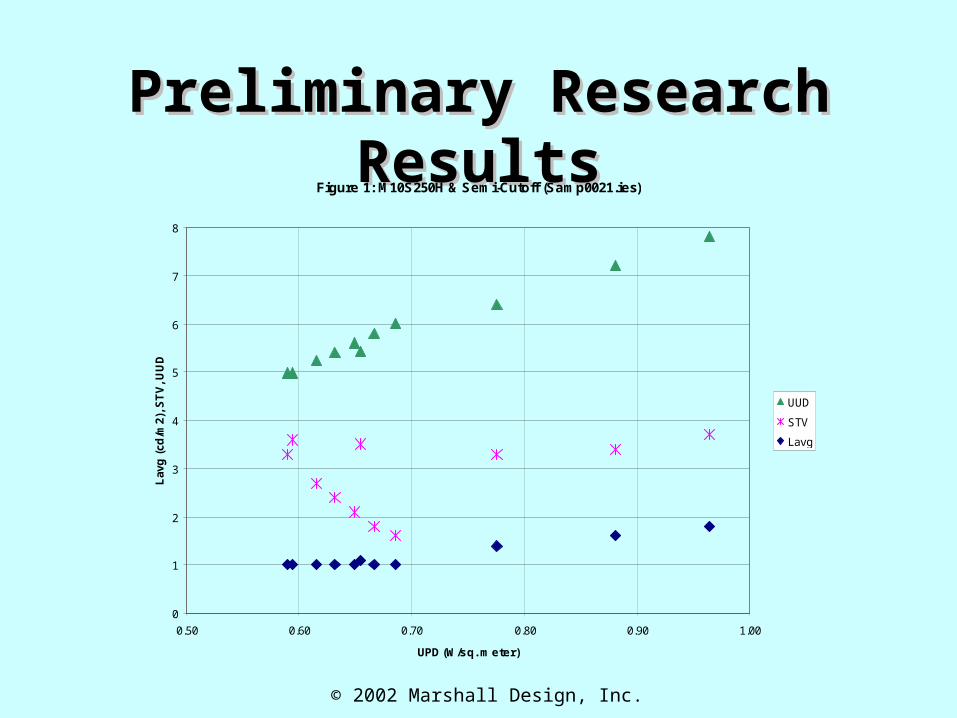
Preliminary Research Preliminary Research ResultsResults
Figure 1: M10S250H & Semi-Cutoff (Samp0021.ies)
0
1
2
3
4
5
6
7
8
0.50 0.60 0.70 0.80 0.90 1.00
UPD (W/sq. meter)
Lav
g (
cd/m
2), S
TV
, UU
D
UUD
STV
Lavg

© 2002 Marshall Design, Inc.
Preliminary Research Preliminary Research ResultsResults
Figure 2: M10S250H & Cutoff (Samp0069.ies)
0
1
2
3
4
5
6
7
8
0.50 0.60 0.70 0.80 0.90 1.00
UPD (W/sq. meter)
Lav
g (
cd/m
2), S
TV
, UU
D
UUD
STV
Lavg

© 2002 Marshall Design, Inc.
Preliminary Research Preliminary Research ResultsResults
Figure 3: M10S250H & Full Cutoff (Samp0064.ies)
0
1
2
3
4
5
6
7
8
0.50 0.60 0.70 0.80 0.90 1.00
UPD (W/sq. meter)
Lav
g (
cd/m
2), S
TV
, UU
D
UUD
STV
Lavg

© 2002 Marshall Design, Inc.
Preliminary Research Preliminary Research ResultsResults
Figure 4: UUD vs UPD (C10S250H)
3.0
3.5
4.0
4.5
5.0
5.5
6.0
0.30 0.40 0.50 0.60 0.70 0.80
UPD (W/sq. meter)
UU
D (
lum
en
s/s
q. m
ete
r)
FC
CO
SC

© 2002 Marshall Design, Inc.
Preliminary Research Preliminary Research ResultsResults

© 2002 Marshall Design, Inc.
Preliminary Research: Preliminary Research: ConclusionsConclusions
• Optimization procedure does work– reliable for illuminance and luminance
methods– not reliable for STV
• Optimum spacing does correspond to optimum UPD - directly proportional
• Semi-cutoff distributions produce lower UPD values than other distributions
• Significant potential for savings is evident

© 2002 Marshall Design, Inc.
Preliminary Research: Preliminary Research: ConclusionsConclusions
• The most effective way to reduce total system uplight is to minimize the UPD (maximize the luminaire spacing) for the particular luminaire– UUD comparisons between photometric files
are less certain than for the same photometry
• The STV method appears to offer the lowest UPD, UUD and associated costs among the three methods
© 2002 Marshall Design, Inc.
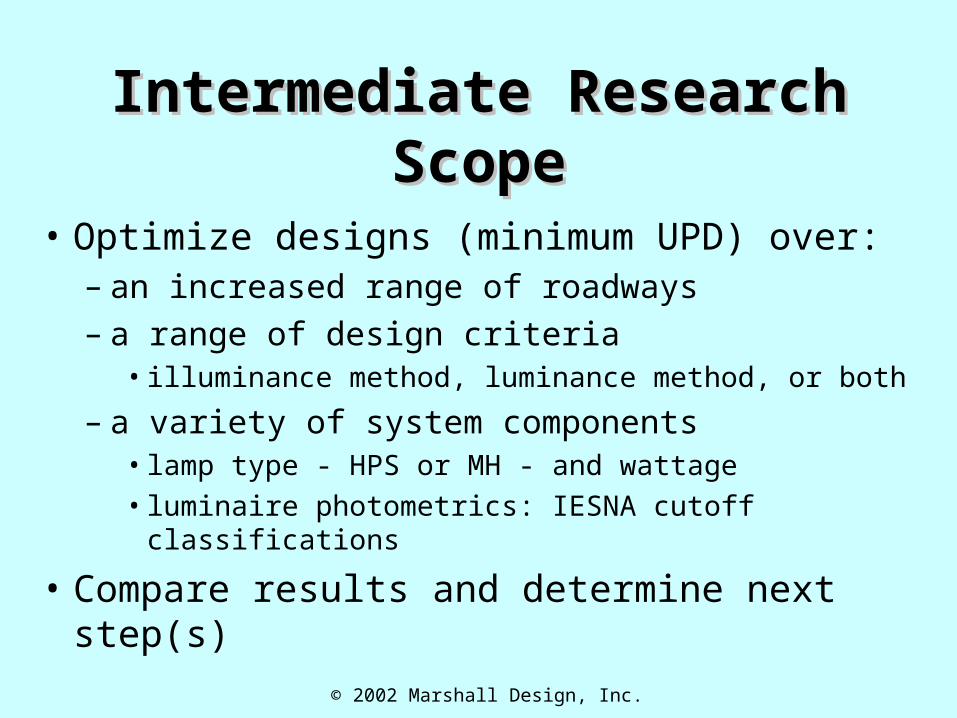
Intermediate Research Intermediate Research ScopeScope
• Optimize designs (minimum UPD) over:– an increased range of roadways– a range of design criteria
• illuminance method, luminance method, or both
– a variety of system components• lamp type - HPS or MH - and wattage• luminaire photometrics: IESNA cutoff
classifications
• Compare results and determine next step(s)

© 2002 Marshall Design, Inc.
Intermediate Research:Intermediate Research:Roadway and Lamp Roadway and Lamp
WattageWattage Roadway Class
---------------------------------------------------------------------
Width Lanes Local Collector Major
(m) 4 1 150/175 & 250 150/175, 250 & 400 7 2 150/175 & 250 150/175, 250 & 400 250
& 400 10 3 150/175, 250 & 400 250 & 400 13 4 250 & 400 17 5 250 & 400 20 6 250 & 400
© 2002 Marshall Design, Inc.
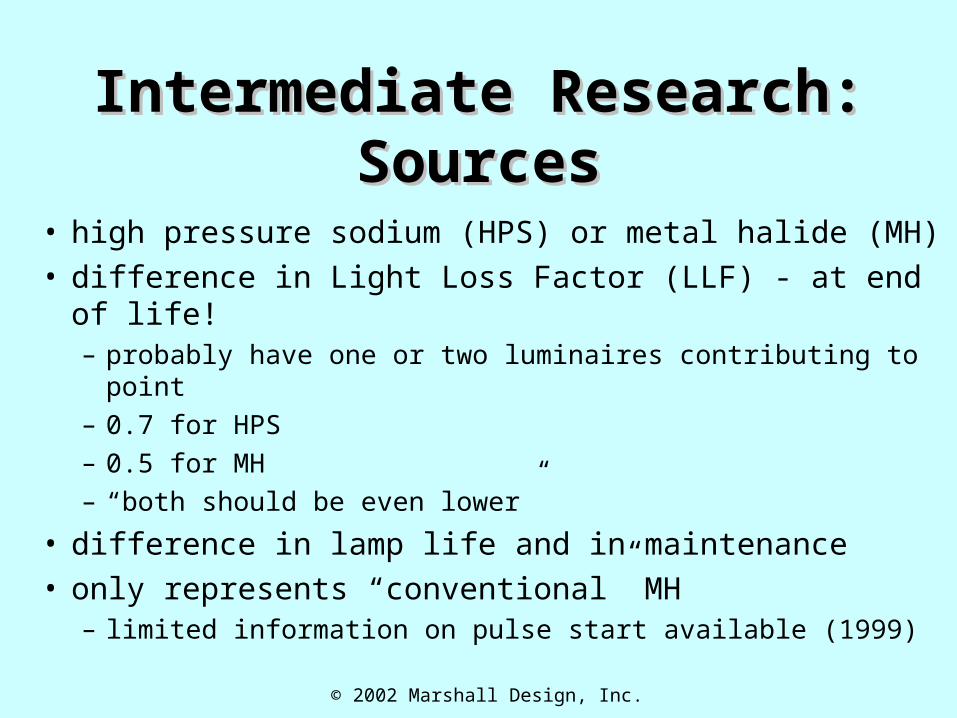
Intermediate Research:Intermediate Research:SourcesSources
• high pressure sodium (HPS) or metal halide (MH)• difference in Light Loss Factor (LLF) - at end of life!
– probably have one or two luminaires contributing to point
– 0.7 for HPS– 0.5 for MH– “both should be even lower”
• difference in lamp life and in maintenance• only represents “conventional” MH
– limited information on pulse start available (1999)

© 2002 Marshall Design, Inc.
Intermediate Research:Intermediate Research:Lamp and Luminaire DataLamp and Luminaire DataLamp Wattage Rated Lumens Input Watts LLF HPS 150 16,000 166 0.70
250 27,500 295 0.70 400 50,000 460 0.70
MH 175 13,500 210 0.50
250 20,500 295 0.50 400 36,000 455 0.50

© 2002 Marshall Design, Inc.
Intermediate Research:Intermediate Research:Photometric FilesPhotometric Files
Lamp Wattage All FC CO SC NC
HPS 150 67 17 21 14 15
250 70 30 19 14 7
400 97 28 36 21 12
All 234 32% 32% 21% 15%
MH 175 59 25 6 15 13
250 47 27 4 9 7
400 47 20 16 4 7
All 153 47% 17% 18% 18%
All 387 38% 26% 20% 16%

© 2002 Marshall Design, Inc.
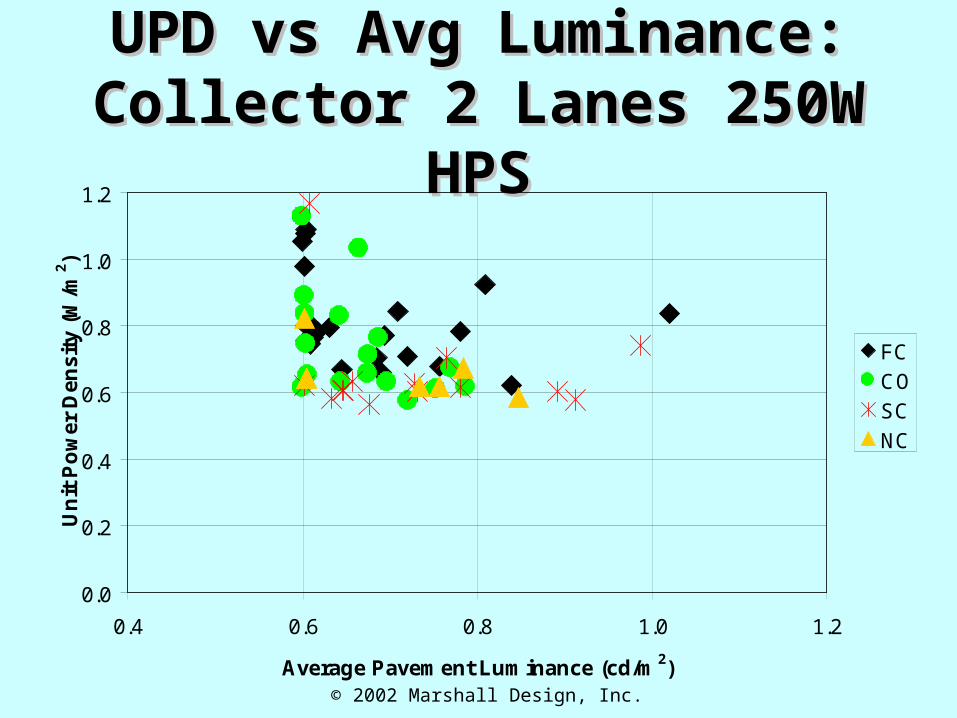
UPD vs Avg Luminance:UPD vs Avg Luminance:Collector 2 Lanes 250W Collector 2 Lanes 250W
HPSHPS
0.0
0.2
0.4
0.6
0.8
1.0
1.2
0.4 0.6 0.8 1.0 1.2
Average Pavement Luminance (cd/m2)
Un
it P
ow
er D
ensi
ty (
W/m
2 )
FC
CO
SC
NC

© 2002 Marshall Design, Inc.
Comparing Cutoff Comparing Cutoff ClassificationsClassifications
• for 250W HPS, photometric file distribution is Lamp Wattage All FC CO SC NCHPS 250 70 30 19 14 7
43% 27% 20% 10%
• Best (lowest) UPD values mostly SC or NC– in “Best 5”, all SC or NC– in “Best 10”, one is CO and all others SC or NC– best FC is tied for 13th best (lowest) UPD value

© 2002 Marshall Design, Inc.
Comparing Design Comparing Design MethodsMethods
• Base calculations meet criteria for BOTHilluminance and luminance methods– this is the most conservative approach
• recalculate for meeting criteria of eitherilluminance method OR luminance method– different criteria, same optimization procedure
• compare each luminaire’s performance undereach single method to Base (BOTH methods)

© 2002 Marshall Design, Inc.
UPD by Design Method:UPD by Design Method:Collector 2 Lanes 250W Collector 2 Lanes 250W
HPSHPS
0.0
0.2
0.4
0.6
0.8
1.0
1.2
1.4
1.6
1.8
S C S S N S S S S C C S N N C S F S C C N N C C F F F F F F F F F
Un
it P
ow
er
De
ns
ity
(W
/m2)
Both
Illum
Lumin

© 2002 Marshall Design, Inc.
Comparing Design Comparing Design Methods: Collector 2 Methods: Collector 2
Lanes 250W HPSLanes 250W HPS UPD (W/m2)#Avgd Base Illum Lum %Decr
to Lum
Best 1 0.56 0.56 0.40 -29%Best 3 0.57 0.57 0.41 -28%Best 5 0.58 0.57 0.43 -24%Best 10 0.59 0.59 0.46 -23%

© 2002 Marshall Design, Inc.
UPD by Design Method:UPD by Design Method:Collector 2 Lanes 250W Collector 2 Lanes 250W
MHMH
0.0
0.2
0.4
0.6
0.8
1.0
1.2
1.4
1.6
1.8
S S N N N N S S N F N N F S S F F F F S F F F C F C C C
Un
it P
ow
er
De
ns
ity
(W
/m2)
Both
Illum
Lumin

© 2002 Marshall Design, Inc.
Comparing Design Comparing Design Methods: Collector 2 Methods: Collector 2
Lanes 250W MHLanes 250W MH UPD (W/m2)#Avgd Base Illum Lum %Decr
to Lum
Best 1 0.85 0.85 0.46 -46%Best 3 0.86 0.86 0.55 -36%Best 5 0.86 0.86 0.60 -31%Best 10 0.91 0.89 0.66 -27%

© 2002 Marshall Design, Inc.
% Increase (Base, any % Increase (Base, any Wattage) in UPD for “Full Wattage) in UPD for “Full
Cutoff Required”Cutoff Required”Road Local Collector Major#Lanes 1L 2L 1L 2L 3L 1L 2L
3L
HPSBest 5 20% 17% 15% 17% 18% 12% 14% 15% Best 10 30% 28% 27% 28% 18% 17% 18% 16%
MHBest 5 19% 19% 18% 22% 20% 13% 14% 12%Best 10 21% 22% 20% 22% 24% 16% 15% 13%

© 2002 Marshall Design, Inc.
Intermediate Research:Intermediate Research:ConclusionsConclusions
• Low wattage corresponds to low UPD values• Best MH UPD is 1.5 to 1.8 times best HPS
– for similar roadways and wattages
• Lower UPD values correspond to luminaire distributions with less stringent cutoff
• UPD for Illum. method similar to Base Case• UPD for Lumin. Method lower than others
– less stringent cutoff distributions improve more

© 2002 Marshall Design, Inc.
Advanced Research ScopeAdvanced Research Scope
• Optimize designs (minimum UPD) over:– some Major High classification roadways– more luminance runs to match base case data– a much greatermuch greater variety of system
characteristics• MH Pulse Start: revise Rated Lamp Lumens• Light Loss Factor: use 0.50 for some HPS runs• OH <= 0: luminaires not allowed over the roadway
• groups shown as Top5 of All dist. or FC only– for comparison purposes

© 2002 Marshall Design, Inc.
Advanced Research:Advanced Research:Roadway and Lamp Roadway and Lamp
WattageWattage Roadway Class
---------------------------------------------------------------------
Width Lanes Local Collector Major: Med & High
(m) 4 1 150/175 & 250 150/175, 250 & 400 250 &
400 7 2 150/175 & 250 150/175, 250 & 400 250 &
400 10 3 150/175, 250 & 400 250 & 400 13 4 250 & 400 17 5 250 & 400 20 6 250 & 400

© 2002 Marshall Design, Inc.
Advanced Research:Advanced Research:Lamp and Luminaire DataLamp and Luminaire DataLamp Wattage Rated Lumens Input Watts LLF HPS 150 16,000 166 0.70
250 27,500 295 0.70 400 50,000 460 0.70
MHP 175 17,500 210 0.50
250 21,500 295 0.50 400 44,000 455 0.50

© 2002 Marshall Design, Inc.
UPD vs Avg Luminance:UPD vs Avg Luminance:Collector 2 Lanes 250W Collector 2 Lanes 250W
MHPMHP
0.0
0.2
0.4
0.6
0.8
1.0
1.2
0.4 0.6 0.8 1.0 1.2
Average Pavement Luminance (cd/m2)
Un
it P
ow
er D
ensi
ty (
W/m
2 )
FC
CO
SC
NC

© 2002 Marshall Design, Inc.
Comparing Cutoff Comparing Cutoff ClassificationsClassifications
• for 250W MH, photometric file distribution is Lamp Wattage All FC CO SC NCMH 250 47 27 4 9 757% 9% 19% 15%
• Best (lowest) UPD values mostly SC or NC– in “Best 5”, all SC or NC– in “Best 10”, one is FC, others all SC or NC– best FC is 9th best (lowest) UPD value
© 2002 Marshall Design, Inc.
UPD vs Avg Luminance:UPD vs Avg Luminance:Collector 2 Lanes 250W Collector 2 Lanes 250W
HPSHPS
0.0
0.2
0.4
0.6
0.8
1.0
1.2
0.4 0.6 0.8 1.0 1.2
Average Pavement Luminance (cd/m2)
Un
it P
ow
er D
ensi
ty (
W/m
2 )
FC
CO
SC
NC

© 2002 Marshall Design, Inc.
UPD vs Avg Luminance:UPD vs Avg Luminance:Collector 2 Lanes 250W Collector 2 Lanes 250W
MHPMHP
0.0
0.2
0.4
0.6
0.8
1.0
1.2
0.4 0.6 0.8 1.0 1.2
Average Pavement Luminance (cd/m2)
Un
it P
ow
er D
ensi
ty (
W/m
2 )
FC
CO
SC
NC

© 2002 Marshall Design, Inc.
Comparing Sources: Comparing Sources: HPS vs MHPHPS vs MHP
UPD (W/m2) #Averaged HPS MHP %Incr
to MHP
Best 1 0.56 0.85 51%Best 3 0.57 0.86 50%Best 5 0.58 0.86 50%Best 10 0.59 0.91 54%

© 2002 Marshall Design, Inc.
Comparing Lamp OutputComparing Lamp Output
• corresponds to the product of:– Light Loss Factor (dependent on maintenance)– Rated Lumens (dependent on lamp technology)
• for one lane roads with HPS luminaires, makeseparate calculations for LLF of 0.50 or 0.70– 40% LLF increase ~ 16% UPD decrease (3:1)
• for all MH, replace standard with Pulse-Start– each 2% lumen increase ~ 1% UPD decr. (2:1)

© 2002 Marshall Design, Inc.
Comparing Overhang Comparing Overhang LimitsLimits
• overhang may be restricted by utility or jurisdiction (it’s a maintenance safety issue)
• recalculate all 250W HPS and MHP for overhang <= zero (Oh<=0)– allow setbacks, but no luminaires over roadway
• typically no effect or increase UPD up to 15%– may change which files have lowest UPD values
• increase greater for wider roadways

© 2002 Marshall Design, Inc.
Comparing UplightComparing Uplight• with the “best six” luminaires
– from 400W MHP on 4 lane Major road– two FC, two CO and two NC– all have full spherical photometric data
• evaluate Unit Power Density (UPD) and Unit Uplight Density (UUD) for each luminaire– does more cutoff correspond to less uplight?– does system efficiency (UPD) correspond to
uplight?

© 2002 Marshall Design, Inc.
UPD vs Avg Luminance:UPD vs Avg Luminance:Major 4 Lanes 400W Major 4 Lanes 400W
MHPMHP
0.0
0.2
0.4
0.6
0.8
1.0
1.2
0.4 0.6 0.8 1.0 1.2
Average Pavement Luminance (cd/m2)
Un
it P
ow
er D
ensi
ty (
W/m
2 )
FC
CO
SC
NC

© 2002 Marshall Design, Inc.
Comparing UPD and UUDComparing UPD and UUD Base UPD Base UUD(W/m2) (lms/m2)
FC 0.78 3.8FC 0.78 4.9CO 0.73 5.2CO 0.74 4.2NC 0.74 4.0NC 0.73 3.9

© 2002 Marshall Design, Inc.
Comparing UplightComparing Uplight
• with the “best six” luminaires• evaluate UPD and UUD for each luminaire• revise conditions
– for overhang <= 0 (luminaire not over roadway)
– for Luminance design method– for Small Target Visibility (STV) design method
• compare trends and UPD-UUD relationship across different conditions

© 2002 Marshall Design, Inc.
Comparing Uplight: UPDComparing Uplight: UPD
0.0
0.1
0.2
0.3
0.4
0.5
0.6
0.7
0.8
0.9
1.0
FC FC CO CO NC NC
Un
it P
ow
er
De
ns
ity
(W/m
2)
Oh <=0
Base
Lum
STV

© 2002 Marshall Design, Inc.
Comparing Uplight: UUDComparing Uplight: UUD
0.0
1.0
2.0
3.0
4.0
5.0
6.0
FC FC CO CO NC NC
Un
it U
plig
ht
De
ns
ity
(lu
me
ns
/m2
)
Oh <=0
Base
Lum
STV

© 2002 Marshall Design, Inc.
Comparing UplightComparing Uplight
• more stringent cutoff (FC or CO) does not necessarily correspond to less uplight
• as UPD increases, UUD increases• as UPD decreases, UUD decreases• changes in UUD are nearly (but not
always) proportional to changes in UPD• more efficient lighting system (lower
UPD) does correspond to less uplight

© 2002 Marshall Design, Inc.
Advanced Research:Advanced Research:ConclusionsConclusions
• The restriction of "overhang less than or equal to zero" makes little if any change to UPD values. As the width of the roadway increases, the change in UPD increases.
• The luminance method offers consistent and significant reductions in UPD compared to the base case. The reduction in UPD becomes smaller as the width of the roadway increases.

© 2002 Marshall Design, Inc.
Advanced Research:Advanced Research:ConclusionsConclusions
• For change in rated lumen or LLF values, the percentage decrease in UPD is only one-half to three-quarters of the increase in the available lumens.– This is significantly different from the widely held
assumption that increases in maintained lumens produce "inversely equivalent" decreases in UPD: a 10% increase (11/10) in maintained lumens would produce a -9% (10/11) change in UPD

© 2002 Marshall Design, Inc.
Advanced Research:Advanced Research:ConclusionsConclusions
• The comparison for the change from Major Medium to Major High shows that conclusions about the rated lumens and LLF comparisons apply for even more aspects of lighting systems. The change in criteria is typically assumed to correspond to a change in UPD of equal percentage, but instead the change in UPD is only one-half to three-quarters of the change in the average illuminance.

© 2002 Marshall Design, Inc.
Advanced Research:Advanced Research:ConclusionsConclusions
• The increase in UPD when full cutoff distributions are required varies as the conditions vary but appears to be consistent and substantial. This is particularly true for narrower roads and the luminance method. For the lighting systems considered in this study, requiring full cutoff distributions corresponds to increases in UPD.

© 2002 Marshall Design, Inc.
% Increase in UPD for FC % Increase in UPD for FC OnlyOnly

© 2002 Marshall Design, Inc.
Overall ConclusionsOverall Conclusions• deltaUPD corresponds strongly to deltaUUD• deltaUPD is ~ 1/2 to 1/3 of deltaLampOutput• UPD drops up to 25% for Luminance method• UPD drops up to 35% for STV method• systems with lowest UPD values typically have
distributions with less stringent cutoff• systems using lower wattage have lower UPD

© 2002 Marshall Design, Inc.
Overall ConclusionsOverall Conclusions• There is a substantial potential for reductions
in equipment, costs, energy use & uplight which correspond to lower Unit Power Density values for roadway lighting systems.
• Comparing systems can lead to results which seem counterintuitive (FC ~ less efficiency).
• The best use of this work may be for comparisons with specific UPD values developed from proposed roadway lighting systems with similar characteristics.

© 2002 Marshall Design, Inc.
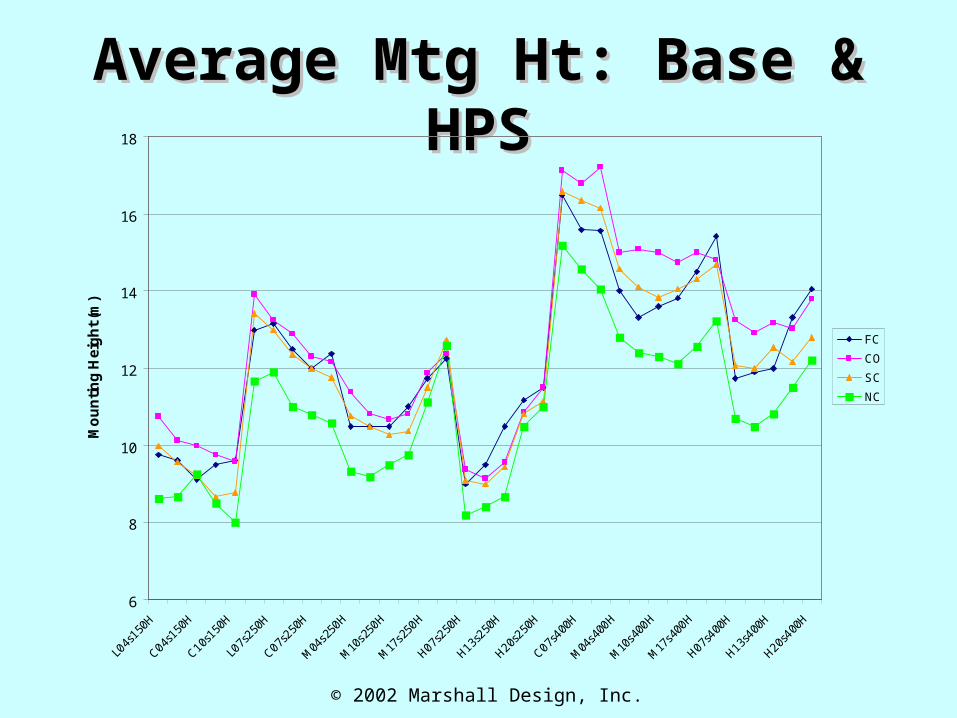
Further ResearchFurther Research
• Additional data from existing research– e.g. mounting heights for “Top10” systems
• Comparisons with proposed designs– potential for improvements
• Comparisons with other photometric files– relative performance– investigate differences for developing
preferred photometric distributions
© 2002 Marshall Design, Inc.
Average Mtg Ht: Base & Average Mtg Ht: Base & HPSHPS
6
8
10
12
14
16
18
L04s
150H
C04s150
H
C10s150
H
L07s
250H
C07s250
H
M04
s250
H
M10
s250
H
M17
s250
H
H07s250
H
H13s250
H
H20s250
H
C07s400
H
M04
s400
H
M10
s400
H
M17
s400
H
H07s400
H
H13s400
H
H20s400
H
Mo
un
tin
g H
eig
ht
(m)
FC
CO
SC
NC

© 2002 Marshall Design, Inc.
LumDnEff vs UPD: Top5F LumDnEff vs UPD: Top5F Collector 2 Lanes 250W Collector 2 Lanes 250W
HPSHPS
0.50
0.55
0.60
0.65
0.70
0.75
65% 70% 75% 80% 85%
Luminaire downward efficiency
UP
D (
W/m
2)
FC
CO
SC
NC

© 2002 Marshall Design, Inc.
Project UPD & UUD Project UPD & UUD EvaluationEvaluation
0
2
4
6
8
10
12
0.00 0.20 0.40 0.60 0.80 1.00 1.20 1.40
Unit Power Density (W/m2 of roadway)
Un
it U
plig
ht
De
ns
ity
(U
plu
me
ns
/m2
of
roa
dw
ay
)
Prop
Rev250
FC 2L
SC 2L
FC 3L
SC 3L

© 2002 Marshall Design, Inc.
Learning fromLearning fromRoadway Lighting Roadway Lighting
Research Research
This presentation is available at:http://resodance.com/ali/presentations.html
Distribution for educational purposes is encouraged!
Please send comments, suggestions, questions or contributions to: