learning objectives - · pdf fileafter reading chapter 3, ... the ncvs also gathers...
TRANSCRIPT

3Property Victimization
INTRODUCTIONWhenever crime or victimization is discussed, the first image that comes to the mind of
most people is the individual who has been the victim of a murder, rape, robbery, theft,
or other crime typically handled by the police. It is these events that make up the annual
crime figures reported each year by the government. These events also provide fodder
for the television shows and movies that entertain us.
This chapter and the following one examine the forms of criminal victimization that
typically comprise the activity of the criminal justice system. In this chapter, we will
LEARNING OBJECTIVES
After reading Chapter 3, you should be able to:
• List the four property crimes that appear in the Part I offenses.
• Define burglary and discuss the elements of the definition.
• Discuss the extent and facts of burglary victimization.
• Provide a definition of larceny/theft.
• Offer insight to the extent of larceny/theft.
• Illustrate the economic impact of theft offenses.
• Show how motor vehicle theft is more inclusive than auto theft.
• Discuss the extent and impact of motor vehicle theft.
• Define arson and discuss its extent.
• Discuss the consequences of Index property crimes.
• Provide a definition of fraud.
• Identify and define methods of traditional fraud.
• Gauge the extent of fraud.
• Define identity theft.
• Discuss how identity theft is committed and why it is more prevalent today.
• List different forms of identity theft.
• Illustrate the extent and impact of identity theft.
• Answer the question “What is mass-marketing fraud?”
• List the three headings of mass-marketing fraud outlined by the Department of Justice.
• Demonstrate knowledge about the extent of mass-marketing fraud.
• Define cybercrime and its different forms.
• Discuss what is known about the extent, victims, and offenders of cybercrime.
• Talk about the costs of property victimization to the victim and society.
43

examine property crimes. More specifically, we will consider the four offenses that com-
prise the Property Crime category of the Part I, Uniform Crime Reports: burglary, lar-
ceny/theft, motor vehicle theft, and arson. A great deal of information is available on
these offenses, including specifics on the number of offenses, the victims, and the
impact of the crimes on the victims and society. Beyond these offenses, this chapter
also looks at the growing problems of fraud, identity theft, mass-marketing fraud, and
cybercrime. Chapter 4 will continue this discussion and look at the personal crimes of
murder, assault, and robbery.
TYPES OF PROPERTY VICTIMIZATIONPeople can suffer property victimization in a number of different ways. Some tend to
raise little fear or concern, such as the theft of a book or an item sitting idle in the yard.
Others generate a great deal of anxiety and fear on the part of the victim. The best exam-
ple of this is when an individual’s home is burglarized (particularly if the person was
present at the time). Other forms of property victimization can cause a lot of financial
pain and hardship, but result in little actual fear, such as in the case of motor vehicle
theft. The common denominator of all of the crimes is the financial loss that faces the
victim.
BurglaryOf all the property crimes, burglary probably engenders the greatest level of angst.
Indeed, in 2009, almost half of those responding to a Gallup poll reported worrying
about their home being burglarized when they were not at home, and one-third worried
about a burglary when they were at home (Maguire, 2010). These levels of worry cut
across both males and females, as well as different races. This is understandable given
the fact that it is in the home where people expect to be free from the dangers of the out-
side world. The very act of burglary destroys that perception and removes the “safe”
sanctuary people count on having.
The FBI’s UCR program defines burglary as “the unlawful entry of a structure to com-
mit a felony or theft” (FBI, 2010a). While most people think of burglary as involving their
home, it is not confined to where an individual lives. A variety of structures can be the
target of burglary, including a house, an apartment, a barn, an office or business, or a
boat. Additionally, there is no need to have used force in entering the structure. Burglary
can occur when an individual simply enters a structure without the legal right to do so.
The key to the definition is that the person entering the structure is doing so with the
intent to commit either a felony offense (such as an assault or rape) or a theft offense.
Burglary is not a rare event. According to the FBI’s UCR, there were almost 2.2 million
burglaries committed in 2009. Of these, 1,393,152 were committed against a residence,
with the balance involving a business (FBI, 2010a). The NCVS also gathers information
on burglaries, although it is limited to households. The 2008 NCVS uncovered roughly
44 VICTIMOLOGY

3.2 million household burglaries (Rand, 2009). It is important to note that the victimiza-
tion data reveal more than a million more total offenses and approximately twice the
number of burglaries against households.
Perhaps a better way to look at the offense data is to consider the offense rates.
Offense rates reflect the number of offenses per some number of individuals (or other
unit of analysis). The FBI typically calculates rates based on offenses per 100,000 indivi-
duals. Comparably, the NCVS offers rates per 1,000 individuals or households. The 2009
UCR burglary rate was 726.9 per 100,000 population (FBI, 2010a), while the NCVS rate
was 2,630.0 per 100,000 households (Rand, 2009). Unfortunately, there is no way to
directly compare these numbers, because one relies on the number of people and the
other uses the number of households. In either case, the figures show that burglary
impacts a substantial number of people in the United States.
The timingof burglaries oftenprompts surprise among thepopulace. Roughly two-thirds
of all residential burglaries take place during the day. Meanwhile, the split for businesses is
roughly even, with half during the day and half at night (FBI, 2010a). The reasons for this are
actually pretty simple. It is during the day that most residences are empty and more attrac-
tive to potential offenders. Businesses, however, are occupied during the day (and often into
the evenings) with both customers and staff, thus making them less attractive and pushing
the offenders to more late night hours if they want to avoid contact with people.
The direct economic loss due to burglary can be very large. According to the 2009
UCR, burglary resulted in $4.6 billion in losses (FBI, 2010a). This works out to an average
loss of $2,096. While these figures include burglaries of any structure, including busi-
nesses, the NCVS offers data on only household offenses. In the victimization data for
2007, 83% of the reporting households claimed to have monetary losses for total
losses of more than $4.5 billion, with an average loss of $1,411 per residence (Bureau
of Justice Statistics, 2010). Twenty percent of the households reported burglary losses
between $250 and $1,000. Another 26% of the households reported losses of more than
$1,000 (Bureau of Justice Statistics, 2010). These figures reveal a staggering economic
impact from burglary that is attributable to the crime alone.
Larceny/TheftLarceny/theft is defined as “the unlawful taking, carrying, leading or riding away of
property from the possession or constructive possession of another” (FBI, 2010a). This
definition covers a wide range of theft behaviors, including the simple taking of unat-
tended property from any location (such as a yard or desk), theft of motor vehicle parts,
theft from a store (i.e., shoplifting), or even picking someone’s pocket or purse. Through-
out these actions is the absence of a confrontation with the victim or the use of force to
take the property. Among the theft offenses not covered under this heading are fraud,
forgery, embezzlement, and similar offenses. Many times the victim may not even
be immediately aware of the loss. Indeed, it is possible that the victim assumes that
the property is simply lost, rather than stolen.
Chapter 3 • Property Victimization 45

Larceny/theft is a very common offense. According to the FBI (2010a), there were
more than 6.3 million offenses in 2009, accounting for two-thirds of all property crimes
(see Table 3–1). The most common forms are from motor vehicles (36.3%) and shoplift-
ing (18.1%). In terms of overall rate of offending, there are 2,061 larceny/thefts for every
100,000 persons. The NCVS offers two theft categories: personal theft (which includes
pickpocketing and purse snatching) and theft. In 2008, there were almost 138,000 per-
sonal thefts reported along with 12.3 million thefts (Rand, 2009). Again, the victimization
figures reveal twice as many offenses as the official police data. The victimization rates
are similarly higher in the NCVS, with 50 personal thefts per 100,000 population (ages 12
and older) and 10,180 thefts per 100,000 households. This latter figure shows that more
than one in 10 households experience a theft victimization each year.
The impact of theft is equally great. Based on UCR figures, the average loss in larceny/
thefts was $864 (FBI, 2010a). When extrapolated to the U.S. population, more than $5.5
billion was lost due to larceny in 2009. The NCVS also offers sobering statistics on loss.
Based on 2007 data, those experiencing a purse-snatching lost an average of $534, and
pick-pocket victims lost an average of $199. These two crimes had a combined loss of
$51 million (Bureau of Justice Statistics, 2010). Theft losses averaged $403, with a total loss
of more than $5.3 billion dollars in 2007 (Bureau of Justice Statistics, 2010). There can be
little doubt that theft has a major economic impact on both the individual and society.
Motor Vehicle TheftThe loss of a car is a major source of stress due to fact that most everyone relies on a
motor vehicle to get to and from work, school, shopping, entertainment, and appoint-
ments. Few cities have a transportation infrastructure that allows people to complete
all their daily tasks without access to personal transportation. A broken-down car on
Table 3–1 Types of Larceny/Theft, 2009
Type Frequency
Pocket-picking 22,952
Purse-snatching 26,281
Shoplifting 990,636
From motor vehicles (except accessories) 1,488,948
Motor vehicle accessories 494,083
Bicycles 83,028
From buildings 606,913
From coin-operated machines 22,482
All others 1,627,275
Total 5,462,598
Source: Adapted from FBI (2010a). Crime in the United States 2009. Washington, DC: U.S. Government
Printing Office. Retrieved September 14, 2010, from http://www.fbi.gov/ucr/cius2009/index.html.
46 VICTIMOLOGY

the way to work causes great angst to many individuals. The loss of a motor vehicle due
to theft similarly raises both anxiety and anger.
According to the FBI (2010a), motor vehicle theft involves “the theft or attempted
theft of a motor vehicle.” While most people think of cars (and some assume the FBI
definition is “auto theft”), motor vehicle theft covers the theft of a wide range of land-
based vehicles, including automobiles and trucks, motorcycles, buses, sport utility vehi-
cles, and snowmobiles. Not covered in this classification are farm machinery, boats, air-
planes, trains, and construction equipment.
Unlike many other offense categories, motor vehicle theft data are very similar across
both official and victimization sources. In 2009, there were 794,616 motor vehicle thefts
according to the FBI (2010a) and 979,640 reported by the NCVS (Rand, 2009). The rates
for motor vehicle theft are 258.8 per 100,000 people (UCR) and 660 per household (NCVS).
Explaining the high levels of reported motor vehicle theft in both official and victimization
sources is easy and straightforward.Motor vehicles are amajor expense formost any house-
hold, thus most are insured against loss. In some cases, insurance is mandated, particularly
if the vehicle is financed or the state requires some form of insurance. Most insurance poli-
cies require that the theft be reported to the authorities before any payments will be made.
This fact results in a high level of official reports that mirror the unofficial reports.
While the actual number of motor vehicle thefts is not as high as other property
crimes, the financial impact of the crime is large. The average loss due to motor vehicle
theft was more than $6,505 in 2009. Nationally, the total loss was more than $5.2 billion
(FBI, 2009). Roughly three-quarters of the theft and loss was of automobiles. Victimiza-
tion data present an equally troubling set of figures, with the average loss at $6,286 and a
gross national loss of $6.1 billion (Bureau of Justice Statistics, 2010).
ArsonThe last of the UCR Part I property crimes is arson. According to the FBI (2010a),
arson is “any willful or malicious burning or attempting to burn, with or without
intent to defraud, a dwelling house, public building, motor vehicle or aircraft, personal
property of another, etc.” Unlike the other crime categories, the UCR does not offer any
estimates on the extent of arson due to the variation in reporting practices by police
agencies. Additionally, arson is not typically addressed in victimization surveys.
Table 3–2 offers information on arson as reported by the UCR. Almost 59,000 arson
cases were reported in 2009 by just under 15,000 law enforcement agencies (FBI,
2010a). Less than 50% were of structures, and more than one-quarter were of some
type of motor vehicle. In terms of structures, roughly 83% were occupied at the time
of the offense. Perhaps of equal concern is the dollar loss related to arson cases. In
2009, the average fire resulted in damages of just over $17,411. This ranges from a low
of $1,791 for “other” forms of property to a high of $93,287 per “industrial/
manufacturing” fire. These dollar figures total almost $895 million in property loss due
to arson.
Chapter 3 • Property Victimization 47

TRENDS IN PROPERTY CRIMEIn Chapter 2 we discussed the fact that both the UCR and NCVS allow for the inspection
of victimization over time. Figure 3–1 graphs official property crime rates for the nation
from 1989 to 2008 (arson is excluded due to limitations in the data). In these figures,
burglary has seen a significant and steady drop since 1989. Both larceny/theft and motor
vehicle theft have seen reductions, although they are not as dramatic, and there has
been mostly a level trend in recent years.
The NCVS has collected victimization data for several years now. This practice per-
mits an inspection of trends. Figure 3–2 graphs property victimization rates since the
NCVS redesign in 1992. A glance at the figures shows a significant reduction in thefts
Table 3–2 Arson Cases
Property Classification Number % % Not in Use Avg. $ Damage
Single-occupancy residential 10,859 21.1 17.6 31,000
Other residential 3,621 7.1 13.4 30,442
Storage 1,525 3.0 20.4 29,885
Industrial/manufacturing 209 0.4 23.9 93,287
Other commercial 2,009 3.2 16.1 78,249
Community/public 2,481 4.8 16.6 26,313
Other structure 2,155 4.2 19.6 10,512
Motor vehicles 13,846 26.9 7,292
Other mobile 731 1.4 15,709
Other 13,945 27.1 1,791
Total 51,389 100.0 17,411
Source: Adapted by authors from FBI (2010a). Crime in the United States 2009. Washington, DC: U.S. Government Printing Office.
Retrieved September 14, 2010, from http://www.fbi.gov/ucr/cius2009/index.html.
Year
2007200520032001199919971995199319911989
Rat
e pe
r 10
0,00
0
4,000
3,000
2,000
1,000
0
BURGLARY
LARCENY
MVT
FIGURE 3–1 Property crime rates, UCR, 1989–2008. Source: Constructed by authors from UCR data.
48 VICTIMOLOGY

but only minor reductions in burglary and motor vehicle theft. These patterns are con-
sistent with conclusions derived from the examination of UCR crime rates.
THE CONSEQUENCES OF INDEX PROPERTY CRIMEAs was noted in Chapter 2, the NCVS provides a wealth of data not available in official
police reports. Key among this information is data on the impact of victimization. The
2008 National Crime Victimization Survey offers a host of information on the costs of
crime to victims (see Table 3–3). There was a gross loss of more than $16 billion asso-
ciated with property crime victimization in 2008 (Bureau of Justice Statistics, 2010).
The bulk of the loss is from motor vehicle theft, followed by household theft and house-
hold burglary. Compounding these financial losses are other ripples, such as time lost
from work. Of those who lose time from work, more than 6% of all property crime vic-
tims reported absences, with almost 11% extending more than one work week and 5%
Year
20082005200320011999199719951993
Rat
e pe
r 10
0,00
0
30,000
20,000
10,000
0
BURGLARY
THEFT
MVT
FIGURE 3–2 Property crime rates, NCVS, 1993–2008. 2006 data excluded due to data inconsistencies. Source:
Constructed by authors from NCVS data.
Table 3–3 Selected Losses Due to the Criminal Event
% w/
Econ.
Gross
Loss in Mean Median % Loss % Loss % Loss % Lost % Loss % Loss % Loss
Offense Loss Millions $ Loss $ Loss <$100 $100–$499 >$500 WorkTime <1 Day 1–10 Days >10 Days
Household
burglary
83.0 $4,536 $1,411 $220 14.4 32.0 41.1 7.1 28.6 64.8 4.5
Motor
vehicle
theft
92.3 $6,158 $6,286 $2,500 0.5 3.2 78.3 21.5 22.1 69.2 5.8
Household
theft
97.2 $5,362 $403 $100 33.7 35.2 14.1 4.8 42.8 48.6 4.9
Source: Constructed by authors from Bureau of Justice Statistics (2010).
Chapter 3 • Property Victimization 49

being out for two or more weeks (Bureau of Justice Statistics, 2010: Table 89). Of course,
it is very difficult, if not impossible, to gauge the impact on lost productivity from the
labor force even after the victim returns to the work site.
Miller and his colleagues (1996) combed through a variety of data sources, including
the NCVS, to get a fuller picture of the costs and consequences of criminal victimization.
They began by compiling a lengthy list of costs extracted by the victimization experi-
ence. As Table 3–4 shows, the annual loss due to just burglary, larceny, motor vehicle
theft, and arson reached $349 million during the 1987–1990 period. These costs include
not only medical costs and property loss, but also losses due to time loss, mental health
care, and criminal justice system costs.
These monetary estimates would escalate considerably if complete information were
available on every single crime incident. At the same time, one should realize that these
figures refer only to a handful of crimes. Other statutory violations (e.g., tax evasion,
white-collar crime, corporate crime, and the like) need to be factored in to arrive at a
more comprehensive assessment. We turn now to three categories of property offending
that add to the burden placed on the victims and society: fraud, identity theft, and
cybercrime.
OTHER ECONOMIC CRIMESThe property crimes discussed so far are often considered under the general heading of
“street crimes”. They are more common events that have faced many victims throughout
the years. That does not make them unimportant or less problematic for the victims.
What is missing from this group of offenses is the growing body of economic crimes that
attack the victim through more subtle and often hidden ways.
These economic crimes have vestiges of some traditional property offenses, but also
rely on emerging electronic technology to prey on victims. A common cornerstone to
these offenses is a type of fraud. What sets fraud apart from other property crimes is
Table 3–4 Annual Losses Due to Crime During 1987–1990, in Millions, Expressed in1993 Dollarsa
Type of Crime Medical Other tangibleb Quality of Life Total
Arson $160 $2,500 $2,400 $5,000
Larceny or attempt $150 $9,000 $0 $9,000
Burglary or attempt $30 $7,000 $1,800 $9,000
Motor vehicle theft or attempt $9 $6,300 $500 $7,000
Total $349 $24,800 $2,910 $30,000
aTotals may appear not to add up due to rounding.bOther tangible items include Property Damage and Loss, Mental Health Care, Police and Fire Services, Victim Services, and Productivity.
Source: Adapted from Miller, T. R., Cohen, M. A., & Wiersema, B. (1996). Victim Costs and Consequences: A New Look. Washington,
DC: National Institute of Justice, p. 17.
50 VICTIMOLOGY

the secrecy and deception involved in the activity. Often, victims do not immediately
know they have been victimized. Fraud is far from a new crime category. Indeed, fraud
is a UCR Part II offense. The difference today is in how the fraud is completed. In this
section we will look at four broad categories of offenses: fraud (in its more traditional
forms), identity theft, mass-marketing fraud, and cybercrime against businesses.
Traditional FraudFraud can be defined as “an act in which attempts are made to deceive with promises of
goods, services, or financial benefits that do not exist, were never intended to be
provided, or were misrepresented” (Office for Victims of Crime, 1998). The key compo-
nent of the definition is the use of deception in completion of the crime. Often this
means that the victim is offered something or invited to participate in something that
promises an attractive payoff, but requires the victim to provide information or finances
in advance of the payoff. Unfortunately, the victim never realizes the promised payoff
and loses what he or she initially provided.
The methods by which traditional fraud was carried out are wide and varied. Some of
the common types of fraud are the following:
• Home repair schemes: The victim is asked for “up-front” money as an initial down
payment or for “supplies”; the offender typically fails to return to complete the
work; often targets the elderly.
• Appliance or auto repair schemes: Similar to home repair schemes, although the
repair may not have been needed in the first place or was not completed at all.
• Insurance fraud: The victim is sold medical or life insurance that is worthless or
not what was promised.
• Award scams: The victim wins a contest or prize but must pay a fee to process the
transactions; the prize or contest may not exist or the fee paid is greater than the
value of the prize.
• Membership fraud: The individual is sold a membership (sometimes a lifetime
membership) in a club or business that either is nonexistent or goes out of
business shortly after the sale.
• Financial or investment fraud: A financial advisor provides misleading or false
information leading to losses by the victim; a loan requires a processing fee and
once paid the loan is never awarded.
• Charity fraud: The offender solicits funds ostensibly on behalf of a charity; the
charity either does not exist or the offender does not turn the funds over to
the charity.
• 900 number phone scams: Victims are enticed to call a number and are billed for
phone time at rates far in excess of what is normal; a caller may contact a regular
phone number and then agrees to be transferred to another person, unaware that
the transfer is to a premium charge line.
Chapter 3 • Property Victimization 51

There is a wide range of other forms of fraud, as well as many variations on those
listed above. Throughout these offenses the victim generally does not realize that he
or she been victimized until days, weeks, or months later.
Gauging the extent of fraud is very difficult. This is due largely to the secrecy of the
initial act. A contributing factor to the lack of information is the reluctance of many
victims to report the crimes. There is a level of shame felt by victims for being duped.
On a more practical level, the UCR does not gather systematic data on fraud. What is
collected by the UCR are figures on the number of arrests for fraud. In 2009, a total of
210,255 arrests were made. This translates into an arrest rate of 67.6 (FBI, 2010a). The
Office for Victims of Crime (1998) suggests that roughly 85% of fraud offenses are not
reported to the police. No other official sources of data exist on fraud, and victimization
surveys generally do not include questions on this type of crime.
One of the few attempts to gauge the extent of fraud using survey methods was con-
ducted in 1991 and published in 1995. Titus and colleagues (1995) conducted a national
phone survey of 1,246 households. Respondents were asked to report on their experi-
ence as a victim of 22 forms of fraud. The results show that 58% of the respondents
had been the victim (or attempted victim) of at least one form of fraud over their life-
times. Roughly one-third of those fraud events took place within the past year, and
48% of those events resulted in a successful fraud being committed. Among the most
common and successful forms of fraud were appliance/auto repair, 900 number fraud,
subscription, and warranty fraud (Titus et al., 1995).
Identity TheftIdentity theft is a common term heard in today’s society, although the term identity theft
was first introduced only a short time ago. McNally and Newman (2008) trace the root of
the term to published newspaper reports in the late 1980s. There is no single accepted
definition for identity theft, and it was not legally defined until passage of the “Federal
Identity Theft and Assumption Deterrence Act” in 1998 (see Table 3–5). This is a rela-
tively broad definition that covers a range of activities from use of false documents to
the production of such documents. A more general, concise definition is that identity
theft “refers to an instance in which an individual’s personal information is used by
another to facilitate an act of fraud” (McNally & Newman, 2008).
The information necessary for an individual to steal someone’s identity can come
from a wide array of sources. Newman (2008) outlines four primary sources: public
records, commercial databases, employment/school records, and family records. A wide
range of different documentation can be obtained from these sources. Included in these
documents are birth certificates, death certificates, Social Security numbers, passports,
credit card and revolving charge accounts, marriage licenses, school records, utility
bills, addresses and phone numbers, and tax records. All of these items can be used
by offenders in setting up fraudulent identities and accounts.
52 VICTIMOLOGY

A primary concern is how potential offenders access these records and documenta-
tion in order to steal someone’s identity. The methods vary, although the use of the
Internet has largely moved the access into the electronic realm. One traditional method
involves the simple theft of mail, which provides addresses, account numbers, personal
information, and other items useful in appropriating an individual’s identity. Another
traditional method entails the theft of an individual’s wallet, purse, or passport.
A variation is an offender copying an individual’s information provided in a legitimate
transaction and using that information again later. In many cases the theft is committed
by someone the victim knows.
Today, identity theft is closely aligned with the Internet and electronic records.
As society has moved toward paperless records and the storage of information on com-
puters, offenders no longer have to have physical access to the records. Instead, they
can access the information over the Internet by either having lawful access to
the files, or illegally gaining entry to the records by hacking into a computer system.
Phishing is another method that involves acquiring information electronically by the
offender posing as a legitimate business that requires the individual to provide per-
sonal information, including account information. These electronic methods can be
used from next door or from around the world. Based on findings from a national sur-
vey of almost 5,000 adults conducted in 2006, most victims did not even know they
were victimized or how it was done (56%) (Synovate, 2007). Sixteen percent claimed
to know the offender, and 7% noted that the theft was due to a past purchase or finan-
cial transaction (Table 3–6).
Table 3–5 Federal Identity Theft and Assumption Deterrence Act
Title 18 Section 1028 of the United States Code defines Identity Theft as when an individual:
1. knowingly and without lawful authority produces an identification document or a false identification document;
2. knowingly transfers an identification document or a false identification document knowing that such document was
stolen or produced without lawful authority;
3. knowingly possesses with intent to use unlawfully or transfer unlawfully five or more identification documents
(other than those issued lawfully for the use of the possessor) or false identification documents;
4. knowingly possesses an identification document (other than one issued lawfully for the use of the possessor) or a
false identification document, with the intent such document be used to defraud the United States;
5. knowingly produces, transfers, or possesses a document—making implement with the intent such document—
making implement will be used in the production of a false identification document or another document—making
implement which will be so used;
6. knowingly possesses an identification document that is or appears to be an identification document of the United
States which is stolen or produced without lawful authority knowing that such document was stolen or produced
without such authority . . .; or
7. knowingly transfers or uses, without lawful authority, a means of identification of another person with the intent to
commit, or to aid or abet, any unlawful activity that constitutes a violation of Federal law or that constitutes a felony
under any applicable State or local law.
Source: Title 18 United States Code, Section 1028.
Chapter 3 • Property Victimization 53

Identity theft can take a variety of forms. The NCVS has included questions on
identity theft since 2004 (Baum, 2007). The Federal Trade Commission has surveyed
the public on identity theft since 2003 (Synovate, 2007). According to the NCVS, more
than 7.9 million households were the victims of identity theft in 2007 (see Table 3–7).
The FTC survey based on surveys of individuals rather than households puts the preva-
lence at 8.3 million victims in 2005 (Synovate, 2007). Theft involving existing credit cards
or other existing accounts is the most common form of identity theft. The establishment
of new accounts and the theft of personal information are also prevalent forms of theft.
Differences in the figures between the two data sources are due to variation in the refer-
ence period under question, the way they count events, and the unit of analysis.
Information on identity theft offers a wealth of additional information. The FTC data
reveal that 61% of the existing accounts involved in identity theft are credit card accounts,
followed by checking and savings accounts (33%), telephone accounts (11%), and Internet
payment accounts (5%) (Synovate, 2007). The NCVS data show that most victims of
Table 3–6 Methods by Which Information Is Taken
Method Percent
Know the thief 16
Purchase or other transaction 7
From wallet 5
From a company 5
Mail 2
Computer hacking 1
Phishing 1
Some other way 7
Don’t know 56
Source: Constructed by authors from Synovate (2007). Federal Trade Commission—
2006 Identity Theft Survey Report. McLean, VA: Synovate.
Table 3–7 Types and Extent of Identity Theft
NCVS FTC
Existing credit cards 3,894,300 3,200,000
Other existing accounts 1,917,000 3,300,000
Personal information 1,031,200 —
Multiple forms 1,086,100 —
New accounts and other — 1,800,000
Total 7,928,500 8,300,000
Source: Constructed by authors from Langton, L., & Baum, K. (2010). Identity Theft Reported by
Households, 2007—Statistical Tables. Washington, DC: Bureau of Justice Statistics; and Synovate
(2007). Federal Trade Commission—2006 Identity Theft Survey Report. McLean, VA: Synovate.
54 VICTIMOLOGY

identity theft are from households with incomes of $75,000 and more (Langton & Baum,
2010). Information from the NCVS suggests that this form of crime has been on the
increase since the first survey was completed in 2003. Many victims fail to realize that a
theft has occurred until long after the event. The most common means by which victims
discovered the theft include noticing missing funds or questionable charges on
accounts or statements (30.8%), being contacted by creditors due to unpaid bills
(20.6%), and experiencing problems with the bank (13.1%) (Baum, 2007).
Like other property offenses, identity theft impacts victims in multiple ways. Most
directly is the cost of the crimes, both to the individuals and to society. The NCVS reports
that the average loss to the individual is $1,830 (Langton & Baum, 2010). The Government
Accountability Office (GAO) (2002) put MasterCard and Visa fraud losses in 2000 at more
than 1 billion dollars and direct loss due to check fraud at $679 million. Beyond actual dol-
lar losses, victims experience considerable lost time trying to resolve the problems, with
18% of households reporting that the problem is ongoing, with another 17.2% reporting
that it took more than one month to resolve the problems and another 9.6% needing
between one week and one month to address the theft (Baum, 2007). Victims also experi-
ence a host of other problems. The FTC survey reports that victims are harassed by collec-
tors, are rejected for credit cards and loans, have accounts frozen, experience insurance
problems, andmay be subjected to criminal investigation or civil lawsuits (Synovate, 2007).
What is not considered in the impact of identity theft are the intangibles. Foremost
among those is the harm done to an individual’s good name and credit. While many
victims are able to resolve the immediate problem within a few days, others have ongo-
ing problems with their credit ratings and ability to operate in the financial arena.
A secondary concern is the cost of investigating and prosecuting offenders by the crimi-
nal justice system. According to the GAO (2002) report, there are no good estimates for
costs related specifically to identity theft, although the average cost to the FBI of inves-
tigating white collar crimes (of which identity theft is one) was $20,000, and the Secret
Service estimates similar investigations at $15,000 per report. The costs to the criminal
justice system of investigating identity theft, therefore, are not inconsequential.
Mass-Marketing FraudIn recent years, fraud has greatly expanded to encompass the use of mass-marketing
techniques. The FBI (2010a) defines mass-marketing fraud as
fraud schemes that use mass-communications media—including telephones, the
Internet, mass mailings, television, radio, and even personal contact—to contact,
solicit, and obtain money, funds, or other items of value from multiple victims in
one or more jurisdictions.
The U.S. Department of Justice (2010) outlines two broad types of mass-marketing
fraud. The first involves schemes that seek to obtain relatively small amounts of money
Chapter 3 • Property Victimization 55

from a large number of victims. In this case, the profit comes from the sheer number of
individuals who are victimized. The second form seeks to maximize the return on a
smaller number of potential victims; this type targets wealthier victims.
A unique feature of this type of fraud is the fact that the offenders can target
victims virtually anywhere in the world. The use of mail, telephones, the Internet,
and the mass media makes borders, whether physical or symbolic, almost meaning-
less. While there are a number of different mass-marketing fraud schemes, there are
several commonalities in the approaches. First is the use of some form of mass com-
munication to reach a wide range of potential victims spread over a large geographic
area (often internationally). A second common feature is the attempt to convince vic-
tims to provide funds or access to funds in return for a promised service or benefit.
Some of these schemes can appear very similar to those seen earlier under identity
theft.
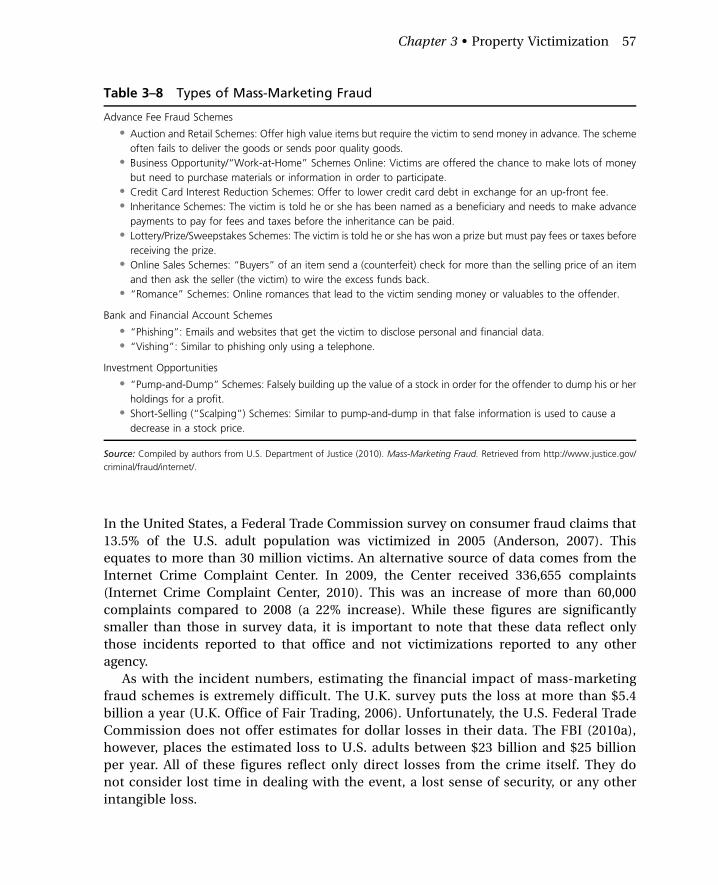
The U.S. Department of Justice (2010) outlines 11 types of mass-marketing fraud
under three general headings (see Table 3–8). The forms under advance fee fraud
schemes all share the common theme of enticing victims to send funds or pay fees in
exchange for a promised item or service that would greatly benefit the victim. In all
cases either the victim receives nothing or the item/service received is of greatly infe-
rior value. Bank and financial account schemes involve getting victims to disclose per-
sonal and financial information that the offender can use to access the victim’s funds
or valuables. This activity typically involves contact over an electronic medium, such
as the Internet or telephone. Finally, investment opportunities schemes entail the
manipulation of stocks or securities to raise or lower their value. The offender, know-
ing that the information being used to alter the price is false, is able to make a profit by
taking action on the true value at the expense of the victim who acts on the false
information.
Gauging the extent of mass-market fraud schemes is not an easy task. Three main
reasons can be offered for the lack of definitive data on these offenses. First, many of
these offenses are relatively new crime forms, and both the public and the criminal jus-
tice system are playing catch-up in identifying and addressing them. Second, there is no
systematic method for collecting and disseminating information on mass-market
crimes. While the FBI and other agencies are working to gather such data, the work is
still in its infancy. Third, many individuals either do not know they have been victimized
or do not report the event to the authorities due to embarrassment and shame. Despite
these facts, we can glean some information on the extent and impact of mass-marketing
fraud.
Most of the information that is available is from victim surveys or complaints filed
by victims. The U.K. Office of Fair Trading (2006) reports that almost half of their
survey respondents had been approached by a scammer in some way over their life-
times. Of those individuals, 8% had been the victim of some form of scam, with most
of the events taking place in the past year. The survey report estimates that more than
3.2 million people (6.5% of the U.K. adult population) are victimized every year.
56 VICTIMOLOGY
In the United States, a Federal Trade Commission survey on consumer fraud claims that
13.5% of the U.S. adult population was victimized in 2005 (Anderson, 2007). This
equates to more than 30 million victims. An alternative source of data comes from the
Internet Crime Complaint Center. In 2009, the Center received 336,655 complaints
(Internet Crime Complaint Center, 2010). This was an increase of more than 60,000
complaints compared to 2008 (a 22% increase). While these figures are significantly
smaller than those in survey data, it is important to note that these data reflect only
those incidents reported to that office and not victimizations reported to any other
agency.
As with the incident numbers, estimating the financial impact of mass-marketing
fraud schemes is extremely difficult. The U.K. survey puts the loss at more than $5.4
billion a year (U.K. Office of Fair Trading, 2006). Unfortunately, the U.S. Federal Trade
Commission does not offer estimates for dollar losses in their data. The FBI (2010a),
however, places the estimated loss to U.S. adults between $23 billion and $25 billion
per year. All of these figures reflect only direct losses from the crime itself. They do
not consider lost time in dealing with the event, a lost sense of security, or any other
intangible loss.
Table 3–8 Types of Mass-Marketing Fraud
Advance Fee Fraud Schemes
• Auction and Retail Schemes: Offer high value items but require the victim to send money in advance. The scheme
often fails to deliver the goods or sends poor quality goods.
• Business Opportunity/“Work-at-Home” Schemes Online: Victims are offered the chance to make lots of money
but need to purchase materials or information in order to participate.
• Credit Card Interest Reduction Schemes: Offer to lower credit card debt in exchange for an up-front fee.
• Inheritance Schemes: The victim is told he or she has been named as a beneficiary and needs to make advance
payments to pay for fees and taxes before the inheritance can be paid.
• Lottery/Prize/Sweepstakes Schemes: The victim is told he or she has won a prize but must pay fees or taxes before
receiving the prize.
• Online Sales Schemes: “Buyers” of an item send a (counterfeit) check for more than the selling price of an item
and then ask the seller (the victim) to wire the excess funds back.
• “Romance” Schemes: Online romances that lead to the victim sending money or valuables to the offender.
Bank and Financial Account Schemes
• “Phishing”: Emails and websites that get the victim to disclose personal and financial data.
• “Vishing”: Similar to phishing only using a telephone.
Investment Opportunities
• “Pump-and-Dump” Schemes: Falsely building up the value of a stock in order for the offender to dump his or her
holdings for a profit.
• Short-Selling (“Scalping”) Schemes: Similar to pump-and-dump in that false information is used to cause a
decrease in a stock price.
Source: Compiled by authors from U.S. Department of Justice (2010). Mass-Marketing Fraud. Retrieved from http://www.justice.gov/
criminal/fraud/internet/.
Chapter 3 • Property Victimization 57

Cybercrime Against BusinessesCybercrime can be defined as “crime that occurswhen computers or computer networks are
involved as tools, locations, or targets of crime” (Newman, 2010). The growth of the Internet
over the past two decades has greatly expanded the ability of offenders to target new and
diverse victims. No longer is it necessary to be geographically proximate to the victim to
commit an offense. Some of the frauds already discussed in this chapter rely on or use com-
puter technology and the Internet to complete the event.Newman (2010) lists seven types of
cybercrime: hacking into computer systems; privacy violations (i.e., spying on the victim’s
computer use); identity theft; phishing; information theft (typically for resale); denial of ser-
vice (causing systems or the Internet to collapse); and virus attacks (releasing viruses into
computers). What is not included in this list is the use of the Internet to promote deviant
activities, such as child pornography or other sexual behaviors. In some cases these actions
are committed for financial gain; in others it is simply to disrupt the activity of the victim.
As we have dealt with several forms of fraud and theft that use computers and the Inter-
net earlier in this chapter, we will turn our focus here to cybercrime against businesses.
Individuals and households are not the only victims of fraud and theft. Businesses are
prime targets of a wide range of property offenses, and the growth of computers and the
Internet has opened new avenues for exploiting businesses. Recognizing the threat poten-
tial of computer crime, the U.S. Department of Justice and the Department of Homeland
Security inaugurated the National Computer Security Survey in 2005 (Rantala, 2008). Three
forms of cybercrime were considered in the survey: cyber attacks—computer viruses,
denials of service, and electronic vandalism or sabotage; cyber theft—theft of money,
computer-based embezzlement, theft of intellectual property, fraud, and theft of data;
and other incidents—adware, spyware, hacking, phishing, and so on.
In the 2005 survey, a total of 7,818 businesses responded, with two-thirds reporting
some form of cyber attack (Rantala, 2008). Almost 60% reported a cyber attack, while
11% reported cyber theft, and one-fourth indicated some other form of cyber victimiza-
tion. The most common form of cyber attack involved being infected with a virus. Most
businesses were victimized more than once. In total, more than 22 million incidents of
cybercrime were uncovered in the survey, with three-quarters of those incidents involving
use of the Internet (Rantala, 2008).
The economic impact of cybercrime on businesses is not inconsequential. A total of
$867 million were lost by the 5,081 victimized businesses (Rantala, 2008). This equates
to an average loss of $170,636 per business. Of course, not all victims experience the
same level of loss. More than 25% had a monetary loss between $10,000 and $99,000,
with another 13% having losses in excess of $100,000. Beyond just dollar loss, businesses
also experience lost time as a result of unexpected business downtime. Businesses
reported almost 324,000 hours of downtime due to some form of cybercrime, with
two-thirds of that time due to a cyber attack (Rantala, 2008).
The survey also provides some insight to the offenders in cybercrimes. A majority of
suspected offenders (71%) are outsiders to the business, regardless of the type of
58 VICTIMOLOGY

incident (Rantala, 2008). Similarly, three-quarters of the cyber attacks and 72% of
the other cyber incidents appear to be by outsiders. Conversely, 74% of the suspected
offenders in cyber thefts are insiders, with the bulk of these suspects involved in
embezzlement cases (Rantala, 2008). Despite the great number of events, especially
when an insider is suspected to be the culprit, only 15% reported the crime to law
enforcement. The businesses are more apt to report the events to other business
organizations (Rantala, 2008).
It is easy to ignore cybercrime against businesses in discussions of victimization.
Indeed, many discussions of crime victims focus on individuals and families as victims
and fail to examine businesses as victims. This is unfortunate because the harm to busi-
nesses has implications for society and individuals. For society, the loss incurred by
businesses can have negative impacts on the viability of companies to stay in business
and thus have an impact on communities and employees. For individuals, cybercrime
against businesses can result in higher prices and costs of products as the businesses pass
on the losses to the consumers. Individuals also suffer from lost work time and unemploy-
ment as businesses have to adjust to the victimizations. It is important to note that indi-
viduals and society suffer indirectly from the victimization of businesses.
Summary of Property Crime TypesProperty crime is much greater than depicted in UCR and victimization reports of burglary,
larceny/theft, motor vehicle theft, and arson. Recent years have seen a great growth in fraud
offenses using computers, the Internet, and other electronic media. These are not new
types of crimes; rather, they are a modern version of fraud crimes that have been around
for a long time. The reach of these new fraud offenses places many more individuals in a
vulnerable position, and the losses resulting from the offenses reach astronomical levels.
Methods of addressing these offenses are still in the development stage. What also needs
to be developed are means of assisting those who are victimized by property crimes.
FURTHER COSTS OF PROPERTY VICTIMIZATIONThe discussion so far has focused on defining the problem of property victimization,
the extent of the different types, and the economic consequences to the victims and society.
What has not been adequately discussed is other consequences of property victimization.
Property crime victims suffer from a variety of ills due to the victimization. First, they
face a financial loss, whether through the direct loss of cash or through the loss of prop-
erty. Many victims may not have insurance to cover any losses, or their insurance will
not reimburse them for the type of loss they incurred. Certainly, falling victim to a
mass-marketing inheritance scam is not something covered by insurance policies. In
these types of cases the loss is born solely by the victim. For victims without property
insurance, even a burglary, arson, or motor vehicle theft leaves the individual with
out-of-pocket losses for which there is no recompense.
Chapter 3 • Property Victimization 59
Second, there are many different emotional consequences that may follow a property
victimization. The Office for Victims of Crime (1998) has pointed out that victims often
experience shame, guilt, and self-blame for the event. Many victims opt not to tell any-
one about the event out of a sense of guilt or shame. They may isolate themselves from
others who they perceive might ridicule them for their lack of foresight or judgment that
“allowed” them to be victimized. Indeed, some observers may condemn the victim as
“getting what he deserved” (Office for Victims of Crime, 1998). These emotional costs
can be more debilitating than the financial losses resulting from the crime.
A third consequence of many types of property crime is a lost sense of security in both
the home and society. In the case of home burglary, victims lose the belief that they can be
safe in their homes from the crime and turmoil that occur “out there.” Whether the crime
occurred when the resident was home or not, there is an increased sense of insecurity and
anxiety that can permeate every facet of daily living. Where do you go to feel safe if you
cannot do so in your home? Anxiety and a loss of trust also emerge as a result of any type
of fraud. Victims may lose all sense of trust in banks/financial institutions, charities, the
use of credit cards, or anything they equate with their victimization.
There is most likely a new level of frustration and indifference with the criminal
justice system as a result of the crime. Property crimes are notoriously hard to clear.
Indeed, the clearance rate (i.e., the rate at which someone has been arrested, charged,
and turned over for prosecution, or the identity of the offender is known but for some
reason cannot be charged or located) for property crimes is very low. The clearance rates
for the UCR Part I property crimes are larceny/theft, 21.5%; burglary, 12.5%; and motor
vehicle theft, 12.4% (FBI, 2009). This leaves the vast majority of property crimes
unsolved and the victims feeling that contacting the authorities is a waste of time.
The sole reason for contacting the authorities for many victims is the requirement that
a report be made before an insurance claim can be paid. For many victims, calling the
police is an effort in futility.
SUMMARYProperty victimization is a pervasive problem in society. Interestingly, it receives rela-
tively little attention in comparison to personal offenses. This is largely due to the fact
that individual personal offenses are more heinous and often result in serious bodily
injury or death. As such, personal offenses raise greater alarm and fear for the populace.
They also provide more interesting fodder for both news programming and fictional
media presentations. Despite these facts, property crimes are much more common
and have a major impact on both individuals and society.
The extent and impact of property crimes are not small. Many more people are vic-
tims of property crime each year than victims of personal offenses. The economic losses
related to property crime are also not inconsequential given the number of offenses.
Losses easily reach into the billions of dollars each year. There is a clear need for addi-
tional attention to be paid to property crime victims, particularly in terms of
60 VICTIMOLOGY

understanding their plight and addressing their post-victimization needs. The needs of
these victims are not totally different from those of personal crime victims, although
the needs do diverge at some points. Before addressing those needs, we will turn to a
discussion of personal crime victimization.
KEY TERMS FOR CHAPTER 3
advance fee fraud scheme
arson
bank and financial account scheme
burglary
clearance rate
cyber attacks
cybercrime
cyber theft
Federal Identity Theft and Assumption Deterrence Act
fraud
identity theft
investment opportunities
scheme
larceny/theft
mass-marketing fraud
motor vehicle theft
phishing
Table 3–9 Selected Internet Sites Dealing with Victimization Statistics
Bureau of Justice Statistics: NCVS http://bjs.ojp.usdoj.gov/content/pub/pdf/cvus07.pdf
FBI Uniform Crime Reports http://www.fbi.gov/about-us/cjis/ucr/crime-in-the-u.s/2009
Federal Trade Commission http://www.ftc.gov/bcp/edu/microsites/idtheft/
Office for Victims of Crime http://www.ojp.usdoj.gov/ovc
U.K. Office of Fair Trading http://www.oft.gov.uk/
U.S. Department of Justice http://www.justice.gov/criminal/fraud/internet/
Chapter 3 • Property Victimization 61