learning progressions in k-8 classrooms - college of education
TRANSCRIPT

Synthesis Report 87
Learning Progressions in K-8 Classrooms: How Progress Maps Can Influence Classroom Practice and Perceptions and Help Teachers Make More Informed Instructional Decisions in Support of Struggling Learners
N A T I O N A L
C E N T E R O N
E D U C AT I O N A L
O U T C O M E S
In collaboration with:Council of Chief State School Officers (CCSSO)
National Association of State Directors of Special Education (NASDSE)
Supported by:U.S. Office of Special Education Programs

Synthesis Report 87
Learning Progressions in K-8 Classrooms: How Progress Maps Can Influence Classroom Practice and Perceptions and Help Teachers Make More Informed Instructional Decisions in Support of Struggling Learners
Karin K. Hess Center for Assessment
January 2012
All rights reserved. Any or all portions of this document may be reproduced and distributed without prior permission, provided the source is cited as:
Hess, K. K. (2012). Learning progressions in K-8 classrooms: How progress maps can influence classroom practice and perceptions and help teachers make more informed instructional decisions in support of struggling learners (Synthesis Report 87). Minneapolis, MN: University of Minnesota, National Center on Educational Outcomes.

N A T I O N A L
C E N T E R O N
E D U C AT I O N A L
O U T C O M E S
The Center is supported through a Cooperative Agreement (#H326G050007) with the Research to Practice Division, Office of Special Education Pro-grams, U.S. Department of Education. The Center is affiliated with the Institute on Community Integration at the College of Education and Human Development, University of Minnesota. This report was funded with partial support from the Multi-state GSEG Toward a Defensible AA-MAS. This project is supported by General Supervision Enhance-ment Grants (#H373X070021) from the Research to Practice Division, Office of Special Education Programs, U.S. Department of Education. Opinions expressed herein do not necessarily reflect those of the U.S. Department of Education or Offices within it.
Photo releases for the photographs included in the report are on file at NCEO.
NCEO Core Staff
Martha L. Thurlow, DirectorDeb A. AlbusManuel T. BarreraLaurene L. ChristensenKamarrie DavisLinda GoldstoneJames HattenChristopher J. JohnstoneJane L. Krentz
Sheryl S. LazarusKristi K. LiuRoss E. MoenMichael L. MooreRachel F. QuenemoenRebekah RiekeChristopher RogersMiong VangYi-Chen Wu
National Center on Educational OutcomesUniversity of Minnesota • 207 Pattee Hall150 Pillsbury Dr. SE • Minneapolis, MN 55455Phone 612/624-8561 • Fax 612/624-0879http://www.nceo.info
The University of Minnesota shall provide equal access to and opportunity in its programs, facilities, and employment without regard to race, color, creed, religion, national origin, gender, age, marital status, disability, public assistance status, veteran status, sexual orientation, gender identity, or gender expression.
This document is available in alternative formats upon request.

Executive Summary
This report describes perceptions and practices of Hawai’i teachers using progress maps (learn-ing progressions) to inform their understanding of how struggling learners progress during the school year in language arts or mathematics. Participants included (K-8) elementary and middle school teachers from six Hawai’i public schools. Each teacher selected five students in his or her classroom to document progress and collect work samples from at least two quarters during the 2010-2011 school year; several of these students were ones who might have been eligible for and participated in an Alternate Assessment based on Modified Achievement Standards (AA-MAS) if Hawai’i had developed one. Multiple data collection tools and processes were developed for use in this project and are described in the report.
This project was part of the work that Hawai’i engaged in as part of the Multi-State GSEG To-ward a Defensible AA-MAS. The project used progress maps initially developed through the Tri-State (Georgia, Hawai’i, and Kentucky) Enhanced Assessment Grant funded by the U.S. Department of Education (Grant #S368A060005).
Data from this project were used to analyze and document how having an underlying learning progression schema might influence teachers’ implementation of strategies to support struggling learners, with a specific focus on:
(a) formative assessment practices and lesson planning;
(b) progress monitoring; and
(c) collaborative student work analysis.
Eight findings from the year-long effort addressed (a) teachers’ reflections on practice (instruc-tion, assessment, and instructional decisions), (b) teachers’ perceptions on learners and learning pathways, (c) facilitated collaboration sessions), and (d) unanticipated activities. This report addresses each of those, as well as the implications of the project for professional development support.


Table of Contents
Executive Summary ................................................................................................................ iii
Introduction ...............................................................................................................................1
Progress Maps and Learning Progressions ...............................................................................2
Staffing for the Progress Maps Project .....................................................................................4
Methodology, Questions for Inquiry, and Timelines ................................................................5
Summary of Lessons Learned .................................................................................................11
Resources ................................................................................................................................23
Appendix A .............................................................................................................................27
Appendix B .............................................................................................................................29
Appendix C .............................................................................................................................31
Appendix D .............................................................................................................................33
Appendix E .............................................................................................................................35
Appendix F ..............................................................................................................................39
Appendix G .............................................................................................................................41
Appendix H .............................................................................................................................43
Appendix I ..............................................................................................................................45
Appendix J ..............................................................................................................................47
Appendix K .............................................................................................................................49


1NCEO
Introduction
Currently there is little existing research to help educators understand how the lowest perform-ing students at each grade level can best learn increasingly more complex concepts and skills in each content domain. Therefore, there is a critical need for new thinking that explicitly describes the best instructional practices, high-quality resources, and effective professional develop-ment strategies for meeting the goal of teaching academic content to students with a variety of unique learning challenges. While both the No Child Left Behind Act of 2000 (NCLB) and The Individuals with Disabilities Education Improvement Act of 2004 (IDEA) require that all students have access to grade-level general education curriculum, there tends to be a lack of targeted support for special education teachers to acquire deep content knowledge in order to meet that goal. Both deep content knowledge and a repertoire of instructional skills are essential to teachers when one considers the diverse needs of learners. In the past, educators have tended to rely on generic supplemental instructional resources, remediation when students fall behind, or adapting instructional materials on a day-to-day basis to meet the needs of their students. These approaches fall short of having a comprehensive and systemic solution.
Corcoran, Mosher, and Rogat (2009) present a case for addressing this void with the use of learning progressions:
We are convinced that it is not possible for the reform goals with respect to “all students” to be met unless instruction in our schools becomes much more adaptive. That is, the norms of practice should shift in the direction in which teachers and other educators take responsibility for continually seeking evidence on whether their students are on track to learning what they need to if they are to reach the goals, along with tracking indicators of what problems they may be having, and then for making pedagogical responses to that evidence designed to keep their students on track, or to get them back on track, moving toward meeting the goals. This, of course, is a description of a formative assessment process in action. We are additionally convinced that teachers will not be able to engage in such pro-cesses unless they have in their minds some idea about how students’ learning in the subjects they are teaching develops over their time in school, as well as some idea of the ways of responding to evidence of their progress or problems that are likely to be effective. We have been looking for promising ideas about what this metaphor of “on track” (or its obverse—“off track”) might mean in terms that could be accessible to and useful for teachers and their students. One such idea that has attracted growing attention in education reform circles is the concept of learning progressions. (p. 8)

2 NCEO
The focus of the Hawai`i Progress Maps project was on instructional practices and supports for all at-risk students, including students who would be eligible for an alternate assessment based on modified achievement standards (AA-MAS)—also called the “2% assessment.” In this regard, a research study was proposed to examine how collaboration between general educa-tion and special education teachers, integrated with the use of Hawai’i Progress Maps (learning progressions) in language arts and mathematics could help to better meet the instructional needs of struggling learners. The student population included, but was not limited to, those students who would be eligible to take an AA-MAS.
In light of emerging literature about the potential of learning progressions to improve teach-ing and learning for all students in science, mathematics, and language arts (Biggam & Itterly, 2008; Confrey, 2011; Corcoran, Mosher, & Rogat, 2009; Hess, 2008, 2010, 2011; Hill, 2001; Masters & Forster, 1996; NRC, 2001; NRC, 2007; Pinnell & Fountas, 2007; Wilson, 2009), a study was proposed to focus on the implementation and use of Hawai’i Progress Maps developed and refined during the 2007-2008 and 2008-2009 school years. Teachers who were involved during the initial development phase (2007-2008), as well as educators involved in field test-ing the progress maps (2008-2009) were invited to participate. Inclusion of some educators knowledgeable in the purpose and use of progress maps was important because both general education and special teachers would be recruited for the study, and having some teachers with prior background knowledge of both the academic content of the Hawai`i benchmarks and progress maps and of processes for using them as tools for examining student learning would be very beneficial. Ideally, teams of teachers working in the same schools were to be recruited (e.g., a special education teacher working with a classroom teacher to support the same students at a particular grade level or grade level teams working with the same content across multiple classrooms).
Throughout the study, educators were asked to expand their content knowledge and teaching skills and to document and reflect upon information related to the use of progress maps in language arts or mathematics. This included processes for collegial collaboration in setting expectations for learning and analyzing student work, instructional planning using the learning continuum described in the progress maps, and use of formative assessment strategies and tools to make instructional decisions. Professional development sessions would be planned to provide ongoing guidance to participating teachers in the use of strategies for formative assessment, instruction, collaboration, and data analysis.
Progress Maps and Learning Progressions
Learning progressions, progress maps, developmental continuums, and learning trajectories are all terms that have been used in the literature over the past decade to generally mean research-based, descriptive continuums of how students develop and demonstrate deeper, broader, and

3NCEO
more sophisticated understanding over time. A learning progression can visually and verbally articulate an hypothesis about how learning will typically move toward increased understanding for most students. There is currently a growing body of knowledge surrounding their purposes and use, as well as ongoing research in identifying and empirically validating content-specific learning progressions (Hess, 2010a).
A conceptual view of learning progressions (Hess, 2008) is one of overlapping learning zones along a continuum of learning. At the lower end of the progression are “novice” performers (at any grade level), who may (or may not) demonstrate the necessary prerequisite skills or under-standing that is needed to be successful (e.g., essential skills/concepts that can be built upon over time). At the other end of the continuum are “expert” performers. Learning progressions descriptors help to “unpack” how learning might unfold for most students over time, moving from novice to expert performance (see Figure 1 below).
Figure 1. Conceptual View of Learning Progressions
In Figure 1, the Zone of Proximal Development/ZPD (Vygotsky, 1978) is the range of actual to potential learning each person demonstrates at any given time. A conceptual view of learning progressions (Hess, 2008) is one of overlapping learning zones along a continuum of learning.
What distinguishes expert from novice performers is not simply general mental abilities, such as memory or fluid intelligence, or general problem-solving strate-

4 NCEO
gies. Experts have acquired extensive stores of knowledge and skill in a particular domain. But perhaps most significant, their minds have organized this knowledge in ways that make it more retrievable and useful. … Most important, they have efficiently coded and organized (chunks of) this information into well-connected schemas … which helps them to notice features and meaningful patterns …that might be overlooked by less competent learners. The schemas enable experts, when confronted with a problem, to retrieve the relevant aspects of their knowl-edge. … Doing so, effectively moves the burden of thought from limited capacity of working memory to long-term memory. (NRC, 2001, pp. 72–73)
In other words, long-term memory is not about a collection of skills and knowledge, but con-nections among skills and knowledge built upon over time.
In this report the terms “learning progressions” and “progress maps” are used interchangeably to describe what within-year progress might look like for most students. Given that the project asked teachers to pay close attention to and document how their struggling learners progressed during the school year within the general education curriculum, there was an expectation that the progress of these students might not be “typical” and analyzing teacher observations and a collection of student work might provide insights into the actual progress made.
Staffing for the Progress Maps Project
Strand 1 Activities focused on identifying and tracking the progress of five (5) struggling learn-ers. Teachers documented which tools, processes, and strategies for assessment and instruction seemed to be working effectively for these students. Karin Hess, Senior Associate at the Center for Assessment, Dover, NH, designed the study with the Hawai’i Department of Education and National Center on Educational Outcomes (NCEO) advisors, developed the data collection tools, met with teachers several times to conduct focus groups, interviewed school leaders and teachers, conducted classroom observations, oversaw the ongoing collection of student work samples, and guided the data analysis activities with teachers at the end of the project. Jeri Thompson and Pam Paek, also with the Center for Assessment, supported these project activities.
Strand 2 Activities provided several days of professional development to project teachers, guid-ing their use of the Hawai’i Content and Performance Standards planning model in using student work analysis protocols and lesson and assessment planning. Valerie Kurizaki coordinated the planning and delivery of these activities with the help of three Hawai’i-based professional devel-opment providers: Mary Frances Higuchi, Lisa Leong, and Tricia Tamayose-Okamura.
Hawai’i Department of Education staff were the essential glue who held this complex project together: recruiting and monitoring teacher involvement, organizing meetings and on-site school visits, acting as liaisons with school leaders, facilitating collection of data, and provid-

5NCEO
ing valuable trouble shooting and assistance throughout the school year. Maxine Nagamine, State Educational Specialist, Special Education Services Branch, and Milton Ching, Resource Teacher, Curriculum and Instruction Branch, played an integral role in the success of the project.
Methodology, Questions for Inquiry, and Timelines
What Was the Purpose of the Project?
This project was designed to examine how the use of Hawai’i Progress Maps in language arts and mathematics (K-8) and collaboration among general education and special education teachers can help better meet the instructional needs of struggling learners. The progress maps used in this study were developed specifically to “unpack” how students in Hawai’i would achieve the Hawai’i benchmarks (grade level expectations of the Hawai’i standards). While care is needed in interpreting the project outcomes as representative of all teachers (in Hawai’i or elsewhere), the results of the study have some potential to be generalized to other locations and contexts in terms of how using an underlying learning progressions schema might influence teacher collaboration practices and instructional decisions in support of all learners. In other words, the results of this project could open the door to new research questions in this area, including school-based action research that seeks to better understand how learning develops.
What Questions Did the Project Try to Answer?
The purpose of inquiry within qualitative research is in understanding the world from the point of view of those who live in it. Our general approach to this project was that of constructiv-
For additional information about what learning progressions/progress maps are, go to any of these websites or refer to the sources listed in Resources.
• View video of Hawai’i educators and read about intended uses of progress maps. http://tristateeag.nceo.info/hawaii-main/hi-products
• Read page 1 of Nichols (2010), What is a learning progression? http://www.pearsonassessments.com/NR/rdonlyres/6C8F4D6F-EFB1-47CE-9247-3712D274190F/0/Bulletin_12.pdf
• Read pages 1-2 of Clements & Sarama (2009), Learning trajectories in early mathematics—sequences of acquisition and teaching. http://literacyencyclope-dia.ca/index.php?fa=items.show&topicId=270
• Read page 2 of Hess (2008), Developing and using learning progres-sions as a schema for measuring progress. http://www.nciea.org/publica-tions/CCSSO2_KH08.pdf.
•

6 NCEO
ist research, borrowing the term from Guba and Lincoln (1994), who identify their qualita-tive research work as constructivist. The term references the acknowledgement of the social construction of knowledge. Constructivist researchers are interested in the co-construction of knowledge between researcher and researched, and thus this project approached the analysis and interpretation of data collaboratively with the teacher participants in order to make sense of how learning progressions could influence their day-to-day practice. Self-reporting surveys, interviews, and focus groups were several means used to invite teacher participants to provide their reflections on the effectiveness of the tools and protocols employed.
The learning progressions project began with two broad questions which were later refined in order to develop specific data collection tools and protocols. The initial questions were framed in this way:
• Who are the struggling learners and what is working for them (e.g., targeted instructional strategies, use of formative assessment, extra scaffolding)?
• How can Hawai’i Progress Maps be used to support the struggling learners, including students with disabilities (e.g., periodic formative assessments, strategies used when examining student work, development of pre- and post-assessments)?
Revised Questions for Inquiry (with sub-questions for possible exploration during data col-lection, interviews, or data analyses—not all questions will be fully discussed in findings).
1. InwhatwaysareprogressmapscurrentlybeinginterpretedandusedbyHawai’iteachers,K-8?
• Areprogressmapsseenasadepictionofwhatcouldbetaught(e.g.,domainmap),whatshouldbetaught(intendedcurriculum),wherethestudentisonalearningpath(e.g.,whatthestudenthas/hasnotlearned),somecombinationofthese,orsomethingelse?
• Whatfactors(e.g.,priorcontentknowledge,teachingexperience,professionaldevelopmentandcollaborationopportunities)may influence teachers’under-standinganduseofprogressmaps?
• Arethereanyunexpectedorunintendedusesofprogressmapsbeingevidenced?
• Doteacherperceptions(e.g.,ofcontent,ofstudents)changeovertimeorwithuse?
2. Howdoestheuseofprogressmapsimpactunderstandingofhowtoteachthecon-tentanduseassessmenttoolsandassessmentevidenceininstructionalplanning?
• Aretheredistinctdifferencesbetweenthecontentareasinhowteachersusedprogressmaps?

7NCEO
• Whatinstructionalstrategiesforassessmentweregeneratedduringuse;whichstrategieswerefoundtobemostusefulandwhichwerenotaseffective?Howcanacceptableorusefulassessmentstrategiesbecharacterized?
3. Howdoestheuseofprogressmapsimpactteacherexpectationsandinstructionaldecisionmakingspecificallyforstrugglinglearners?
• Towhatextentdotheparticipants(membersofthesameschoolteam)needtohaveasharedunderstandingofthecontentcontainedinaprogressmap?
• Aretheredifferencesinuseofprogressmapsforstrugglingandnon-strugglingortypicallyprogressinglearners?
• Howimportantiscollaborationorprofessionaldialoguetotheproblemsolvingprocessformeetingtheneedsofstrugglinglearners?
4. Whatcontextualfactorssupportorhindertheuseofprogressmapstomeettheneedsofstrugglinglearners?
• Whatorganizationalaspectsarenecessary(e.g.,schoolleadersupport,struc-turesthatallowforprofessionaldialogue,teacherleaderswithinaschool,gen-eraleducation-specialeducationcollaborationtime,etc.)?
• Are some teachersmore successful than others in using the progressmaps?Why?
Who Participated in the Project and What Were They Asked to Do?
Staff of the Hawai’i Department of Education made on-site school visits to recruit general and special education teachers and encouraged teams of teachers from the same schools to partici-pate in the project. Classroom teachers working directly with a special education teacher and teachers with prior involvement or knowledge of the Hawai’i Progress Maps development or field testing were given priority. In the end, prior developers and field testers of the progress maps only made up about 40% of the total participants. Prior knowledge of the progress maps did not seem to hinder teachers’ ability to understand and use the progress maps in the project, in part because the initial training session provided extensive background information on their development, purpose, and use.
The resulting teacher teams ranged from as small as two teachers at one grade level in a school, to teams that included all of the teachers (17) in the school’s mathematics department for grades 6, 7, and 8. There were four school teams of six or fewer teachers and three school teams of seven or more. Only one school had both a mathematics and language arts team involved in the project. Three special education teachers participated “officially” in the project, while other special educators working in schools with the participating teachers were engaged in many of
8 NCEO
the school-based activities in support of students. A few special education teachers even par-ticipated in the focus group interviews with project teachers they worked with because of their informal involvement. Forty-eight teachers began the project: thirty mathematics teachers and 18 language arts teachers. Two language arts teachers were unable to finish, but did participate for most of the school year. All teachers received a stipend for their participation in the project.
Forthepurposeoffurtherexplainingtherolesandresponsibilitiesofparticipants,twoparal-lel“strands”describeactivitiesfacilitatedbyeithertheCenterforAssessmentstaff(strand1)ortheHawai’iDepartmentofEducationstaffandconsultants(strand2).Activitiesforbothstrandswererequiredandransimultaneouslyduringtheschoolyear.ThefocusofthisreportisprimarilyonStrand1—activitiesrelatedtoteacherpracticesandperceptionsandwhattheylearnedfromthedatacollectionandanalysesforfivestrugglinglearners.Strand2activitiesrelatedtoemployingthesixstepsoftheHawai’iContentandPerformanceStandardsplanningmodelforgeneralunitandassessmentplanning,orHCPSIIIIMPLEMENTATIONPROCESSMODEL.(Formoreinformationabouthowthismodelappliedtouseofprogressmaps,goto http://tristateeag.nceo.info/attachments/046_Intended%20Use%20of%20Progress%20Maps.pdf.)
Strand 1 Activities. Teacher participants were asked to identify and then track the progress of five (5) struggling learners in their classrooms, including at least two students with disabilities. Teachers documented which tools, processes, and strategies for assessment and instruction seemed to be working effectively for these students. During the year-long project, facilitators from the Center for Assessment, who designed the study and the data collection tools, met with teachers on-site several times to: (1) introduce the project and explain the use of the various data collection tools, (2) make school visits to conduct focus groups and interview school leaders and teachers, (3) make school visits to conduct classroom observations and oversee the ongoing collection of student work samples, and (4) to guide the data analysis activities with teachers at the end of the project. Ongoing e-mail communication was maintained with all project teachers, school leaders, and Hawai’i Department of Education staff who monitored teacher involvement and provided valuable trouble shooting and assistance throughout the school year.
Strand 2 Activities. In support of the Strand 1 activities, the Hawai’i Department of Education used project funds to hire a coordinator and three on-site professional development providers to work with project teachers, guiding their use of the Hawai’i Content and Performance Standards planning model in three full-day sessions. Strand 2 activities during year 3 and their relation to progress map development during years 1-2 are described in detail in a second paper by Valerie Kurizaki, the project professional development coordinator, Educating Struggling Learners: Reflections on Lessons Learned about Curriculum, Instruction, and Assessment (Kurizaki, 2011). A summary of the evaluations for these sessions is included in this report, as they relate to analysis of student work and assessment development.

9NCEO
Project Expectations
1. (Strand 1) Select a content area (reading or mathematics), progress map, and grade level to focus on. Use the tools provided (e.g., learner characteristics descriptors, student profile descriptors, student work analysis form) and available school data (e.g., last year’s report card, pre-assessment for unit of study, diagnostic or state assessment) to identify five strug-gling students in reading or mathematics for the study.
2. (Strand 1) Administer a short (math or reading) pre- and post-attitudinal survey to each of the five students. Several grade appropriate and content specific surveys were provided to participants.
3. (Strand 2) Use the progress map chosen and a collaborative process to develop/use assess-ments, plan instruction, and examine or discuss student work and student progress. Three full-day meetings were scheduled during the year to facilitate this planning across school teams. Complete pre- and post-evaluations for these sessions.
4. (Strand 1) Collect assessment and instruction data on five selected students for quarters 1 (July-Oct), 2 (Oct-Dec), and 3 (Jan-Mar) only. This information is documented on forms 2 and 3 (Appendices D and E).
5. (Strand 1) Meet with outside research consultant at school either in the second or third quar-ter. This was an interview or focus group with participating teachers at the school to learn about how progress maps were being used to support struggling learners. Teachers had the chance to ask questions about the data being collected for the five students.
6. (Strands 1 and 2) Complete two required surveys designed to guide reflections and docu-mentation of student progress.
7. (Strand 1) Fourth quarter (April-May) Pull data and work samples for each student together across teachers, grade levels, and schools. Teachers bring their data to this meeting for fa-cilitated group analysis.
Summary of Required Project Meetings
Meetings were held on weekend or nonschool days, except for the school site visit day when classroom observations and focus groups were conducted.
o Day 1 (July 2010) Large-group orientation meeting for overview of tools, processes, and data collection. This day included a half day professional development session on designing pre- and post-assessments. Professional resource books were purchased that

10 NCEO
included instructional planning ideas along a learning continuum. Books were distrib-uted to all teachers at this meeting.ELA teachers received their choice of one of these professional books:
• Literacy profiles: A framework to guide assessment, instructional strategies and intervention, K-4
• Developmental continuums: A framework for literacy instruction and assess-ment K-8
Math teachers received their choice of one of these professional books (based on prog-ress map content chosen):
• First Steps in Mathematics: Chance and Data • First Steps in Mathematics: Space • First Steps in Mathematics: Measurement, Volume 1 or Volume 2 • First Steps in Mathematics: Number, Volume 1 or Volume 2
o Day 2 (August 2010-Strand 2) Professional Development session: large-group facili-tated collaboration general training for how to use the student work analysis (SWA) forms and protocols to benchmark student work.
o Day 3 (August/September 2010-Strand 2) Professional Development session: large-group facilitated collaboration using Hawai’i Student Work Analysis (SWA) form and mid assessments given—different days for math and reading. This session focus was for examining actual student work from formative/mid-assessments.
o Day 4 (October/November 2010 or January/February 2011-Strand 1) On-site school visits—scheduled either in quarter 2 or 3. Outside consultants interview each indi-vidual, grade level team (e.g., general education and special education teachers), and conduct focus group after school with all teachers at that school. (This structure varied depending on how many teachers were involved at the same school.) Some meetings were conducted after school and others during teacher prep times following a class-room observation. Dates were scheduled based on school schedules and availability of teachers.
o Day 5 (March 2011-Strand 2) Facilitated collaboration sessions using SWA form and assessments—different days for math and reading. This day was for examining actual student work from post and final assessments.
o Day 6 (April 2011-Strand 1) Large-group data analysis day during April: both content areas met on the same day. Two Center for Assessment staff facilitated content-specific discussions and data analyses. Teachers brought portfolios of work samples collected for five students during the school year and summarized findings across classrooms.

11NCEO
Grade 7 teachers from Kapolei Middle School share data about student progress while examining a student portfolio at the April 2011 meeting. From left to right: Christine Kerr, Lynne True, Joy Nekomoto-Yamada, Roy Imamura, and Julie Lum, math department chair.
Summary of Lessons Learned
Data Collection Tools
Data from multiple sources—interviews, school-based focus groups, and self-reporting sur-veys—as well as student work samples were collected and analyzed by Center for Assessment staff in order to describe classroom assessment practices, the frequency and nature and use of formative assessment tools and strategies, and use of assessment data to plan instruction.
• Allprojectteachersparticipatedineitheranindividualintervieworfocusgroup,orboth.(FocusgroupandinterviewquestionsareincludedinAppendixC.)
• DatacollectionforstudentworksampleswereorganizedusingthetoolsinAppendixD(Form2:SampleELADataCollectionToolforTrackingaSingleBenchmark),AppendixE(Form3:SampleStudentProfileforLanguageArtsforDataCollectionToolforTrackingMultipleBenchmarks),andeitherAppendixF(Form1:LearnerCharacteristicsforReading)orAppendixG(Form1:LearnerCharacteristicsforMathematics)forreadingormathemat-ics,respectively.Morethanhalfoftheteachersactuallyusedthestudentprofile(Appendix
12 NCEO
E)forallofthestudentsintheirclasses,notjustthefivestrugglinglearnersidentifiedforthestudy.Thiswasatestimonytoitsperceivedusefulnessandwillbediscussedfurtherinthesection,UnanticipatedActivitiesbelow.
• Self-reporting formativeuse surveyswereadministeredat theendof theproject (April2011).ThirteenEnglishlanguagearts(ELA)teachers,26mathematicsteachers(includingonespecialeducationteacher),and3specialeducationteacherswhoidentifiedthemselvesasteachingbothELAandmathcompletedasurveydescribingtheirformativeassessmentpractices.(TheBurnsFormativeAssessmentUseScale—forTeacherswasadaptedforuseinthisprojectwithpermissionfromR.Burns,2010.)Theformativeusesurveyasksaboutfrequencyofusingpracticessuchas(1)theuseofalignedrubricsandannotatedstudentworktodescribeexpectedperformancetostudents,(2)providingwrittenororalfeedback,(3)studentself-andpeer-assessmentpractices,(4)modifyingassessmentbasedonformativeevidence,(5)beingintentionalwhendesigningformativeassessments,and(6)examplesofformativetoolsmostfrequentlyused.
• Allteachersalsocompletedapre-(August 2010) andpost-(January 2011) surveyafterattendingthefacilitatedcollaborationsessionswithHawai’i-basedworkshopleaders.Thesurveysincludeddemographicinformationandprojectprocessquestions(e.g.,use of strate-gies for using student work analysis to plan instruction or assessments), aswellasquestionsspecifictoworkshopactivities.(ThesesurveyscanbefoundinAppendixHandAppendixI.)
• Professionaldevelopmentfacilitators(strand2leaders)alsocompletedasurveyaskingthemtoreflectonandevaluatethefacilitatedcollaborationsessions.
Data analyses are discussed below under the following topics and draw from various data sources described above:
• Teachers’ Reflections on Practice: Instruction, Assessment, and Instructional Decisions• Teachers’ Perceptions: Learners and Learning Pathways• Facilitated Collaboration Sessions• Unanticipated Activities• Structures and Supports: Implications for Professional Development
Teachers’ Reflections on Practice: Instruction, Assessment, and Instructional Decisions
Finding #1:
As a result of the project activities—using Progress Maps to plan assessments and instruction and to track progress of individual students—all teachers identified an increased use of many formative strategies and tools. (See summary in Table 1 for selected descriptors.)

13NCEO
Table 1: Frequency and Use of Formative Assessment Strategies
Examples of formative strategies that were used usually or almost always by most participants
Math Teachers
(n=25)
ELA Teachers
(n=13)
Special Ed Teachers
(n=5)
I assess using rubrics aligned explicitly to the Hawai’i benchmarks and grade level standards.
76% 100% 60%
I use planned formative assessments (questioning probes, pretests, open-ended questions) to provide me with information that guides my next steps for instruction.
84% 100% 100%
The written or oral feedback that I give students about their work explic-itly addresses how they did or did not meet the Hawai’i benchmarks.
72% 92% 60%
My students have opportunities to assess their own work and get feed-back prior to handing it in for a final grade.
60% 53% 60%
My units of study include opportunities for students to engage in and get feedback on the kinds of problems that will be on their tests or exams.
96% 69% 40%
I use homework for purposes other than grading. 92% 85% 80%
I modify my instructional strategies when a student does not do well on a quiz or assessment.
88% 100% 80%
I modify my instructional strategies on the spot while teaching when a student or group of students does not seem to understand.
92% 100% 100%
I schedule class time for students to revise their work and provide ongo-ing feedback to them during that process.
76% 85% 80%
However, it appears that it was the general education teachers whose practices incorporated the most frequent use of formative strategies linked to grade level benchmarks when using the progress maps. For example, general education teachers tended to link scoring rubrics and feedback explicitly to progress towards the Hawai’i benchmarks and standards, while most special educators did not. And while one might expect a special education teacher to modify instruction on the spot while teaching (as confirmed by the five special education teachers who responded), researchers were surprised to see how many general education teachers also were using formative assessment data to modify instruction in various instructional situations. Also, special educators did not employ peer and student self-assessment strategies as frequently as did their general education colleagues.
Finding #2:
Progress Maps provided a clearer understand of what “within grade level progress” could look like; therefore, teachers were able to use a variety of instructional strategies and tools to monitor that progress. Teachers were asked on the formative uses survey to “describe any additional strategies you frequently use to know how well your students are progressing before giving them a performance-based summative assessment.” All teachers were able to identify several effective progress monitoring strategies. That said, there were also some lessons or

14 NCEO
assessment materials observed that showed a lack of understanding of how to make learning more accessible to students with disabilities. Since this was true of some general education and special education teachers, we can only surmise that the concept of universal design for learning is a broader issue that cannot be directly addressed using progress maps or formative strategies and should be a topic considered for future professional development across Hawai’i schools, district wide. Universal design for learning refers to a research-based framework for designing instruction that works for all students by using flexible approaches that can be customized and adjusted for individual needs (CAST, 2011).
With regard to supporting English language learners (ELLs)—many of whom were identified as “struggling learners” in Hawai’i classrooms—researchers observed many teachers at all grade levels employing strategies to support these learners (e.g., acting out situations for math prob-lem solving to be sure students understood the context of the problem, building content-specific vocabulary skills for better communication, using visuals and models to support vocabulary development and use). These strategies were seen by teachers as generally beneficial to all students, including students with disabilities.
Below are the most common responses given when asked about progress monitoring strategies employed by project teachers. Surprisingly, the general education teachers used observations and formative warm-ups and exit cards more frequently than did special education teachers to monitor ongoing progress. Special education teachers tended to rely on pre-, mid-, and post- assessments of a larger grain size than did classroom teachers (see Table 2).
Table 2: Additional Strategies Used to Know How Students Are Progressing
General Education ELA Teachers
Grades K-5: Teacher observation, small group work, conferencing, warm-ups and exit tasks, pre-assessmentsGrades 6-8: Warm-ups (formative probes) at the start of class, checks for understanding during the lesson, graphic organizers, small group/pairs work
General Education Math Teachers
Grades 2-5: Teacher observation, small group work, conferencing, warm-ups and exit tasks, pre-assessmentsGrades 6-8: Warm-ups (formative probes) at the start of class, checks for understanding during the lesson (pair-share, hold up fingers to show degree of understanding 0-2-4, exit cards), conferencing or small group work, pre-assessments
Special Education Teachers
Pre- and mid-assessments, practice summative assessments with extra sup-ports, quick checks for understanding during the lesson (specific strategies not named)
15NCEO
Finding #3:
When asked specifically what, if anything, teachers had changed in their day-to-day practice for developing and using assessments with progress maps, many teachers commented that they had a new lens for developing and using assessment evidence, especially the pre-assessments.
• Many of the teachers noted that they gained a clearer understanding of the state standards and grade level benchmarks. “I’ve taught these benchmarksforyears, but never really un-derstood them this deeply before using the progress maps to break down the benchmarks.”
• Less experienced teachers spoke about the many benefits of collaboration and use of the progress maps to clarify understanding of the benchmarks: “It (the project) helped me focus on the benchmarks. I test per benchmark now. Before I would give a test covering three benchmarks and give a grade. Now it helped me focus on (content of) standards and benchmarks more. I’m a new teacher so it was eye opening—the assessments I was giving, the planning, and the assessments I should be giving. I have a poster on the wall so students know and reflect on what they need to do to move up on the map.”
• Knowing the content was essential. Teachers who did not have deep content knowledge, especially special and general educators teaching math, stated that they benefitted greatly from collaboration activities with colleagues and admitted that without deep content knowl-edge, they could not have developed strong assessments or been as skilled in interpreting assessment results.
• Pre-assessments were used to determine “entry points” onto the progress maps and to dif-ferentiate instruction for individuals or small groups. This was a new insight and use of pre-assessments that was brought to light while using the progress maps.
• Teachers learned that the most useful pre-assessments were the ones that focused on the foundational (or prerequisite) skills needed to be successful, and not on the “end point” of the continuum (the benchmark). “At first our pre-assessments were too difficult, included too much, and students could not show what they knew, if anything. Then we figured out that we needed to focus on the prerequisite skills needed to get ready to learn the skills in the benchmarks. That made a huge difference in getting usable assessment evidence.” Again, having deep content knowledge was identified as critical to the process and progress maps supported breaking down benchmarks into teachable chunks. Teachers used assessment evidence from pre-assessments to determine where to begin the instruction—starting with foundational skills or with skills closer to what “approaching proficient” looked like.

16 NCEO
• Formative assessment data was found to be a new way to flexibly group students for targeted instruction or support all along the learning continuum, even those students who teachers thought had a solid understanding of the grade-level content. One teacher noted, “It was a real eye-opener. Some students who I thought were proficient were actually below proficiency according to what they could and could not do on the formative and mid-assessments.”
• Well designed pre-assessments helped teachers to decide how to best use instructional time: what to teach and what not to teach. “Pretests allow me to skip over benchmarks students already know from previous years, so I make up time that way. The pre-assessment is good way to find out where they are now and what I need to re-teach.”
Finding #4:
Another observation made by most teachers was that their assessments now had greater clarity and focus; therefore, assessment data became more useful to them in guiding instruction. Teachers often saw flaws in the commercially available assessments they had been using and chose to redesign many assessments they had used in the past. There was strong agreement that collaboratively developed common assessments seemed to strengthen the resulting assessments and provide better opportunities for analyzing results and sharing instructional strategies across classrooms.
• Teachers noted greater clarity and focus in their collaboratively developed assessments using progress map descriptors and including prerequisite skills. “When we looked at our first results and the assessment we used, we said, ‘what were we thinking?’ This is an aw-ful assessment!”After the first pre-assessment was given and results were analyzed, most teachers revised their thinking about what to include in a pre-assessment, thus improving the quality of assessments used.
• Teachers noted that when there was greater clarity in the assessment tasks, assessment results were more useful in terms of what to do or teach next. “I never really thought about each individual benchmark, and generally taught and assessed many of them at the same time. So I never knew what the next steps might be when they didn’t get it.”
• Teachers frequently told us that the progress map descriptors and better designed assessments helped them to go deeper into the content with instruction. “I don’t just touch the surface of the benchmark now, but go more in depth.”
• Assessment prompts and assignments: Many teachers told us that they now rethink the purposes of specific assignments and write them with more detail and specificity about the outcomes they expect from students.

17NCEO
Teachers’ Perceptions: Learners and Learning Pathways
Finding #5:
Above all, teachers told us that having the progress maps gave them greater insight into what to teach next when a student was not making progress and to see all students somewhere on the progress maps. Teachers’ perceptions of the slowest progressing students shifted for some (not all) teachers who began to see students according to what the students could do, not what they could not do. “I’m not seeing this student as ‘behind the other students’ like I might have before. I see where he is on the progress map; and now I have an idea of how I can help him.”
• Timeandagain,teachersstatedthattheybegantounderstandwhatapathtoproficiencyor“approachingproficiency”mightactuallylooklikeandcouldnowplanlessonstogetthere.Theindicatorsintheprogressionspresentedthe“bigpicture”ofwhatstudentscoulddothatteacherscouldbuildupon.Morethanhalfoftheprojectteachersstartedtousetheprogressmapswithparentsandstudentstodescribeprogressinconcreteterms.
• Teachersfoundthattheyhadtoknowthestudentbetterinorderto“placethem”onalearningcontinuum—becausetheyneededmorespecificformativeassessmentdata,theystartedtodesignassessmentswithmoretargetedpurposes. “First quarter pre assessments are more informative, since they tested the skills students needed to know to move ahead.”
• Manyteacherstoldusthattheyhadbeenusingthegrade-levelbenchmarksforyears,butneverreallyunderstoodthebenchmarksinawaythatlaidoutapathtogetthere(meaninghowtoteachtogettherefromwhereverthestudentstarted).
• Teacherstoldustheyhaddiscoveredanewwaytokeeptrackofprogress:“Now I had a visual organizer of where students were and what I had to do next.”
• Teacherstoldustheirconfidenceininterpretingprogressforthemselvesandstudentswasenhanced:“For seventh grade, it helped us improve our assessments. We made this assess-ment and compared it with the progress maps. We found that we had to adapt tests and add in questions to properly assess what students know. The result was more rigorous than what we (originally) had planned to assess. It changed the language used in the assessment and how we speak to students. Progress maps allow us to speak to the progress upfront with students, so they know what they need to do for it to be good enough. It’s completely taken the guesswork out for us and the kids. They feel more comfortable and confident with what they need to learn.”

18 NCEO
Facilitated Collaboration Sessions
The facilitated collaboration sessions are referenced in a companion report by Valerie Kurizaki (2011), Educating Struggling Learners: Reflections on Lessons Learned about Curriculum, Instruction, and Assessment. These sessions were planned and led by four Hawai’i educators as part of the Strand 2 activities. Center for Assessment staff realized early on in the project that having two separate strands might be somewhat confusing to teachers. In strand 1, teachers were using the progress maps and tools provided to track the progress of five students; while in strand 2, they were bringing full classroom sets of student work to analyze. We regret that more effort was not made to better tie the activities of the two strands more closely throughput the project. It was not until the January focus groups and teacher interviews that researchers realized this gap was as significant as it was for many teachers who expressed that it was like being involved in two different projects. Teachers did not always see the connections between the activities in the two strands as clearly as the leaders of strands did. This was easily explained when questions finally surfaced and could have been avoided.
Finding #6:
The use of student work analysis (SWA) protocols, combined with Progress Maps, was a major game changer for making instructional decisions. While teachers told us that in the past they had looked at evidence in student work to give a grade, they had not considered using SWA to target instruction for groups of students, nor were they always sure of what to teach next when students struggled.
• The idea of “sorting papers” was a new idea for many teachers: “I never thought of sort-ing papers according to what students were able to do or not do. That really changed my thinking about next steps for instruction.”
• SWA processes were sometimes seen as too cumbersome and unmanageable because of the lengthy protocols used early in the project during the facilitated sessions. A more streamlined protocol was designed (Appendix J) late in the project to address this problem voiced by many middle school teachers who teach as many as 150 students.
Finding #7:
Participants noted time and again the benefits of collaborative planning to both design assessment tasks and analyze student work together. Many teachers expressed that after the initial collaborative facilitation session to teach them how to use the process of SWA with colleagues, they would have preferred to simply have quality time with colleagues in a less structured format so they could self-direct the SWA activities.

19NCEO
Unanticipated Activities
Finding #8:
During the school year, many schools, as well as individual teachers, initiated practices related to the use of Progress Maps that were not required, but supported the implementation of Progress Maps more fully and became embedded in day-to-day practice. We believe that many of the teacher-initiated practices have continued beyond the life of the project.
• School Wide Portfolios—One middle school initiated whole-school portfolios guided by the use of progress maps. This resulted in more than half of the project teachers using the student profile (Appendix E) for all of the students in their ELA and math classes, not just for the five struggling learners identified for the study. Student work was collected and used with the progress map descriptors in the profile during parent and student-led conferences during the school year. One elementary school that involved most of their teachers in the ELA part of the project asked if they could use the math student profiles next school year to expand the use of progress maps school-wide to both ELA and math.
• Classroom environments—Classroom and school visits by Center for Assessment staff during the year provided a unique lens into how teachers were using progress maps beyond the requirements of the project. Students were using progress maps for reflection and goal setting before and after testing in one eighth grade math classroom. The teacher told us that this change moved students from setting general learning goals to more specific ones, because students were more clear about a visible path for their own learning and what was being assessed.
• Classroom environments—Another way that teachers used the progress maps to make the learning pathway visible to students was through posting samples of student work along a continuum and promoting student dialogue and peer and student self-assessment as it related to specific “pit stops” along the learning pathway. Teachers in these fifth grade classrooms used formative assessment checklists (based on the progress map descriptors they were focusing on) to monitor small group dialogue during problem solving activities. They were then able to immediately adjust instruction based on informal notes taken. Below is a photo of one teacher’s bulletin board, taken during an on-site visit. It displays the progress map descriptors along the learning continuum with samples of what student work looks like along the learning pathway. Students move their markers (sticky notes) along the path when they achieve the next level and all students support each other in getting there. The class goal is for everyone to achieve at the highest levels.

20 NCEO
Fifth grade teachers at Mililani Uka Elementary School, Evelyn Ibonia, and Margeaux Ikuma, display descriptors of the levels of the progress maps they are working on and then post student work samples so students can see how the work becomes more sophisticated over time. Students work together to get everyone to the “high end” of the progression by the end of the unit. The sticky notes represent students in the class and are moved from “just starting” to match the progress map descriptors as they make progress to “got it.”
Structures and Supports: Implications for Professional Development
There are several simple but important takeaways from this project. While they may seem obvi-ous, we list them to be sure that future efforts to implement a learning progressions schema in classroom practice does not overlook what may be essential to its success.
• Everyone needs time and support structures for collaboration, collaboration, collaboration.
• Teachers need a SWA process that is manageable and practical to use.
21NCEO
• Special education teachers must become fully integrated as a member of the planning and instructional teams.
• Everyone needs to know the content to really make a difference in support of struggling learners.
• Clarity saves time: strong instructional and assessment models, common language, and shared expectations will benefit all teachers and all students in the long run.
• Build school wide consensus for recognizing high quality in assessments, expectations for students (and evidence of real learning), and proven instructional approaches to get there.
• Last, but perhaps most important, work to build “leadership density” within each school (Hess, 2000). School administrators can provide collaboration time, support structures, and the resources needed to support full implementation of learning progressions; however, it is the master teachers who will lead the school in these efforts, if enough of them come to deeply understand purposes and uses of progress maps. This is called leadership density—many leaders within a school who can inspire and mentor colleagues along the way.

22 NCEO

23NCEO
Resources
Biggam, S., & Itterly, K. (2008). Literacy profiles: A framework to guide assessment, instruc-tional strategies and intervention, K-4. Pearson Education, Inc.
Burns, R. (2010). Burns formative assessment use scale—for teachers. In Implementation of formative assessment strategies by high school teachers and students: Professional development implications. Unpublished doctoral dissertation. (UMI No. AAT 3398377)
Center for Applied Special Technology (CAST). (2011). About UDL. Retrieved from www.cast.org/udl/index.html
Clements, D. H., & Sarama, J. (2009). Learning trajectories in early mathematics – sequences of acquisition and teaching. Encyclopedia of language and literacy development, 1-7. London, ON: Canadian Language and Literacy Research Network. Retrieved from http://literacyency-clopedia.ca/index.php?fa=items.show&topicId=270
Confrey, J. (June 2011). A new generation of instructionally supportive assessment: From draw-ing board to the classroom. Presentation at the National Conference on Student Assessment, Sponsored by the Council of Chief State School Officers, Orlando, FL.
Corcoran, T., Mosher, F. A., & Rogat, A. D. (2009). Learning progressions in science: An Evi-dence-based approach to reform. Philadelphia, PA: Consortium for Policy Research in Education.
Darling-Hammond, L., & Snyder, J. (2000). Authentic assessment of teaching in context. Teach-ing and Teacher Education, 16, 523–545.
DepartmentofEducationandTraining,WesternAustralia.(2007). First steps in mathematics: Chance and data. Beverly,MA:STEPSProfessionalDevelopment.
DepartmentofEducationandTraining,WesternAustralia. (2007). First steps in mathematics: Space. Beverly,MA:STEPSProfessionalDevelopment.
DepartmentofEducationandTraining,WesternAustralia.(2005). First steps in mathematics: Measurement, Volume 1. Beverly,MA:STEPSProfessionalDevelopment.
DepartmentofEducationandTraining,WesternAustralia.(2007). First steps in mathematics: Measurement, Volume 2. Beverly,MA:STEPSProfessionalDevelopment.
DepartmentofEducationandTraining,WesternAustralia. (2007). First steps in mathematics: Number, Volumes 1 & 2. Beverly,MA:STEPSProfessionalDevelopment.

24 NCEO
Guba, E. G., & Lincoln, Y. S. (1994). Competing paradigms in qualitative research. In N. K. Denzin & Y. S. Lincoln (Eds.), The landscape of qualitative research: Theories and issues (pp. 195-220). Thousand Oaks, CA: Sage.
Hess, K. (2000). Beginning with the end in mind: A cross-case analysis of two elementary schools’ experiences implementing Vermont’s framework of standards and learning opportuni-ties. Unpublished doctoral dissertation. Burlington, VT: University of Vermont.
Hess, K. (2008). Developing and using learning progressions as a schema for measuring prog-ress. Paper presented at 2008 CCSSO Student Assessment Conference, Orlando, FL. Retrieved from http://www.nciea.org/publications/CCSSO2_KH08.pdf
Hess, K. (February, 2010a). Using learning progressions to monitor progress across grades: A science inquiry learning profile for PreK-4. Science & Children, 47(6), 57-61.
Hess, K., (Ed.) (December 2010b). Learning progressions frameworks designed for use with the common core state standards in mathematics K-12. National Alternate Assessment Center at the University of Kentucky and the National Center for the Improvement of Educational As-sessment. Retrieved from http://www.nciea.org/publications/Math_LPF_KH11.pdf
Hess, K. (Ed.) (November 2011). Learning progressions frameworks designed for use with the common core state standards in English language Arts and literacy K-12. National Alternate Assessment Center at the University of Kentucky and the National Center for the Improvement of Educational Assessment.
Hess, K., Kurizaki, V., & Holt, L. (2009). Reflections on tools and strategies used in the Hawai’i progress maps project: Lessons learned from learning progressions. Final Report, Tri-State Enhanced Assessment Grant. Minneapolis, MN: University of Minnesota, National Center on Educational Outcomes. Retrieved from http://tristateeag.nceo.info/hawaii-main
Hill, B. C. (2001). Developmental continuums: A framework for literacy instruction and as-sessment K-8. Norwood, MA: Christopher-Gordon Publishers, Inc.
Individuals with Disabilities Education Improvement Act (IDEA) of 2004, PL 108-446, 20 U.S.C. §§ 1400 et seq.
Kurizaki, V. (2011). Educating struggling learners: Reflections on lessons learned about cur-riculum, instruction, and assessment (Synthesis Report 86). Minneapolis, MN: University of Minnesota, National Center on Educational Outcomes.
Masters, & Forster. (1996). Progress maps. (Part of the Assessment Resource Kit.) Melbourne, Australia: The Australian Council for Educational Research, Ltd., 1-58.
25NCEO
New Zealand Ministry of Education. (2007). The number framework. Retrieved from http://www.nzmaths.co.nz/numeracy/2007numPDFs/NumBk1.pdf
New Zealand Ministry of Education. (2010). Literacy learning progressions: Meeting the read-ing and writing demands of the curriculum. Retrieved from http://literacyprogressions.tki.org.nz/
Nichols. P. (2010). What is a learning progression? Retrieved from http://www.pearsonassess-ments.com/NR/rdonlyres/6C8F4D6F-EFB1-47CE-9247-3712D274190F/0/Bulletin_12.pdf
No Child Left Behind Act of 2001, PL 107-110, 115 Stat. 1425, 20 U.S.C §§ 6301 et seq.
National Research Council (NRC). (2001). Knowing what students know: The science and design of educational assessment. Committee on the Foundations of Assessment. J. Pellegrino, N. Chu-dowsky, & R. Glaser (Eds.), Board on Testing and Assessment, Center for Education, Division of Behavioral and Social Sciences and Education. Washington, DC: National Academy Press.
National Research Council (NRC). (2007). Taking science to school: Learning and teaching science in grades K–8. Committee on Science Learning, Kindergarten through eighth grade. R. A. Duschl, H. A. Schweingruber, & A. W. Shouse (Eds.). Washington, DC: The National Academies Press.
Pinnell, G. S., & Fountas, I. C. (2007). The continuum of literacy learning grades K-8: Behaviors and understandings to notice, teach, and support. Portsmouth, ME: Heinemann.
Popham, W. J. (2011). Transformative assessment in action: An inside look at applying the process. Alexandria, VA: Association for Supervision and Curriculum Development.
State of Victoria, Department of Education and Early Childhood Development. Victoria, Aus-tralia. (learning progressions in all content areas). Retrieved from http://www.education.vic.gov.au/studentlearning/teachingresources/
Wilson, M. (2009). Measuring progressions: Assessment structures underlying a learning pro-gression. Journal of Research in Science Teaching, 46(6), 716-730.

26 NCEO

27NCEO
2Hawaiifinalreportver8.16.11
Appendix A -SampleClassroomObservationSummaryForm-MATH
Teacher: grade: School:
skills concepts P Solve X
Lesson content/objective/focus (very brief sentence/include benchmark only if you know it – not required!) For example: This lesson focused on comparing data in tables to graphs representing that data. Strategies observed Describe any specific things the teacher did that would be supportive of any struggling learner – you do not have to make a direct link to their 5 kids Other comments/ideas/suggestions:You might include a positive comment, such as how the teacher encourages use of math language and math dialogue among students. You might include a suggestion – students could benefit from use of manipulatives to demonstrate …
Are there specific examples? Was the lesson focus mostly on one area? All 3?Thelessonincluded:
Skills/procedures Concepts Problemsolving For example: pairs of students were given a “story” and asked to describe what the graph should look like
Appendix B -SampleClassroomObservationSummaryForm-ELA
Teacher: grade: School:
Literal X
Interpret X
Analyze X
Lesson content/objective/focus (very brief sentence/include benchmark only if you know it – not required!) For example: This lesson focused on retelling a story heard read aloud, The Very Hungry Caterpillar.
Strategies observed Other comments/ideas/suggestions:For example: Teacher connected the lesson (book selection) to finding a butterfly chrysalis the day before. Since students know the term “chrysalis” teacher could introduce the term, “chrysalides” which is the plural form of chrysalis.
Are there specific examples? Was the lesson focus mostly on one area? All 3? Literal – Interpreting – Analyzing – students worked in trios to arrange story events in proper sequence
Appendix A Sample Classroom Observation Summary Form - MATH

28 NCEO

29NCEO
Appendix B Sample Classroom Observation Summary Form - ELA
2Hawaiifinalreportver8.16.11
Appendix A -SampleClassroomObservationSummaryForm-MATH
Teacher: grade: School:
skills concepts P Solve X
Lesson content/objective/focus (very brief sentence/include benchmark only if you know it – not required!) For example: This lesson focused on comparing data in tables to graphs representing that data. Strategies observed Describe any specific things the teacher did that would be supportive of any struggling learner – you do not have to make a direct link to their 5 kids Other comments/ideas/suggestions:You might include a positive comment, such as how the teacher encourages use of math language and math dialogue among students. You might include a suggestion – students could benefit from use of manipulatives to demonstrate …
Are there specific examples? Was the lesson focus mostly on one area? All 3?Thelessonincluded:
Skills/procedures Concepts Problemsolving For example: pairs of students were given a “story” and asked to describe what the graph should look like
Appendix B -SampleClassroomObservationSummaryForm-ELA
Teacher: grade: School:
Literal X
Interpret X
Analyze X
Lesson content/objective/focus (very brief sentence/include benchmark only if you know it – not required!) For example: This lesson focused on retelling a story heard read aloud, The Very Hungry Caterpillar.
Strategies observed Other comments/ideas/suggestions:For example: Teacher connected the lesson (book selection) to finding a butterfly chrysalis the day before. Since students know the term “chrysalis” teacher could introduce the term, “chrysalides” which is the plural form of chrysalis.
Are there specific examples? Was the lesson focus mostly on one area? All 3? Literal – Interpreting – Analyzing – students worked in trios to arrange story events in proper sequence

30 NCEO

31NCEO
Sample Questions for Individual Teacher Interviews
Thanks for letting me visit your classroom today. First I have a couple of questions about today’s lesson. Can you relate anything that I saw today to the work we’ve been doing in the project? – for example…
1. Did the lessons I saw today focus on one of your “selected” benchmarks? If yes, where are you in the process of documenting learning? (e.g., just started, near the end)
2. How does the content of the lesson today build on what students have already learned? 3. What is your sense of what the students know and understand at this point about the
topic/content/benchmark? What examples of work/evidence tells you this? 4. Given what your students did today, what are the next steps you will take? Or: How will you build
on what they learned today? Where will you go from here? What helps you to decide next steps? 5. Did you do anything specific today to support one of your struggling learners during the lesson (e.g.,
acted out the problem with props for an ESL student)?
Sample Questions for Focus Groups
(1) In general, how have things been going so far? Has anything about the research project surprised you that you did not expect to see/do? (e.g., changed benchmarks, started later)
#1#2#3#4
(2) Did you have any problems identifying your 5 students? What typically did you do to identify them? What data were most useful in identifying your students?
� Did you remember to complete the table you got in July and check off what data you used for all 5 students? (Someone from the department of education will collect that table from you in March)
� Did you administer the reading or math attitude survey? yes___ no ___ Any comments about that?
(3) Do you have questions or need help with completing the data forms (1, 2, and 3) or selecting evidence of progress? (This question is not about the SWA forms)
Form #1 (learner characteristics with instruction that worked - Appendix F and Appendix G)
� If you were going to describe any of your struggling students to a teacher who was going to take over your class, would the descriptors in Form #1 be helpful?__ accurate? ___
� Do you have suggestions about revising any descriptors?� How many times have you completed this form for each student so far? 1____ 2____3____ (You can
wait until late March to complete the last one.) � So far, have you identified any tools, processes, and/or strategies for assessment and instruction that are
working really effectively for any of these 5 students? (We will have time at the April meeting to discuss this and for you to add ideas then.)
Recording forms were set up to capture comments from multiple responders during focus groups
Appendix C Sample Questions for Teacher Interviews & Focus Groups
32 NCEO
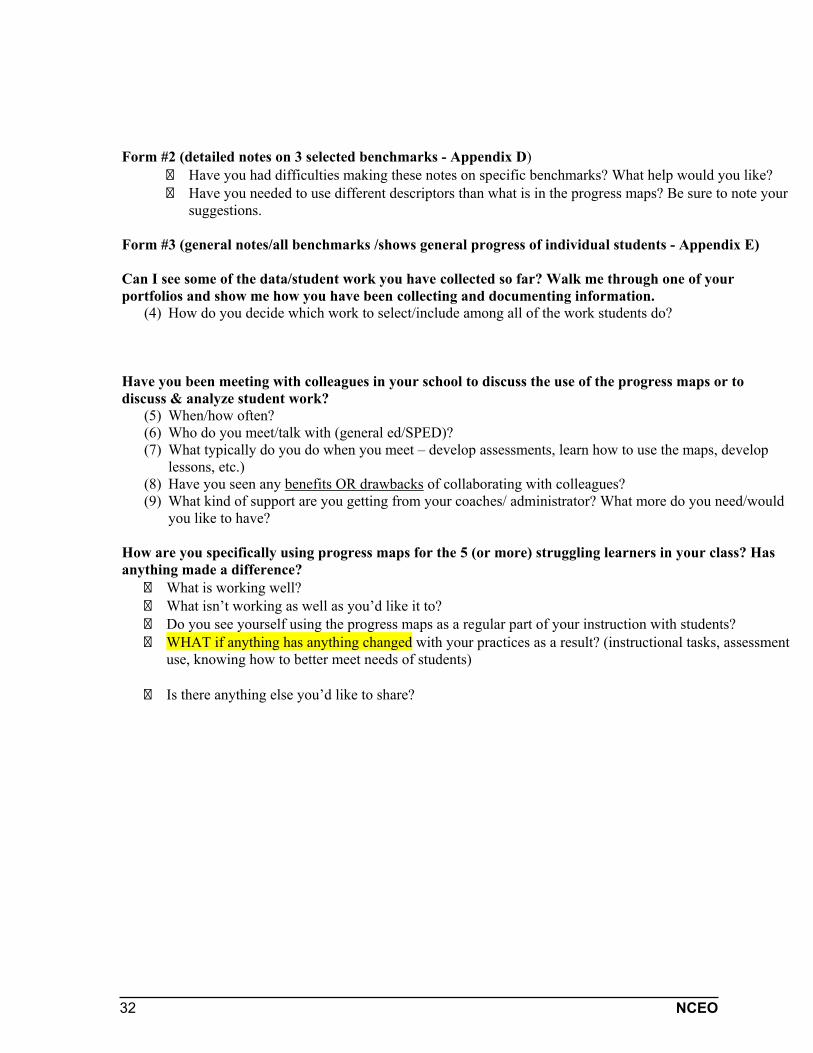
Form #2 (detailed notes on 3 selected benchmarks - Appendix D)� Have you had difficulties making these notes on specific benchmarks? What help would you like? � Have you needed to use different descriptors than what is in the progress maps? Be sure to note your
suggestions.
Form #3 (general notes/all benchmarks /shows general progress of individual students - Appendix E)
Can I see some of the data/student work you have collected so far? Walk me through one of your portfolios and show me how you have been collecting and documenting information.
(4) How do you decide which work to select/include among all of the work students do?
Have you been meeting with colleagues in your school to discuss the use of the progress maps or to discuss & analyze student work?
(5) When/how often? (6) Who do you meet/talk with (general ed/SPED)? (7) What typically do you do when you meet – develop assessments, learn how to use the maps, develop
lessons, etc.) (8) Have you seen any benefits OR drawbacks of collaborating with colleagues? (9) What kind of support are you getting from your coaches/ administrator? What more do you need/would
you like to have?
How are you specifically using progress maps for the 5 (or more) struggling learners in your class? Has anything made a difference?
� What is working well? � What isn’t working as well as you’d like it to? � Do you see yourself using the progress maps as a regular part of your instruction with students? � WHAT if anything has anything changed with your practices as a result? (instructional tasks, assessment
use, knowing how to better meet needs of students)
� Is there anything else you’d like to share?

33NCEO
Check: Math ___ or ELA __√___ Strand: Reading Comprehension Grade Level: 4
LA.4.2.4Distinguish fact from opinion and cause from effect when reading informational textsProgress Map Descriptors
Concept: Constructing Meaning
Below lowest descriptor (please describe what student was able to do)
Foundational
Distinguish fact from opinions based on personal experiences (e.g., Fact: I have black hair. Opinion: I look better as a red head.). Predict effects for experience-based causal factors (i.e. if you study hard, you might get good grades.).
Define the terms, fact, opinion, cause and effect.
Approaching ProficientIdentify cue/signal words for cause/effect pattern (since, because, if/then, etc.) and facts/opinion (I believe, etc.).
ProficientTell which key points are facts and which are opinions; and identify causes and effects.
Student work is “ closest” to which entry leveldescriptor?(include date)
Date o Met
o Not quite
o Met
o Not quite
o Met
o Not quite
o Met
o Not quite
Comments about the Evidence(observed or in the student work): strategies-skills-concepts
Comments related to the assessmentused
Comments related to next steps for instruction or support
Appendix D Form 2: Sample ELA Data Collection Tool for Tracking Progress and Instructional Strategies for a Single Benchmark.
Used to document specific strategies used and analyze student work samples.

34 NCEO

35NCEO
Student ID: 5R-KH-01
Year Grade Classroom Teacher Support Service Provider(s) – is the student receiving
other services
Case Manager/Special Educator
2009-10 5 Karin Hess SLP services -
The Student Profile provides a guide for instructional and assessment planning, progress monitoring, and documentation of essential learning of ELA skills and concepts based on Hawai’i’s grade-level benchmarks and related Hawai’i Progress Map descriptors. The profile provides the “big picture” of ELA benchmarks for the full school year.
Samples of student work will accompany this record and simply be placed inside the student’s folder. When including a sample of student work, label the student work with: (1) Student ID#, (2) Date, (3) letter/column associated with benchmark (e.g., 5R-KH-01, 8/7/09, B). In some cases, an assessment could assess more than one benchmark, so include all letters/benchmarks that apply. (See next pages for letters/columns associated with the Hawai’i ELA benchmarks.)
Check all benchmarks for which you have monitored progress (√) this year.
√ A = Comprehension - LA.5.2.1 √ F = Interpretative Stance - LA.5.3.3 √ K = Vocabulary – LA.5.1.1
√ B = Comprehension - LA.5.2.2 √ G = Personal Connection - LA.5.3.7 √ L = Use of Resources –
LA.5.1.2√ C = Comprehension -
LA.5.2.3 H = Critical Stance - LA.5.3.4
D = Interpretative Stance - LA.5.3.1
I = Critical Stance - LA.5.3.5
E = Interpretative Stance - LA.5.3.2
J = Literary Elements - LA.5.3.6
DIRECTIONS for Documenting Progress:
/ in the box indicates the skill/concept has been introduced, but the student has not yet demonstrated conceptual understanding or consistently applied the skill (e.g., identify characters in different texts). It may be necessary to: scaffold instruction; re-teach the concept using another approach or another text/activity; or re-assess acquisition of skills/concepts at earlier levels if not yet mastered. Administering formative assessments during instructional activities is highly recommended to guide instructional planning and appropriate timing of the summative assessments. (You may wish to collect some of the shorter formative assessment probes you’ve used, in addition to pre-mid-post assessments.)
X in the box indicates the student has fully met expectations, meaning that there is sufficient evidence(assessment data from multiple formats – teacher observations, formative assessments, performance tasks, etc.) to support this conclusion.
Use this form to complete one profile for each student. Collect work samples with ID#, date, & benchmark (A, B, C, etc.). OPTIONAL: Add any other notes/descriptors of performance to make the profile more useful or meaningful.
Please note the number of assessments you’re including with student work samples.
Appendix E Form 3: Sample Student Profile for Language Arts (Data Collection Tool for Tracking Multiple Benchmarks)
Sample Student Profile for ELA - Grade 5

36 NCEO
ELA
A Is the student using organizational patterns
(e.g., compare and contrast, proposition and support) to
access information?
B Can the student make inferences and draw
conclusions about grade-appropriate texts?
C Can the student distinguish between explicit and implied
information?
PM descriptors
Comprehension - LA.5.2.1 Understanding Text Structure
Comprehension - LA.5.2.2 Constructing Meaning
Comprehension - LA.5.2.3 Constructing Meaning
Adv
ance
d
Prof
icie
nt
X Use organizational patterns (e.g., proposition and support) to access and construct meaning. /
Make inferences and draw conclusions about grade-appropriate texts /
Distinguish between explicit (i.e., directly stated) and implied (i.e., inferred) information.
2 assessments
1 assessment – will continue in 3rd quarter
2 assessments– will continue in 3rd quarter
App
roac
hing
Prof
icie
nt
X Use graphic representations to organize information in texts (e.g., proposition/ support frame, etc.).
X Use prior experience to draw a conclusion based on a simple text with clear clues as to a possible outcome (i.e., “The coyote was hungry. He saw a rabbit. So he…”).
X
Locate clues within a text that might support an inference.
1 assessment 1 assessment Teacher observation/question student after reading
Locate words that give clues to the organizational structure of a text (e.g., expert said, examples to support, etc.).
X Draw a conclusions about a passage based on both the text and an illustration. X
Identify explicit information in a text (i.e., find answer to a who, what, when, where question).
1 assessment
Foun
datio
nal
X Identify the elements of an organizational pattern (e.g., proposition and support, problem-solution, cause-effect, etc.).
X Identify what is happening in a text after viewing an illustration.
XDefine implied or inferred information as logical guesses based on personal experience (e.g., The cat is limping so he must be injured.).
2 assessments
Teacher observation/question student after reading
Bel
ow lo
wes
t de
scrip
tor
X Locate signal words in a variety of texts 1 assessment
X Match signal words with appropriate text structure 1 assessment
NO
TES
Text Structures: sequence, cause-effect, chronology, description, compare/contrast, proposition/support
Teacher notes that student showed proficiency “x” Student has NOT
shown proficiency yet on this benchmark
The teacher added notes about text structures included for instruction and formative assessments “below” the lowest descriptors on the Progress Map. Student successfully showed understanding. (See “x” in boxes for this benchmark.)

37NCEO
© (2008) Karin Hess. Student profile for use with learning progressions. Permission to reproduce is given when authorship is fully cited ([email protected]).
D Can the student cite specific information or
ideas in the text that support and develop the
author’s message or theme?
E Can the student explain the
relationship between plot events and how
they build to the resolution of the
selection’s primary conflict?
F Can the student explain how
characters evolve over the course of a
work?
G Can the student describe similarities and differences
between characters and themes in literary texts and
personal or real world experiences?
LA.5.3.1 - Interpretative Stance
LA.5.3.2- Interpretative Stance
LA.5.3.3- Interpretative Stance
LA.5.3.7 – Personal connection
Advanced
/
ProficientCite specific information or ideas in the text that support and develop the author’s message or theme
X
Explain the relationship between events and resolution such as cause and effect, coincidence, chance, etc. and how they build to the resolution of the selection’s primary conflict
X
Explain how characters evolve over the course of a work.
Describe how the characters and theme in a text are alike or different from own life or the real world (text to self, text to world).
X
Approaching Proficient Cite details in the text that support the theme. X
Identify important events that leads to resolution
X
Tell how a character changes over time (e.g. in the beginning… - now…)
Identify a theme from a text and connect it to own experience or world experiences
X
Identify the author’s message.
X
Cite a change in the main character’s actions, thoughts, or feelings.
X
Align similar attributes, actions, or motives between self and character
Foundational
Below Lowest Descriptor
NO
TES
Made connections between signal words, text structures & cause-effect in story events
The teacher includes some information on other benchmarks, although reading comprehension was the focus for the data collection. (See “x” or “/” for other benchmarks achieved or almost met.)
38 NCEO

39NCEO
Connecting Learner Characteristics to Instructional Supports for Reading
Student _____________________ Grade ____ Student ID# ____________________ Directions: List student ID# at top of page. Check all descriptors that apply (3 times during the instructional time). Describe instructional supports to which the student responded positively.
Reading Learner Characteristics Pre Mid Post Instructional Supports that Worked
Self-Monitors/ Uses Reading Strategies
Uses no fix-up strategies Tries some fix-up strategies with limited success
Fix-up strategies help to construct meaning; self-corrects for meaning
Decodes
Uses Reading Strategies
Reads one-syllable, short vowel words & words with silent e
Uses word patterns & syllable types to decode common words
Uses patterns, affixes, roots to decode multi-syllable words
Retells
Comprehends
Not able to retell what was read (read aloud or silently)
Partial retell; has some story elements Retell is logical; includes all story elements
Predicts
Comprehends
Unable to predict; or predictions not supported by text/illustrations/ visuals
Predictions consistent; text logically supports predictions /assumptions
Paraphrases Summarizes
Comprehends
Unable to summarize/paraphrase (e.g., only identifies topic)
Partial information; lacks key ideas or ideas in random order
Main ideas/events with relevant details in correct sequence
Transfers comprehension skills to different text genres
MakesRelevant Connections Interprets
Unable to respond personally Gives personal response, but not explicitly related to text
Response applies personal experiences & knowledge to text
Asks Questions/ Interprets
Asks literal questions; short answer/word-level questions
Asks inferential/analytical questions MakesInferences
Interprets
Literal response; no interpretation; interpretation not logical
Logical interpretation; infers basic cause-effect
Logical & deeper interpretation; infers relationships between ideas or parts; elaborates with support
Appendix F Form 1: Learner Characteristics for Reading

40 NCEO
Expands Vocabulary
Lacks understanding of key words/ideas
Understands most concrete/ literal word meanings
Uses word relationships (e.g., synonyms, analogies) for meaning
Learner Characteristics (cont) Pre Mid Post Instructional Supports that
Worked Understands or interprets abstract/ figurative meanings
Reading Attitudes/ Habits
Lacks interest or confidence in reading
Shows some interest or confidence
Self-selects books at appropriate level; Sustains engagement
Communication Describe
Auditory Describe
VisualDescribe
Motor or Spatial Skills Describe
Other?
Learner Characteristics for Reading, Developed by Karin K. Hess (2008), National Center for Assessment using Keene’s Major Point Interview (1997), Dewitz (Feb. 2003 Reading Teacher), Biggam & Itterly (Literacy Profiles, 2008), & Bonnie Campbell Hill (Developmental Continuums, 2001). © Karin Hess. Permission to reproduce is given when authorship is fully cited ([email protected]).

41NCEO
Connecting Learner Characteristics to Instructional Supports for Mathematics
Teacher ________________________ Grade ___ Student ID# ____________ Directions: List student ID# at top of page. Check all descriptors that apply (3 times during the instructional time). Describe instructional supports to which the student responded positively.
Math Learner Characteristics Pre Mid Post Instructional Supports that
Worked
Com
puta
tiona
l Ski
lls
and
Proc
edur
es
Still developing understanding of numbers, counting, equals, basic math language & representations
Counts, skip counts, uses manipulatives, or calculator for routine operations
Connects the concrete (objects) to symbolic representations /expressions
Does routine computational procedures with and without a calculator; demonstrates some fluency of number facts & operations (+, -, x, ÷)
Performs specified routine procedures (e.g., rules for rounding, measuring, evaluating an expression)
Performs procedures with multiple steps or multiple decision points
Con
cept
ual U
nder
stan
ding
Performs basic routine procedures but cannot explain why/reasoning
Applies concepts only in familiar contexts (e.g., place value, estimating, =, ≤, ≥)
Can give example or non-example of concept or approach that will work
Explains a term, symbolic representation, principle, operation, or relationship (e.g., add-subtract)
Compares, classifies, or orders data, observations, or figures
Constructs and interprets simple representations (e.g., bar graph)
Extends and generalizes a pattern Translates from one representation to another Solves routine problems requiring the application of multiple concepts
Uses concepts to solve non-routine problems; generalizes to new situations
Explains thinking when more than one response or approach is possible
Appendix G Form 1: Learner Characteristics for Mathematics

42 NCEO
Math Learner Characteristics (cont.) Pre Mid Post Instructional Supports that
Worked
Prob
lem
Sol
ving
Ski
lls
Misinterprets the question or unable to locate key information needed
Chooses a partial or inappropriate strategy to solve the problem
Solves simple problems with periodic support/scaffolding provided
Locates key information (e.g., question) needed to solve problem
Independently solves a one-step word problem Retrieves information from a table, graph, or figure to solve a problem requiring multiple steps
Applies appropriate strategies/ approaches/ materials to solve routine word problems from various contexts
Applies computational procedures to solve routineor non-routine word problems from a variety of contexts
Applies variety of strategies/approaches to solve routine and non- routine word problems from a variety of contexts
Atti
tude
s/ H
abits
Demonstrates interest or confidence when using math to solve problems
Checks reasonableness of solutions; verifies results; self corrects
Sustains engagement; initiates different strategies when answer is not apparent
Commu-nication
Auditory Visual Spatialor Motor Skills
Other?
Learner Characteristics for Mathematics, developed by Karin Hess (2008), Center for Assessment, using Webb’s Depth of Knowledge Levels (1997), First Steps in Mathematics (STEPS PD, Beverly MA, 2007), & Mathematics Assessment Handbooks K-2, 3-5 & 6-8 (NCTM, 2005). © Karin Hess. Permission to reproduce is given when authorship is fully cited ([email protected]).

43NCEO
Appendix H Student Work Analysis (SWA) Meeting Evaluation Survey #1 (August 2010)Appendix H - SWA Meeting Evaluation Survey #1 (August 8, 2009)
For all Reading and Mathematics teachers participating in theHawaii General Supervision Enhancement Grant (HI GSEG)
Instructions: Please rate the following statements on a scale of 1 to 7 using the rating scales and keys under each question. If you are not able to provide an answer to a question, please indicate CR (Cannot Rate). You can either: highlight your response or underline your response and email it back. Feel free to add other comments to explain any response if you wish. Names are optional.
Please note that this information will solely be used to describe general participant responses about the usefulness & clarity of SWA workshop activities and materials.
Meeting Outcomes A. I felt satisfied with the progress we made in reviewing student work for reading or mathematics.
1 2 3 4 5 6 7 CR (Strongly Disagree) (Strongly Agree)
B. I learned new and effective strategies for reviewing student work for reading or mathematics. .
1 2 3 4 5 6 7 CR (Strongly Disagree) (Strongly Agree)
C. I already knew all or most of the strategies for reviewing student work and did not learn any new ideas today. .
1 2 3 4 5 6 7 CR (Strongly Disagree) (Strongly Agree)
Workshop Activities & Facilitation A. I felt satisfied with my understanding of the strategies we can use to review student work back in our classrooms/schools.
1 2 3 4 5 6 7 CR (Strongly Disagree) (Strongly Agree)
B. Facilitators answered questions in a clear, concise, and appropriate manner. 1 2 3 4 5 6 7 CR
(Strongly Disagree) (Strongly Agree)
C. Facilitators were well-organized and kept the workshop moving in a timely manner. 1 2 3 4 5 6 7 CR
(Strongly Disagree) (Strongly Agree)

44 NCEO
D. Materials used for the workshop were useful and I feel well-prepared to use them. 1 2 3 4 5 6 7 CR
(Strongly Disagree) (Strongly Agree)
E. Individuals in my content group reflected a team orientation and collaborated well when coming to consensus on scoring or interpreting student work.
1 2 3 4 5 6 7 CR (Strongly Disagree) (Strongly Agree)
How could the process for student work analysis (SWA) be improved in the future?
Please explain how you intend to use the information gained from participation in thismeeting (e.g., in your classroom, understanding of specific students, understanding of use of assessment).
Please provide any additional comments regarding the meeting.
Please rate the overall quality of this meeting (e.g., outcomes accomplished, quality of facilitation, satisfaction with activities to prepare you for the work ahead).
1 2 3 4 5 6 7 CR (Low quality) (High Quality)
Your Demographic Information A. Please indicate your content area:
_____Reading _____Mathematics
B. Please indicate the grade-level your are working with: _____Grade K _____Grade 3 _____Grade 6 _____Grade 1 _____Grade 4 _____Grade 7 _____Grade 2 _____Grade 5 _____Grade 8
C. Please indicate your area(s) of expertise:_____Special Education_____Classroom Teacher
_____Other, please specify ___________

45NCEO
For all Reading and Mathematics Teachers participating in the Hawaii GSEG Research Project
Instructions: Please rate the following statements on a scale of 1 to 7 using the rating scales and keys under each question. If you are not able to provide an answer to a question, please indicate CR (Cannot Rate). Please circle your responses and return. Feel free to add comments to explain any response.
Please note that this information will solely be used to describe general participant responses about the usefulness & clarity of SWA workshop activities and materials.
SWA Meeting Outcomes – I have now participated in _____ SWA sessions (2009-2010) – include both the school-based session on your own and Saturday sessions. I think it will be 6 if you started in July and went to all of them
A. I feel satisfied with the progress I’ve made so far this year - using what I’ve learned from analyzing my students’ work with others.
1 2 3 4 5 6 7 CR (Strongly Disagree) (Strongly Agree)
B. I have learned/ applied new and effective strategies for using SWA to plan instruction or assessments.
1 2 3 4 5 6 7 CR (Strongly Disagree) (Strongly Agree)
C. The most beneficial outcome of the SWA sessions for me was:
Workshop Activities & Facilitation
A. Information presented was relevant to me, my colleagues, and ultimately my students. 1 2 3 4 5 6 7 CR
(Strongly Disagree) (Strongly Agree)
B. Facilitators were well-organized and kept the workshops moving in a timely manner. 1 2 3 4 5 6 7 CR
(Strongly Disagree) (Strongly Agree)
Appendix I Student Work Analysis (SWA) Meeting Evaluation Survey #2 (January 2011)

46 NCEO
C. Materials used for the SWA workshop were useful and I feel well-prepared to use them in the future.
1 2 3 4 5 6 7 CR (Strongly Disagree) (Strongly Agree)
D. Individuals in my content group reflected a team orientation and collaborated well when coming to consensus on scoring or interpreting student work.
1 2 3 4 5 6 7 CR (Strongly Disagree) (Strongly Agree)
Please explain how you intend to use the information gained from participation this year (e.g., in your classroom, understanding of specific students, understanding of use of assessment data, collaborating with colleagues). How could the SWA process for student work analysis be improved in the future? Please provide any additional comments.
Please rate the overall quality of the SWA meetings (e.g., outcomes accomplished, quality of facilitation, satisfaction with activities to prepare you for applying strategies in the future).
1 2 3 4 5 6 7 CR (Low quality) (High Quality) Your Demographic Information
A. Please indicate your content area: _____Reading _____Mathematics
B. Please indicate the grade-level your are working with: _____Grade K _____Grade 3 _____Grade 6 _____Grade 1 _____Grade 4 _____Grade 7 _____Grade 2 _____Grade 5 _____Grade 8
C. Please indicate your area(s) of expertise:_____Special Education_____Classroom Teacher
_____Other, please specify ___________
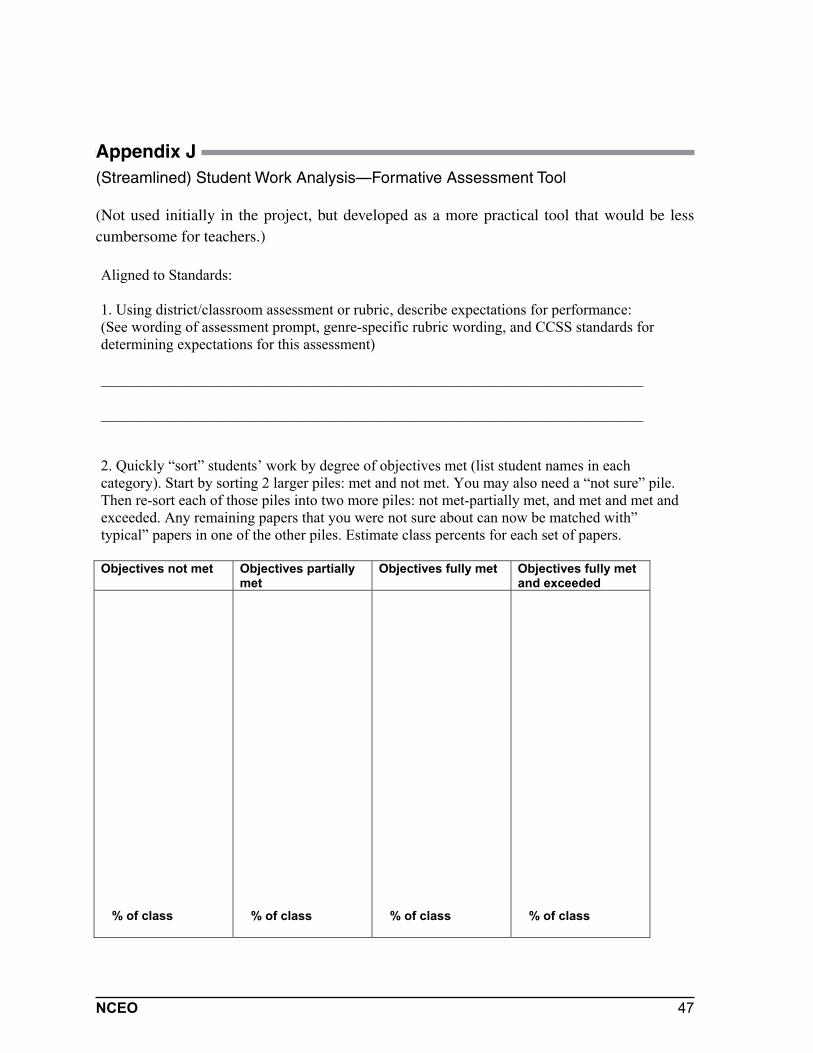
47NCEO
Subject Area: Grade Level:
Performance Task/Assessment:
Aligned to Standards:
1. Using district/classroom assessment or rubric, describe expectations for performance: (See wording of assessment prompt, genre-specific rubric wording, and CCSS standards for determining expectations for this assessment)
________________________________________________________________________
________________________________________________________________________
2. Quickly “sort” students’ work by degree of objectives met (list student names in each category). Start by sorting 2 larger piles: met and not met. You may also need a “not sure” pile. Then re-sort each of those piles into two more piles: not met-partially met, and met and met and exceeded. Any remaining papers that you were not sure about can now be matched with” typical” papers in one of the other piles. Estimate class percents for each set of papers.
Objectives not met Objectives partially met
Objectives fully met Objectives fully met and exceeded
% of class
% of class % of class % of class
Appendix J (Streamlined) Student Work Analysis—Formative Assessment Tool
(Not used initially in the project, but developed as a more practical tool that would be less cumbersome for teachers.)

48 NCEO
3. Choose samples from each group/category and describe “typical” performance, or specific performance of selected students in each grouping. Objectives not met Objectives partially
metObjectives fully met Objectives fully met
and exceeded
4. based on above descriptions, describe learning needs of identified students (or students in each targeted group) Objectives not met Objectives partially
metObjectives fully met Objectives fully met
and exceeded
5. Identify differentiated strategies to move ALL groups of students forward. Note any patterns or trends. What will some students benefit from? What will all students benefit from?
© 2009 Student Work Analysis Tool Adapted by Karin Hess from: Moir, E. (October 2009). “Accelerating teacher effectiveness: Lessons learned from two decades of new teacher induction.” Phi Delta Kappan, V91 N2. Permission to reproduce is given when authorship is fully cited ([email protected]).

49NCEO
1. What is your current “official” position at the school? (check all that apply) o Principal o Assistant principal o School curriculum coordinator/curriculum developer o District curriculum coordinator/curriculum developer o literacy or numeracy coach o staff development specialist o department chair o mentor teacher o other (please describe):
2. How would you describe your role in supporting Field Test (FT) teachers in your school during
the Hawaii LP Project? (Check all that apply.) o Providing time for teachers to meet o Providing substitutes/coverage for teachers to have released time related to project o Providing additional resources for teachers to implement LP project, specific lessons, or assessments o Acting as a Mentor – as a curriculum/instructional specialist o Acting as a Mentor – as an assessment specialist o Attending curriculum/lesson planning meetings with teachers o Attending student work analysis meetings with teachers o Facilitating curriculum/lesson planning meetings with teachers o Facilitating student work analysis meetings with teachers o Locating available resources (please describe): o Other (please describe):
3. What have you seen as the greatest impacts as a result of teachers’ participation in the research
project? (Please feel free to elaborate on any that apply.) o curricular planning at the school? o teaching/instruction/lesson planning? o their view of students/student learning? o their approach to/understanding of formative and summative assessment? o Collaboration? o Other?
4. Do you have any comments about …
Teachers’ collegial discussions about how children learn.
Teachers analyzing student work/ assessment data with colleagues.
Appendix K School Leader Survey

50 NCEO
Teachers’ attitudes about low performing students as result of this work.
Teachers’ attitudes about average or high performing students have changed as result of this work.
Teachers developing high quality formative assessments.
Teachers developing instruction that targets specific learning needs.
5. What have you seen as the teachers’ greatest challenge(s) during this project and how have you
or the teachers addressed it? 6. Are there any plans to sustain, expand, or enhance use of learning progressions in any way at
your school? (Feel free to elaborate on your response.)
7. What else would you like to share with us? Is there anything we haven’t asked about that you’d like us to know about your school’s involvement with the LP project?

NCEO is an affiliated center of the Institute on Community Integration