learning score function parameters for improved spectrum
TRANSCRIPT

Learning Score Function Parameters for Improved SpectrumIdentification in Tandem Mass Spectrometry ExperimentsMarina Spivak,† Michael S. Bereman,† Michael J. MacCoss,† and William Stafford Noble†,‡,*†Department of Genome Sciences, University of Washington, Seattle, Washington, United States‡Department of Computer Science and Engineering, University of Washington, Seattle, Washington, United States
*S Supporting Information
ABSTRACT: The identification of proteins from spectra derived froma tandem mass spectrometry experiment involves several challenges:matching each observed spectrum to a peptide sequence, ranking theresulting collection of peptide-spectrum matches, assigning statisticalconfidence estimates to the matches, and identifying the proteins. Thepresent work addresses algorithms to rank peptide−spectrum matches.Many of these algorithms, such as PeptideProphet, IDPicker, or Q-ranker, follow a similar methodology that includes representing peptide-spectrum matches as feature vectors and using optimization techniquesto rank them. We propose a richer and more flexible feature setrepresentation that is based on the parametrization of the SEQUESTXCorr score and that can be used by all of these algorithms. Thisextended feature set allows a more effective ranking of the peptide-spectrum matches based on the target-decoy strategy, in comparison toa baseline feature set devoid of these XCorr-based features. Ranking using the extended feature set gives 10−40% improvementin the number of distinct peptide identifications relative to a range of q-value thresholds. While this work is inspired by the modelof the theoretical spectrum and the similarity measure between spectra used specifically by SEQUEST, the method itself can beapplied to the output of any database search. Further, our approach can be trivially extended beyond XCorr to any linear operatorthat can serve as similarity score between experimental spectra and peptide sequences.
KEYWORDS: machine learning, spectrum identification, shotgun proteomics
1. INTRODUCTION
The core problems in the analysis of shotgun proteomics datainclude mapping each observed spectrum to the sequence ofthe peptide that generated the spectrum and determining whichof these matches are likely to be correct. Methods for matchingspectra to peptide sequences (reviewed in ref 1) can besubdivided according to whether they take as input only theobserved spectrumde novo methodsor take as input theobserved spectrum and a database of peptides, although thedistinction between these two types of algorithms is sometimesfuzzy. In this work, we focus on the latter, database searchformulation of the peptide identification problem.In particular, we use as the starting point for our experiments
one of the most widely used database search algorithms,SEQUEST.2 The SEQUEST algorithm generates a theoreticalspectrum with fixed peak heights for each candidate peptide inthe databasethat is, each peptide whose mass lies within auser-specified range of the inferred precursor mass associatedwith a particular, observed spectrumand then uses a cross-correlation-based score, XCorr, to measure the similaritybetween the observed spectra and these idealized theoreticalspectra.Because database search algorithms like SEQUEST will
always output the best-scoring match for every observed
spectrum, regardless of the quality of the match, a number ofalgorithms have been developed to assign confidence estimatesto the peptide-spectrum matches (PSMs).3−8 All of thesealgorithms essentially solve two distinct problems: (1) rankingthe matches produced by a search engine in such a way that(ideally) the top of the ranked list is enriched with correctmatches, and (2) assigning to each match an estimate of thelikelihood that the given match is correct. For the second task,various statistical measures, such as posterior error probabilities,false discovery rate estimates or q-values, have been employed.9
In this work, we focus on the ranking task, and we use apreviously described method10 to assign statistical confidenceestimates.Although XCorr can be used directly to rank peptide-
spectrum matches, combinations of several measures ofpeptide-spectrum match quality produced by the databasesearch have been shown to yield substantial increases in thenumbers of peptides identified with high confidence. Therefore,many state-of-the-art algorithms represent peptide-spectrummatches as feature vectors, composed of a collection of qualitymeasures of the peptide-spectrum matches, as well as
Received: March 9, 2012Published: August 6, 2012
Article
pubs.acs.org/jpr
© 2012 American Chemical Society 4499 dx.doi.org/10.1021/pr300234m | J. Proteome Res. 2012, 11, 4499−4508
characteristics of the candidate peptides and the spectra. Forexample, for SEQUEST database search, IDPicker6 uses twoindicators of match quality: (1) XCorr (see eq 3), and (2) δCn,the fractional difference between the current and second bestXCorr score. PeptideProphet3 uses four features: (1) XCorr,(2) δCn, (3) SpRank, the rank of the current PSM in the listthat is sorted based on a preliminary score function, and (4) theabsolute value of the difference between the mass of the peptideand the measured mass of the precursor ion. Percolator7 and Q-ranker8 further expand this feature set to include charge states,indicators of tryptic termini and other match quality measures(see Supplementary Table 1, Supporting Information).All of the match verification algorithms mentioned above
represent the score of a peptide-spectrum match x by somefamily of parametrized functions f(x) and use optimizationtechniques to find parameters of f based on empirical data.Percolator, Q-ranker and PeptideProphet use discriminantfunction analysis to determine the parameters of the scorefunction f, while IDPicker uses Monte Carlo simulation to findthe optimal parameter values.The scores of the peptide-spectrum matches based on the
values of the function f are then used to estimate statisticalmeasures of the confidence of each match. Thus, Percolator, Q-ranker and IDpicker rank the matches based on their scores andthen assign false discovery rates to the matches as an estimateof their correctness based on the ranking. PeptideProphet usesthe EM algorithm to assign posterior probabilities that thematches are accurate. At this stage of the analysis, IDPicker andPeptideProphet make use of additional information about thematchessuch as enzyme specificity, missed cleavage sites andcharge statesthat Percolator and Q-Ranker incorporatedirectly into the input to the peptide-spectrum match scorefunction. PeptideProphet models the joint distribution of thepeptide-spectrum match scores, numbers of tryptic termini andnumbers of missed cleavages during the EM analysis. IDPickerdivides the matches into separate groups based on their chargestates and numbers of tryptic termini and then draws FDRthresholds separately for each group.In this work, we focus on learning the peptide-spectrum
match score function f(x). We aim to incorporate elements ofthe theoretical spectrum generation used during the precedingdatabase search into the learning process. We thereforeparametrize the model used by the search engine, and we usemachine learning techniques to adjust these parameters duringthe match evaluation step of the analysis. The main idea in thiswork is to exploit the linearity of the cross-correlation functionas well as the XCorr score in order to parametrize the scorefunction f(x) in terms of the peak heights of the theoreticalspectrum. The optimal values of these parameters can then bedetermined based on empirical data using optimizationtechniques. The aim is to produce an optimal solution to thetarget-decoy ranking task. The resulting ranking can then be
used for estimations of the statistical confidence of the peptide-spectrum matches.The advantage of our approach is that we use global
information about the whole collection of spectra in the dataset to adjust the peak height assumptions made during thedatabase search. Accordingly, the peak height parametersoptimal for ranking are estimated in the context of otherfeatures of the entire set of peptide-spectrum matches. Theinformation about these global characteristics is not available tothe search engine, because the whole peptide-spectrum matchcollection does not yet exist during the database search.We demonstrate that the parametrization we propose leads
to improved performance in comparison to a baseline featureset that uses fixed peak heights to compute XCorr. In particular,the extended feature set yields 10−40% improvement in thenumber of peptide identifications over a range of q-valuethresholds on all of the data sets examined in this paper. Weshow that these results are due to the use of the more flexiblefeature set and are supported by variations in the models thatwe optimized.
2. PARAMETRIZATION OF THE CROSS-CORRELATIONFUNCTION IN TERMS OF THE PEAK HEIGHTS OFTHE THEORETICAL SPECTRUM
2.1. SEQUEST Search
Before presenting our parametrized score function, we describethe preprocessing of the observed spectrum, the model of thetheoretical spectrum and the XCorr score used by SEQUEST.2
Before the analysis, each observed spectrum is divided into 10equal mass-to-charge regions, and each region is linearlynormalized by the highest intensity peak contained in it. Thetheoretical spectrum is represented by ∼1 Da bins ranging from0 to the maximum possible mass-to-charge of peptidefragments in the data set. To create a theoretical spectrumfrom a peptide amino acid sequence, the algorithm identifies allprefix and suffix ions (b-ions and y-ions), generates six peaks foreach ion and distributes these peaks into the bin closest to theirmass-to-charge ratio. The six peaks correspond to
1 Primary peaks, with an m/z value based on the sum ofthe masses of the amino acids in the corresponding b- ory-ion,
2 Flanking peaks, occupying the 1-Th bins on either side ofthe primary peak, and
3 Three neutral loss peaks corresponding to loss of water(18.0153 Da), ammonia (17.03056 Da) or carbonmonoxide (28.0101 Da). The carbon monoxide loss,which is equivalent to an a-ion, is included only for b-ions.
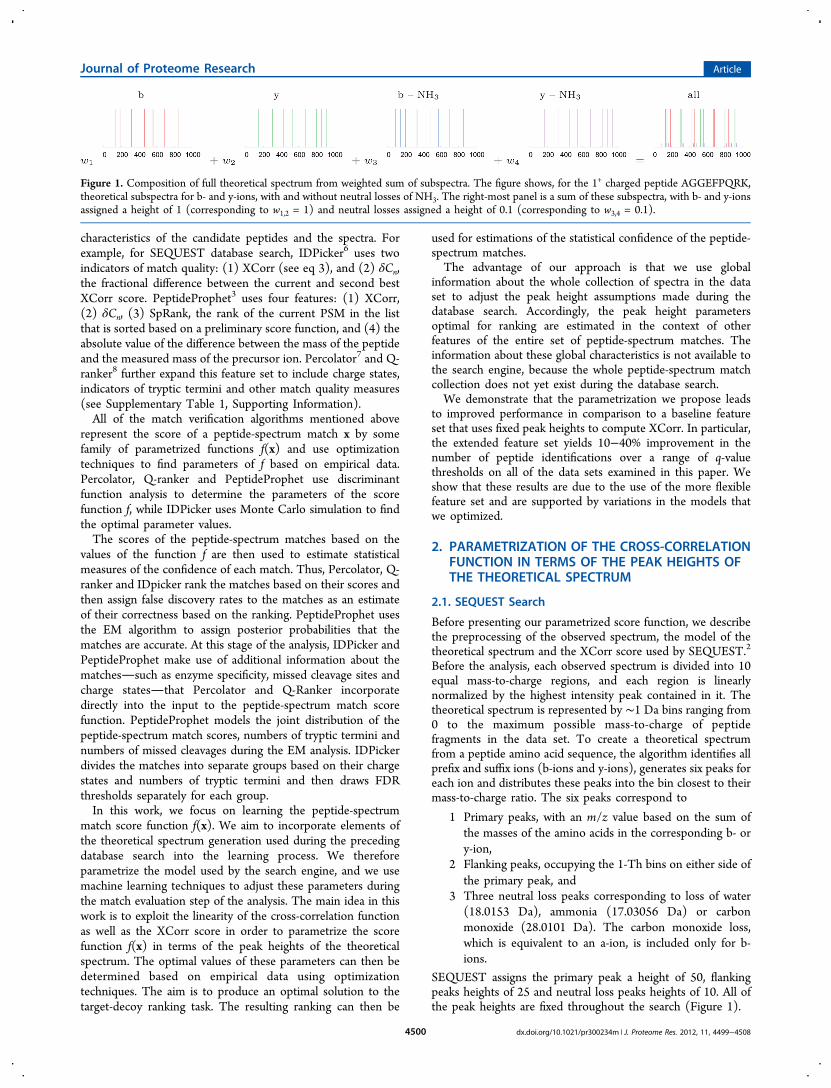
SEQUEST assigns the primary peak a height of 50, flankingpeaks heights of 25 and neutral loss peaks heights of 10. All ofthe peak heights are fixed throughout the search (Figure 1).
Figure 1. Composition of full theoretical spectrum from weighted sum of subspectra. The figure shows, for the 1+ charged peptide AGGEFPQRK,theoretical subspectra for b- and y-ions, with and without neutral losses of NH3. The right-most panel is a sum of these subspectra, with b- and y-ionsassigned a height of 1 (corresponding to w1,2 = 1) and neutral losses assigned a height of 0.1 (corresponding to w3,4 = 0.1).
Journal of Proteome Research Article
dx.doi.org/10.1021/pr300234m | J. Proteome Res. 2012, 11, 4499−45084500

The search procedure then computes a similarity measurebetween each experimental spectrum s and theoreticalspectrum t given by the XCorr score, which measures theextent to which the experimental and theoretical spectra align.11
The XCorr score is the cross-correlation between spectra withno shift minus the average cross-correlation calculated from arange of shifts:
∑Ξ = −τ τ
τ
τ=− ≠
=+⎛⎝⎜⎜
⎞⎠⎟⎟R Rs t( , ) /1500
75, 0
75
(1)
where
∑=τ τ+R t si i (2)
The output is a ranking of candidate peptides according to Ξ.Eng et al.12 showed that the SEQUEST XCorr score can be
calculated efficiently:
Ξ = ′⋅ ̃t s t s( , ) (3)
where
∑̃ = −τ τ
τ
τ=− ≠
=⎛⎝⎜⎜
⎞⎠⎟⎟s s s /150i i
75, 0
75
and s ̃ are computed once for each observed spectrum s. Theformulation of the XCorr given by eq 3 indicates clearly thatthe function is linear in the theoretical spectrum.2.2. Parametrization
One of the stronger assumptions made by SEQUEST is theassignment of fixed heights to various types of peaks in thetheoretical spectra. Here we address this assumption byparametrizing the theoretical spectrum model and adjustingthe parameters based on empirical data.We start with decisions about which ion types in a spectrum
will have peak heights that can be modeled as relativelyindependent of the peak heights of the other ions types. Sinceall the peaks in a spectrum arise from a single peptide sample,their heights must have some mutual dependence. However, ithas been observed that different ion types can be characterizedby their specific ranges of peak heights that remain consistentacross multiple spectra in the experiment.13 This observationimplies that there are physical and chemical factors thatintroduce consistent biases in the heights of the peaks ofdifferent ion types, making these heights somewhat independ-ent of the original peptide concentration and of each other.Indeed, extensive studies have used large collections of spectrato elucidate these factors, provide statistical analysis of the peakheights of various ion types and attempt to create computa-tional models of these events (see review in ref 13).For the purposes of parametrization of the theoretical
spectrum, we rely on the observation in these studies that thedifferent ion types can be characterized by the height ranges oftheir peaks. We assume that the following ion peaks will havecharacteristic heights: b-ion; y-ion; NH3 loss from b-ion; H2Oloss from b-ion; NH3 loss from y-ion; H2O loss from y-ion;flanking peaks; CO loss from b-ion. However, we stress that theparametrization presented in this paper can be triviallyextended to any other subdivision of the theoretical spectruminto ion types.Each ion type is represented by a separate theoretical
“subspectrum”, containing peaks with m/z values correspond-ing to a single ion type and with unit intensities (Figure 1). A
full theoretical spectrum for any peptide sequence can berepresented as a weighted sum of the N subspectra t1 ... tNcorresponding to each separate ion type:
∑==
wt ti
N
i i1 (4)
Because the XCorr score given by eq 3 is linear in thetheoretical spectrum, it can be written as
∑Ξ ==
wPi
N
i i1 (5)
where
= ′ ̃P t si i (6)
On the basis of this parametrization, any feature setrepresentation of the peptide-spectrum match can beaugmented to contain several features Pi, representing thesum of shifted cross-correlations of the observed spectrum withthe theoretical subspectrum for each individual ion type. Inparticular, all of the postprocessing algorithms mentioned in theIntroduction that use the XCorr score as one of the featuresPeptideProphet,3 IDPicker,6 and Q-ranker8can triviallyaugment their feature sets in this fashion. Similarly, featuresets that do not contain the cross-correlation or the XCorrscore can be extended to contain these new features.In this work, we use the peptide-spectrum match feature
representation previously described in references 7 and 8, as thebase feature set, which we employ as a baseline for all theexperiments in the paper. We then modify this feature set byadding the XCorr score of the products P1 ... P8 given by eq 5 tothe base feature set, while leaving all the of the othercomponents intact. The baseline and extended feature setsare described in Supplementary Table 1(Supporting Informa-tion). Note that we do not remove the XCorr score from thebase feature set when we add the subspectrum features, becauseour discriminative model is capable of making use of partiallyredundant features. We compare the performance of these twofeature representations of peptide-spectrum matches inoptimization techniques based on different score functions f(x).
3. METHODS AND DATA SETS
3.1. Methods
For a detailed description of the optimization problem setupand methods see the Supporting Information. Here we give theessential elements of our approach.In this paper we use a target-decoy learning strategy,7,8 and
we assign positive labels y = 1 to the peptide-spectrum matchescontaining real peptides and negative labels y = −1 to thepeptide-spectrum matches containing decoy peptides. Weemploy a linear model for computing the peptide-spectrummatch score function (see eq 1 in the Supporting Information).We then solve a ranking optimization problem which involvesdetermining the parameters of the PSM score function f(x)such that for every pair of target and decoy PSMs, the targetscores higher than the decoy (eq 2 in the SupportingInformation). Finally, q-values were assigned based on theranking induced by the peptide-spectrum match scores aspreviously described10 (eq 5 in the Supporting Information).We also compared the performance of existing algorithms:PeptideProphet, Percolator and Q-ranker. Q-ranker was
Journal of Proteome Research Article
dx.doi.org/10.1021/pr300234m | J. Proteome Res. 2012, 11, 4499−45084501

modified to take as input either the base or extended feature setfor peptide-spectrum matches.
3.2. Data Sets
We tested the extended feature representation for peptide-spectrum matches on four different sets of data (SupplementaryTable 2, Supporting Information). The first set, described inreference 7, consists of three S. cerevisiae yeast lysates digestedwith trypsin, chymotrypsin and elastase as well as a C. elegansworm lysate digested with trypsin and analyzed on an Orbitrapmass spectrometer. We refer to these four sets as YT, YC, YEand WT, respectively. The second set, described in reference14, contains six replicate runs of C. elegans lysate digested withtrypsin, acquired on a high resolution Orbitrap massspectrometer. We refer to these data sets as run1run6. Thethird set contains eight samples that represent a dilution curveof 48 known proteins synthesized by Sigma (see Supple-mentary Table 3). These data sets are mixtures (mix1−mix8 inSupplementary Table 2) of the C. elegans lysate at equalconcentrations and the 48 proteins that are diluted by a factorof 2 in each successive mix, with mix1 having the highestconcentration of 840 fmol of the synthesized proteins and mix8having the lowest concentration of 6 fmol (the concentrationsin all the eight data sets are listed in Supplementary Table 1).
Finally, to demonstrate the performance of our method on datasets analyzed by different collision-induced dissociationmethods, we use two C. elegans lysate data sets described inreference 15. The first data set (WHCD in the SupplementrayTable 2) was analyzed using a front-end higher energy collision-induced dissociation (fHCD), whereas the second data set(WCID in the Supplementray Table 2) was analyzed usingresonance excitation collision-induced dissociation(RE-CID).For all data sets, peptides were assigned to spectra by using
the Crux implementation of the SEQUEST algorithm.16 Thesearch was performed against a concatenated target-decoydatabase composed of open reading frames of the correspond-ing organism and their reversed or randomly shuffled versions,as specified below. All the searches were performed withoutvariable modifications, using a 3.0 Da precursor mass window,and requiring candidates peptides to have at least oneenzymatic terminus and no missed cleavages. The top threePSMs for each spectrum were retained for the analysis.
4. RESULTS
4.1. Ranking Results
We first compare the ranking performance using the base andextended feature sets on the three yeast data sets (YT, YC and
Figure 2. Comparison of base and extended feature sets. Number of unique target peptides identified as a function of q-value threshold for theranking algorithm using base and extended feature sets.
Figure 3. Comparison of base and extended feature sets on six replicate C. elegans data sets. (A) Number of unique target peptides identified in twoor more replicate data sets as a function of q-value threshold for the ranking algorithm using base and extended feature sets. (B) Average of absolutevalues of retention time differences (in minutes) of peptides identified in two or more replicate data sets as a function of number of peptides at thetop of the rank list.
Journal of Proteome Research Article
dx.doi.org/10.1021/pr300234m | J. Proteome Res. 2012, 11, 4499−45084502

YE) and one worm data set (WT). We use the linear model torepresent the peptide-spectrum match score function, and weoptimize a ranking loss function. Figure 2 shows that using theextended feature set leads to superior ranking performanceacross a wide range of q-value thresholds. SupplementaryFigure 1 (Supporting Information) computes the percentincrease in the number of identified target peptides when usingthe extended feature set over the base feature set. The percentincrease ranges from 10% to 40% over various q-valuethresholds on all four data sets analyzed.We further verify that this result is not dependent on the type
of the decoys used for the analysis. While Figure 2 andSupplementary Figure 1 (Supporting Information) showanalysis on the data sets in which decoys are represented bythe reversed peptide sequences, Supplementary Figure 2 showsthe same comparison on the data sets which represent decoysas randomly shuffled peptides sequences. Supplementary Figure3 verifies that the percent improvement due to using theextended feature set again ranges between 10 and 50% on datasets that used random peptide sequences as decoys.
4.2. Ranking on Six Replicate Worm Data Sets
Thus far, all of the comparisons we have presented arecontingent upon the target/decoy method for estimating q-
values. To control for potential bias in these estimates, wecarried out three additional validations that do not dependupon the q-value estimation procedure.The first of these three methods investigates the reprodu-
cibility of our identifications across replicate experiments. Weanalyze the six replicate C. elegans data sets (run1−run6), againusing either the base or the extended feature set representa-tions. For the analysis of these data sets, we use the linearmodel to represent the peptide-spectrum match score function,and we optimize a ranking loss function. Once optimization isperformed separately on all the six data sets, the peptides thatare identified in two or more data sets are combined into setsfor each q-value threshold.Figure 3A shows that, at a range of q-value thresholds, the
number of replicate peptides identified is higher when thepeptide-spectrum matches are represented by the extendedfeature set. Supplementary Figure 4 (Supporting Information)shows that the percent improvement due to the use of extendedfeature set ranges from 5 to 30% depending on the q-valuethreshold. The fact that the peptides were identified by at leasttwo out of the six experiments suggests increased confidence ofthese identifications, in comparison with those obtained by asingle experiment.
Figure 4. Percent of peptide-spectrum matches that were considered “high quality” by the Bullseye algorithm. Percent of “Bullseye hits” among thepeptide-spectrum matches identified using the extended feature set or base feature set as a function of number of peptide-spectrum matches at thetop of the ranked list in the six replicate runs.
Journal of Proteome Research Article
dx.doi.org/10.1021/pr300234m | J. Proteome Res. 2012, 11, 4499−45084503
4.3. Validation by Analyzing Retention Time Differences
The second orthogonal validation compares observed retentiontimes across replicate experiments. The absolute value of thedifferences in the retention times for the same peptideidentified in two or more runs should be small in comparisonto the range of the retention times of the peptides during theexperiments (from ∼0.1 to 99.5 min). For the purposes ofvalidation, we ranked peptides identified using the base andextended feature sets based on their scores and took peptidesets over a range of rank cut-offs to compute the absolute valuesof their retention time differences across runs. Figure 3B showsthat using the extended feature set results in comparabledifferences in retention times of the peptides identified at arange of rank cut-offs. The peptides identified using theextended feature set do not display unreasonably large
retention time differences in comparison with the differencesof all the identified peptides.
4.4. Validation by Matching Monoisotopic Mass ofPrecursor Spectra with Calculated Peptide Mass
Finally, we use an analysis of the precursor spectrum to furthervalidate our method. The precision with which the precursormass-to-charge of a given fragmentation spectrum can bespecified depends upon the precision of the isolation window ofthe instrument and is often not sufficient to determineaccurately the mass-to-charge ratio. The Bullseye software17 isdesigned to examine high-resolution Orbitrap data and assignan exact monoisotopic mass to each MS/MS spectrum. Thisinformation can serve as a basis for validation of the peptide-spectrum matches. On the one hand, the mass of the peptide inthe match can be calculated from its amino acid sequence; onthe other hand, the exact monoisotopic mass of the MS/MS
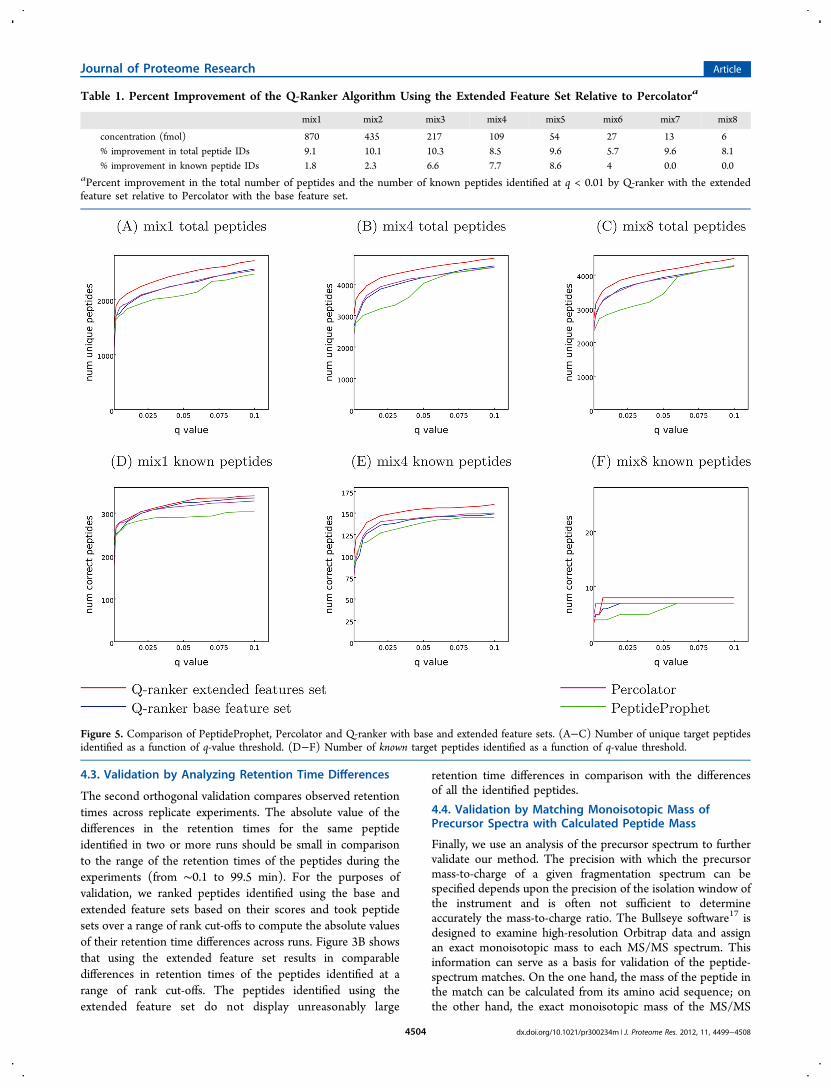
Table 1. Percent Improvement of the Q-Ranker Algorithm Using the Extended Feature Set Relative to Percolatora
mix1 mix2 mix3 mix4 mix5 mix6 mix7 mix8
concentration (fmol) 870 435 217 109 54 27 13 6% improvement in total peptide IDs 9.1 10.1 10.3 8.5 9.6 5.7 9.6 8.1% improvement in known peptide IDs 1.8 2.3 6.6 7.7 8.6 4 0.0 0.0
aPercent improvement in the total number of peptides and the number of known peptides identified at q < 0.01 by Q-ranker with the extendedfeature set relative to Percolator with the base feature set.
Figure 5. Comparison of PeptideProphet, Percolator and Q-ranker with base and extended feature sets. (A−C) Number of unique target peptidesidentified as a function of q-value threshold. (D−F) Number of known target peptides identified as a function of q-value threshold.
Journal of Proteome Research Article
dx.doi.org/10.1021/pr300234m | J. Proteome Res. 2012, 11, 4499−45084504
spectrum in the match can be assessed using the Bullseyesoftware. Ideally, these masses should be close. In this paper, weconsidered a peptide-spectrum match to be a “Bullseye hit” ifthe absolute value of the difference between the calculatedpeptide mass and the estimated precursor ion mass did notexceed 10 ppm.We used the Bullseye output to evaluate the peptide-
spectrum matches that are identified at various rank cut-offs inthe ranked lists produced using either extended or base featuresets. We subjected each of the six C. elegans data sets separatelyto Bullseye analysis and determined the peptide-spectrummatches that contained spectra of high enough quality toreceive an assignment of the monoisotopic precursor mass.Further, we calculated the mass of the peptides in thesematches based on the amino acid sequences and compared thispredicted mass with the estimates of the precursor ion massdetermined by the Bullseye.Figure 4 shows that, in all six replicate C. elegans data sets, the
analysis with the extended feature representation consistentlyresulted in a higher percentage of “Bullseye hits” among theidentified peptide-spectrum matches at the top of the rankedlist, in comparison to the peptide-spectrum matches identifiedusing the base feature set. The percent of hits among thepeptides identified at q-value less than 0.01 using the extendedfeature set ranged from 50 to 65%, whereas the percent of hitsamong the peptides identified at q-value 0.01 using the basefeature set ranged from 40 to 55% percent.
4.5. Comparison with Existing Algorithms
So far, we have investigated the performance of a simple linearmodel on the base and extended feature representation of thepeptide-spectrum matches. We now compare the performanceof the existing state-of-the-art algorithms PeptideProphet,3
Percolator7 and Q-ranker.8 While Percolator and Q-ranker bothuse the base feature set representation given in theSupplementary Table 1 (Supporting Information), we alsomodified Q-ranker to take the extended feature set as input,and we compared the resulting performance to that of the otheralgorithms.For these experiments, we use eight mixtures (mix1 to mix8
in Supplementary Table 2, Supporting Information) whichrepresent a dilution curve of 48 known synthesized proteins.These mixtures contain equal concentrations of C. elegans lysateand successive 2-fold dilutions of the 48 known proteins addedto it (concentrations in all the eight data sets are listed in Table1). The existence of known synthetic proteins in the mixturesallows us to check how many peptides belonging to theseproteins are identified, giving a measure of the sensitivity of theanalysis by the algorithms compared. Figure 5 presents theresults of this comparison on three out of the eight mixtures.Mix1 contains the highest concentration of 870 fmol of theknown proteins, mix4 represents one of the intermediatedilutions with concentration 109 fmol, and mix8 contains thelowest concentration of 6 fmol. The results on the other fivedata sets are found in the Supplementary Figure 5.Because these data sets consist of C. elegans lysate in addition
to the 48 known proteins, they contain many more peptidesthan those derived from the synthetic proteins. Therefore, wefirst compared the performance of PeptideProphet, Percolatorand Q-ranker using base or extended feature sets in terms ofthe overall number of unique peptides identified by thesealgorithms at a range of q-value thresholds. Figure 5A−C andSupplementary Figure 5A−C and G−H (Supporting Informa-
tion) show that the Q-ranker algorithm that uses the extendedfeature set consistently outperforms the other methods in termsof numbers of target peptide identifications. For example, itconsistently gives 8% to 10% improvement over Percolator atthe q-value threshold 0.01 on all the eight data sets (Table 1).Percolator and Q-ranker with the base feature set givecomparable results. PeptideProphet identifies fewer targetpeptides at low q-value thresholds, but gives comparable resultsto the other methods at high q-value thresholds.We then checked how many among all the target peptides
identified by each method belonged to the 48 syntheticproteins that were definitely present in the original mixture.Figure 5D−F and Supplementary Figure 5D−F and I−J(Supporting Information) show that for mix1 and mix2, whichcontain high concentrations of synthetic proteins, all fourmethods perform equally well on the task of identifyingpeptides belonging to these proteins. As the concentration ofthe known proteins decreases (mix3−mix5), using the extendedfeature set in the Q-ranker algorithm allowed it to identify morepeptides belonging to these proteins than the other threealgorithms. Q-ranker with the extended feature set showedfrom 6.6 to 8.6% improvement over Percolator in terms of thenumber of known peptide identifications at q-value threshold0.01 on these data sets (Table 1). Finally, all algorithmsperformed equally poorly on the mix6 to mix8, which containedthe lowest concentrations of the synthetic proteins.These results suggest that at sufficiently high concentrations
of proteins, the algorithms that do not adjust the peak heightparameters during the postprocessing step are still able tosuccessfully identify peptides belonging to these proteins. Asthe protein concentration decreases, the advantages of thecorrections to the original theoretical spectrum modelaccomplished by using the extended feature set become moresignificant. Finally, at low concentrations of proteins, thepeptides belonging to these proteins become increasinglychallenging to identify. However, the poor results on lowconcentration mixtures may arise due to sampling anddetection issues as much as due to informatics. It is likelythat at these low concentrations peptides are not detected at allor do not trigger an MS2 scan.
4.6. Examining the Parameter Values Associated with theTheoretical Spectrum Peaks
Because the XCorr score is parametrized in terms of the peakheights of the ions in the theoretical spectrum, we can askwhether the parameters learned during optimization corre-spond to the peak heights of the experimental spectra. Weannotated the peak heights of the spectra contained in the high-confidence peptide-spectrum matches that were identified at q-value ≤0.01 in the three yeast data sets and one worm data setexamined earlier. However, the comparison between theseannotated peak heights and peak heights predicted based onthe parameters of the XCorr-score revealed very littlecorrespondence (results not shown).The lack of correspondence between the estimated
parameter values and the empirical peak heights can beexplained by the fact the we are working in the discriminativerather than generative setting. While generative models aretrained specifically to learn accurate peak height rangescharacterizing different ion types, discriminative models aretrained to give optimal performance on a classification or aranking task. Because there may be correlations among the peakheights as well as correlation of the peak heights with other
Journal of Proteome Research Article
dx.doi.org/10.1021/pr300234m | J. Proteome Res. 2012, 11, 4499−45084505
features of the peptide-spectrum match representation, theoptimal parameters for a discriminative task may not accuratelyreflect the peak heights in the experimental data.Despite this caveat, we found that for the majority of the data
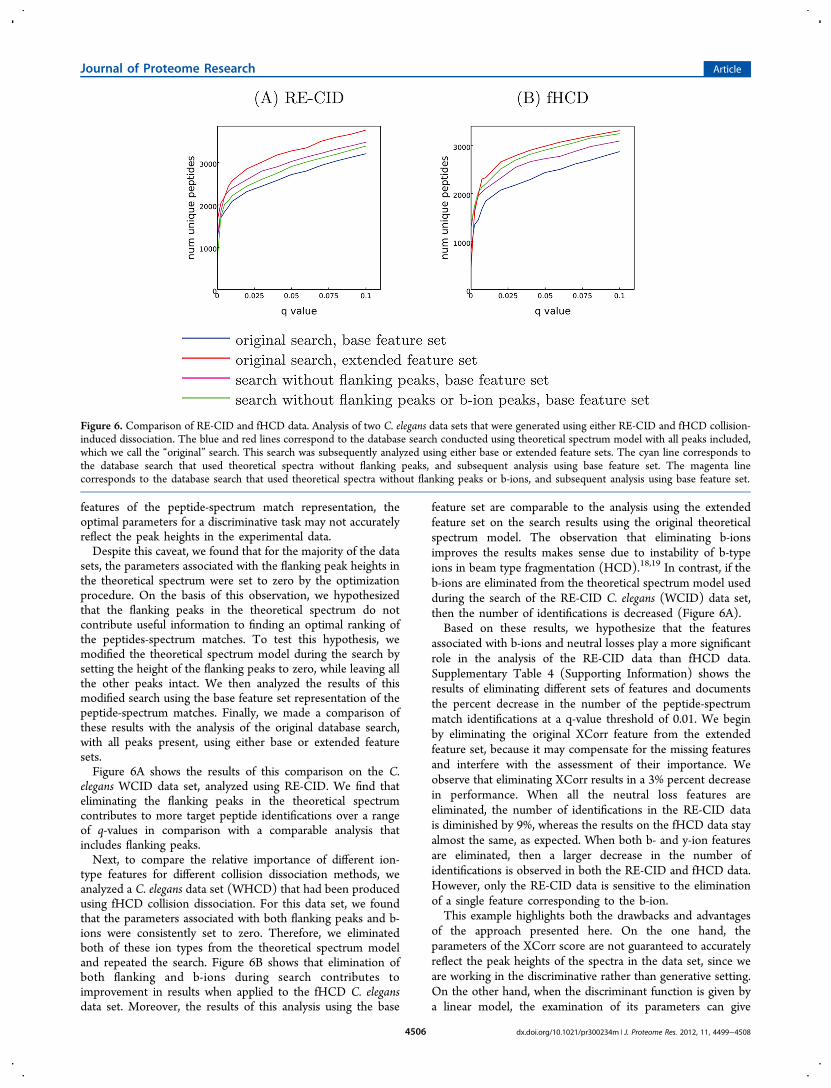
sets, the parameters associated with the flanking peak heights inthe theoretical spectrum were set to zero by the optimizationprocedure. On the basis of this observation, we hypothesizedthat the flanking peaks in the theoretical spectrum do notcontribute useful information to finding an optimal ranking ofthe peptides-spectrum matches. To test this hypothesis, wemodified the theoretical spectrum model during the search bysetting the height of the flanking peaks to zero, while leaving allthe other peaks intact. We then analyzed the results of thismodified search using the base feature set representation of thepeptide-spectrum matches. Finally, we made a comparison ofthese results with the analysis of the original database search,with all peaks present, using either base or extended featuresets.Figure 6A shows the results of this comparison on the C.
elegans WCID data set, analyzed using RE-CID. We find thateliminating the flanking peaks in the theoretical spectrumcontributes to more target peptide identifications over a rangeof q-values in comparison with a comparable analysis thatincludes flanking peaks.Next, to compare the relative importance of different ion-
type features for different collision dissociation methods, weanalyzed a C. elegans data set (WHCD) that had been producedusing fHCD collision dissociation. For this data set, we foundthat the parameters associated with both flanking peaks and b-ions were consistently set to zero. Therefore, we eliminatedboth of these ion types from the theoretical spectrum modeland repeated the search. Figure 6B shows that elimination ofboth flanking and b-ions during search contributes toimprovement in results when applied to the fHCD C. elegansdata set. Moreover, the results of this analysis using the base
feature set are comparable to the analysis using the extendedfeature set on the search results using the original theoreticalspectrum model. The observation that eliminating b-ionsimproves the results makes sense due to instability of b-typeions in beam type fragmentation (HCD).18,19 In contrast, if theb-ions are eliminated from the theoretical spectrum model usedduring the search of the RE-CID C. elegans (WCID) data set,then the number of identifications is decreased (Figure 6A).Based on these results, we hypothesize that the features
associated with b-ions and neutral losses play a more significantrole in the analysis of the RE-CID data than fHCD data.Supplementary Table 4 (Supporting Information) shows theresults of eliminating different sets of features and documentsthe percent decrease in the number of the peptide-spectrummatch identifications at a q-value threshold of 0.01. We beginby eliminating the original XCorr feature from the extendedfeature set, because it may compensate for the missing featuresand interfere with the assessment of their importance. Weobserve that eliminating XCorr results in a 3% percent decreasein performance. When all the neutral loss features areeliminated, the number of identifications in the RE-CID datais diminished by 9%, whereas the results on the fHCD data stayalmost the same, as expected. When both b- and y-ion featuresare eliminated, then a larger decrease in the number ofidentifications is observed in both the RE-CID and fHCD data.However, only the RE-CID data is sensitive to the eliminationof a single feature corresponding to the b-ion.This example highlights both the drawbacks and advantages
of the approach presented here. On the one hand, theparameters of the XCorr score are not guaranteed to accuratelyreflect the peak heights of the spectra in the data set, since weare working in the discriminative rather than generative setting.On the other hand, when the discriminant function is given bya linear model, the examination of its parameters can give
Figure 6. Comparison of RE-CID and fHCD data. Analysis of two C. elegans data sets that were generated using either RE-CID and fHCD collision-induced dissociation. The blue and red lines correspond to the database search conducted using theoretical spectrum model with all peaks included,which we call the “original” search. This search was subsequently analyzed using either base or extended feature sets. The cyan line corresponds tothe database search that used theoretical spectra without flanking peaks, and subsequent analysis using base feature set. The magenta linecorresponds to the database search that used theoretical spectra without flanking peaks or b-ions, and subsequent analysis using base feature set.
Journal of Proteome Research Article
dx.doi.org/10.1021/pr300234m | J. Proteome Res. 2012, 11, 4499−45084506

insights into the usefulness of various features for thediscriminative task being addressed.
5. DISCUSSIONWhile numerous studies have been devoted to elucidation ofphysical and chemical mechanisms that control systematic peakintensity differences in the spectra produced by peptide ions,13
the peak heights in a spectrum produced by a given peptide arenotoriously hard to predict. Therefore, search engines that relyon generating theoretical spectra to represent peptides in thedatabase are often forced to make strong assumptions about thepeak heights in these spectra. In this work, we proposed amethod to relax these assumptions during postprocessing of thedatabase search results when the correctness of the matches isevaluated.This work focused on peptide-spectrum match feature
representations that include the SEQUEST XCorr. However,our approach is not dependent on the database search engine,since the method is applied during the postprocessing of thedatabase search results. Our approach only requires that thedatabase search produces a set of measures of the quality of thepeptide-spectrum matches that can be used as features to assignscores to these matches. This requirement is fulfilled by most ofthe widely used search engines, and the feature sets derivedfrom these searches have previously been combined withmachine learning techniques for match validation. For example,the Percolator algorithm, originally developed for two featuresets derived from SEQUEST and InsPecT,20 was later adoptedto serve as evaluation tool for the matches produced byMascot21 as well. The peptide-spectrum match featurerepresentation of Mascot Percolator replaces the XCorr scorewith the Mascot score and includes measures of the quality ofthe spectra and matches similar to the SEQUEST-derived set.22
Any such feature set can be augmented with additional cross-correlation-based features, which can be calculated completelyindependently of the database search itself, as long as thepeptide-spectrum matches are available. One of the possibleadvantages is that the information not used by the searchengine due to time and efficiency constraints can bereintroduced during the subsequent analysis. For example, X!Tandem23 also uses a linear operator as a similarity measurebetween the observed and theoretical spectrum. It computes adot product between the observed and theoretical spectrum,multiplied by the factorials of the numbers of b- and y- ions:Nb!Ny!Σi = 1
n siti. While this model can be factorized itself, it doesnot contain information about neutral losses of CO, water andammonia. This extra information can be added in the form ofcross-correlation-based features during the evaluation of thepeptide-spectrum matches, as described in this paper. Thecomputation of dot product or cross correlation between theobserved spectrum and all the theoretical subspectra (as inFigure 1 and eqs 5 and 6) in the postprocessing setting issignificantly less time-consuming, since it has to be done onlyfor a single peptide in the peptide-spectrum match, in contrastto multiple peptides during the database search.However, not every database search algorithm employs linear
operators to measure similarity between observed andtheoretical spectra. The peptide-spectrum match featurerepresentations derived from such searches can still beaugmented by the decompositions described here, since theycan be computed completely independently of the searchengine. The advantage in this setting is that matching scoresfrom different search enginesthat is, the score used by the
database search itself and the SEQUEST XCorr-based scoresgenerated during the postprocessing, as described in thepapercan be combined during the statistical evaluation of thequality of the matches.The approach presented here is flexible and can be easily
extended to other representations of the theoretical spectrumand similarity scores between spectra. For example, thetheoretical spectrum generation can be extended to morecomplicated models, which could include separate sets ofparameters for each charge state or could take into accountcharacteristics that depend on the precursor mass, the peptidelength, the peptide hydrophobicity, etc. Furthermore, thisapproach could be used by any method that employs linearoperators to estimate similarity between two spectra. TheXCorr score is a special case of a general linear operator y′Wx,where y is a theoretical spectrum, x is the experimentalspectrum and W is a weight matrix. The matrix W for theXCorr score has 1s on the diagonal and −1/150 for all theother entries. The parametrization of the theoretical spectrumpresented in this paper could be used by any method thatemploys an operator of this form with different entries of thematrix W to estimate similarity between spectra.
■ ASSOCIATED CONTENT*S Supporting Information
Supplementary methods, tables, and figures. This material isavailable free of charge via the Internet at http://pubs.acs.org.
■ AUTHOR INFORMATIONCorresponding Author
*E-mail: [email protected]. Tel.: 1 206 221-4973. Fax: 1206 685-7301.Notes
The authors declare no competing financial interest.
■ ACKNOWLEDGMENTSThis work was funded by NIH awards R01 GM096306 and P41GM103533.
■ REFERENCES(1) Nesvizhskii, A. I.; Vitek, O.; Aebersold, R. Analysis and validationof proteomic data generated by tandem mass spectrometry. Nat.Methods 2007, 4 (10), 787−797.(2) Eng, J. K.; McCormack, A. L.; Yates, J. R., III An approach tocorrelate tandem mass spectral data of peptides with amino acidsequences in a protein database. J. Am. Soc. Mass Spectrom. 1994, 5,976−989.(3) Keller, A.; Nesvizhskii, A. I.; Kolker, E.; Aebersold, R. Empiricalstatistical model to estimate the accuracy of peptide identificationmade by MS/MS and database search. Anal. Chem. 2002, 74, 5383−5392.(4) Choi, H.; Nesvizhskii, A. I. Semisupervised model-basedvalidation of peptide identifications in mass spectrometry-basedproteomics. J. Proteome Res. 2008, 7 (1), 254−265.(5) Ding, Y.; Choi, H.; Nesvizhskii, A. Adaptive discriminant functionanalysis and reranking of MS/MS database search results for improvedpeptide identification in shotgun proteomics. J. Proteome Res. 2008, 7(11), 4878−4889.(6) Ma, Z.-Q.; Dasari, S.; Chambers, M. C.; Litton, M.; Sobecki, S.M.; Zimmerman, L.; Halvey, P. J.; Schilling, B.; Drake, P. M.; Gibson,B. W.; Tabb, D. L. IDPicker 2.0: Improved protein assembly with highdiscrimination peptide identification filtering. J. Proteome Res. 2009, 8(8), 3872−3881.
Journal of Proteome Research Article
dx.doi.org/10.1021/pr300234m | J. Proteome Res. 2012, 11, 4499−45084507
(7) Kal̈l, L.; Canterbury, J.; Weston, J.; Noble, W. S.; MacCoss, M. J.A semi-supervised machine learning technique for peptide identi-fication from shotgun proteomics datasets. Nat. Methods 2007, 4,923−25.(8) Spivak, M.; Weston, J.; Bottou, L.; Kal̈l, L.; Noble, W. S.Improvements to the Percolator algorithm for peptide identificationfrom shotgun proteomics data sets. J. Proteome Res. 2009, 8 (7), 3737−3745.(9) Kal̈l, L.; Storey, J. D.; MacCoss, M. J.; Noble, W. S. Posteriorerror probabilities and false discovery rates: two sides of the same coin.J. Proteome Res. 2008, 7 (1), 40−44.(10) Kal̈l, L.; Storey, J. D.; MacCoss, M. J.; Noble, W. S. Assigningsignificance to peptides identified by tandem mass spectrometry usingdecoy databases. J. Proteome Res. 2008, 7 (1), 29−34.(11) Eng, J. K.; Searle, B. C.; Clauser, K. R.; Tabb, D. L. A face in thecrowd: recognizing peptides through database search. Mol. Cell.Proteomics 2011, 10 (11), R111.009522.(12) Eng, J. K.; Fischer, B.; Grossman, J.; MacCoss., M. J. A fastSEQUEST cross correlation algorithm. J. Proteome Res. 2008, 7 (10),4598−4602.(13) Barton, S. J.; Whittaker, J. C. Review of factors that inflence theabundance of ions produced in a tandem mass spectrometer andstatistical methods for discovering these factors. Mass Spectrom. Rev.2009, 28, 177−187.(14) Hoopmann, M. R.; Merrihew, G. E.; von Haller, P. D.;MacCoss, M. J. Post analysis data acquisition for the iterative MS/MSsampling of proteomics mixtures. J. Proteome Res. 2009, 8 (4), 1870−1875.(15) Bereman, M. S.; Cantabery, J. D.; Egertson, J. D.; Horner, J.;Remes, P. M.; Schwartz, J.; Zabrouskov, V.; MacCoss, M. J. Evaluationof front-end higher energy collision induced dissociation on a bench-top dual pressure linear ion trap mass spectrometer for shotgunproteomics. Anal. Chem. 2012, 84, 1533−1539.(16) Park, C. Y.; Klammer, A. A.; Kal̈l, L.; MacCoss, M. P.; Noble.,W. S. Rapid and accurate peptide identification from tandem massspectra. J. Proteome Res. 2008, 7 (7), 3022−3027.(17) Hsieh, E.; Hoopmann, M.; Maclean, B.; Maccoss, M.Comparison of database search strategies for high precursor massaccuracy MS/MS data. J. Proteome Res. 2010, 9 (2), 1138−1143.(18) Vachet, R. W.; Ray, K. L.; Glish, G. L. Origin of product ions inthe MS/MS spectra of peptides in a quadrupole ion trap. J. Am. Soc.Mass Spectrom. 1998, 9, 341−344.(19) Paizs, B.; Suhai, S. Fragmentation pathways of protonatedpeptides. Mass Spectrom. Rev. 2005, 24, 508−548.(20) Tanner, S.; Shu, H.; Frank, A.; Ling-Chi Wang, E.; Zandi, M.;Mumby, P. A.; Pevzner; Bafna, V. InsPecT: Identification ofposttranslationally modified peptides from tandem mass spectra.Anal. Chem. 2005, 77, 4626−4639.(21) Perkins, D. N.; Pappin, D. J. C.; Creasy, D. M.; Cottrell, J. S.Probability-based protein identification by searching sequence data-bases using mass spectrometry data. Electrophoresis 1999, 20, 3551−3567.(22) Brosch, M.; Yu, L.; Hubbard, T.; Choudhary, J. Accurate andsensitive peptide identification with Mascot Percolator. J. Proteome Res.2009, 8 (6), 3176−3181.(23) Craig, R.; Beavis, R. C. Tandem: matching proteins with tandemmass spectra. Bioinformatics 2004, 20, 1466−1467.
Journal of Proteome Research Article
dx.doi.org/10.1021/pr300234m | J. Proteome Res. 2012, 11, 4499−45084508