learning semantic and visual similarity for endomicroscopy ... · 1 learning semantic and visual...
TRANSCRIPT

1
Learning Semantic and Visual Similarity
for Endomicroscopy Video RetrievalBarbara André, Tom Vercauteren, Anna M. Buchner, Michael B. Wallace, and Nicholas Ayache
Abstract—Content-Based Image Retrieval (CBIR) is a valuablecomputer vision technique which is increasingly being appliedin the medical community for diagnosis support. However,traditional CBIR systems only deliver visual outputs, i.e. imageshaving a similar appearance to the query, which is not directlyinterpretable by the physicians. Our objective is to provide asystem for endomicroscopy video retrieval which delivers bothvisual and semantic outputs that are consistent with each other.In a previous study, we developed an adapted bag-of-visual-words method for endomicroscopy retrieval, called “Dense-Sift”,that computes a visual signature for each video. In this study,we present a novel approach to complement visual similaritylearning with semantic knowledge extraction, in the field of in vivo
endomicroscopy. We first leverage a semantic ground truth basedon 8 binary concepts, in order to transform these visual signaturesinto semantic signatures that reflect how much the presenceof each semantic concept is expressed by the visual wordsdescribing the videos. Using cross-validation, we demonstratethat, in terms of semantic detection, our intuitive Fisher-basedmethod transforming visual-word histograms into semantic esti-mations outperforms Support Vector Machine (SVM) methodswith statistical significance. In a second step, we propose toimprove retrieval relevance by learning an adjusted similaritydistance from a perceived similarity ground truth. As a result,our distance learning method allows to statistically improve thecorrelation with the perceived similarity. We also demonstratethat, in terms of perceived similarity, the recall performance ofthe semantic signatures is close to that of visual signatures andsignificantly better than those of several state-of-the-art CBIRmethods. The semantic signatures are thus able to communicatehigh-level medical knowledge while being consistent with thelow-level visual signatures and much shorter than them. In ourresulting retrieval system, we decide to use visual signaturesfor perceived similarity learning and retrieval, and semantic
signatures for the output of an additional information, expressedin the endoscopist own language, which provides a relevantsemantic translation of the visual retrieval outputs.
Index Terms—Content-Based Image Retrieval, Bag-of-Visual-Words, Semantic and Visual Similarity, Similarity Learning,Semantic Gap, Endomicroscopy
I. INTRODUCTION
The Content-Based Image Retrieval (CBIR) techniques,
inherited from the computer vision field, have various medical
B. André and T. Vercauteren are with the company Mauna KeaTechnologies, Paris, France, E-mails: [email protected],[email protected]
A.M. Buchner is with the Hospital of the University of Pennsylvania,Philadelphia, US, E-mail: [email protected]
M.B. Wallace is with the Mayo Clinic of Jacksonville, Florida, US, E-mail:[email protected]
N. Ayache is with the Asclepios Research Team at INRIA - SophiaAntipolis, France, E-mail: [email protected]
Copyright (c) 2010 IEEE. Personal use of this material is permitted.However, permission to use this material for any other purposes must beobtained from the IEEE by sending a request to [email protected].
�
�
�
�
�
����� ������������
�� ����������� �����������������������
������������� �������
!�� �� "�����#�� $����� "�����
%��� ����&��'�(�"���)"� � $����
�� �������������� ����������� �������
����������������������������� �������
!�� �� "�����#�� $����� "�����
%��� ����&��'�(�"���)"� � $����
�� �������������� ����������� �������
����������������������������� �������
!�� �� "�����#�� $����� "�����
%��� ����&��'�(�"���)"� � $����
�� �������������� ����������� �������
����������������������������� �������
!�� �� "�����#�� $����� "�����
%��� ����&��'�(�"���)"� � $����
�� �������������� ����������� �������
����������������������������� �������
!�� �� "�����#�� $����� "�����
%��� ����&��'�(�"���)"� � $����
�� �������������� ����������� �������
����������������������������� �������
!�� �� "�����#�� $����� "�����
%��� ����&��'�(�"���)"� � $����
���$ ������*��������� ����+���������$ � �,
���$ ������*�����-���������� ����+���������$ � �,
���$ ������."�"������+����� � '����$ � �,
���$ ������*��������� ����+���������$ � �,
���$ ������."�"������+����� � '����$ � �,
���$ ������*�����-���������� ����+���������$ � �,
Fig. 1: Illustration of the semantic gap: content-based retrieval ofvisually similar pCLE videos having dissimilar semantic annotations.The 5 most similar pCLE videos are retrieved by the “Dense-Sift”method that only relies on visual features. The semantic conceptsannotated as present in a given video are underlined and set to 1,those annotated as absent are set to 0. For each video, the pathologicaldiagnosis, either malignant or non-malignant, is indicated below thesemantic concepts. For illustration purposes, videos are representedby mosaic images.
applications. Müller et al. [1] presented a benchmark for the
evaluation of multimodal CBIR methods on medical databases
according to the “ImageCLEF” medical image retrieval task
that includes heterogeneous medical images, from radiogra-
phy and electrocardiograms to histopathology. More recently,
a dense CBIR approach was proposed by Avni et al. [2]
2
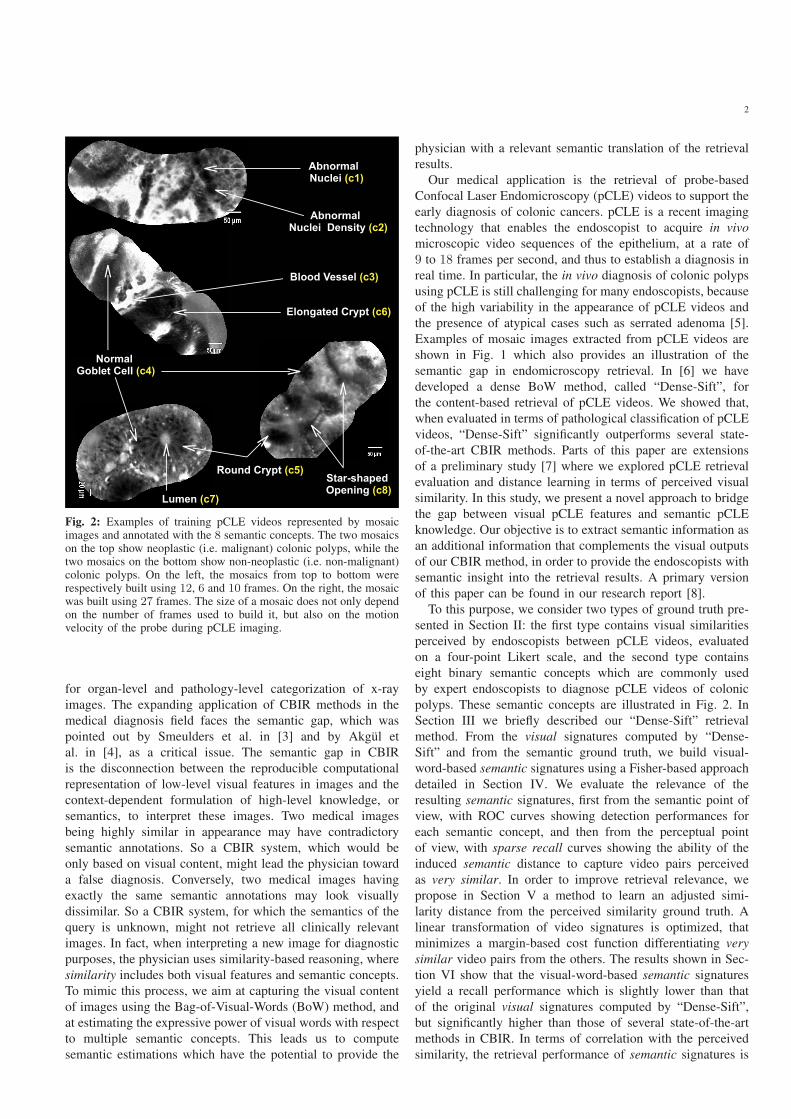
Fig. 2: Examples of training pCLE videos represented by mosaicimages and annotated with the 8 semantic concepts. The two mosaicson the top show neoplastic (i.e. malignant) colonic polyps, while thetwo mosaics on the bottom show non-neoplastic (i.e. non-malignant)colonic polyps. On the left, the mosaics from top to bottom wererespectively built using 12, 6 and 10 frames. On the right, the mosaicwas built using 27 frames. The size of a mosaic does not only dependon the number of frames used to build it, but also on the motionvelocity of the probe during pCLE imaging.
for organ-level and pathology-level categorization of x-ray
images. The expanding application of CBIR methods in the
medical diagnosis field faces the semantic gap, which was
pointed out by Smeulders et al. in [3] and by Akgül et
al. in [4], as a critical issue. The semantic gap in CBIR
is the disconnection between the reproducible computational
representation of low-level visual features in images and the
context-dependent formulation of high-level knowledge, or
semantics, to interpret these images. Two medical images
being highly similar in appearance may have contradictory
semantic annotations. So a CBIR system, which would be
only based on visual content, might lead the physician toward
a false diagnosis. Conversely, two medical images having
exactly the same semantic annotations may look visually
dissimilar. So a CBIR system, for which the semantics of the
query is unknown, might not retrieve all clinically relevant
images. In fact, when interpreting a new image for diagnostic
purposes, the physician uses similarity-based reasoning, where
similarity includes both visual features and semantic concepts.
To mimic this process, we aim at capturing the visual content
of images using the Bag-of-Visual-Words (BoW) method, and
at estimating the expressive power of visual words with respect
to multiple semantic concepts. This leads us to compute
semantic estimations which have the potential to provide the
physician with a relevant semantic translation of the retrieval
results.
Our medical application is the retrieval of probe-based
Confocal Laser Endomicroscopy (pCLE) videos to support the
early diagnosis of colonic cancers. pCLE is a recent imaging
technology that enables the endoscopist to acquire in vivo
microscopic video sequences of the epithelium, at a rate of
9 to 18 frames per second, and thus to establish a diagnosis in
real time. In particular, the in vivo diagnosis of colonic polyps
using pCLE is still challenging for many endoscopists, because
of the high variability in the appearance of pCLE videos and
the presence of atypical cases such as serrated adenoma [5].
Examples of mosaic images extracted from pCLE videos are
shown in Fig. 1 which also provides an illustration of the
semantic gap in endomicroscopy retrieval. In [6] we have
developed a dense BoW method, called “Dense-Sift”, for
the content-based retrieval of pCLE videos. We showed that,
when evaluated in terms of pathological classification of pCLE
videos, “Dense-Sift” significantly outperforms several state-
of-the-art CBIR methods. Parts of this paper are extensions
of a preliminary study [7] where we explored pCLE retrieval
evaluation and distance learning in terms of perceived visual
similarity. In this study, we present a novel approach to bridge
the gap between visual pCLE features and semantic pCLE
knowledge. Our objective is to extract semantic information as
an additional information that complements the visual outputs
of our CBIR method, in order to provide the endoscopists with
semantic insight into the retrieval results. A primary version
of this paper can be found in our research report [8].
To this purpose, we consider two types of ground truth pre-
sented in Section II: the first type contains visual similarities
perceived by endoscopists between pCLE videos, evaluated
on a four-point Likert scale, and the second type contains
eight binary semantic concepts which are commonly used
by expert endoscopists to diagnose pCLE videos of colonic
polyps. These semantic concepts are illustrated in Fig. 2. In
Section III we briefly described our “Dense-Sift” retrieval
method. From the visual signatures computed by “Dense-
Sift” and from the semantic ground truth, we build visual-
word-based semantic signatures using a Fisher-based approach
detailed in Section IV. We evaluate the relevance of the
resulting semantic signatures, first from the semantic point of
view, with ROC curves showing detection performances for
each semantic concept, and then from the perceptual point
of view, with sparse recall curves showing the ability of the
induced semantic distance to capture video pairs perceived
as very similar. In order to improve retrieval relevance, we
propose in Section V a method to learn an adjusted simi-
larity distance from the perceived similarity ground truth. A
linear transformation of video signatures is optimized, that
minimizes a margin-based cost function differentiating very
similar video pairs from the others. The results shown in Sec-
tion VI show that the visual-word-based semantic signatures
yield a recall performance which is slightly lower than that
of the original visual signatures computed by “Dense-Sift”,
but significantly higher than those of several state-of-the-art
methods in CBIR. In terms of correlation with the perceived
similarity, the retrieval performance of semantic signatures is

3
Fig. 3: Schematic outline of the online “Visual Similarity Scoring” tool showing the example of a scoring process, where 3 video couples(I0, I1), (I0, I2) and (I0, I3) are proposed. Each video is summarized by a set of mosaic images, two of which are shown here as anexample.
better, with statistical significance, than those of the state-of-
the-art methods, and comparable to that of the original visual
signatures. For both semantic signatures and visual signatures,
the distance learning method allows to improve, with statistical
significance, the correlation with the perceived similarity. Our
resulting pCLE retrieval system, of which visual and semantic
outputs are consistent with each other, should better assist the
endoscopist in establishing a pCLE diagnosis.
II. GROUND TRUTH FOR PERCEIVED VISUAL SIMILARITY
AND FOR SEMANTICS
A. pCLE database
Our video database contains 118 pCLE videos of colonic
polyps that were acquired from 66 patients for the study of
Buchner et al. [9]. The lengths of the acquired pCLE videos
range from 1 second to 4 minutes, depending on the time
spent to image the lesion of interest. All the patients underwent
a surveillance colonoscopy with pCLE for fluorescein-aided
imaging of suspicious colonic polyps before their removal. For
each patient, pCLE was performed of each detected polyp with
one video corresponding to each particular polyp. All polyps
were removed and evaluated by a pathologist to establish the
“gold standard” diagnosis.
During the colonoscopy procedures the pCLE miniprobe
was in constant contact with the epithelium, so the viewpoint
changes between the images of stable pCLE video sequences
are mostly in-plane rotations and translations. For this reason,
we can represent any pCLE video as a set of mosaic images
built with the video-mosaicing technique of Vercauteren et al.
[10], each mosaic image corresponding to a stable subsequence
of the video. pCLE mosaic images will not only be used as
input for our retrieval system, but also as retrieval output
attached to the extracted similar videos. Indeed, Dabizzi et
al. [11] recently showed that pCLE mosaics have the potential
to replace pCLE videos for a comparable diagnosis accuracy
and a significantly shorter interpretation time.
B. Ground Truth for Perceived Visual Similarity
To generate a pairwise similarity ground truth between
pCLE videos, we designed an online survey tool, called
VSS [12], that allows multiple observers, who are fully
blinded to the video metadata such as the pCLE diagnosis,
to qualitatively estimate the perceived visual similarity degree
between videos. The VSS tool proposes, for each video
couple, the following four-point Likert scale: very dissimilar,
rather dissimilar, rather similar and very similar. Because
interpreting whole video sequences is time consuming, the
VSS supports this task by making available both the whole
video content and for each video, its set of static mosaic
images providing a visual summary. Each scoring process, as
illustrated in Fig. 3, is characterized by the random drawing
of 3 video couples (I0, I1), (I0, I2) and (I0, I3), where the
candidate videos I1, I2 and I3 belong to patients that are
different from the patient of the reference video I0, in order to
exclude any patient-related biases. 17 observers, ranging from
middle expert to expert in pCLE diagnosis, performed as many
scoring processes as they could. Our generated ground truth
can be represented as a weighted oriented graph G = (V,E)where the nodes in V are the videos and where each couple
of videos may be connected by zero, one or several edges in
E weighted by the similarity scores. As less than 2% of these
video couples were scored by more than 2 distinct observers, it
was not relevant to measure inter-observer variability. In total,
4, 836 similarity scores were given for 2, 178 distinct video
couples. Thus 16.2% of all 13, 434 distinct video couples
were scored. Compared to our preliminary study [7] where
14.5% of all possible video couples were scored, the perceived
similarity ground truth was enriched for this study in order to
better differentiate potentially very similar video pairs from
4
the others, a goal which is closer to our retrieval purpose.
If the video couples were randomly drawn with a uniform
non-informative prior by the VSS tool, we would have drawn
many more video pairs perceived as dissimilar than video pairs
perceived as very similar. The resulting perceived similarity
ground truth would have been too far from our clinical
application which aims at extracting highly visually similar
videos. For this reason, we use the a priori similarity distance
dVis computed by the “Dense-Sift” method to enable two
modes for the drawing of video pairs: in the first mode, video
pairs with different perceived similarities are equally likely
to be drawn; in the second mode, video pairs perceived as
very similar are more likely to be drawn. Using this a priori
distance can deliver a slight bias in the VSS process, however
it is an efficient solution to increase the number of very similar
video pairs.
More precisely, in the first mode, the probability of drawing
a video couple (Ii, Ij) is proportional to the inverse of the
density of dprior(Ii, Ij). In the second mode, the video Ij is
one of the 5 nearest neighbors of the video Ii according to
the retrieval distance dVis. A total of 3, 801 similarity scores
was recorded with the first mode, and 1, 035 with the second
mode.
Although the resulting similarity graph remains very sparse,
we will show in Section VI that it constitutes a valuable
ground-truth database for retrieval evaluation and for perceived
similarity learning.
C. Ground Truth for Semantic Concepts
All the acquired pCLE videos were manually annotated with
M = 8 binary semantic concepts that are illustrated on pCLE
mosaic images in Fig. 2. The eight semantic concepts were
defined by the endoscopists, who use them as main criteria
to diagnose the colonic polyps from pCLE videos. These se-
mantic concepts express a mid-level clinical knowledge, which
we consider as “high-level” clinical knowledge in contrast to
the low-level visual features. As pCLE images are rather new
for many endoscopists, the taxonomy of pCLE semantics is
still under construction. Although eight semantic concepts is
a relatively small number, it is a first necessary step for the
full understanding of the pathologies observed in pCLE videos.
In a given pCLE video, each semantic concept is defined as
either visible, potentially several times, or not visible at all in
the video. The first two concepts, abnormal nuclei (c1) and
abnormal nuclei density (c2), which are the most difficult to
identify, were annotated by two expert endoscopists. With the
support of the modified Mainz criteria identified by Kiesslich
et al. [13] six other concepts were annotated: blood vessel (c3),
normal goblet cell (c4), round crypt (c5), elongated crypt (c6),
lumen (c7) and star-shaped opening (c8). If the semantic jth
concept is visible in the video then cj = 1 else cj = 0. Table I
shows, for each semantic concept, the percentage of the videos
in the database where the concept is annotated as visible.
III. FROM PCLE VIDEOS TO VISUAL WORDS
Among the state-of-the-art methods in CBIR, the BoW
method of Zhang et al. [14], referred to as “HH-Sift”, is
Semantic Frequencyconcept
c1. abnormal nuclei 46.6 %
c2. abnormal nuclei density 63.6 %
c3. blood vessel 47.5 %
c4. normal goblet cell 72.0 %
c5. round crypt 47.5 %
c6. elongated crypt 64.4 %
c7. lumen 27.1 %
c8. star-shaped opening 18.6 %
TABLE I: Frequency of each semantic concept. The frequency ofeach semantic concept is measured by the percentage of the videosin the database where the concept is annotated as visible.
particularly successful for the retrieval of texture images in
computer vision. Whereas “HH-Sift” combines the sparse
“Harris-Hessian” detector with the SIFT descriptor, the “Tex-
tons” method proposed by Leung and Malik [15] is based on
a dense description of local texture features. Adjusting these
approaches for pCLE retrieval, we proposed in [6] the “Dense-
Sift” method with the following parameters: disk regions of
radius 60 pixels, a total of K = 100 visual words and dense
SIFT description of explicit mosaic images. In the field of
computer vision, the superiority of the dense SIFT descrip-
tor, compared to the standard sparse SIFT descriptor, was
demonstrated by Li and Perona for natural scene classification
in [16]. The image description performed by our “Dense-
Sift” method is invariant to in-plane rotations and in-plane
translations changes that are due to the motion of the pCLE
miniprobe, and to the affine illumination changes that are
due to the leakage of fluorescein used in pCLE. “Dense-Sift”
also enables the extension from pCLE image description to
pCLE video description by leveraging video mosaicing results.
As a result, “Dense-Sift” computes a visual word signature
SVis(I) = (wI1 , ..., w
IK) for each pCLE video I , where wI
k is
the frequency of the kth visual word in the video I . We define
the visual similarity distance dVis(I, J) between two videos Iand J as the χ2 pseudo-distance between their visual word
signatures computed by “Dense-Sift”:
dVis(I, J) = χ2(SVis(I),SVis(J))
=1
2
∑k∈{1,..,K},wI
kwJ
k>0
(wIk − wJ
k )2
wIk + wJ
k
(1)
The last CBIR method which we consider as a reference
is the “Haralick” [17] method based on global statistical
features. We use an extended Haralick method, provided by
Avinash Uppuluri in Matlab Central [18], that extracts 23texture features computed from the Gray Level Co-occurrence
Matrices (GLCM). The seminal method of Haralick consists of
extracting 13 global statistical features from the co-occurrence
matrix which is computed on the whole image at the first level
of adjacency. Other global descriptors have been proposed
more recently in the literature, such as the gist descriptor of
Oliva and Torralba [19].
Among the four state-of-the-art CBIR methods, “HH-Sift”,
“Textons”, “Dense-Sift” and “Haralick”, our “Dense-Sift”
method was proven in [6] to be the best method in terms of
5
pathological classification of pCLE videos. “Dense-Sift” will
also be proven to be the best method in terms of correlation
with the perceived visual similarity, as shown in Section VI.
For these reasons, we decided to build the semantic signatures
of pCLE videos from the visual signatures computed by
“Dense-Sift”.
IV. FROM VISUAL WORDS TO SEMANTIC SIGNATURES
Among the approaches in bridging the semantic gap, recent
methods based on random-walk processes on visual-semantic
graphs were proposed by Poblete et al. [20] and by Ma et
al. [21]. Latent semantic indexing approaches have also been
investigated, for example by Caicedo et al. [22] to improve
medical image retrieval. Rasiwasia et al. [23], [24] proposed
a probabilistic method which we consider as a reference
method for performing a semantic retrieval which is based on
visual features. In particular, their approach estimates for each
semantic concept the probability that, given a visual feature
vector in an image, the semantic concept is present in the
image. In [25], Kwitt et al. recently applied this method for
learning pit pattern concepts in endoscopic images of colonic
polyps. These pit pattern concepts at the macroscopic level
can be seen as corresponding to our semantic concepts at the
microscopic level. In order to learn semantic concepts from
visual words in endomicroscopic videos, we propose a rather
simple method providing satisfactory results. The application
of a probabilistic method such as the one in [23] on our
data was not successful, certainly because of our relatively
small sample size, but we plan to further investigate it. Our
proposed method is a Fisher-based approach that estimates the
expressive power of each of the K visual words with respect
to each of the M semantic concepts.
Let Dtrain be the set of training videos. Given the kth
visual word and the jth semantic concept, we estimate the
discriminative power of the kth visual word with respect to
the jth semantic concept using the signed Fisher criterion:
Fk,j =µ1(k, j)− µ0(k, j)
σ21(k, j) + σ2
0(k, j)(2)
where µp(k, j) (resp. σ2p(k, j)) is the mean (resp. the variance)
of {wIk, c
Ij = p, I ∈ Dtrain} with p = 0 or p = 1. We call F
the resulting matrix of Fisher’s weights. Given a video I with
the visual signature SVis(I) = (wI1 , ..., w
IK), we define the se-
mantic weight of I with respect to the jth semantic concept as
the following linear combination: sIj =∑K
k=1 Fk,jwIk. Thus,
the transformation from the visual signature SVis(I) into its
visual-word-based semantic signature SSem(I) = (sI1, ..., sIM )
is given by the equation:
SSem(I) = FTSVis(I) (3)
The signed value sIj reflects how much the presence of the jth
semantic concept is expressed by the visual words describing
the video I . Finally, a visual-word-based semantic similarity
distance between two videos I and J can be defined for
example using the L2 norm:
dSem(I, J) = ||SSem(I)− SSem(J)||L2 (4)
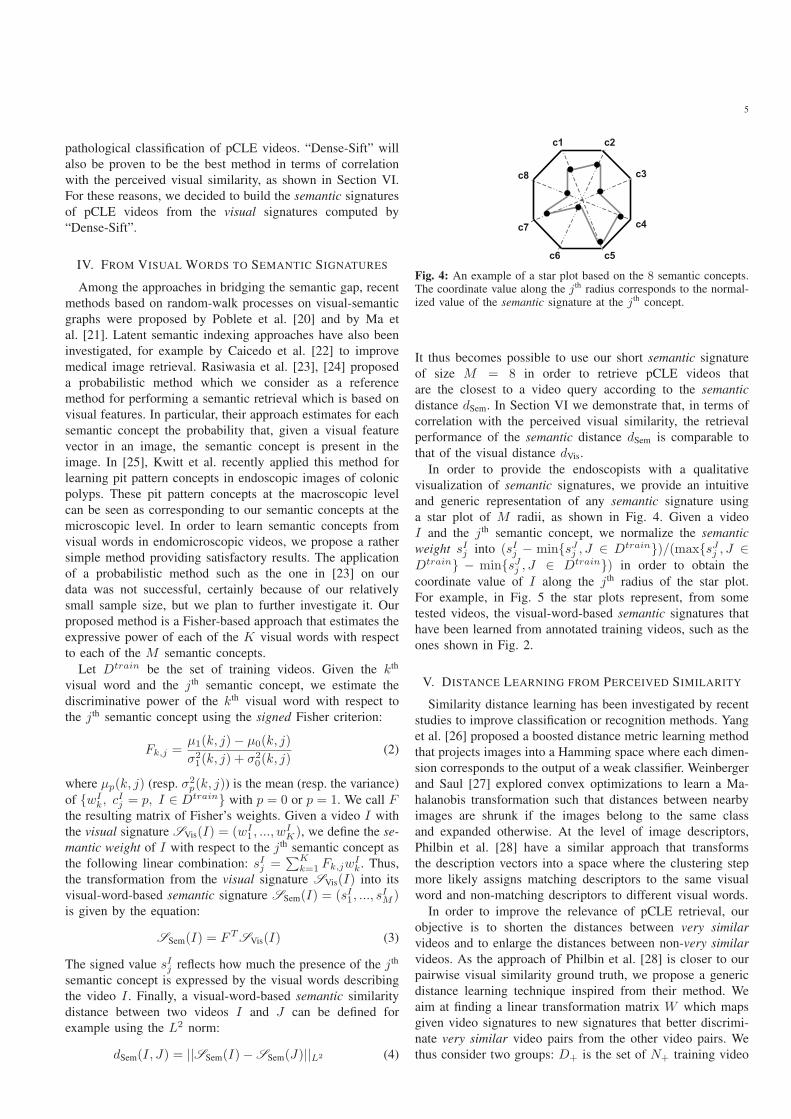
Fig. 4: An example of a star plot based on the 8 semantic concepts.The coordinate value along the j th radius corresponds to the normal-ized value of the semantic signature at the j th concept.
It thus becomes possible to use our short semantic signature
of size M = 8 in order to retrieve pCLE videos that
are the closest to a video query according to the semantic
distance dSem. In Section VI we demonstrate that, in terms of
correlation with the perceived visual similarity, the retrieval
performance of the semantic distance dSem is comparable to
that of the visual distance dVis.
In order to provide the endoscopists with a qualitative
visualization of semantic signatures, we provide an intuitive
and generic representation of any semantic signature using
a star plot of M radii, as shown in Fig. 4. Given a video
I and the jth semantic concept, we normalize the semantic
weight sIj into (sIj − min{sJj , J ∈ Dtrain})/(max{sJj , J ∈Dtrain} − min{sJj , J ∈ Dtrain}) in order to obtain the
coordinate value of I along the jth radius of the star plot.
For example, in Fig. 5 the star plots represent, from some
tested videos, the visual-word-based semantic signatures that
have been learned from annotated training videos, such as the
ones shown in Fig. 2.
V. DISTANCE LEARNING FROM PERCEIVED SIMILARITY
Similarity distance learning has been investigated by recent
studies to improve classification or recognition methods. Yang
et al. [26] proposed a boosted distance metric learning method
that projects images into a Hamming space where each dimen-
sion corresponds to the output of a weak classifier. Weinberger
and Saul [27] explored convex optimizations to learn a Ma-
halanobis transformation such that distances between nearby
images are shrunk if the images belong to the same class
and expanded otherwise. At the level of image descriptors,
Philbin et al. [28] have a similar approach that transforms
the description vectors into a space where the clustering step
more likely assigns matching descriptors to the same visual
word and non-matching descriptors to different visual words.
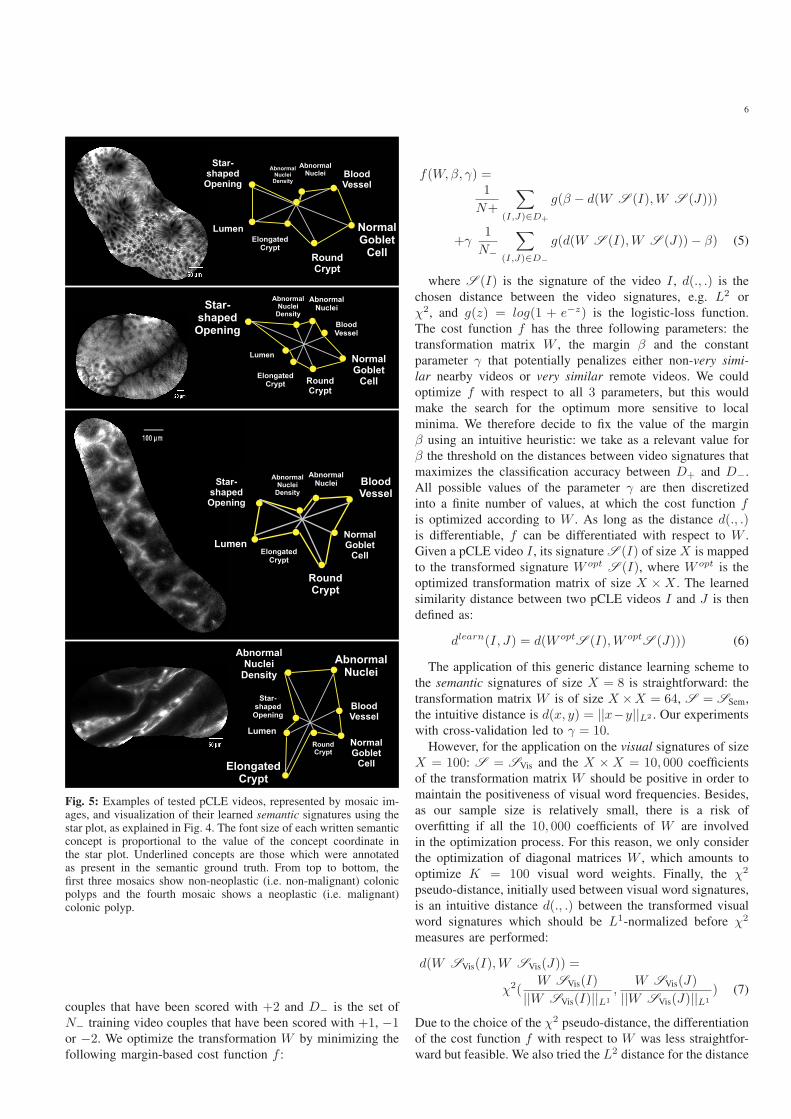
In order to improve the relevance of pCLE retrieval, our
objective is to shorten the distances between very similar
videos and to enlarge the distances between non-very similar
videos. As the approach of Philbin et al. [28] is closer to our
pairwise visual similarity ground truth, we propose a generic
distance learning technique inspired from their method. We
aim at finding a linear transformation matrix W which maps
given video signatures to new signatures that better discrimi-
nate very similar video pairs from the other video pairs. We
thus consider two groups: D+ is the set of N+ training video
6
Fig. 5: Examples of tested pCLE videos, represented by mosaic im-ages, and visualization of their learned semantic signatures using thestar plot, as explained in Fig. 4. The font size of each written semanticconcept is proportional to the value of the concept coordinate inthe star plot. Underlined concepts are those which were annotatedas present in the semantic ground truth. From top to bottom, thefirst three mosaics show non-neoplastic (i.e. non-malignant) colonicpolyps and the fourth mosaic shows a neoplastic (i.e. malignant)colonic polyp.
couples that have been scored with +2 and D− is the set of
N− training video couples that have been scored with +1, −1or −2. We optimize the transformation W by minimizing the
following margin-based cost function f :
f(W,β, γ) =1
N+
∑
(I,J)∈D+
g(β − d(W S (I),W S (J)))
+γ1
N−
∑
(I,J)∈D−
g(d(W S (I),W S (J))− β) (5)
where S (I) is the signature of the video I , d(., .) is the
chosen distance between the video signatures, e.g. L2 or
χ2, and g(z) = log(1 + e−z) is the logistic-loss function.
The cost function f has the three following parameters: the
transformation matrix W , the margin β and the constant
parameter γ that potentially penalizes either non-very simi-
lar nearby videos or very similar remote videos. We could
optimize f with respect to all 3 parameters, but this would
make the search for the optimum more sensitive to local
minima. We therefore decide to fix the value of the margin
β using an intuitive heuristic: we take as a relevant value for
β the threshold on the distances between video signatures that
maximizes the classification accuracy between D+ and D−.
All possible values of the parameter γ are then discretized
into a finite number of values, at which the cost function fis optimized according to W . As long as the distance d(., .)is differentiable, f can be differentiated with respect to W .
Given a pCLE video I , its signature S (I) of size X is mapped
to the transformed signature W opt S (I), where W opt is the
optimized transformation matrix of size X ×X . The learned
similarity distance between two pCLE videos I and J is then
defined as:
dlearn(I, J) = d(W optS (I),W opt
S (J))) (6)
The application of this generic distance learning scheme to
the semantic signatures of size X = 8 is straightforward: the
transformation matrix W is of size X ×X = 64, S = SSem,
the intuitive distance is d(x, y) = ||x−y||L2 . Our experiments
with cross-validation led to γ = 10.
However, for the application on the visual signatures of size
X = 100: S = SVis and the X × X = 10, 000 coefficients
of the transformation matrix W should be positive in order to
maintain the positiveness of visual word frequencies. Besides,
as our sample size is relatively small, there is a risk of
overfitting if all the 10, 000 coefficients of W are involved
in the optimization process. For this reason, we only consider
the optimization of diagonal matrices W , which amounts to
optimize K = 100 visual word weights. Finally, the χ2
pseudo-distance, initially used between visual word signatures,
is an intuitive distance d(., .) between the transformed visual
word signatures which should be L1-normalized before χ2
measures are performed:
d(W SVis(I),W SVis(J)) =
χ2(W SVis(I)
||W SVis(I)||L1
,W SVis(J)
||W SVis(J)||L1
) (7)
Due to the choice of the χ2 pseudo-distance, the differentiation
of the cost function f with respect to W was less straightfor-
ward but feasible. We also tried the L2 distance for the distance

7
1 11 21 31 41 51 61 71 81 91 101 111 1210
0.1
0.2
0.3
0.4
0.5
0.6
0.7
0.8
0.9
1
Number of neighbors
Spar
se R
ecal
l
L=2, Dense−Sift
L=2, Semantic
L=2, Textons
L=2, HH−Sift
L=2, Haralick
1 11 21 31 41 51 61 71 81 91 101 111 1210
0.1
0.2
0.3
0.4
0.5
0.6
0.7
0.8
0.9
1
Number of neighbors
Spar
se R
ecal
l
L>=1, DenseSift
L>=1, Semantic
L>=1, Textons
L>=1, HH−Sift
L>=1, Haralick
1 11 21 31 41 51 61 71 81 91 101 111 1210
0.1
0.2
0.3
0.4
0.5
0.6
0.7
0.8
0.9
1
Number of neighbors
Sp
arse
Rec
all
L=2, 30x3−Dense−Sift + Learn
L=2, 30x3−Dense−Sift
L=2, 30x3−Semantic + Learn
L=2, 30x3−Semantic
1 11 21 31 41 51 61 71 81 91 101 111 1210
0.1
0.2
0.3
0.4
0.5
0.6
0.7
0.8
0.9
1
Number of neighbors
Sp
arse
Rec
all
L>=1, 30x3−Dense−Sift + Learn
L>=1, 30x3−Dense−Sift
L>=1, 30x3−Semantic + Learn
L>=1, 30x3−Semantic
Fig. 6: Sparse recall curves associated with the retrieval methods in L-scored domains where L = +2 (left) or L >= 1 (right). For retrievalmethods using distance learning, each sparse recall curve is the median of the sparse recall curves computed with 30× 3 cross-validation.The recall curves associated with “Semantic” and “Semantic + Learn” are indirect indicators of the relevance of the semantic signature. Asexplained in in Section VI-D, the small performance loss observed with the semantic signature must not be interpreted as a rejection of themethod.
d(., .) but we did not retain it because the results were not as
good as with the χ2 pseudo-distance. Our experiments with
cross-validation for the visual signatures also led to γ = 10.
VI. EVALUATION AND RESULTS
A. Cross-validation
In order to exclude any learning bias, we used m× q-fold
cross-validation, i.e. m random partitions of the database into
q subsets. Each of these subsets is successively the testing
set and the union of the q − 1 others is the training set. To
exclude patient-related bias, all videos from the same patient
are in the same subset. Given our sparse ground truth for
perceived similarity, q must be not too large in order to have
enough similarity scores in each testing set, and not too small
to ensure enough similarity scores in the training set. For our
experiments, we performed m = 30 random partitions of our
pCLE video database into q = 3 subsets. When computing any
performance indicator, we will consider as a robust indicator
value the median of all the indicator values computed with
cross-validation.
B. Retrieval Evaluation Tools
Standard recall curves are a common means of evaluating
retrieval performance. However, because of the sparsity of
our perceived similarity ground truth, it is not possible to
compute them in our case. As an alternative, we define sparse
recall curves. At a fixed number n of nearest neighbors in the
complete video database, we define the sparse recall value
SR(n) of a retrieval method as the percentage of L-scored
video couples, with L = +2 or L >= 1, for which one of
8
the two videos has been retrieved by the method among the
n nearest neighbors of the other video:
SR(n) =
Card{(x, y) ∈ E | e(x, y) = L, x ∈ Vny or y ∈ Vn
x }
Card{(x, y) ∈ E | e(x, y) = L}(8)
where E are the edges of the sparse similarity graph G =(V,E), e(x, y) is the similarity score of the edge (x, y) and
Vnx is the n-neighborhood of the video x. The resulting sparse
recall curve, for example with L = +2, shows the ability
of the retrieval method to extract, among the first nearest
neighbors, videos that are perceived as very similar to the
video query.
The evaluation of a retrieval method against perceived
similarity ground truth can be qualitatively illustrated by four
superimposed histograms HL, L ∈ {−2,−1,+1,+2}. HL is
defined as the histogram of the similarity distances which were
computed by the retrieval method in the restricted domain of
all L-scored video couples, where L is one of the four Likert
points: very dissimilar (−2), rather dissimilar (−1), rather
similar (+1) and very similar (+2). The more separated these
four histograms are, the more likely the distance computed
by the retrieval method will be correlated with perceived
similarity ground truth. As a separability measure between
each pair of histograms, we use the Bhattacharyya distance
which is closely related to the Bayes error [29] and thus more
indicative of a probability of similarity between histograms
than the simple histogram intersection.
C. Evaluation of Semantic Concept Extraction
In order to evaluate, from the semantic point of view, our
visual-word-based semantic extraction method, we propose to
measure the detection performance of each of the M = 8semantic weights contained in the semantic signature. For the
jth semantic concept, we compute a ROC curve that shows the
matching performance of the learned semantic weight sj with
respect to the semantic ground truth cj . The obtained ROC
curves reflect how well the presence of semantic concepts can
be learned from the visual words.
Possible indicators of the correlation between the distance
computed by a retrieval method and the perceived simi-
larity ground truth are Pearson correlation π, Spearman ρand Kendall τ . Compared to Pearson π which measures
linear dependence based on the data values, Spearman ρand Kendall τ are better adapted to the psychometric Likert
scale because they measure monotone dependence based on
the data ranks [30]. Kendall τ is less commonly used than
Spearman ρ but its interpretation in terms of probabilities
is more intuitive. To assess statistical significance for the
comparison between two correlation coefficients associated
with two retrieval methods, we have to perform the adequate
statistical test. First, ground-truth data on the four-point Likert
scale are characterized by a non-normal distribution, so data
ranks should be used instead of data values. Second, the
rank correlation coefficients measured for two methods are
themselves correlated because they both depend on the same
ground-truth data. For these reasons, we decide to perform
Steiger’s Z-tests, as recommended by Meng et al. [31], and
we apply it to Kendall τ .
D. Results and Discussions
For our experiments, we compared the retrieval perfor-
mances of “Dense-Sift” with those of “HH-Sift”, “Haralick”
and “Textons” presented in Section III which are considered
as state-of-the-art in CBIR. We call “Semantic” the visual-
word-based semantic retrieval method, “30x3-Semantic” the
same method with 30 × 3 cross-validation and “30x3-
Dense-Sift” the “Dense-Sift” with 30 × 3 cross-validation.
“30x3-Semantic+Learn” (resp. “30x3-Semantic+Learn”) is
the “30x3-Semantic” method (resp. “30x3-Dense-Sift+Learn”
method) improved with distance learning.
In terms of sparse recall performances, we observe in
Fig. 6 that the retrieval methods from best to worst are:
“Dense-Sift+Learn”, “Dense-Sift”, “Semantic+Learn”, “Se-
mantic”, “Textons”, “HH-Sift” and “Haralick”. According to
the recall associated with L = +2, our “Dense-Sift” method
based on the visual signatures is able to capture, within the 10first neighbors, more than 70% of the video couples perceived
as “very similar”, which is quite encouraging for our retrieval
application. We also observe that perceived similarity distance
learning allows to slightly improve recall performance. The
fact that “Dense-Sift” outperforms “Semantic” in terms of
recall performance, before and after distance learning, is due to
the drastic dimensionality reduction which was performed by
our Fisher-based transformation, from K = 100 visual words
to M = 8 semantic concepts. Indeed, semantic signatures
seem to be too short to discriminate very similar video pairs as
well as visual signatures. Although the recall results based on
semantic signatures are not as good as those based on visual
signatures, the curve of semantic signatures is much closer
to the curve of visual signatures than the curves of state-
of-the-art methods. We can therefore be rather confident in
the fact that the semantic signatures are informative. Sparse
recall is only a means to evaluate the relevance of the semantic
signatures. Ultimately, we want to base the retrieval of pCLE
videos on visual content and not on semantic annotations,
otherwise the retrieval system might retrieve videos that are
semantically related but not similar in appearance, in which
case the physician might lose trust in the retrieval system.
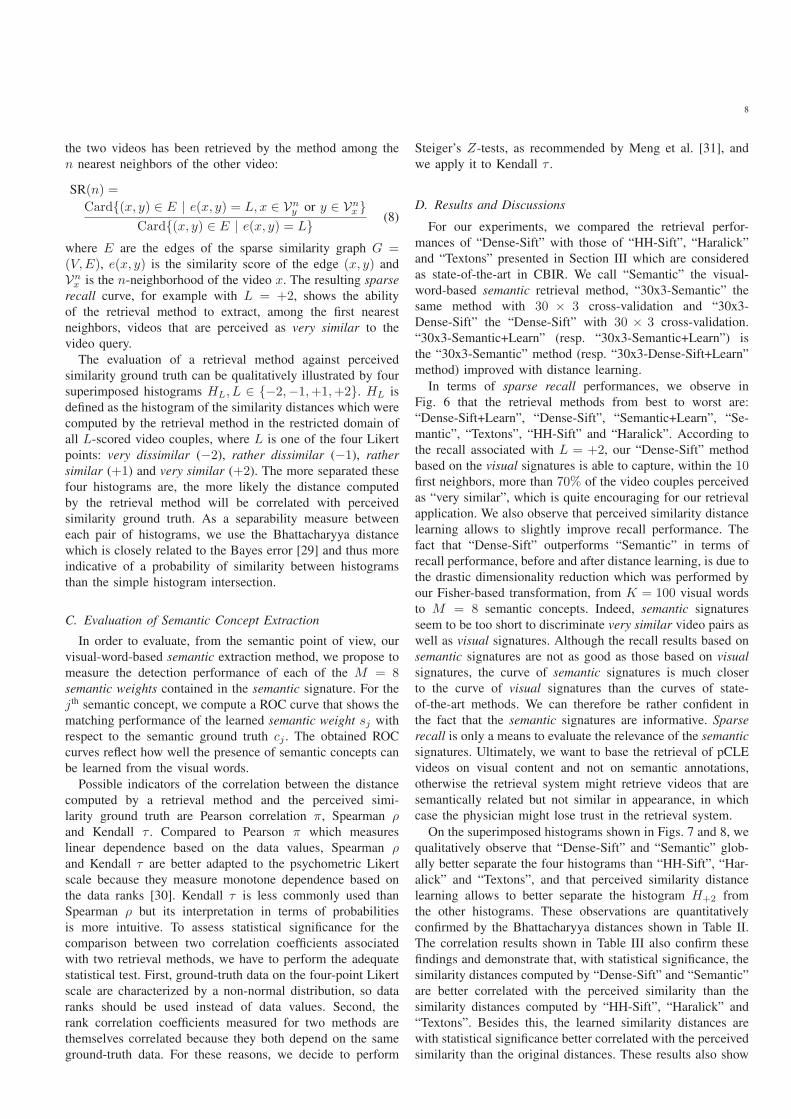
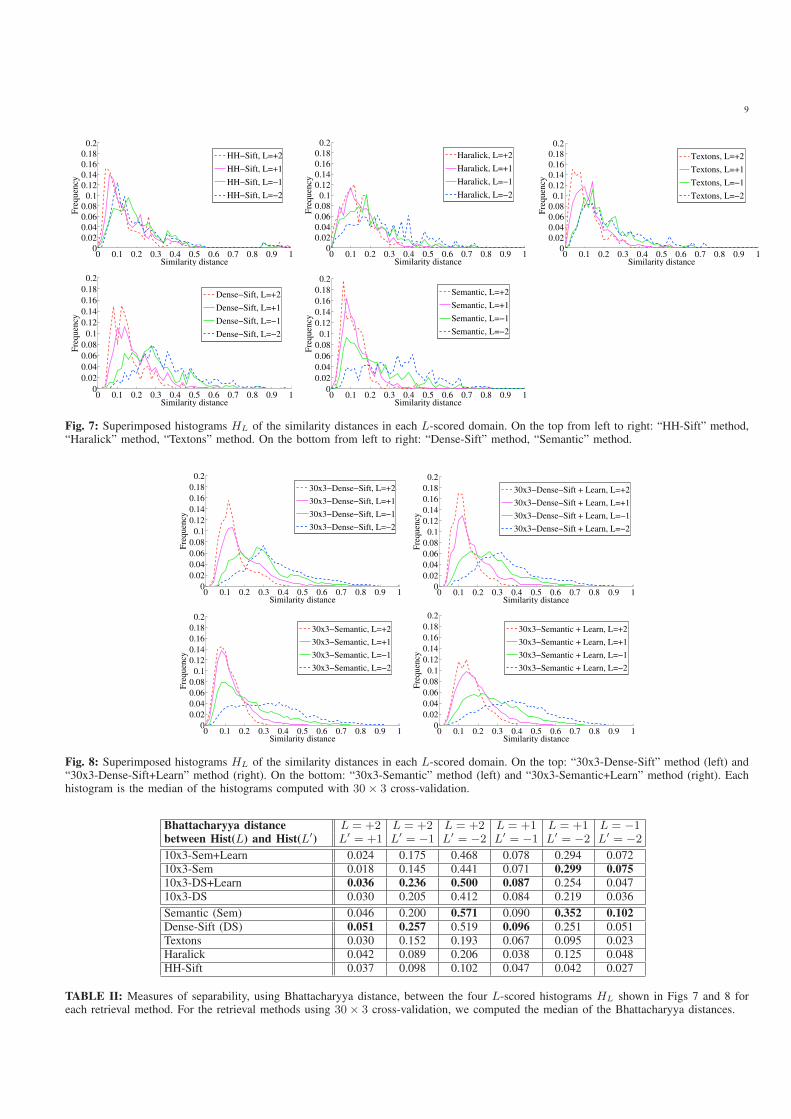
On the superimposed histograms shown in Figs. 7 and 8, we
qualitatively observe that “Dense-Sift” and “Semantic” glob-
ally better separate the four histograms than “HH-Sift”, “Har-
alick” and “Textons”, and that perceived similarity distance
learning allows to better separate the histogram H+2 from
the other histograms. These observations are quantitatively
confirmed by the Bhattacharyya distances shown in Table II.
The correlation results shown in Table III also confirm these
findings and demonstrate that, with statistical significance, the
similarity distances computed by “Dense-Sift” and “Semantic”
are better correlated with the perceived similarity than the
similarity distances computed by “HH-Sift”, “Haralick” and
“Textons”. Besides this, the learned similarity distances are
with statistical significance better correlated with the perceived
similarity than the original distances. These results also show
9
0 0.1 0.2 0.3 0.4 0.5 0.6 0.7 0.8 0.9 10
0.02
0.04
0.06
0.08
0.1
0.12
0.14
0.16
0.18
0.2
Similarity distance
Fre
qu
ency
HH−Sift, L=+2
HH−Sift, L=+1
HH−Sift, L=−1
HH−Sift, L=−2
0 0.1 0.2 0.3 0.4 0.5 0.6 0.7 0.8 0.9 10
0.02
0.04
0.06
0.08
0.1
0.12
0.14
0.16
0.18
0.2
Similarity distance
Fre
quen
cy
Haralick, L=+2
Haralick, L=+1
Haralick, L=−1
Haralick, L=−2
0 0.1 0.2 0.3 0.4 0.5 0.6 0.7 0.8 0.9 10
0.02
0.04
0.06
0.08
0.1
0.12
0.14
0.16
0.18
0.2
Similarity distance
Fre
qu
ency
Textons, L=+2
Textons, L=+1
Textons, L=−1
Textons, L=−2
0 0.1 0.2 0.3 0.4 0.5 0.6 0.7 0.8 0.9 10
0.02
0.04
0.06
0.08
0.1
0.12
0.14
0.16
0.18
0.2
Similarity distance
Fre
qu
ency
Dense−Sift, L=+2
Dense−Sift, L=+1
Dense−Sift, L=−1
Dense−Sift, L=−2
0 0.1 0.2 0.3 0.4 0.5 0.6 0.7 0.8 0.9 10
0.02
0.04
0.06
0.08
0.1
0.12
0.14
0.16
0.18
0.2
Similarity distance
Fre
quen
cy
Semantic, L=+2
Semantic, L=+1
Semantic, L=−1
Semantic, L=−2
Fig. 7: Superimposed histograms HL of the similarity distances in each L-scored domain. On the top from left to right: “HH-Sift” method,“Haralick” method, “Textons” method. On the bottom from left to right: “Dense-Sift” method, “Semantic” method.
0 0.1 0.2 0.3 0.4 0.5 0.6 0.7 0.8 0.9 10
0.02
0.04
0.06
0.08
0.1
0.12
0.14
0.16
0.18
0.2
Similarity distance
Fre
qu
ency
30x3−Dense−Sift, L=+2
30x3−Dense−Sift, L=+1
30x3−Dense−Sift, L=−1
30x3−Dense−Sift, L=−2
0 0.1 0.2 0.3 0.4 0.5 0.6 0.7 0.8 0.9 10
0.02
0.04
0.06
0.08
0.1
0.12
0.14
0.16
0.18
0.2
Similarity distance
Fre
qu
ency
30x3−Dense−Sift + Learn, L=+2
30x3−Dense−Sift + Learn, L=+1
30x3−Dense−Sift + Learn, L=−1
30x3−Dense−Sift + Learn, L=−2
0 0.1 0.2 0.3 0.4 0.5 0.6 0.7 0.8 0.9 10
0.02
0.04
0.06
0.08
0.1
0.12
0.14
0.16
0.18
0.2
Similarity distance
Fre
quen
cy
30x3−Semantic, L=+2
30x3−Semantic, L=+1
30x3−Semantic, L=−1
30x3−Semantic, L=−2
0 0.1 0.2 0.3 0.4 0.5 0.6 0.7 0.8 0.9 10
0.02
0.04
0.06
0.08
0.1
0.12
0.14
0.16
0.18
0.2
Similarity distance
Fre
quen
cy
30x3−Semantic + Learn, L=+2
30x3−Semantic + Learn, L=+1
30x3−Semantic + Learn, L=−1
30x3−Semantic + Learn, L=−2
Fig. 8: Superimposed histograms HL of the similarity distances in each L-scored domain. On the top: “30x3-Dense-Sift” method (left) and“30x3-Dense-Sift+Learn” method (right). On the bottom: “30x3-Semantic” method (left) and “30x3-Semantic+Learn” method (right). Eachhistogram is the median of the histograms computed with 30× 3 cross-validation.
Bhattacharyya distance L = +2 L = +2 L = +2 L = +1 L = +1 L = −1between Hist(L) and Hist(L′) L′ = +1 L′ = −1 L′ = −2 L′ = −1 L′ = −2 L′ = −2
10x3-Sem+Learn 0.024 0.175 0.468 0.078 0.294 0.072
10x3-Sem 0.018 0.145 0.441 0.071 0.299 0.075
10x3-DS+Learn 0.036 0.236 0.500 0.087 0.254 0.047
10x3-DS 0.030 0.205 0.412 0.084 0.219 0.036
Semantic (Sem) 0.046 0.200 0.571 0.090 0.352 0.102
Dense-Sift (DS) 0.051 0.257 0.519 0.096 0.251 0.051
Textons 0.030 0.152 0.193 0.067 0.095 0.023
Haralick 0.042 0.089 0.206 0.038 0.125 0.048
HH-Sift 0.037 0.098 0.102 0.047 0.042 0.027
TABLE II: Measures of separability, using Bhattacharyya distance, between the four L-scored histograms HL shown in Figs 7 and 8 foreach retrieval method. For the retrieval methods using 30× 3 cross-validation, we computed the median of the Bhattacharyya distances.
10
Retrieval M1” M1’ M2” M2’ M1 M2 M3 M4 M5method M 10x3-Sem+Learn 10x3-Sem 10x3-DS+Learn 10x3-DS Sem DS Textons Haralick HH-Sift
Pearson π 55.7 % 53.3 % 53.4 % 51.4 % 54.6 % 51.6 % 35.3 % 35.4 % 15.8 %σ 0.3 % 0.2 % 0.2 % 0.2 %
Spearman ρ 56.6 % 53.8 % 58.2 % 55.5 % 55.3 % 55.7 % 38.2 % 34.5 % 22.8 %σ 0.3 % 0.2 % 0.2 % 0.3 %
Kendall τ 50.9 % 48.1 % 52.4 % 49.8 % 49.4 % 50.0 % 34.1 % 30.4 % 20.0 %σ 0.3 % 0.2 % 0.2 % 0.2 %
> M1’ > M1’ > M3,M4 > M3,M4 > M4 > M5Steiger’s Z-test > M2’ > M5 > M5 > M5
on τ ; p-value p = 0.022 p < 0.003 p < 10−45 p < 10−60 p < 10−4 p < 10−15
∼ M2”,M2’ ∼ M2’ ∼ M1” ∼ M2p > 0.05 p = 0.163 p > 0.05 p = 0.486
TABLE III: Indicators of correlation between the similarity distance computed by the retrieval methods and the ground truth. For theretrieval methods using 30×3 cross-validation, we show the median of correlation coefficients. The standard deviation σ of each correlationestimator can be computed from the standard deviation of the n samples σsamples =
√n− 1σ. We also show the median of p-values
when comparing two retrieval methods using 30 × 3 cross-validation. > M indicates that the improvement from method M is statisticallysignificant, ∼ M indicates that it is not.
that the correlation performance of “30x3-Semantic+Learn”
(resp. “30x3-Semantic”) is comparable to that of “30x3-Dense-
Sift+Learn” (resp. 30x3-Dense-Sift”), as their difference is not
statistically significant.
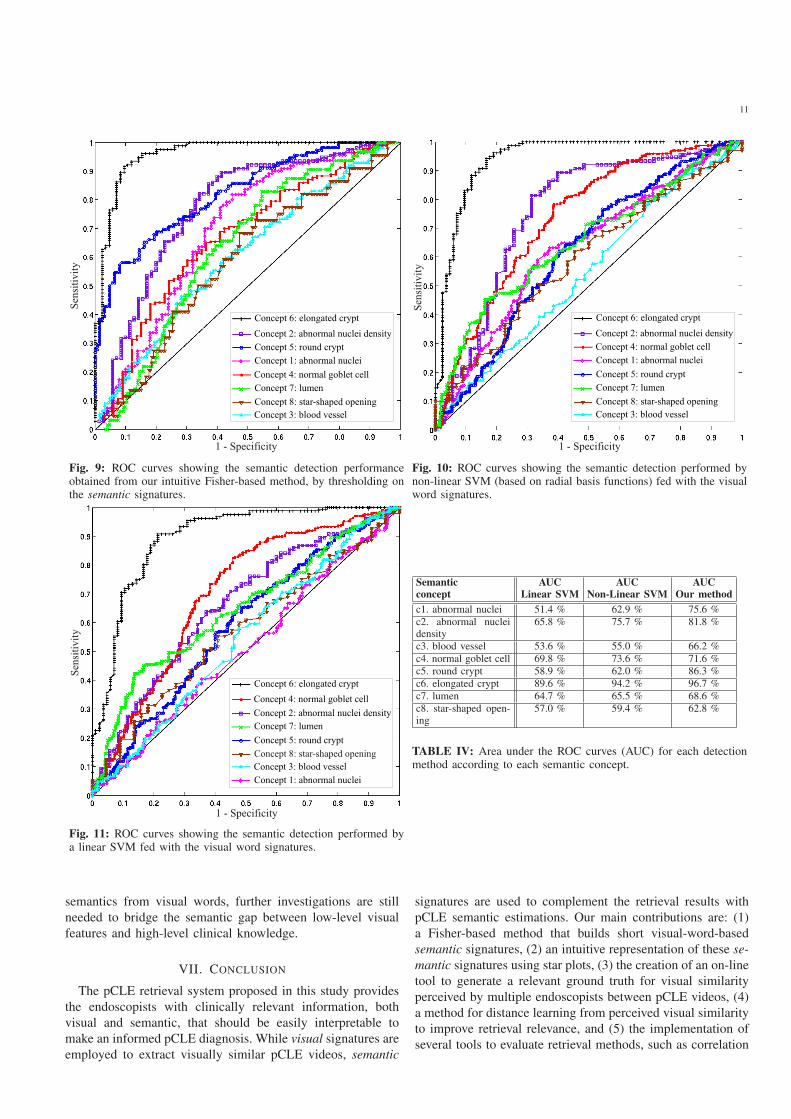
From the semantic point of view, the performance of the
semantic signature can be appreciated in the ROC curves
shown in Fig. 9. Each ROC curve associated with a concept
cj is the median of the ROC curves computed with 30 × 3cross-validation by thresholding on the semantic weight sj .
According to the areas under the ROC curves (AUC) shown
in Table IV, the semantic concepts, from the best classified
to the worst classified, are: elongated crypt, round crypt,
abnormal nuclei density, abnormal nuclei, normal goblet cell,
lumen, blood vessel and star-shaped opening. The fact that the
concept elongated crypt is very well classified shows that the
visual words clearly express whether this concept is present
or not in pCLE videos. As the presence of elongated crypts
in a pCLE video is a typical criterion of malignancy for the
endoscopists, we deduce that semantic signatures could be
successfully used for pCLE classification between malignant
and non-malignant colonic polyps. Although the concepts
blood vessel and star-shaped opening are poorly classified,
they contribute, as “weak classifiers”, to the clinical relevance
of the whole semantic signature because their ROC curves are
above the diagonal. As the semantic detection deriving from
semantic signatures is based on a rather intuitive Fisher-based
linear method, it is worth to be compared with more sophisti-
cated classification method, such as Support Vector Machines
(SVM). We thus test the detection performance of a linear
SVM and a non-linear SVM based on radial basis functions,
which we feed with the visual word signatures. The resulting
ROC curves are shown in Figs. 10 and 11. Each ROC curve
associated with a concept cj is the median of the ROC curves
computed with 30× 3 cross-validation. In order to assess the
statistical significance of AUC differences, we used the non-
parametric method of DeLong et al. [32] based on the Mann-
Whitney U-statistic. From the AUC values in Table IV we
deduce that most of the ROC curves obtained with the linear
SVM and with the non-linear SVM are statistically worse than
those obtained with our intuitive method, and none of them
are statistically better. More precisely, our method outperforms
the linear SVM method with statistical significance for all
semantic concepts except the concept c4. Compared to the
non-linear SVM method, our method performs also better for
all semantic concepts except c4, and statistical significance is
demonstrated for the concepts c1, c2, c3 and c5. These AUC
comparison results demonstrate the relevance of our intuitive
Fisher-based method in terms of semantic detection, and thus
the relevance of the semantic signatures.
In order to ensure both the high recall of the visual-word-
based retrieval including perceived similarity learning, and the
clinical relevance of the semantic information contained in
the semantic signature, we propose a pCLE retrieval system
where the most similar videos are extracted using the “Dense-
Sift+Learn” method, and where the star plots representing
semantic signatures are displayed as additional information.
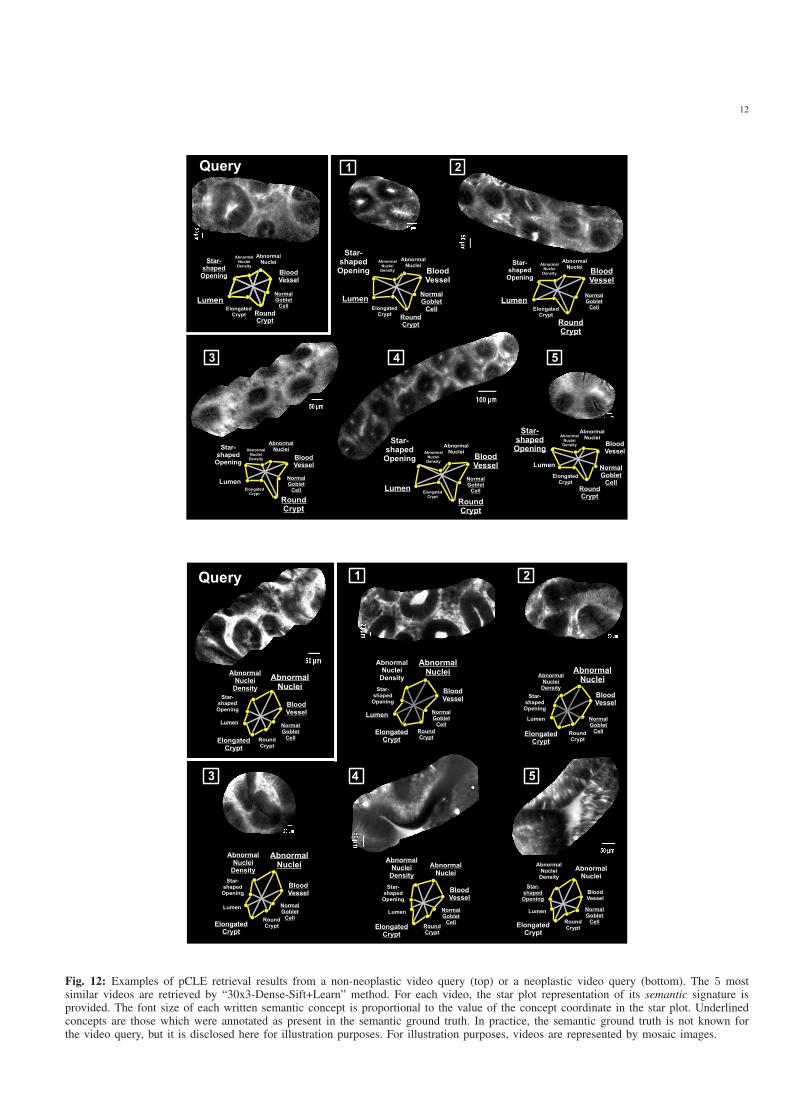
Fig. 12 shows some typical results of our pCLE retrieval
system with 5 nearest neighbors, with the added semantic
ground truth represented by underlined concepts. In clinical
practice, the semantic ground truth is not known for the
video query, but in these retrieval examples it is disclosed for
illustration purposes. The extracted pCLE videos, represented
as mosaic images, look quite similar in appearance to the
query, the first neighbor being more visually similar than
the 5th one. On each star plot, the font size of each written
semantic concept is proportional to the normalized value of its
semantic weight. Semantic concepts written in large characters
may or may not be in agreement with the underlined concepts
present in the ground truth. Most importantly, if for a given
pCLE video, the semantic ground truth is very different from
the estimated semantic signature, then the difficulty to interpret
the video for diagnosis purpose might be high, because visual
content is not correlated with semantic annotations. Our visual-
word-based semantic signature would thus have the potential
to distinguish ambiguous from non-ambiguous pCLE videos.
The remaining disagreements between the learned semantic
information and the semantic ground truth show that, even
though we have achieved encouraging results in extracting
11
Fig. 9: ROC curves showing the semantic detection performanceobtained from our intuitive Fisher-based method, by thresholding onthe semantic signatures.
Fig. 10: ROC curves showing the semantic detection performed bynon-linear SVM (based on radial basis functions) fed with the visualword signatures.
Fig. 11: ROC curves showing the semantic detection performed bya linear SVM fed with the visual word signatures.
Semantic AUC AUC AUCconcept Linear SVM Non-Linear SVM Our method
c1. abnormal nuclei 51.4 % 62.9 % 75.6 %
c2. abnormal nucleidensity
65.8 % 75.7 % 81.8 %
c3. blood vessel 53.6 % 55.0 % 66.2 %
c4. normal goblet cell 69.8 % 73.6 % 71.6 %
c5. round crypt 58.9 % 62.0 % 86.3 %
c6. elongated crypt 89.6 % 94.2 % 96.7 %
c7. lumen 64.7 % 65.5 % 68.6 %
c8. star-shaped open-ing
57.0 % 59.4 % 62.8 %
TABLE IV: Area under the ROC curves (AUC) for each detectionmethod according to each semantic concept.
semantics from visual words, further investigations are still
needed to bridge the semantic gap between low-level visual
features and high-level clinical knowledge.
VII. CONCLUSION
The pCLE retrieval system proposed in this study provides
the endoscopists with clinically relevant information, both
visual and semantic, that should be easily interpretable to
make an informed pCLE diagnosis. While visual signatures are
employed to extract visually similar pCLE videos, semantic
signatures are used to complement the retrieval results with
pCLE semantic estimations. Our main contributions are: (1)
a Fisher-based method that builds short visual-word-based
semantic signatures, (2) an intuitive representation of these se-
mantic signatures using star plots, (3) the creation of an on-line
tool to generate a relevant ground truth for visual similarity
perceived by multiple endoscopists between pCLE videos, (4)
a method for distance learning from perceived visual similarity
to improve retrieval relevance, and (5) the implementation of
several tools to evaluate retrieval methods, such as correlation
12
����� ��
��
��� ����
�������� ����
�����
�����������������
�������������� ������
��������������
!���"�����
������#����� ���
�������������� ������
��������������
!���"�����
������#����� ���
��� ����
�������� ����
�����
�����������������
�������������� ������
��������������
!���"�����
������#����� ���
��� ����
�������� ����
�����
�����������������
�������������� ������
�������������� ������
�������������� ��������������
��������������������
��������������
!���"�����
!���"�����
!���"�����
������#����� ���
������#����� ���
������#����� ���
��� ����
��� ����
��� ����
�������� ���� ��������
����
�������� ���������
�����
�����
�����������������
�����������������
�����������������
$�
�� %� &�
����� ��
��� ��������
�����
�� ���� ����������
����� ������������
����� �����
�� ����
!��������
����� ������������
����� ������������
����� ������������
����� ������������
����� �����
����� ����� �����
���������� �����
�� ����
�� ���� ��
������ ����
��� "�����
��� "�����
��� "�����
��� "�����
��� "�����
��� "�����
!��������
!�������� !���
�����
!��������
��� ��������
��� ��������
��� ��������
��� ��������
�����
���������� �����
�� ���� ����������
�� ���� ����������
�� ���� ����������
�� ���� ����������
#�
$� %� &�
����� ������������
����� �����
�� ����
!��������
��� ��������
�����
�� ���� ����������
Fig. 12: Examples of pCLE retrieval results from a non-neoplastic video query (top) or a neoplastic video query (bottom). The 5 mostsimilar videos are retrieved by “30x3-Dense-Sift+Learn” method. For each video, the star plot representation of its semantic signature isprovided. The font size of each written semantic concept is proportional to the value of the concept coordinate in the star plot. Underlinedconcepts are those which were annotated as present in the semantic ground truth. In practice, the semantic ground truth is not known forthe video query, but it is disclosed here for illustration purposes. For illustration purposes, videos are represented by mosaic images.
13
measures and sparse recall curves. Moreover, this proposed
methodology could be applied to other medical or non-medical
databases, as long as ground-truth data are available.
Despite our relatively small pCLE database and despite the
sparsity of the perceived similarity ground truth, our evalu-
ation experiments show that the visual-word-based semantic
signatures extract, from low-level visual features, a higher-
level clinical knowledge which is consistent with respect
to perceived similarity. Possible disagreements between the
semantic estimation, based on visual features, and the semantic
ground truth could be investigated in order to estimate the
interpretation difficulty of pCLE videos, which we explored
in a previous study [33] only based on visual words. Future
work will focus on more sophisticated methods to learn jointly
visual and semantic similarity. Our long-term objective is the
clinical evaluation of our visual-semantic retrieval system to
see whether it could help the endoscopists in making more
accurate pCLE diagnosis.
REFERENCES
[1] H. Müller, J. Kalpathy-Cramer, C. E. Kahn, W. Hatt, S. Bedrick, andW. R. Hersh, “Overview of the ImageCLEFmed 2008 medical imageretrieval task,” in CLEF, 2008, pp. 512–522. 1
[2] U. Avni, H. Greenspan, E. Konen, M. Sharon, and J. Goldberger, “X-ray categorization and retrieval on the organ and pathology level, usingpatch-based visual words,” IEEE Trans. Med. Imag., vol. 30, no. 3, pp.733–746, 2011. 1
[3] A. W. M. Smeulders, M. Worring, S. Santini, A. Gupta, and R. Jain,“Content-based image retrieval at the end of the early years,” IEEE
Trans. Pattern Anal. Mach. Intell., vol. 22, no. 12, pp. 1349–1380, 2000.2
[4] C. B. Akgül, D. L. Rubin, S. Napel, C. F. Beaulieu, H. Greenspan, andB. Acar, “Content-based image retrieval in radiology: Current status andfuture directions,” J. Digital Imaging, vol. 24, no. 2, pp. 208–222, 2011.2
[5] O. Khalid, S. Radaideh, O. W. Cummings, M. J. O’ Brien, J. R.Goldblum, and D. K. Rex, “Reinterpretation of histology of proximalcolon polyps called hyperplastic in 2001,” World J Gastroenterol,vol. 15, no. 30, pp. 3767–70, 2009. 2
[6] B. André, T. Vercauteren, M. B. Wallace, A. M. Buchner, and N. Ayache,“Endomicroscopic video retrieval using mosaicing and visual words,” inProc. ISBI’10, 2010, pp. 1419–1422. 2, 4
[7] B. André, T. Vercauteren, A. M. Buchner, M. B. Wallace, and N. Ayache,“Retrieval evaluation and distance learning from perceived similaritybetween endomicroscopy videos,” in Proc. MICCAI’11, 2011, pp. 289–296. 2, 3
[8] ——, “Learning semantic and visual similarity for endomicroscopyvideo retrieval,” INRIA, INRIA Technical Report RR-7722, Aug. 2011.[Online]. Available: http://hal.inria.fr/inria-00618057/en/ 2
[9] A. M. Buchner, M. W. Shahid, M. G. Heckman, M. Krishna, M. Ghabril,M. Hasan, J. E. Crook, V. Gomez, M. Raimondo, T. Woodward,H. Wolfsen, and M. B. Wallace, “Comparison of probe based confocallaser endomicroscopy with virtual chromoendoscopy for classificationof colon polyps,” Gastroenterology, vol. 138, no. 3, pp. 834–842, 2009.3
[10] T. Vercauteren, A. Perchant, G. Malandain, X. Pennec, and N. Ayache,“Robust mosaicing with correction of motion distortions and tissuedeformation for in vivo fibered microscopy,” Med. Image Anal., vol. 10,no. 5, pp. 673–692, Oct. 2006. 3
[11] E. Dabizzi, M. W. Shahid, B. Qumseya, M. Othman, and M. B. Wallace,“Comparison between video and mosaics viewing mode of confocallaser endomicroscopy (pCLE) in patients with Barrett’s esophagus,”Gastroenterology (DDW 2011), 2011. 3
[12] VSS, “Visual similarity scoring (VSS),” http://smartatlas.maunakeatech.com, login: MICCAI-User, password: MICCAI2011. 3
[13] R. Kiesslich, J. Burg, M. Vieth, J. Gnaendiger, M. Enders, P. Delaney,A. Polglase, W. McLaren, D. Janell, S. Thomas, B. Nafe, P. R. Galle, andM. F. Neurath, “Confocal laser endoscopy for diagnosing intraepithelialneoplasias and colorectal cancer in vivo,” Gastroenterology, vol. 127,no. 3, pp. 706–13, 2004. 4
[14] J. Zhang, S. Lazebnik, and C. Schmid, “Local features and kernels forclassification of texture and object categories: a comprehensive study,”Int. J. Comput. Vis., vol. 73, pp. 213–238, Jun. 2007. 4
[15] T. Leung and J. Malik, “Representing and recognizing the visualappearance of materials using three-dimensional textons,” Int. J. Comput.Vis., vol. 43, pp. 29–44, Jun. 2001. 4
[16] F.-F. Li and P. Perona, “A Bayesian hierarchical model for learningnatural scene categories,” in Proc. CVPR’05, 2005, pp. 524–531. 4
[17] R. M. Haralick, “Statistical and structural approaches to texture,” inProc. IEEE, vol. 67, 1979, pp. 786–804. 4
[18] GLCM texture features, http://www.mathworks.com/matlabcentral/fileexchange/22187-glcm-texture-features. 4
[19] A. Oliva and A. Torralba, “Modeling the shape of the scene: A holisticrepresentation of the spatial envelope,” Int. J. Comput. Vis., vol. 42,no. 3, pp. 145–175, 2001. 4
[20] B. Poblete, B. Bustos, M. Mendoza, and J. M. Barrios, “Visual-semanticgraphs: using queries to reduce the semantic gap in web image retrieval,”in Proc. ACM Information and Knowledge Management, 2010, pp.1553–1556. 5
[21] H. Ma, J. Zhu, M. R. Lyu, and I. King, “Bridging the semantic gapbetween image contents and tags,” IEEE Trans. Multimedia, vol. 12,pp. 462–473, 2010. 5
[22] J. C. Caicedo, J. G. Moreno, E. A. Niño, and F. A. González, “Combin-ing visual features and text data for medical image retrieval using latentsemantic kernels,” in Proc. Multimedia Information Retrieval, 2010, pp.359–366. 5
[23] N. Rasiwasia, P. J. Moreno, and N. Vasconcelos, “Bridging the gap:Query by semantic example,” IEEE Trans. Multimedia, vol. 9, no. 5,pp. 923–938, 2007. 5
[24] N. Rasiwasia, J. C. Pereira, E. Coviello, G. Doyle, G. R. G. Lanckriet,R. Levy, and N. Vasconcelos, “A new approach to cross-modal multi-media retrieval,” in ACM Multimedia, 2010, pp. 251–260. 5
[25] R. Kwitt, N. Rasiwasia, N. Vasconcelos, A. Uhl, M. Häfner, and F. Wrba,“Learning pit pattern concepts for gastroenterological training,” in Proc.
MICCAI’11, 2011, pp. 273–280. 5[26] L. Yang, R. Jin, L. Mummert, R. Sukthankar, A. Goode, B. Zheng,
S. C. H. Hoi, and M. Satyanarayanan, “A boosting framework forvisuality-preserving distance metric learning and its application to med-ical image retrieval,” IEEE Trans. Pattern Anal. Mach. Intell., vol. 32,pp. 30–44, 2010. 5
[27] K. Q. Weinberger and L. K. Saul, “Distance metric learning for largemargin nearest neighbor classification,” J. Mach. Learn. Res., vol. 10,pp. 207–244, 2009. 5
[28] J. Philbin, M. Isard, J. Sivic, and A. Zisserman, “Descriptor learning forefficient retrieval,” in Proc. ECCV’10, 2010, pp. 677–691. 5
[29] T. Kailath, “The divergence and Bhattacharyya distance measures insignal selection,” IEEE Trans. Commun. Technol., vol. 15, no. 1, pp.52–60, 1967. 8
[30] V. Barnett, Sample Survey principles and methods. Hodder Arnold,1991. 8
[31] X.-L. Meng, R. Rosenthal, and D. B. Rubin, “Comparing correlatedcorrelation coefficients,” Psychological Bulletin, vol. 111, no. 1, pp. 172–175, 1992. 8
[32] E. R. DeLong, D. M. DeLong, and D. L. Clarke-Pearson, “Comparingthe areas under two or more correlated receiver operating characteristiccurves: a nonparametric approach,” Biometrics, vol. 44, no. 3, pp. 837–845, 1988. 10
[33] B. André, T. Vercauteren, A. M. Buchner, M. W. Shahid, M. B. Wallace,and N. Ayache, “An image retrieval approach to setup difficulty levels intraining systems for endomicroscopy diagnosis,” in Proc. MICCAI’10,no. 6362, 2010, pp. 480–487. 13