learning to detect the functional components of doorbell …alexs/papers/humanoids_2010/... · ·...
TRANSCRIPT

Learning to Detect the Functional Components of Doorbell ButtonsUsing Active Exploration and Multimodal Correlation
Vladimir Sukhoy and Alexander Stoytchev
Abstract— This paper describes a large-scale experimentalstudy, in which a humanoid robot learned to press and detectdoorbell buttons autonomously. The models for action selectionand visual detection were grounded in the robot’s sensorimotorexperience and learned without human intervention. Exper-iments were performed with seven doorbell buttons, whichprovided auditory feedback when pressed. The robot learnedto predict the locations of the functional components of eachbutton accurately. The trained visual model was also able todetect the functional components of novel buttons.
I. INTRODUCTION
Buttons are everywhere around us. There are buttonsin every room, in every car, and in every elevator. Thesesimple 1-dof devices are the method of choice for controllingthe state of many mechanisms and systems. The averagehuman interacts with dozens of buttons every day withouteven noticing. By necessity, robots that operate in human-inhabited environments will have to learn how to use buttons.Otherwise, they will not be very useful.
Pressing buttons is still challenging for robots for tworeasons. First, buttons are designed for humans, not forrobots. Their shapes and sizes are optimized for humanfingers. Buttons that are pressable by humans may not bepressable by robots (e.g., because they are too small forrobotic fingers). Furthermore, seemingly small differencesin finger morphology can lead to significantly different usepatterns. For example, some plastic buttons may be tooslippery for robotic fingers made of brushed aluminum,forcing the robot to use approach trajectories that rely onthe external button housing in order to perform the push.Second, different buttons produce different feedback whentheir state changes. Some buttons click, others light up, stillothers provide auditory feedback when pressed. This largevariety of buttons makes it impossible to write one programthat all robots can use in order to press all possible buttons.
The goal of this work is to develop a framework anda visual model for detecting the functional components ofbuttons that can be trained from experience. The experimentswere performed with seven doorbell buttons that provideauditory feedback when pressed, but the framework can beapplied to other buttons as well. For each button the robotperformed a large number of oscillatory pushing movementsin the vicinity of the button and recorded the auditory, pro-prioceptive, and visual events that occurred. A visual modelwas learned, which from the resulting dataset predicted thelocations of the functional parts of buttons, i.e., the parts that
Developmental Robotics Laboratory, Iowa State University, 3128 CooverHall, Ames, IA 50011-3060, USA. {sukhoy, alexs}@iastate.edu
Fig. 1. All experiments were performed with the upper-torso humanoidrobot, shown here in front of the buttons.
actually produced sound when pressed. The model was ableto generalize to novel buttons.
As the robot explores buttons it keeps track of the locationof its fingertip when the buzzer goes off. The spatial densityof the auditory events in the robot’s visual space is used totrain a classifier that maps image patches from visual space totheir likelihood of triggering the buzzer. This classifier servesas the robot’s model of what the functional component of abutton looks like. The model was able to detect the functionalcomponents of both familiar and novel buttons.
Finally, the visual model is capable of monitoring its ownlearning progress in order to estimate the amount of trainingexperience that is required. Specifically, the robot is ableto estimate when the predictions of its visual model stopchanging. For most buttons this condition is reached after50-100 trials, which allows our method to learn in real time.
II. RELATED WORK
A. Robotics
The related work on button pushing in robotics can bedivided into three main categories as described below.
1) Pressing buttons is easy, but detecting them is hard.This category assumes that the physical act of pressing abutton is trivial and focuses on the problem of visuallydetecting the button, which is presumed to be more difficult.The feedback from the button (e.g., click, light, sound) is notcommonly used to detect it. In fact, this feedback is typicallyignored. Work in this category has focused on detectingelevator buttons [1] [2] [3]. In some of these studies [2] [3],the detection of elevator buttons was improved using the factthat they are often arranged in a grid.

2) Both pressing and detecting buttons is hard. The secondcategory assumes that both detecting and pressing buttons,switches, and other small widgets designed for humans is stilltoo difficult for robots. Therefore, they choose to make thesewidgets more visible and manipulable by attaching tags tothem (e.g., reflective markers or RFID tags) [4]. For a button,this tag carries information about how and where a robot canpress it and what would be the result of this action. The mainfocus of this research is on robotic applications in the homethat are enabled by these augmentations [5].
3) Button pressing as a social learning task. This categoryhas focused on social learning strategies for teaching a robotto press buttons. It was demonstrated that a robot can learn topress a button using human social cues as feedback [6]. Themain focus, however, was on interpreting and learning fromhuman social cues and not on the physical task of pressinga button.
Our work differs from previous approaches in the follow-ing ways: 1) We treat both the detection task and the pressingtask as challenging; 2) The visual model for detecting abutton is constructed incrementally from the multimodalevents produced by the button (i.e., we don’t ignore thefeedback that the button generates when it is pressed); 3)Our approach does not rely on a human to tell the robothow and where to press the button.
Because of the different embodiments of the human andthe robot, it is not always possible to tell a robot how to pressa button. Therefore, the robot learns its own representationby actively exploring the button and detecting the multimodalevents resulting from this interaction. As the robot gatherstraining data it learns a visual model to detect the button. Themodel’s generalization properties improve with additionalexperience and it can be used to detect novel buttons.
The strategies that the robot used to explore the buttonswere formulated in the information-theoretic paradigm ofactive learning [7] [8] [9]. Active learning has been usedsuccessfully for grasping tasks [10] [11] [12] [13]. Theexploration strategies are analyzed in more detail in [14],which is based on the same dataset. The focus of this paper ison combining active learning with an ability to generalize theexperience obtained from it. The experience is generalizedacross different modalities: it is obtained primarily usingproprioception and audio, but the generalization occurs inthe visual domain.
B. Developmental Psychology
In psychology, E.J. Gibson [15] analyzed a large body ofresearch on exploration and knowledge acquisition and con-cluded that, for a human infant, “observations made possiblevia both exploratory and performatory actions provide thematerial for his knowledge of the world – a knowledge thatdoes not cease expanding, whose end (if there is an end) isunderstanding.”
Others have also noted that the experience that infantsobtain while exploring objects stimulates their further interestin these objects [16]. 7-11 months old infants are not inter-ested in seeing objects, or people who manipulate objects,
(a) (b)Fig. 2. The experimental setup: (a) the robot exploring button number 4;(b) The back side of the experimental fixture.
until the infants have had the chance to play with theseobjects [16]. Only after playing with the objects the infantsbecame interested in observing how people manipulate theseobjects [16]. There is also evidence that human infantscan anticipate events that occur during manipulation. Inparticular, infants as young as 9 months old can predict thatan interesting sound will be heard or a bright light will beseen when an experimenter presses a colored button [17].
III. EXPERIMENTAL SETUPA. Robot
The button pushing experiments were performed with theupper-torso humanoid robot shown in Fig. 1. The robot usedin the experiments had two Barrett Whole Arm Manipulators(WAMs) as arms with two Barrett BH8-262 Hands as endeffectors. A color marker was attached to the fingertip offinger F3 on the left hand – the hand used to press the buttons– in order to simplify its visual tracking.B. Experimental Fixture with Doorbell Buttons
Seven different doorbell buttons were mounted on awooden fixture as shown in Fig. 2. The middle segment ofthe fixture could slide horizontally, which allowed differentbuttons to be placed in front of the robot without movingthe fixture or the robot. This was necessary for the propercollection and analysis of such a large-scale dataset. Thebutton currently explored by the robot was connected to abuzzer, which produced loud auditory feedback.C. Experimental Trials
The robot explored the buttons with 3 different explo-ration strategies: random, stimulus-driven, and uncertainty-driven (see Section IV-A). For each strategy, the robot per-formed 200 trials. In addition, an evaluation set of 400 trialswas collected for each button, which was used to evaluatethe performance of the three strategies. The evaluation setwas collected using the random strategy, but the data wasused only for testing and not for training. To summarize, foreach of the 7 buttons the robot performed 3× 200 + 400 =1000 trials, for a total of 7×1000 = 7000 trials. Each trialconsisted of 5 pushing behaviors (see Fig. 3), which resultedin a dataset with 35,000 pushing behaviors.

Time in seconds
Aud
ioV
ideo
?
Start of trial
?
Random start point
?
Push 1 (no buzzer)
?
Push 2 (buzzer)
?
Push 3 (buzzer)
?
Push 4 (buzzer)
?
Push 5 (no buzzer)
Fig. 3. A sample trial performed by the robot. Video frames for each of the five pushing behaviors are matched to the corresponding sound spectrogram.The robot’s field of view is larger than the images shown here, which were cropped to show only the area around the button.
The starting position for each push was the end positionof the previous push. The end point of the push was selectedbased on the learning strategy that was used. To randomizethe starting position of each trial, the robot started with arandom push that was not counted toward the 5 pushes inthe trial. Each trial lasted for approximately 18-20 seconds(the setup time was 3–5 seconds and each of the 5 pushingbehaviors took ∼3 seconds).
All 1000 trials with each button were performed sequen-tially without interruptions. It took about 6 hours of explo-ration to collect all the data for one button (3 explorationstrategies plus evaluation set). The total time for collectingthe dataset with 7 buttons was about 7×6 = 42 hours.
This large dataset was necessary to properly analyze theeffects of more experience on the generalization abilities ofthe robot under the three exploration strategies. As describedbelow, the robot learned to press and detect even the mostchallenging buttons in far fewer trials.
D. Behavioral Parametrization
Each trial was started from a fixed reference arm position,for which the robot’s finger was above a button. At the startof each trial, the robot pushed the area around the buttonat random. This push randomized the start position of theexploration and did not count towards it, even if it happenedto trigger the buzzer. Then the robot performed 5 exploratorypushing behaviors in the area around the button. The startposition for each of these behaviors was the end position ofthe previous push. The end position was determined usingthe current exploration strategy. From the start position, therobot backed up its arm halfway towards the fixed referenceposition without reaching it and then pushed towards the endposition. At the end of the trial the robot returned its armcompletely to the reference position and started the next trial.
A vector x ∈ R6, which was a concatenation of twounit vectors x(b),x(p) ∈ R3 in the robot’s Cartesian space,parameterized each pushing behavior. x(b) was the directionof the backup movement towards the fixed arm referenceposition. x(p) was the direction of the following push. Toprovide equal weights for both backward and forward move-ments, which constitute a pushing behavior, both x(b) andx(p) are movement directions rather than exact positions.The parameters for the pushing behaviors were sampleduniformly in joint space, which resulted in non-uniformsampling in Cartesian and visual space. Even though the
reference arm position was the same for all behaviors, theparametrization, and the resulting movement, was differentfor behaviors with different start and stop positions on thesurface of the experimental fixture.
To summarize, the behaviors in each trial resulted in oscil-latory finger movements around the button. Infants performrepetitive movements when they learn similar tasks [18].
E. Sensory Data
The robot recorded sensory data using 3 modalities: video,audio, and proprioception. Video was recorded at 10 fps and640×480 pixels per frame from the Logitech QuickCam Pro4000 webcam in the robot’s left eye. Audio was recorded at44.1 KHz (16-bit stereo) from the Audio-Technica U853AWHanging Microphone mounted in the robot’s head. Joint an-gles and joint torques for each of the 7 joints of the left WAMarm were recorded at 500 Hz. Audio and proprioceptionwere processed in real time to detect events and to train thepredictive models used by the 3 exploration strategies (seeSection IV-A). The data from all modalities was timestampedand stored to disk for additional analysis.
Proprioceptive events were detected when the magnitudeof the torque for any of the 7 joints exceeded a predefinedthreshold. These events were recorded when the robot’sfinger was “stuck” and could not move any further (e.g.,because it was pressing hard against the wall or the button).Whenever a proprioceptive event was detected, the robotinterrupted the current movement and started the next one.
Auditory events were recorded when the robot heard thebuzzer. The detection was achieved in two steps. First,candidate regions were extracted from the audio stream whenthe volume exceeded a predefined threshold. Regions shorterthan 0.03 seconds were not analyzed. Longer candidateregions were truncated after 0.1 seconds. If the buzzer washeard more than once during a pushing behavior then onlythe first instance was recorded. Second, the Discrete FourierTransform was applied to each candidate region to get itsspectrogram (with 257 frequency bins and a Hamming win-dow of 512 samples overlapped at 50%). A 20-bin frequencycomponent histogram was calculated from the spectrogramand its bin values were used as input features for a cascade oftwo classifiers (Naive Bayes and K∗ [19]), which made thefinal decision. The cascade structure was determined froma similar dataset [20], in which candidate regions with andwithout the buzzer sound were labeled manually.

IV. METHODOLOGY
A. Exploration StrategiesThree different exploration strategies were evaluated: ran-
dom, stimulus-driven, and uncertainty-driven. Each strategyused a different predictive model M to choose the nextpushing behavior from a set of N = 25 random candidates,generated from scratch every time. From these randomcandidates, the current strategy selected one, which was thenperformed by the robot. The strategies differed in the specificrule that they used to select the winning behavior from the setof random candidates, given the current state of the model.
More formally, as the robot explored a button, it recordedtuples (bi,oi) where bi ∈R6 were the behavioral parametersand oi ∈ {buzzer,no buzzer} was the observed outcome.These tuples constituted experience that the robot obtainedfrom exploration. The predictive model M was trained usingthis experience to estimate the conditional probability Pr(o|b)of an outcome o given the candidate behavior b. The threestrategies were formulated as follows.
1) Random Strategy: always selected the first behaviorfrom the 25 random candidates, i.e., j = 1. This strategydid not use a predictive model and the resulting explorationwas random.
2) Stimulus-Driven Strategy: selected the behavior thatwas most likely to produce the buzzer outcome among theN candidates according to the predictive model M. Moreformally, the behavior j parametrized by x j ∈ {x1, . . . ,xN}was chosen such that:
j = argmaxi=1,...,N
Pr(buzzer|xi).
3) Uncertainty-Driven Strategy: selected the behavior forwhich the predictive model M was most uncertain about itsoutcome. For each of the N = 25 candidate behaviors, theentropy of the conditional distribution of its outcomes quan-tified the uncertainty. More formally, this strategy selectedbehavior j parametrized as x j ∈ {x1, . . .xN} such that
j = argmaxi=1,...,N
∑o∈O−Pr(o|xi) log(Pr(o|xi)).
The choice of a mechanism for a predictive model Mwas motivated by the need to update it incrementally asthe robot collected more experience. The results of a pilotstudy [20] showed that the k-NN classifier performed wellfor a similar task. The k-NN classifier is data-driven andthe computational cost of updates as more training instancesbecome available is low. In this study we set k = 5 (anodd k is useful to avoid tied votes), i.e., the classifierestimated Pr(o|x) from the outcome distribution of the 5nearest neighbors of x in the robot’s experience. For example,if 4 out of 5 of these neighbors had buzzer outcomes, theestimate for Pr(buzzer|x) was 4/5.
B. Spatial Distributions of Auditory Events
As the robot explored a button, it recorded the visuallocation of its fingertip every time it heard the buzzer.Fig. 6(e) shows the resulting 2D point clouds for the
Fig. 4. Snapshots from the dataset showing different ways in which therobot was able to ring the doorbell buttons. Note that the red marker on therobot’s fingertip does not necessarily have to overlap with the functionalcomponent of the button.
uncertainty-driven strategy. The point clouds for the test setare shown in Fig. 6(b). The apparent scattering of the pointsis due to the fact that the robot can press a button withparts of its finger other than its fingertip, which was the onlything that was tracked. Fig. 4 shows several examples of therobot successfully pressing a button even though the visualposition of its fingertip does not coincide with the functionalcomponent of the button.
The point clouds offer a good way to visualize the posi-tions of the auditory events in camera coordinates. A betterway to visualize this data, however, is to compute the densityof the auditory events, shown in Fig. 6(c) and 6(f). Thesedensities were estimated using k-NN with k = 5, which is astandard technique [21]. The density of the auditory eventscontains information that can be used by the robot to decidewhere a button should be pressed. Furthermore, as describedbelow, the density can be used to learn a visual model ofwhat a button looks like.C. Visual Features
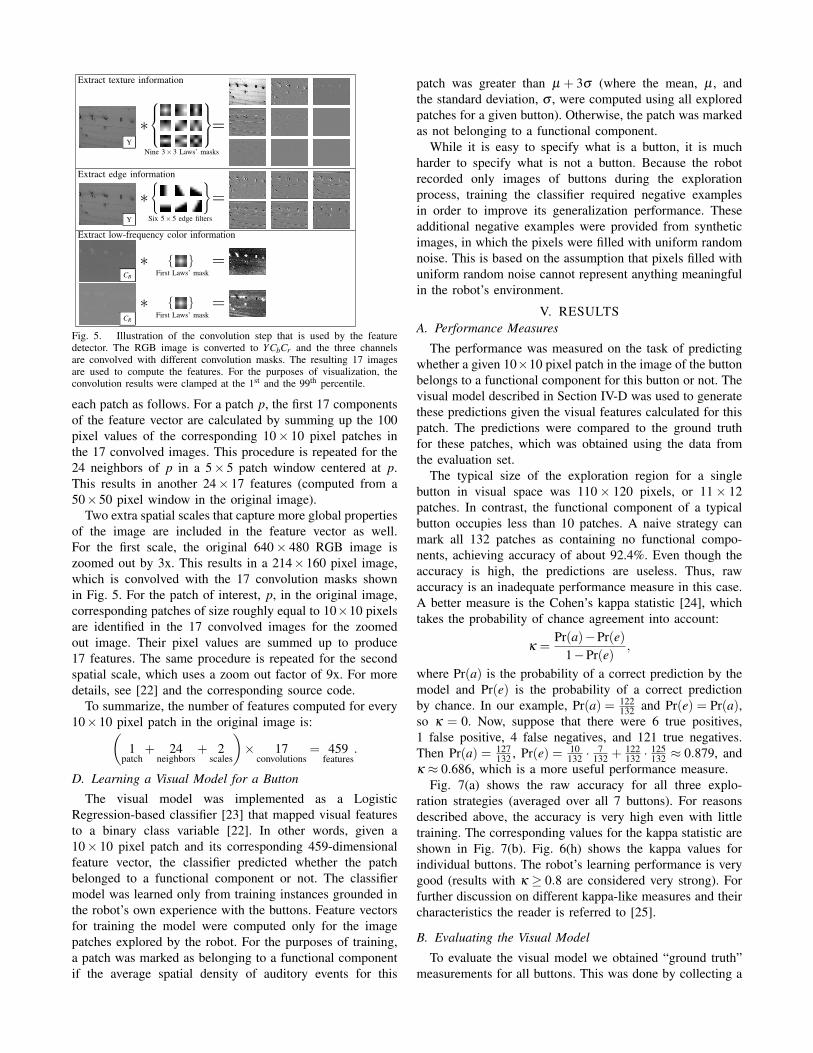
As the robot explored a button, it attempted to simultane-ously build a visual model that could detect the functionallymeaningful part of the button (i.e., the part that produces au-ditory feedback when pressed). The robot extracted featuresfrom the color image using the feature detector described in[22]. These features have been used successfully by a robotto detect grasp points in novel objects, which was one reasonwhy they were selected for this task.
The features aim to extract texture, edge, and low-frequency color information from the original RGB image,which is converted to YCbCr before further processing.Texture is extracted from the Y image, which is convolvedwith nine 3×3 Laws’ masks. Edge information is extractedalso from the Y image by convolving it with six 5×5 edgefilters. Finally, low-frequency color information is obtainedfrom the Cb and Cr images, which are convolved with the firstLaws’ mask. Fig. 5 shows this procedure, which results in 17images. These images are squared before the next operationsare performed on them to extract the features.
The original image is then partitioned into 10× 10 pixelpatches and a 459-dimensional feature vector is computed for
Y
∗ =Nine 3×3 Laws’ masks
Extract texture information
Extract edge information
Extract low-frequency color information
Y
∗ ={ }
Six 5×5 edge filters
CB
CR
∗ ={ }First Laws’ mask
∗ ={ }
First Laws’ mask
Fig. 5. Illustration of the convolution step that is used by the featuredetector. The RGB image is converted to YCbCr and the three channelsare convolved with different convolution masks. The resulting 17 imagesare used to compute the features. For the purposes of visualization, theconvolution results were clamped at the 1st and the 99th percentile.
each patch as follows. For a patch p, the first 17 componentsof the feature vector are calculated by summing up the 100pixel values of the corresponding 10× 10 pixel patches inthe 17 convolved images. This procedure is repeated for the24 neighbors of p in a 5× 5 patch window centered at p.This results in another 24× 17 features (computed from a50×50 pixel window in the original image).
Two extra spatial scales that capture more global propertiesof the image are included in the feature vector as well.For the first scale, the original 640× 480 RGB image iszoomed out by 3x. This results in a 214×160 pixel image,which is convolved with the 17 convolution masks shownin Fig. 5. For the patch of interest, p, in the original image,corresponding patches of size roughly equal to 10×10 pixelsare identified in the 17 convolved images for the zoomedout image. Their pixel values are summed up to produce17 features. The same procedure is repeated for the secondspatial scale, which uses a zoom out factor of 9x. For moredetails, see [22] and the corresponding source code.
To summarize, the number of features computed for every10×10 pixel patch in the original image is:(
1patch
+ 24neighbors
+ 2scales
)× 17
convolutions= 459
features.
D. Learning a Visual Model for a Button
The visual model was implemented as a LogisticRegression-based classifier [23] that mapped visual featuresto a binary class variable [22]. In other words, given a10× 10 pixel patch and its corresponding 459-dimensionalfeature vector, the classifier predicted whether the patchbelonged to a functional component or not. The classifiermodel was learned only from training instances grounded inthe robot’s own experience with the buttons. Feature vectorsfor training the model were computed only for the imagepatches explored by the robot. For the purposes of training,a patch was marked as belonging to a functional componentif the average spatial density of auditory events for this
patch was greater than µ + 3σ (where the mean, µ , andthe standard deviation, σ , were computed using all exploredpatches for a given button). Otherwise, the patch was markedas not belonging to a functional component.
While it is easy to specify what is a button, it is muchharder to specify what is not a button. Because the robotrecorded only images of buttons during the explorationprocess, training the classifier required negative examplesin order to improve its generalization performance. Theseadditional negative examples were provided from syntheticimages, in which the pixels were filled with uniform randomnoise. This is based on the assumption that pixels filled withuniform random noise cannot represent anything meaningfulin the robot’s environment.
V. RESULTSA. Performance Measures
The performance was measured on the task of predictingwhether a given 10×10 pixel patch in the image of the buttonbelongs to a functional component for this button or not. Thevisual model described in Section IV-D was used to generatethese predictions given the visual features calculated for thispatch. The predictions were compared to the ground truthfor these patches, which was obtained using the data fromthe evaluation set.
The typical size of the exploration region for a singlebutton in visual space was 110× 120 pixels, or 11× 12patches. In contrast, the functional component of a typicalbutton occupies less than 10 patches. A naive strategy canmark all 132 patches as containing no functional compo-nents, achieving accuracy of about 92.4%. Even though theaccuracy is high, the predictions are useless. Thus, rawaccuracy is an inadequate performance measure in this case.A better measure is the Cohen’s kappa statistic [24], whichtakes the probability of chance agreement into account:
κ =Pr(a)−Pr(e)
1−Pr(e),
where Pr(a) is the probability of a correct prediction by themodel and Pr(e) is the probability of a correct predictionby chance. In our example, Pr(a) = 122
132 and Pr(e) = Pr(a),so κ = 0. Now, suppose that there were 6 true positives,1 false positive, 4 false negatives, and 121 true negatives.Then Pr(a) = 127
132 , Pr(e) = 10132 ·
7132 + 122
132 ·125132 ≈ 0.879, and
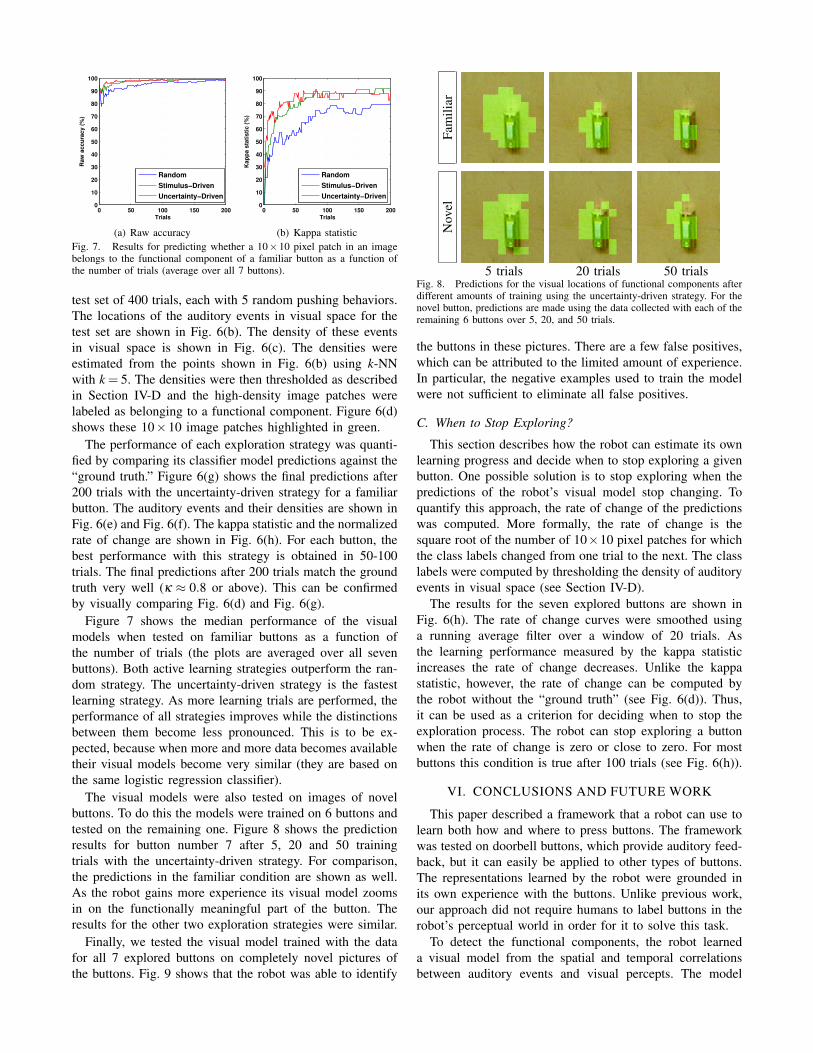
κ ≈ 0.686, which is a more useful performance measure.Fig. 7(a) shows the raw accuracy for all three explo-
ration strategies (averaged over all 7 buttons). For reasonsdescribed above, the accuracy is very high even with littletraining. The corresponding values for the kappa statistic areshown in Fig. 7(b). Fig. 6(h) shows the kappa values forindividual buttons. The robot’s learning performance is verygood (results with κ ≥ 0.8 are considered very strong). Forfurther discussion on different kappa-like measures and theircharacteristics the reader is referred to [25].
B. Evaluating the Visual Model
To evaluate the visual model we obtained “ground truth”measurements for all buttons. This was done by collecting a

gBut
tons
.g1 2 3 4 5 6 7
(a) The seven doorbell buttons explored by the robot.
(b) Auditory events localized in visual space. Each point corresponds to the location of the robot’s finger when the buzzer went off.
LO
HI
(c) Densities for the auditory events in visual space shown in (b), estimated using k-NN with k = 5.
T est
ing
set
used
for
eval
uatio
n(4
00ra
ndom
tria
ls).
(d) “Ground truth” about the visual positions of the functional components extracted by thresholding the densities shown in (c).
(e) Auditory events localized in visual space. Each point corresponds to the location of the robot’s finger when the buzzer went off.
LO
HI
(f) Densities for the auditory events in visual space shown in (e), estimated using k-NN with k = 5.
(g) Functional components for each button learned after 200 trials performed with the uncertainty-driven strategy.
T rai
ning
set
colle
cted
usin
g20
0tr
ials
ofth
eun
cert
aint
y-dr
iven
stra
tegy
.
0 50 100 150 200
0
20
40
60
80
100
0 50 100 150 200
0
20
40
60
80
100
0 50 100 150 200
0
20
40
60
80
100
0 50 100 150 200
0
20
40
60
80
100
0 50 100 150 200
0
20
40
60
80
100
0 50 100 150 2000
20
40
60
80
100
0 50 100 150 200
0
20
40
60
80
100
(h) Two measures of learning progress. The predictions after 200 trials are shown in (g). The “ground truth” is shown in (d).The kappa statistic(blue line, %) and the normalized smoothed rate of change(red line, %) are shown as functions of the number of trials.
Fig. 6. Summary of the experimental results for a familiar button. See text for more details.
0 50 100 150 2000
10
20
30
40
50
60
70
80
90
100
Trials
Ra
w a
cc
ura
cy
(%
)
Random
Stimulus−Driven
Uncertainty−Driven
(a) Raw accuracy
0 50 100 150 2000
10
20
30
40
50
60
70
80
90
100
Trials
Ka
pp
a s
tati
sti
c (
%)
Random
Stimulus−Driven
Uncertainty−Driven
(b) Kappa statisticFig. 7. Results for predicting whether a 10×10 pixel patch in an imagebelongs to the functional component of a familiar button as a function ofthe number of trials (average over all 7 buttons).
test set of 400 trials, each with 5 random pushing behaviors.The locations of the auditory events in visual space for thetest set are shown in Fig. 6(b). The density of these eventsin visual space is shown in Fig. 6(c). The densities wereestimated from the points shown in Fig. 6(b) using k-NNwith k = 5. The densities were then thresholded as describedin Section IV-D and the high-density image patches werelabeled as belonging to a functional component. Figure 6(d)shows these 10×10 image patches highlighted in green.
The performance of each exploration strategy was quanti-fied by comparing its classifier model predictions against the“ground truth.” Figure 6(g) shows the final predictions after200 trials with the uncertainty-driven strategy for a familiarbutton. The auditory events and their densities are shown inFig. 6(e) and Fig. 6(f). The kappa statistic and the normalizedrate of change are shown in Fig. 6(h). For each button, thebest performance with this strategy is obtained in 50-100trials. The final predictions after 200 trials match the groundtruth very well (κ ≈ 0.8 or above). This can be confirmedby visually comparing Fig. 6(d) and Fig. 6(g).
Figure 7 shows the median performance of the visualmodels when tested on familiar buttons as a function ofthe number of trials (the plots are averaged over all sevenbuttons). Both active learning strategies outperform the ran-dom strategy. The uncertainty-driven strategy is the fastestlearning strategy. As more learning trials are performed, theperformance of all strategies improves while the distinctionsbetween them become less pronounced. This is to be ex-pected, because when more and more data becomes availabletheir visual models become very similar (they are based onthe same logistic regression classifier).
The visual models were also tested on images of novelbuttons. To do this the models were trained on 6 buttons andtested on the remaining one. Figure 8 shows the predictionresults for button number 7 after 5, 20 and 50 trainingtrials with the uncertainty-driven strategy. For comparison,the predictions in the familiar condition are shown as well.As the robot gains more experience its visual model zoomsin on the functionally meaningful part of the button. Theresults for the other two exploration strategies were similar.
Finally, we tested the visual model trained with the datafor all 7 explored buttons on completely novel pictures ofthe buttons. Fig. 9 shows that the robot was able to identify
Fam
iliar
Nov
el
5 trials 20 trials 50 trialsFig. 8. Predictions for the visual locations of functional components afterdifferent amounts of training using the uncertainty-driven strategy. For thenovel button, predictions are made using the data collected with each of theremaining 6 buttons over 5, 20, and 50 trials.
the buttons in these pictures. There are a few false positives,which can be attributed to the limited amount of experience.In particular, the negative examples used to train the modelwere not sufficient to eliminate all false positives.
C. When to Stop Exploring?
This section describes how the robot can estimate its ownlearning progress and decide when to stop exploring a givenbutton. One possible solution is to stop exploring when thepredictions of the robot’s visual model stop changing. Toquantify this approach, the rate of change of the predictionswas computed. More formally, the rate of change is thesquare root of the number of 10×10 pixel patches for whichthe class labels changed from one trial to the next. The classlabels were computed by thresholding the density of auditoryevents in visual space (see Section IV-D).
The results for the seven explored buttons are shown inFig. 6(h). The rate of change curves were smoothed usinga running average filter over a window of 20 trials. Asthe learning performance measured by the kappa statisticincreases the rate of change decreases. Unlike the kappastatistic, however, the rate of change can be computed bythe robot without the “ground truth” (see Fig. 6(d)). Thus,it can be used as a criterion for deciding when to stop theexploration process. The robot can stop exploring a buttonwhen the rate of change is zero or close to zero. For mostbuttons this condition is true after 100 trials (see Fig. 6(h)).
VI. CONCLUSIONS AND FUTURE WORK
This paper described a framework that a robot can use tolearn both how and where to press buttons. The frameworkwas tested on doorbell buttons, which provide auditory feed-back, but it can easily be applied to other types of buttons.The representations learned by the robot were grounded inits own experience with the buttons. Unlike previous work,our approach did not require humans to label buttons in therobot’s perceptual world in order for it to solve this task.
To detect the functional components, the robot learneda visual model from the spatial and temporal correlationsbetween auditory events and visual percepts. The model

Fig. 9. After the visual model was trained with all 7 buttons, the robot was tested with images of the experimental fixture that it had never seen before.
was tested on the tasks of predicting the functional com-ponents of: 1) familiar buttons, and 2) novel buttons. Forfamiliar buttons, the performance was close to perfect. Fornovel buttons, the model was still able to find a decentapproximation based on the experience obtained with otherbuttons. For both novel and familiar buttons, the performanceimproved as the robot obtained more experience. In a way,the trained visual model acted like an affordance detector asit was able to label patches in as “pushable there”.
The visual model can also be used by the robot to decidewhen to stop exploring a button. The rate of change inthe predictions of the model can serve as a measure oflearning progress. The robot can stop the exploration whenthe predictions of the model stop changing. In other words,the can could stop when pressing the button any furtherwould not help improve the visual model for detecting it.
In general, we found that the button pressing task is neithertoo easy nor too difficult. Our robot learned to press buttonsin 50-100 trials. The visual model for what a button lookslike was also learned (and converged) in 50-100 trials. Itperformed well for both familiar and novel buttons.
Future work can add feedback from touch sensors to theframework, which already supports audio and video. Thenext generation BarrettHand (BH8-280), which has 96 tactilesensors, should make this a feasible option for our robot.Another possibility is to include the physical resistance of abutton as one of its properties. Currently we are exploringwhether the resistance of a button during its small traveldistance (1- 2mm) can be detected reliably by the WAM.
At present, the exploration strategies do not take intoaccount the predictions of the visual model. The frameworkcan be extended to incorporate the patch-based representationinto the selection of the next pushing behavior.
The mechanism for detecting events in the current frame-work is engineered for very specific types of auditoryand proprioceptive events: the buzzer sound and high jointtorques. The events are mapped to vision using the colortracking of a marker on the robotic fingertip. Future workcan replace these mechanisms with more general modelsfor detecting, categorizing, and matching events in differentmodalities with the robot’s actions.
Finally, the framework can be extended to handle othersmall widgets, including: light switches, elevator buttons,sliders, and levers. One possible challenge task for a robotwould be to learn how to manipulate the widgets on a novelinstrument panel.
REFERENCES
[1] J. Miura, K. Iwase, and Y. Shirai, “Interactive teaching of a mobilerobot,” in Proc. of ICRA, 2005, pp. 3378–3383.
[2] K.-T. Song and T.-Z. Wu, “Visual servo control of a mobile manipula-tor using one-dimensional windows,” in Proc. of Industrial ElectronicsSociety, vol. 2, 1999, pp. 686–691.
[3] E. Klingbeil, B. Carpenter, O. Russakovsky, and A. Ng, “Autonomousoperation of novel elevators for robot navigation,” in Proc. of ICRA,2010, pp. 751–758.
[4] R. Katsuki et al., “Handling of objects with marks by a robot,” inProc. of IROS, vol. 1, 27-31 2003, pp. 130 – 135.
[5] H. Nguyen, T. Deyle, M. Reynolds, and C. Kemp, “PPS-tags: Physical,Perceptual and Semantic tags for autonomous mobile manipulation,”in Proc. of the IROS Workshop on Semantic Perception for MobileManipulation, 2009.
[6] A. Thomaz, “Socially guided machine learning,” Ph.D. dissertation,Massachusetts Institute of Technology, 2006.
[7] A. Baranes and P.-Y. Oudeyer, “R-IAC: Robust intrinsically motivatedactive learning,” in Proc. of ICDL, 2009.
[8] A. Barto, “Intrinsically motivated learning of hierarchical collectionsof skills,” in Proc. of ICDL, 2004, pp. 112–119.
[9] F. Kaplan and P.-Y. Oudeyer, “Motivational principles for visual know-how development,” in Proc. of the 3rd Intl. Workshop on EpigeneticRobotics, no. 101. Lund Univ. Cognitive Studies, 2003, pp. 73–80.
[10] M. Salganicoff, L. Ungar, and R. Bajcsy, “Active learning for vision-based robot grasping,” Machine Learning, vol. 23, no. 2-3, pp. 251–278, 1996.
[11] L. Montesano and M. Lopes, “Learning grasping affordances fromlocal visual descriptors,” in Proc. of ICDL. Los Alamitos, CA, USA:IEEE Computer Society, 2009, pp. 1–6.
[12] A. Morales and E. Chinellato, “Active learning for robot manipula-tion,” in Proc. of the European Conference on AI, 2004, pp. 905–909.
[13] O. Kroemer, R. Detry, J. Piater, and J. Peters, “Active learning usingmean shift optimization for robot grasping,” in Proceedings of IROS,2009, pp. 2610–2615.
[14] V. Sukhoy, J. Sinapov, L. Wu, and A. Stoytchev, “Learning to pressdoorbell buttons,” in Proc. of ICDL, 2010, pp. 132–139.
[15] E. Gibson, “Exploratory behavior in the development of perceiving,acting, and the acquiring of knowledge,” Annual review of psychology,vol. 39, no. 1, pp. 1–42, 1988.
[16] P. Hauf, G. Aschersleben, and W. Prinz, “Baby do-baby see!: Howaction production influences action perception in infants,” CognitiveDevelopment, vol. 22, no. 1, pp. 16 – 32, 2007.
[17] P. Hauf and G. Aschersleben, “Action-effect anticipation in infantaction control,” Psych. Research, vol. 72, no. 2, pp. 203–210, 2008.
[18] J. Piaget, The origins of intelligence in children. Intl. Univ. P., 1952.[19] J. Cleary and L. Trigg, “K∗: An instance-based learner using an
entropic distance measure,” in Proc. of ICML, 1995, pp. 108–114.[20] L. Wu, V. Sukhoy, and A. Stoytchev, “Toward learning to press
doorbell buttons,” in Proc. of AAAI, 2010, pp. 1965–1966.[21] R. Duda, P. Hart, and D. Stork, Pattern classification, 2nd ed. Wiley,
2001.[22] A. Saxena, J. Driemeyer, and A. Y. Ng, “Robotic grasping of novel
objects using vision,” The International Journal of Robotics Research,vol. 27, no. 2, pp. 157–173, 2008.
[23] S. le Cessie and J. van Houwelingen, “Ridge estimators in logisticregression,” Journal of the Royal Statistical Society. Series C (AppliedStatistics), vol. 41, no. 1, pp. 191–201, 1992.
[24] J. Cohen, “A coefficient of agreement for nominal scales,” Educationaland Psychological Measurement, vol. 20, no. 1, pp. 37–46, April 1960.
[25] K. Gwet, Handbook of Inter-Rater Reliability, 2nd ed. AdvancedAnalytics, 2010.