learning to make specific predictions using slow feature analysis
TRANSCRIPT
Learning to make specific predictions using Slow Feature
Analysis
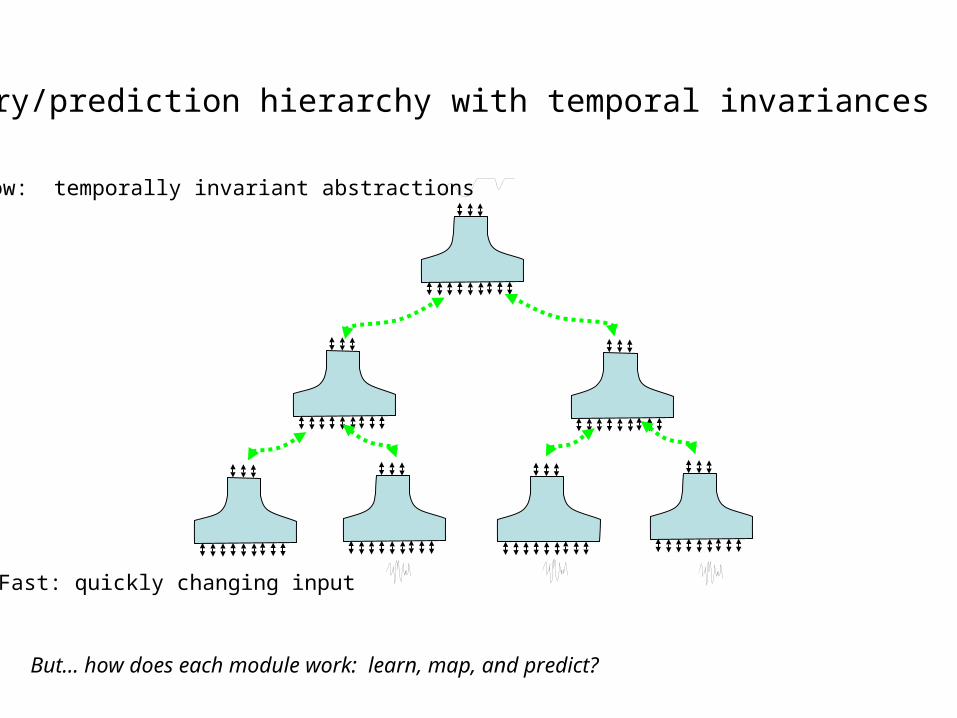
Slow: temporally invariant abstractions
Fast: quickly changing input
Memory/prediction hierarchy with temporal invariances
But… how does each module work: learn, map, and predict?
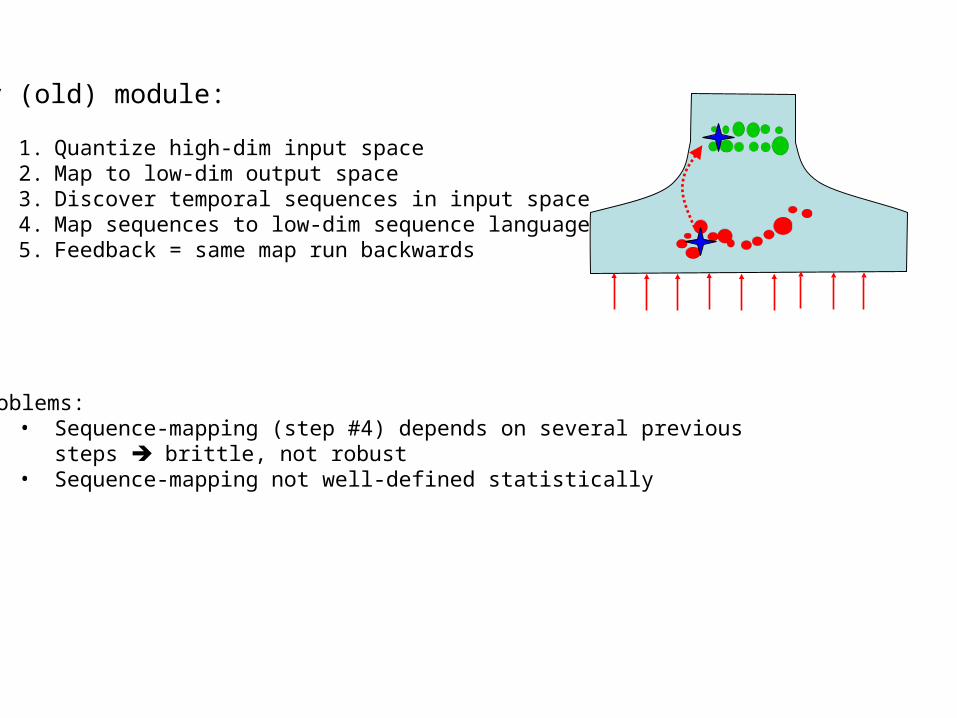
My (old) module:
1. Quantize high-dim input space2. Map to low-dim output space3. Discover temporal sequences in input space4. Map sequences to low-dim sequence language5. Feedback = same map run backwards
Problems: • Sequence-mapping (step #4) depends on several previous
steps brittle, not robust• Sequence-mapping not well-defined statistically

Pro’s of SFA: •Nearly guaranteed to find some slow features•No quantization •Defined over entire input space•Hierarchical “stacking” is easy•Statistically robust building blocks (simple polynomials, Principal Components Analysis, variance reduction, etc)
a great way to find invariant functions invariants change slowly, hence easily predictable
New module design: Slow Feature Analysis (SFA)

BUT…
….No feedback!
• Can’t get specific output from invariant input
• It’s hard to take a low-dim signal and turn it into the right high-dim one (underdetermined)
Here’s my solution (straightforward, probably done before somewhere):
Do feedback with separate map

First, show it working…… then, show how & why
Input space: 20-dim “retina”Input shapes: Gaussian blurs (wrapped) of 3 different widths Input sequences: constant-velocity motion (0.3 pixels/step)
T = 0
…T=2…
T=4
T = 23
…T=25
…
T=27
Pixel 21 = pixel 1

Sanity-check: slow features extracted match generating parameters:
“What”
“Where”
Gaussian std dev.
Gaussian center pos’n
Slow feature #1
Slow feature #2
(… so far, this is plain vanilla SFA, nothing new…)

T = 0
…T=2…
T=4
T=5
New contribution: Predict all pixels of next image, given previous images…
? ? ? ? ? ? ? ? ? ? ? ? ? ? ? ? ? ? ? ?
Reference prediction is to use previous image (“tomorrow’s weather is just like today’s”)
T=4
T=5
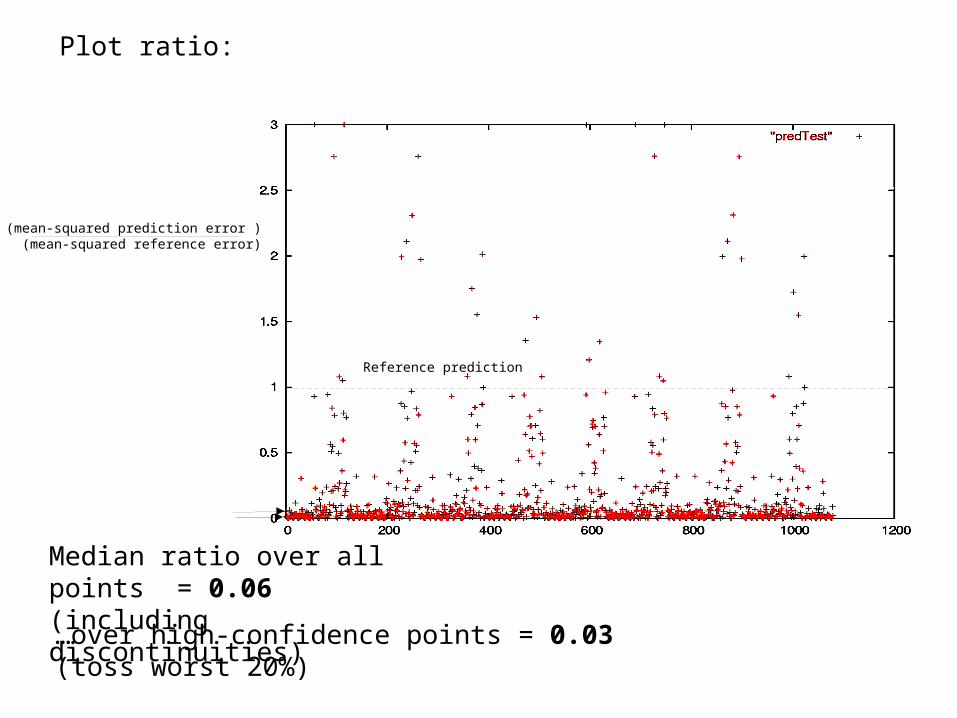
Plot ratio:
Median ratio over all points = 0.06(including discontinuities)
…over high-confidence points = 0.03(toss worst 20%)
Reference prediction
(mean-squared prediction error ) (mean-squared reference error)
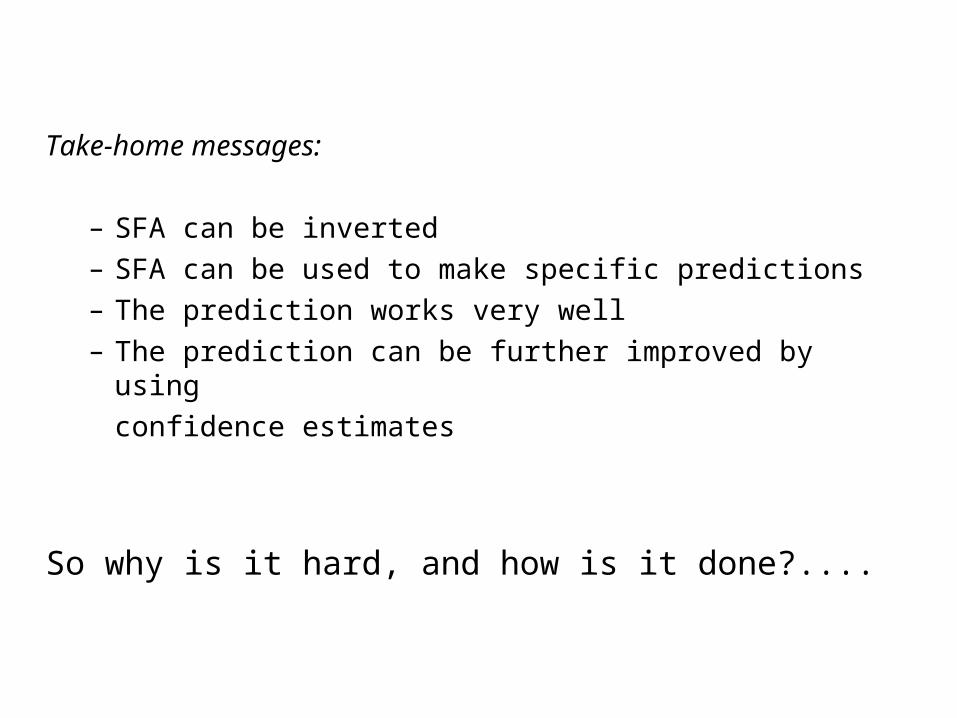
Take-home messages:
– SFA can be inverted– SFA can be used to make specific predictions– The prediction works very well– The prediction can be further improved by using
confidence estimates
So why is it hard, and how is it done?....

Why it’s hard:
High-dim: x1 x2 x3 ……………………………………………..…………………..x20
Low-dim slow features: S1 = 0.3 x1 + 0.1 x12 + 1.4 x2 x3 + 1.1 x42 +…. + 0.5 x5 x9 + …
But given S1 = 1.4 S2 = -0.33
x1= ?x2=?x3=?x4=?x5=?x6=?
.
.
.x20=?
•Infinitely many possibilities of x’s•Vastly under-determined•No simple polynomial-inverse formula (e.g. “quadratic formula”)
easy
HARD
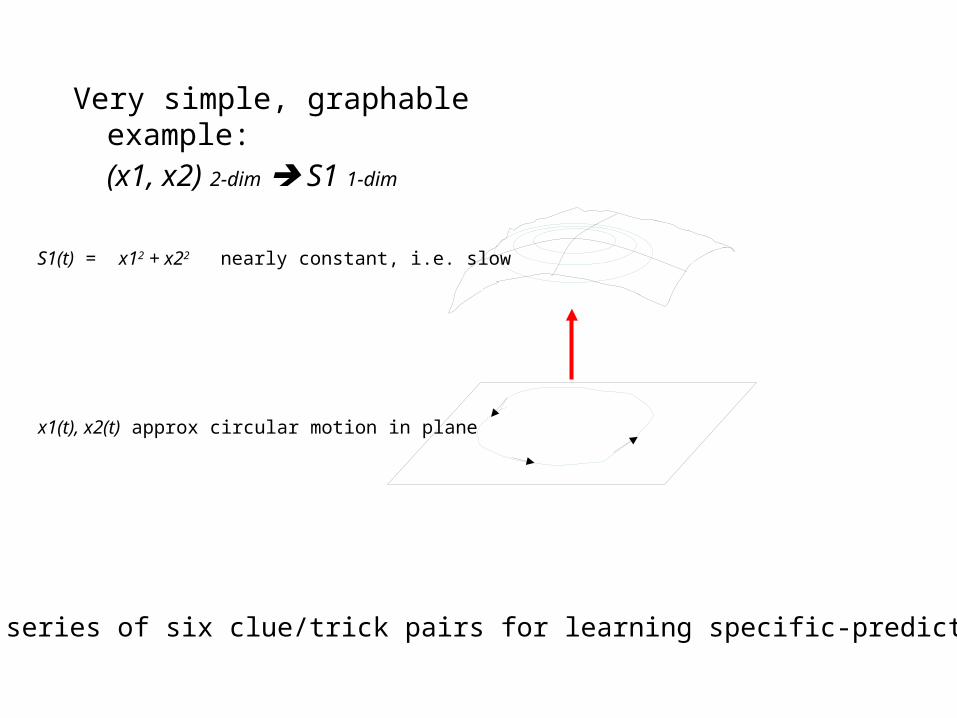
Very simple, graphable example: (x1, x2) 2-dim S1 1-dim
x1(t), x2(t) approx circular motion in plane
S1(t) = x12 + x22 nearly constant, i.e. slow
Illustrate a series of six clue/trick pairs for learning specific-prediction mapping

Clue #1: The actual input data is a small subset of all possible input data (i.e. on a “manifold”)
Trick #1: Find a set of points which represent where the actual input data is
≠
20-80 “anchor points” Ai
(Found using k-means, k-medoids, etc. This is quantization, but only for feedback)
actual possible

Clue #2: The actual input data is not distributed evenly about those anchor-points
Trick #2: Calculate covariance matrix Ci of data around Ai
yes no
data Eigenvectors of Ci

Clue #3: S(x) is locally linear about each anchor point
Trick #3: Construct linear (affine) Taylor-series mappings SLi approximating S(x) about each Ai
(NB: this doesn’t require polynomial SFA, just differentiable)

Clue #4: Covariance eigenvectors tell us about the local data manifold
Trick #4:1. Get SVD pseudo-inverse X = SLi
-1(Snew – S(Ai))
2. Then stretch X onto manifold by multiplying by chopped* Ci
Good news: Linear SLi can be pseudo-inverted (SVD)Bad news: We don’t want any old (x1,x2), we want (x1,x2) on the data manifold
Snew
S(Ai)
S
X
X
…stretch…
Stretched X
* Projection matrix, keeping only as many eigenvectors as dimensions of S

Good news: Given Ai and Ci, we can invert Snew Xnew
Bad news: How do we choose which Ai and SLi-1 to
use?
?
?
?These three all have the
same value of Snew
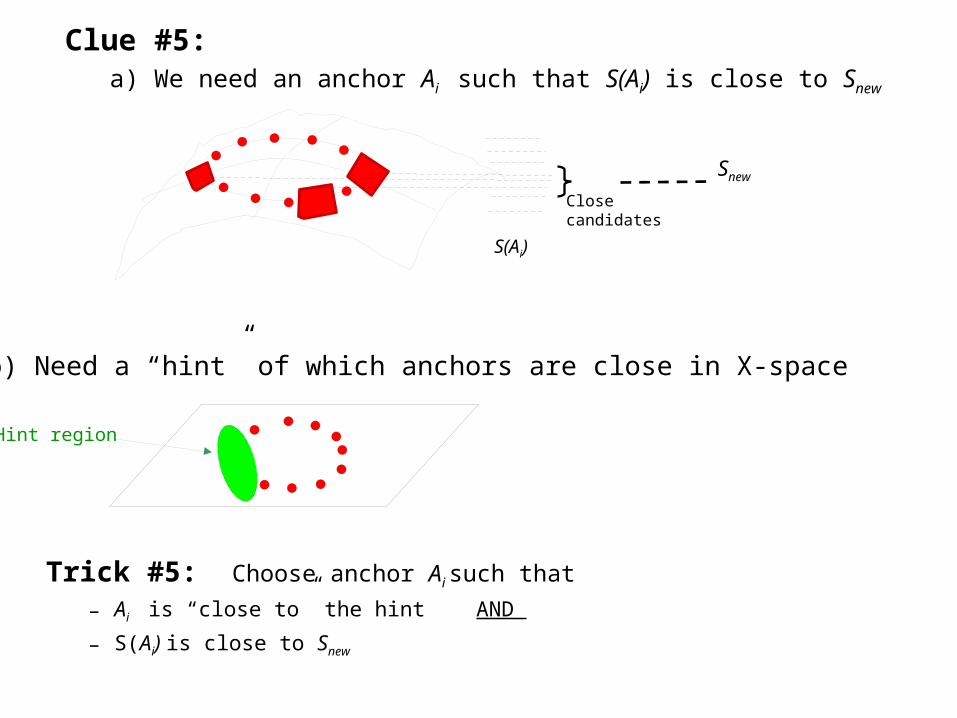
Clue #5: a) We need an anchor Ai such that S(Ai) is close to Snew
Trick #5: Choose anchor Ai such that
– Ai is “close to” the hint AND
– S(Ai) is close to Snew
Snew
S(Ai)
Close candidates
b) Need a “hint” of which anchors are close in X-space
Hint region

All tricks together:
Map local linear inverse about each anchor point
Anchors +
S(Ai) neighbors x

Clue #6: The local data scatter can decide if a given point is probable (“on the manifold”) or not
Trick #6: Use Gaussian hyper-ellipsoid probabilities about closest Ai (this can tell if a prediction makes sense or not)
probable
improbable
probable
improbable

Estimated uncertainty increases away from anchor points
-log(P)

Summary of SFA inverse/prediction method:
We have X(t-2), X(t-1), X(t)… we want X(t+1)
1. Calculate slow features
S(t-2), S(t-1), S(t)
St
2. Extrapolate that trend linearly to Snew (NB: S varies slowly/smoothly in time)
St
3. Find candidate S(Ai)’s close to Snew
Snew
Snewall S(Ai)
e.g. candidate i = {1, 16, 3, 7}

Summary cont’d
4. Take X(t) as “hint,” and find candidate Ai’s close to it
5. Find “best” candidate Ai , whose index is high on both candidate lists:
e.g. candidate i = {8, 3, 5, 17}
S(Ai)’s close to Snew Ai close to X(t)
i i
1 8
16 3
3 5
6 17

6. Use chosen Ai and pseudo-inverse
(i.e. SLi-1(Snew – S(Ai) ) with SVD) to get X
S(Ai)
X
X
…stretch…
Stretched X
7. Stretch X onto low-dim manifold using chopped Ci
8. Add stretched X back onto Ai to get final prediction
Stretched X
Ai

9. Use covariance hyper-ellipsoids to estimate confidence in this prediction
probable
improbable
This method uses virtually everything we know about the data; any improvements presumably would need further clues…– Discrete sub-manifolds– Discrete sequence steps– Better nonlinear mappings

Next steps
• Online learning – Adjust anchor points and covariance as new data arrive
– Use weighted k-medoid clusters to mix in old with new data
• Hierarchy– Set output of one layer as input to next
– Enforce ever-slower features up the hierarchy
• Test with more complex stimuli and natural movies• Let feedback from above modify slow feature polynomials• Find slow features in the unpredicted input (input – prediction)