learning to perceive a smaller l2 vowel inventory: an
TRANSCRIPT

�1�
Learning to perceive a smaller L2 vowel inventory:an Optimality Theory account
Paul Boersma, University of Amsterdam
Paola Escudero, Utrecht University
September 6, 2004
This paper gives an Optimality-Theoretic formalization of several aspects of theacquisition of phonological perception in a second language. The subject matter will bethe acquisition of the Spanish vowel system by Dutch learners of Spanish, as evidencedin a listening experiment. Since an explanation of the learners� acquisition path requiresknowledge of both the Dutch and the Spanish vowel system, the 12 Dutch and 5Spanish vowels are presented in Figure 1. Along the vertical axis we find the auditorycorrelate of perceptual vowel height (first formant, F1), and along the horizontal axisthe auditory correlate of perceptual vowel backness (second formant, F2), whosearticulatory correlates are tongue backness and lip rounding. A third auditorydimension, duration, is implicit in the length sign (�!�) used for 4 of the 12 Dutchvowels.
i u
e o
a
a˘A
ε
çI
Ye˘ ø˘
o˘
i y u300
400
500
600
800
1000
50010001500200025003000F2 (Hz)
F1 (
Hz)
Fig.1. The 5 Spanish vowels (circled) amidst the 12 Dutch vowels.
To control for speaker-dependent vocal tract dimensions, we based the two sets offormant values in Figure 1 on the speech of a single speaker, a perfect Spanish-Dutchbilingual (moved to the Netherlands when she was 12, currently a teacher of Spanishspeaking proficiency at the University of Amsterdam, with no noticeable foreign accentin either Dutch or Spanish). We see the usual features of the Dutch vowel system: /i/,/y/ and /u/ at the same height, /e!/ and /ø!/ at the same height, /"/ and /#/ at the same

�2�
height, /!/ more open than /"/, /#/ more open than /!/ but somewhat closer than /a$/.As for most speakers of Dutch, /a$/ is front and /#/ is back. As for many speakers, /%/and /&/ are a bit lower than /e$/ and /ø$/. The height of /"/ shows that this speaker isfrom one of those large areas that merge the reflexes of both historical /"/ and /'/ intoa single relatively high variant at the height of /%/ and /&/ (if this had been true of allspeakers of Dutch, a better symbol for this phoneme would have been /'/). A moreidiosynchratic feature of the speaker�s regional accent is the low position in the chart ofthe vowel /o$/, which is due to its large degree of diphthongization (i.e., the three highermid vowels are pronounced [ei], [øy], ["u]). As for this speaker�s Spanish vowelsystem, we see that /a/ is rather front, that /e/ and /o/ are not close to any Dutchvowel, and that the extent of the Spanish vowel space is somewhat smaller than that ofthe Dutch vowel space, with a notable centralization of /o/. The patterns are compatiblewith what is known about Dutch (Pols, Tromp & Plomp 1973; Koopmans-Van Beinum1980), about Spanish (Bradlow 1995, 1996), and about the crosslinguistic correlationbetween the size of a language�s auditory vowel space and the size of its vowelinventory (Liljencrants & Lindblom 1972, Lindblom 1986).
1. Ease and difficulty for Dutch learners of Spanish vowelsFor Dutch learners of Spanish who want to master the Spanish vowel system, there issomething easy as well as something difficult about it. The ease lies in creating lexicalrepresentations for Spanish vowels, while the difficulty lies in perception, i.e. in themapping from raw auditory data to discrete representations that can be used for lexicalaccess.
1.1. Easy: lexical symbols for L2 vowels
When native speakers of Dutch learn to use the vowel system of the Spanish language,they seem to have the advantage that the target language has fewer vowels than theirnative language, so that they have the option of reusing a subset of their native vowelcategories for the storage of Spanish lexemes. The phonological representations ofentries in the Spanish lexicon can get by with only five vowel categories, which we willdenote as |a|S, |e|S, |i|S, |o|S, and |u|S (in our notations, underlying forms are given withinpipes, and subscript S is used for structures in the minds of native speakers of Spanish).Thus, the lexical representation of the word centrifugado �centrifugated� is|(ent)ifu*a+o|S for native speakers of (European) Spanish. Native speakers of Dutchhave to maintain at least 12 vowel categories in their native lexical representations: |#|D,|a$|D, |!|D, |%|D, |e$|D, |i|D, |&|D, |ø$|D, |y|D, |"|D, |o$|D, |u|D (subscript D for structures in theminds of native speakers of Dutch). When learning Spanish, then, they could simplyreuse five of these for representing their L2 Spanish lexemes; no category split, nocategory creation would be necessary. As we will see when discussing the results of ourlistening experiment, this is what the learners indeed seem to do. The followingsimplified list shows which Dutch vowels are reused for which Spanish vowels in theinterlanguage:

�3�
(1) Identification of lexical symbols for Dutch learners of Spanish
|!|D � |a|S|"|D � |e|S|i|D � |i|S|#|D � |o|S|u|D � |u|S
Note that this identification does not describe the knowledge of the learners; rather, it isan observation that we as linguists can infer from experimental tasks. The identificationin (1) means, for instance, that the Dutch learner�s underlying representation of Spanishcentrifugado is |$"nt%ifu&!d#|D. Also note that our use of vowel symbols is not meant tosuggest crosslinguistic identity: |u|D is not in any sense more similar to |u|S than |!|D is to|!|S.
1
1.2. Difficult: perceptual boundaries of L2 vowels
While the reuse of existing categories is advantageous in itself, there is an additionalgain in the identifications in (1), which are far from arbitrary. These identificationsseem largely based on language-specific perceived (auditory and structural) similarity.Typical tokens of an intended native Spanish |a|S, for instance, tend to sound like theshort somewhat front open vowel [a] or [a ']. The spectral quality (F1 and F2) of thesetokens is close to that of typical tokens of Dutch |a(|D, which sound like the long frontvowel [a(]; the duration of these tokens, however, is close to that of typical tokens ofDutch |!|D, which sound like the slightly rounded low back vowel [!)]. Since Dutchlisteners, when having to categorize sounds in the [a]-[!)]-[!)(]-[a(] region, weight theduration cue much higher than the spectral cues (Gerrits 2001: 89), they will classify theSpanish [a]-like tokens as /!/D rather than as /a(/D.2 Another option is to perceive thesetokens as /"/D, whose typical realizations in Dutch sound like the open mid front vowel["]. In the listening experiment partly discussed below we found that non-Spanish-learning speakers of Dutch perceived Spanish |a|S as /!/D 60 percent of the time, as /"/D
27 percent of the time, and as |a(|D 4 percent of the time. So it seems that perceivedsimilarity, with duration as the main determining cue, largely explains theidentifications in (1).3
So why would learners choose to base their identifications on perceived similarity,i.e. what advantage does it give them to reuse Dutch categories whose auditorydistributions include the most typical tokens of the Spanish correspondents, as in (1)?To answer this, we have to consider what is involved in the listener�s comprehensiontask, i.e. her mapping from auditory information to lexical representations that make
1 Nor less similar. A theory of phonology that regards all vowels as a combination of innate (hencecrosslinguistically identical) phonological feature values may even consider every vowel at the left in (1)as identical to its counterpart at the right.2 We use slashes (�/�) for perceived phonological surface representations. We assume that theserepresentations consist of the same kinds of discrete arbitrary symbols as lexical representations, becausethe task of the perception process is to turn raw auditory data into discrete representations that aremaximally suited for lexical access. See (2) for an explicit model.3 Deeper mechanisms than perceived similarity may play a role as well, such as choosing categories thatare peripheral in the L1, in order to improve production in such a way that other listeners� comprehensionimproves. This may contribute to linking |a|S to |!|D rather than to |"|D.

�4�
contact with meaning. In several theories of phonological comprehension (for anoverview, see McQueen & Cutler 1997 and McQueen, in press), the process consists oftwo sequential levels, which can be called perception and recognition:
(2) Two-stage comprehension model
perception recognitionauditory
!phonological
!lexical
representation representation representation
e.g. [kæso] /k!s"/D |k#s"|D �case�
The advantage of reusing lexical categories now becomes clear: the learner will exhibitsome initial proficiency in her comprehension, at least if she transfers the perceptionsystem (the mapping from auditory to phonological representations) to herinterlanguage system as well. Suppose, for instance, that the learner is in a stage atwhich she has already correctly stored the Spanish words |kaso|S �case� and |keso|S�cheese� into her interlanguage lexicon as |k#s"|D �case� and |k!s"|D �cheese�. A hundrednative tokens of an intended |kaso|S will have a distribution of vowel formants (for the|a|S part) that is centred around values that are typical of a low front vowel. Dutchmonolinguals may hear 60 of these vowel tokens as /#/D, 27 as /!/D. If learners transferthis perception to their interlanguage, they will perceive 60 instances of |kaso|S as/k#s"/D, 27 as /k!s"/D. In the majority of the cases, then, a beginning learner willperceive /k#s"/D, with which the lexical item |k#s"|D �case� can be retrieved quiteeasily. Thus, comprehension is well served by an initial transfer of native perception(which presupposes an initial transfer of native lexical symbols) to the interlanguage.
But an interlanguage perception system that is identical to the native perceptionsystem is not perfect yet. In the example above, 27 percent of intended |kaso|S tokens,perhaps the most fronted and raised ones, will be perceived as /k!s"/D, from which it isnot so easy to retrieve the lexical item |k#s"|D �case�.4 To improve, the learner will haveto learn to perceive tokens in the [æ] region as /#/D rather than as /!/D when listening toSpanish. Preferably, though, tokens in that same region should continue to be perceivedas /!/D if the learner is listening to Dutch. The following table sums up the ways inwhich [æ] would then be perceived in the five cases we discussed:
(3) Five perceptions of [æ]
Monolingual Spanish: [æ] ! /a/S
Monolingual Dutch: [æ] ! /!/D
Beginning learners when listening to Spanish: [æ] ! /!/D (transfer)Proficient learners when listening to Spanish : [æ] ! /#/D (native-like)All learners when listening to Dutch: [æ] ! /!/D (double perception systems)
The situation in (3) would require a duplication of the learner�s perception system,where the interlanguage perception system starts out as a clone of the native perceptionsystem but subsequently develops towards something more appropriate for the 4 In OT terms, having to map a perceived /k!s"/ to an underlying |k#s"| can be said to involve afaithfulness violation in the recognition grammar (Boersma 2001).

�5�
comprehension of the target language. The experiment described below, in which weshow that Dutch learners of Spanish exhibit different perceptual behaviour when theythink they are listening to Dutch than when they think they are listening to Spanish,provides evidence for two separate perception systems in L2 learners.
1.3. The listening experiment: method
The method (stimulus material, subjects, tasks) was described before in Escudero &Boersma (2002). We repeat here only what is relevant for the present paper.
Stimulus material. The same bilingual speaker as in Figure 1 read aloud a Spanishtext, from which we cut 125 CVC (consonant-vowel-consonant) tokens. The consonantswere selected in such a way that each of the 125 CVC tokens could pass for a licitDutch syllable (apart from the vowel).
Subjects. 38 Dutch learners of Spanish performed the three tasks bescribed below.The learners were from various parts of the Netherlands, so that their vowel systemsmay differ from the one in Figure 1 mainly in the location of /!/ (which for manyspeakers has [!]- and ["]-like positional variants) and in the location of /o#/ (which formany speakers has the same degree of diphthongization, and the same height, as /e#/and /ø#/). There were two control groups: 11 Dutch non-learners of Spanish performedthe first and second tasks only, and 44 native speakers of Spanish performed the thirdtask only.
First task. In the first task the subjects were told that they were going to listen to anumber of Dutch vowels and had to classify them into the Dutch classes /$/, /a#/, /%/,/&/, /e#/, /i/, /'/, /ø#/, /y/, /!/, /o#/, /u/. But the subjects actually heard a randomizedset of the 125 Spanish tokens. To enhance the Dutch perception mode, the tokens wereinterspersed with 55 CVC tokens that were cut from a Dutch text spoken by the samebilingual speaker; these included tokens with very Dutch vowels and consonants, oftencorresponding to a recognizable Dutch word, e.g. /(ø#s/ �really�. The 180 CVC tokenswere also embedded within a Dutch carrier phrase (luister naar...).
Second task. The second task differed from the first only in the perception mode thatwe wanted to bring the subjects in. So we told the subjects (correctly, this time) thatthey were going to listen to Spanish vowels, and we interspersed the 125 CVC tokens(which were the same as in the first task) with 55 very Spanish-sounding tokens (e.g./ro)/) and embedded the 180 stimuli within a Spanish carrier phrase (la palabra...).Importantly, though, we told the listeners to try to �listen with Dutch ears� to thesestimuli and to classify the 180 tokens into the 12 Dutch vowel classes.
Third task. The third task differed from the second only in that we told the listenersto listen with Spanish ears and to classify the 180 tokens into the 5 Spanish vowelclasses. This task, then, simply tested the learners� proficiency in the perception of thetarget language.
1.4. The listening experiment: results
When the subjects thought that the language they heard was Dutch (Task 1), theyresponded differently from when they thought the language was Spanish (Task 2): theyturned out not to be able to completely �listen with Dutch ears� in Task 2. For details,see Escudero & Boersma (2002). We now describe the three main differences betweenthe results of the two tasks. In Task 2, the 38 listeners avoided responding with �&�.

�6�
Although most tokens that were scored as �!� in the first task were still scored as �!� inthe second (namely 599), many tokens that were scored as �!� in the first task werescored as �i� or �"� in the second (namely, 120 and 101, respectively). The reverse driftwas much smaller: the number of tokens that were scored as �i� or �"� in the first taskbut as �!� in the second were only 27 and 57, respectively. Since the differencesbetween 120 and 27 and between 101 and 57 are significantly greater than zero (p < 10-
14 and p < 0.001, respectively), we can reliably say that the listeners shied away from the�!� response in the second task. The learners showed an analogous behaviour for �#�responses, which were avoided in the second task, where many of them were replacedwith �u� and �$� responses. A third reliable effect was the shift of the �%� response:many tokens that were scored as �"� when the listeners were fooled into thinking theywere Dutch were scored as �%� when the listeners knew they were Spanish, and manytokens that were scored as �%� in the first task were scored as �$� in the second. Finally,the long vowels �a&�, �e&�, �o&� and �ø&� were generally avoided in the responses.
The learners showed developmental effects. The degree of �!� avoidance in Task 2relative to Task 1 correlated with the experience level of the learners (who were dividedinto 11 beginners, 18 intermediate, and 9 advanced on the basis of a languagebackground questionnaire) as well as with the perceptual proficiency level as measuredin Task 3 (Escudero & Boersma 2002).
1.5. The listening experiment: interpretation
The case with the �%� responses in the first and second task shows that the learnersreused their Dutch /%/D category for perceiving Spanish /a/S. The mechanism is asfollows:
(4) Separate language modes
Language mode Token Perception ResponseDutch [æ] /"/D �"�
Spanish [æ] /%/D �%�
For the Spanish vowel /i/S, which could in principle have been identified with Dutch/!/D or with Dutch /i/D, the avoidance of �!� in the second task shows that in factSpanish /i/S was identified with Dutch /i/D. This shows that (1) is correct. Theavoidance of the four long vowels in both the first and second tasks confirms theexpectation mentioned in §1.2 that duration is a strong auditory cue that can overrideany spectral similarity.
The developmental effects can be explained by an initial transfer of the nativeperception system to the interlanguage, followed by lexicon-guided learning. Thus, theDutch-appropriate perception of [æ ] as /"/D is transferred to the initial state of thelearner�s interlanguage, so that a beginning Dutch learner of Spanish will perceive [æ]as /"/D, regardless of whether she listens to Dutch or to Spanish. When she is listeningto Spanish, however, the lexicon will often issue an error message. If the learnerperceives an incoming [kæso] as /k"s$/D, for instance, the recognition system may haveto map this perception to the lexical item |k%s$|D �case�, in which case the lexicon can�tell� the perception system to modify itself in such a way that a /k%s$/D perception

�7�
becomes more likely in the future. Both the perception system and lexicon-guidedlearning are formally modelled in the following sections.
2. An explicit phonological model of perceptionPerception researchers agree that perception, i.e. the mapping from auditory tophonological representations, is a language-dependent process for all speakers fromabout 9 months of age (Werker & Tees 1984; Jusczyk, Cutler & Redantz 1993; Polka &Werker 1994). This language dependence is enough reason for us as linguists to want tomodel perception by linguistic means, e.g. to model it by Optimality-Theoreticconstraint ranking, as has been done before by Tesar (1997, 1998),5 Tesar & Smolensky(2000), Boersma (1997, 1998, 1999, 2000), Hayes (2001), Escudero & Boersma (2003,2004), Broselow (2003), Pater (2004), and Apoussidou & Boersma (2003, 2004). In ourspecial case of L2 acquisition, perception can depend on the language that learners thinkthey are listening to: the likelihood of mapping [æ] to the Dutch lexical vowel symbol/!/D depends on whether the learner think she hears Dutch (more likely) or Spanish(less likely), as we mentioned in §1.4. We therefore model the behaviour of the learnerwith two separate perception grammars, one for their Dutch perception, which does notchange during their learning of Spanish, and one for their Spanish perception, whichstarts out as a clone of their Dutch perception grammar and subsequently developstowards a more Spanish-appropriate grammar by the lexicon-driven optimization weintroduced in §1.5.
2.1. Tableaus and constraints that model perception
Optimality-Theoretic perception grammars use the same decision scheme as the moreusual Optimality-Theoretic production grammars. Whereas a production grammar takesan underlying lexical representation as its input and yields a pronunciation or surfacestructure as its output (Prince & Smolensky 1993, McCarthy & Prince 1995), aperception grammar takes an auditory representation as its input and yields aphonological surface structure as its output.
The perceptual process that we restrict ourselves to in this paper is staticcategorization, where the inputs are static (temporally constant) values of auditoryfeatures and the output candidates are language-specific phonological features orphonemes. Escudero & Boersma (2003) proposed that this mapping is evaluated by thenegatively formulated constraint template in (5), which directly relates auditory featurevalues to phonological categories. The reason for its negative formulation will bediscussed in §4.5.
(5) Perceptual construction constraints for auditory feature values
�A value x on the auditory continuum f should not be mapped to the phonologicalcategory y.�
For our case, the perception of Dutch and Spanish vowels, the relevant auditorycontinua are the first formant (F1), the second formant (F2), and duration, and the
5 Tesar and Smolensky call it robust interpretive parsing rather than perception, but we think that the twocan be equated.

�8�
relevant phonological categories are the 12 Dutch vowel symbols. Examples ofconstraints are therefore �an F1 of 531 Hz is not /!/D�, or �an F2 of 1585 Hz is not/e"/D�, or �a duration of 150 ms is not /y/D�. We propose that such constraints exist forany auditory value and any vowel category, regardless of whether that auditory value isa plausible cue for that vowel category. Thus while a typical F1 value for /i/D is 280Hz, we indiscriminately allow the presence of constraints like �an F1 of 280 Hz is not/i/D� and �an F1 of 900 Hz is not /i/D�. It is the ranking of these constraints, not theirpresence, that determines what auditory values map to what vowel categories. Thus, inorder to make it unlikely that an auditory input with an F1 of 900 Hz will ever beperceived as /i/D, the constraint �an F1 of 900 Hz is not /i/D� should be ranked veryhigh, and in order to allow that [i]-like auditory events can be perceived as /i/D at all,the constraint �an F1 of 280 Hz is not /i/D� should be ranked rather low.
As an example, consider the perception of the typical token of the Spanish vowel |a|S,namely an [a]-like auditory event with an F1 of 877 Hz, an F2 of 1881 Hz, and aduration of 70 ms. In tableau (6) we see that the two spectral cues favour the perceptionof |a"|D, but that in line with the finding in §1.5 these cues are overridden by the durationconstraints, which assert that an overtly short vowel token (e.g. 70 ms long) should notbe perceived as the vowel /a"/D.
(6) Dutch cross-language perception of a typical token of Spanish |a|S
[a], i.e.[F1=877,F2=1881,dur=70]
[dur=70]is not/a"/D
[F1=877]is not/#/D
[F2=1881]is not/$/D
[F1=877]is not/a"/D
[F1=877]is not/$/D
[F2=1881]is
not /#/D,not /a"/D
[dur=70]is
not /$/D,not /#/D
/a"/D *! * *
! /$/D * * *
/#/D *! * *
With (6) we can describe the behaviour of the Dutch-only listeners in the experiment.There are two reasons why the listeners� responses are variable. First, the 25 |a|S tokensin the experiment were all different, so that some will have been closer to [#], some to[$]. Secondly, listeners are expected to show variable behaviour even for repeatedresponses to the same token. We model this by using stochastic Optimality Theory(Boersma 1997, 1998; Boersma & Hayes 2001), in which constraints have rankingvalues along a continuous scale and in which some evaluation noise is temporarilyadded to the ranking of a constraint at each evaluation. In tableau (6) this will mean thatcandidate /$/D will win most of the time, followed by candidate /#/D.
In general, the candidates in a tableau should be all 12 vowels. Since that wouldrequire including all 36 relevant constraints, we simplified tableau (6) to include onlythree candidates, so that we need only consider 9 constraints. The remaining ninecandidate vowels can be ruled out by constraints such as �an F1 of 877 Hz is not /i/D�and �an F2 of 1881 Hz is not /%/D�, which are probably ranked far above �a duration of70 ms is not /a"/D�, since there were no �i� or �%� responses at all for intended |a|S.Tableau (6) also abstracts away from constraints such as �an F1 of 280 Hz is not /!/D�that refer to auditory feature values that do not occur in the input of this tableau. Such
�9�
constraints do exist and are ranked along the same continuum as the nine constraints in(6); the constraint �an F1 of 280 Hz is not /!/D� can interact with six of the nineconstraints in (6), namely when the input contains a combination of an F1 of 280 Hzwith either an F2 of 1881 Hz or a duration of 70 ms.
Since the four long Dutch vowels play no role in the identifications in (1) or in theperception experiment reported in §1.3, we will from now on ignore these long vowelsand consider only the eight short vowels as possible candidates. This allows us to ignorethe duration constraints and to focus on the spectral cues alone.
2.2. Lexicon-driven perceptual learning in OT
A tableau is just a description of how perception can be modelled in OT. A moreexplanatory account involves showing how the ranking of so many constraints can belearned. This section describes Boersma�s (1997, 1998) proposal for lexicon-drivenoptimization of an OT perception grammar.
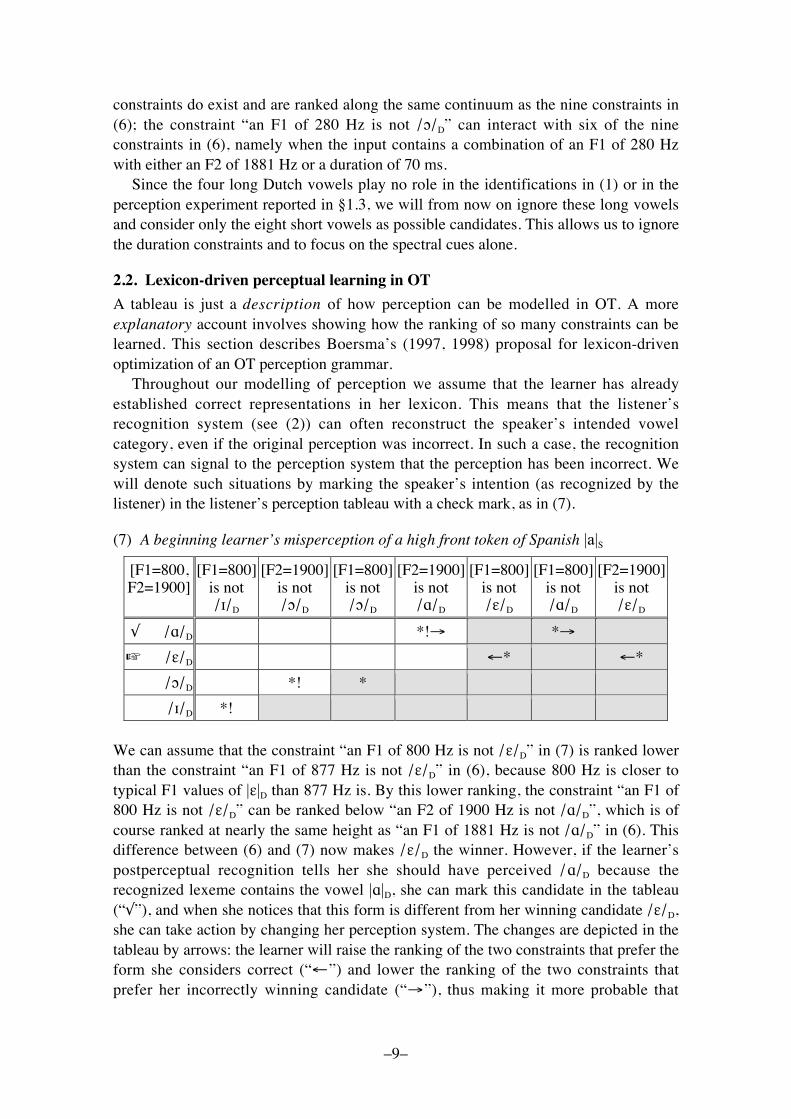
Throughout our modelling of perception we assume that the learner has alreadyestablished correct representations in her lexicon. This means that the listener�srecognition system (see (2)) can often reconstruct the speaker�s intended vowelcategory, even if the original perception was incorrect. In such a case, the recognitionsystem can signal to the perception system that the perception has been incorrect. Wewill denote such situations by marking the speaker�s intention (as recognized by thelistener) in the listener�s perception tableau with a check mark, as in (7).
(7) A beginning learner�s misperception of a high front token of Spanish |a|S
[F1=800,F2=1900]
[F1=800]is not/"/D
[F2=1900]is not/!/D
[F1=800]is not/!/D
[F2=1900]is not/#/D
[F1=800]is not/$/D
[F1=800]is not/#/D
[F2=1900]is not/$/D
! /#/D *!" *"
! /$/D #* #*
/!/D *! *
/"/D *!
We can assume that the constraint �an F1 of 800 Hz is not /$/D� in (7) is ranked lowerthan the constraint �an F1 of 877 Hz is not /$/D� in (6), because 800 Hz is closer totypical F1 values of |$|D than 877 Hz is. By this lower ranking, the constraint �an F1 of800 Hz is not /$/D� can be ranked below �an F2 of 1900 Hz is not /#/D�, which is ofcourse ranked at nearly the same height as �an F1 of 1881 Hz is not /#/D� in (6). Thisdifference between (6) and (7) now makes /$/D the winner. However, if the learner�spostperceptual recognition tells her she should have perceived /#/D because therecognized lexeme contains the vowel |#|D, she can mark this candidate in the tableau(�!�), and when she notices that this form is different from her winning candidate /$/D,she can take action by changing her perception system. The changes are depicted in thetableau by arrows: the learner will raise the ranking of the two constraints that prefer theform she considers correct (�#�) and lower the ranking of the two constraints thatprefer her incorrectly winning candidate (�"�), thus making it more probable that

�10�
auditory events with an F1 of 800 Hz or an F2 of 1900 Hz will be perceived as /!/D atfuture occasions, at least when she is listening to Spanish.
In order to prove that the learning algorithm just described works for Dutch learnersof Spanish throughout their L1 and L2 acquisition, we will show two computersimulations. Section 3 will simulate a simplified problem, namely the L1 and L2acquisition of the mapping from a single auditory continuum (F1) to four vowel heights(exemplified by /!/D, /"/D, /#/D, and /i/D). Section 4 will fully simulate the L1 and L2acquisition of the mapping from two auditory continua (F1 and F2) to the 12 Dutchvowels and, later, the 5 Spanish vowels of Figure 1.
3. One-dimensional vowel lossWe will first simulate the acquisition of a simplified vowel system, one in which asingle auditory continuum, namely F1, is mapped to only four vowels. Thissimplification is necessary in order for us to be able to show with one-dimensionalcurves how constraint rankings in the perception grammar can lead to an optimalperception in L1 and L2.
3.1. The L1 language environment
The L1 at hand is a language with only four vowels, simplified Dutch. The vowels carrythe familiar labels /!/D, /"/D, /#/D, and /i/D, but they are distinguished only by their F1values. We assume that the token distributions of the four intended vowels |!|D, |"|D, |#|D,and |i|D have Gaussian shapes around their mean values along a logarithmic F1 axis, asin Figure 2. The mean values (i.e. the locations of the peaks in Figure 2) are the same asthe median F1 values of Figure 1, namely 926, 733, 438, and 305 Hz, and the standarddeviation is 0.05 along a base-10 logarithmic scale (i.e. 0.166 octaves). This leads to thecurves in Figure 2, where we assume for simplicity that all four vowels occur equallyfrequently, so that the four peaks are equally high.
ñAñ
824
ñεñ
567
ñIñ
365
ñiñ
1000150 1500200 300 400 500 700F1 (Hz)
Optimal F1 boundaries (Hz)
Prob
abili
ty
Fig. 2. Idealized token distributions for four short Dutch vowels.

�11�
3.2. Optimal L1 perception
Figure 2, then, describes the distributions of speakers� productions of the four intendedvowels in a large corpus of one-dimensional Dutch. The task of the listeners is to mapeach incoming F1 value on one of the vowel categories /!/D, /"/D, /#/D, and /i/D, inpreparation for subsequent access of one of the underlying vowels |!|D, |"|D, |#|D, and |i|D.The question now is: what would be an optimal strategy for a listener? We propose thatthe optimal strategy is to minimize the discrepancy between the perceived vowel andthe recognized vowel, i.e. to minimize the number of cases where the listener perceivesa certain vowel (e.g. /"/D) but subsequently finds a different vowel (e.g. |#|D) in herlexicon (we call such a situation a perception error). A general strategy that achievesthis minimization of the number of perception errors is the maximum likelihood strategy(Helmholtz 1910), where the listener perceives any given F1 value as the vowel thatwas most likely to have been intended by the speaker. In Figure 2 we see that if alistener hears an F1 value of 400 Hz, it is most likely that this was a token of anintended vowel |#|D. We know this because for an F1 of 400 Hz the distribution curve for|#|D lies above the distribution curves for the other three vowels. In general, any F1 valueshould be perceived as the vowel whose curve is highest. Which curve is highest inFigure 2 is determined by the three main cutting points of the curves, which lie at 365,567, and 824 Hz. Given the distributions in Figure 2, then, a maximum-likelihoodstrategy entails that the listener should perceive all incoming F1 values below 365 Hz as/i/D, all F1 values between 365 and 567 Hz as /#/D, all F1 values between 567 and 824Hz as /"/D, and all F1 values above 824 Hz as /!/D. If the listener indeed uses thesethree optimal boundaries as her criteria for perception, she will achieve a correctnesspercentage of 90.5, i.e. of all F1 values that will be drawn according to the distributionsof Figure 2 (with equal probabilities for each of the four intended vowels) she willperceive 90.5 percent as the same vowel as she will subsequently find in her lexicon.The remaining 9.5 percent are cases of perception errors, caused by the overlap in thecurves of Figure 2 (i.e. in 9.5 percent of the productions an F1 value crosses theboundary with a neighbouring vowel).
The reader will have noticed that our definition of optimal perception (minimizingthe number of perception errors) is related to our operationalization of lexicon-drivenlearning (§2.2), which changes the perception grammar every time the listener makes aperception error. The simulation of the following section will show that lexicon-drivenperceptual learning with the GLA indeed leads to optimal boundaries in the listener.
3.3. L1 acquisition of the perception of one-dimensional Dutch
In order to be able to do a computer simulation of the F1-only simplified Dutch vowelsystem, we divide up the F1 continuum between 150 and 1500 Hz in 100 values equallyspaced along a logarithmic scale: 152, 155, 159, ..., 1416, 1449, and 1483 Hz. We willassume that only these 100 frequencies are possible incoming F1 values. According to§2.1, we therefore need 400 constraints (100 F1 values ! 4 vowel categories) that can beformulated like �[F1 = 1416 Hz] is not /#/D�.6
6 A more sophisticated discretization of the F1 continuum, as used by Boersma (1997), would involvetaking many more F1 values and allowing the learning algorithm to change the ranking of someneighbouring constraints by a value that decreases with the distance to the incoming F1. This would leadto results similar to those obtained by the simpler implementation of the present paper.

�12�
We assume that in the initial state of the learner all lexical representations arecorrect, so that lexicon-driven learning according to tableaus like (7) works flawlessly.We further assume that all 400 constraints are initially ranked at the same height,namely 100.0, so that any F1 value has a probability of 25 percent of being perceived asany of the four vowels. This combination of assumptions is obviously a severesimplification, since a correct lexicalization must depend on a reasonably goodperception system, i.e. one whose percentage correct is much higher than 25. Such areasonably good perception system could be obtained by an OT distributional learningmethod for infants such as the one described by Boersma, Escudero & Hayes (2003),but we will not pursue this here since we are mainly interested in what happens later inlife.
We feed our simulated learner with 10,000 F1 values per virtual year, drawn fromthe distributions in Figure 2 (i.e. more F1 values near the peaks than near the valleys),always telling the learner, as in (7), what would have been the correct perception. Everytime there is a mismatch between the perceived vowel and the correct vowel (i.e. thevowel intended by the speaker, as recognized by the listener�s lexicon), some rankingschange by a small amount, the plasticity (learning step). The plasticity is 1.0 during thefirst year, then decreases by a factor of 0.7 every year, ending up as a plasticity of0.0023 during the 18th virtual year. With a constant evaluation noise of 2.0, thisplasticity scheme causes learning to be initially fast but imprecise, and later on slow butaccurate. The left side of Figure 3 shows the development of the grammars and is to beinterpreted as follows. For every F1 value it is the lowest-ranked constraint thatdetermines into which vowel category the F1 value will most often be classified. Forinstance, for an F1 of 400 Hz the lowest ranked constraint (the thick curve) is �[F1 =400 Hz] is not /!/D�. Tableau (8) shows that the low ranking of this constraintdetermines the winner, irrespective of the relative ranking of the other three relevantconstraints.
(8) Perception determined by the lowest curve
[F1=400] [F1=400]is not/"/D
[F1=400]is not/#/D
[F1=400]is not/i/D
[F1=400]is not/!/D
/"/D *!
/#/D *!
! /!/D *
/i/D *!
Every grammar leads to its own perception pattern. In the course of the 18 virtual yearswe see that the crossing points of the constraint curves come to lie close to the optimalboundaries of 365, 567, and 824 Hz. If a listener with the 18th-year grammar in Figure3 sets her evaluation noise to zero, her percentage correct will be about 90.5, just as forthe maximum-likelihood listener in §3.2 (the percentage correct can be estimated byrunning 100,000 F1 values, distributed as in Figure 2, through the grammar andcounting the number of correct output vowels). If we assume, however, that the listener

�13�
824567365150 150090
100
110R
anki
ngAfter 0 years
824567365150 15000
0.25
1
Prob
abili
ty
After 0 years
Correct:
25.0%
824567365150 150090
100
110
Ran
king
After 1 year
/A/
824
/ε/
567
/I/
365
/i/
150 15000
0.25
1
Prob
abili
ty
After 1 year
Correct:
81.1%
824567365150 150090
100
110
Ran
king
After 3 years
/A/
824
/ε/
567
/I/
365
/i/
150 15000
0.25
1
Prob
abili
tyAfter 3 years
Correct:
83.7%
824567365150 150090
100
110
Ran
king
After 6 years
/A/
824
/ε/
567
/I/
365
/i/
150 15000
0.25
1
Prob
abili
ty
After 6 years
Correct:
84.2%
824567365150 150090
100
110
Ran
king
After 18 years
/A/
824
/ε/
567
/I/
365
/i/
150 15000
0.25
1
Prob
abili
ty
After 18 years
Correct:
83.7%
Fig.3. Simulated L1 acquisition of Dutch.Left: the rankings of the four constraint families �[F1=x] is not /vowel/D�.
Right: the identification curves.Dashed: /i/D; plain thick: /!/D; dotted: /"/D; plain thin: /#/D.
has an evaluation noise of 2.0, just as during learning, the percentage correct is a bitlower. It can be shown (Boersma 1997) that in the one-dimensional case the resultingperception grammar is probability matching, i.e. the probability of perceiving a certainF1 value as a certain vowel comes to approximate the probability that this F1 value had

�14�
been intended as that vowel. For instance, we can read off Figure 2 that an F1 value of400 Hz has 90 percent chance of having been intended as |!|D and 10 percent chance ofhaving been intended as |i|D. When confronted with an auditory input of 400 Hz, aprobability-matching listener will perceive it 90 percent of the time as /!/D and 10percent of the time as /i/D. Exactly this is what our learner comes to do, improving from25 percent correct to 83.7 percent correct, which is the same value that can be computedfrom Figure 2.7 In the rest of this paper we will call probability-matching behaviour�optimal�, and forget about maximum-likelihood behaviour, which never occurs inpractice anyway.
The right side of Figure 3 shows our virtual listener�s identification curves (as knownfrom perception experiments with real listeners), i.e. for each of the four vowels a curvethat shows for every F1 value how often that F1 value is perceived as that vowel. Thesecurves are computed by running each of the 100 F1 values through the grammar 1,000times and counting how often each of the four possible vowels is the winner. The virtuallearner grows increasingly confident of her category boundaries, which become optimalfor her language environment.
3.4. L2 acquisition of the perception of one-dimensional Spanish
After having learned Dutch for 18 years, our virtual learner starts learning Spanish. Ourone-dimensional Spanish has the three vowels |a|S, |e|S, and |i|S, whose F1 distributionsare centred around the median F1 of Figure 1, again with a logarithmic standarddeviation of 0.05. The learner equates the three Spanish vowels with her Dutchcategories |"|D, |# |D, and |i|D, respectively, as do the real learners of §1.1. Her L2language environment can thus be described by the curves in Figure 4.
ñAñ
662
ñεñ
407
ñiñ
1000150 1500200 300 400 500 700F1 (Hz)
Optimal F1 boundaries (Hz)
Prob
abili
ty
Fig. 4. The Spanish vowel environment, with Dutch labels.
7 Given a distribution where p(f, v) denotes the probability that a token drawn randomly from thelanguage environment has an F1 of f Hz and was intended as the vowel v (i.e. !f,v p(f, v) = 1), the fractioncorrect for a maximum-likelihood listener can be computed as !f maxv p(f, v), and the fraction correct fora probability-matching listener can be computed as !f (!v p(f, v)2 / !v p(f, v)).

�15�
The learner�s initial interlanguage grammar is a copy of her current grammar ofDutch, i.e. the picture in the upper left of Figure 5 is identical to the picture in the lowerleft of Figure 3. Such a grammar handles Spanish better than an infant-like grammarwhere all constraints are ranked at the same height. Whereas an infant-like grammarwould score 25 percent correct, the copied Dutch grammar already scores 53.1 percentcorrect. Nevertheless, this score is far from nativelike, since an adult probability-matching listener of Spanish will achieve 95.5 percent correct (as computed from Figure4). If she is to gain more accuracy in her L2 environment, our virtual listener will haveto learn.
We immerse our virtual learner in a rich Spanish environment where she hears10,000 vowel tokens a year, as many as during her L1 acquisition. Acknowledging herhigh motivation, we endow her with a plasticity of 0.01, which is four times as high asher final L1 plasticity of 0.0023 but of course still only a tiny fraction of her initial L1plasticity of 1. The development of the virtual L2 learner is shown in Figure 5. Themain feature of this development is the fall of the /!/D category. Whenever the learnerperceives an incoming F1 value as /!/D, the interlanguage lexicon, which does notcontain any instances of |!|D, will tell her that she should have perceived a differentvowel, most often /i/D or /e/D. In all these cases, one of the constraints �[F1=x] is not/!/D� will rise along the ranking scale, thus making it less likely that the nextocccurrence of the same F1 value will again be perceived as /!/D.
The learner�s proficiency clearly improves, although despite her complete immersionin her L2 environment, despite her raised motivation, and despite her full access to anL1-like learning mechanism (the GLA), she has trouble achieving complete nativelikecompetence (95.5%), even in 18 years. This small failure is mainly due to the plasticityof 0.01, which stresses adultlike precision rather than infantlike learning speed.

�16�
662407150 150090
100
110R
anki
ngAfter 0 years
/A/
662
/ε/
407
/I//i/
150 15000
0.25
1
Prob
abili
ty
After 0 years
Correct:
53.1%
662407150 150090
100
110
Ran
king
After 1 year
/A/
662
/ε/
407
/I//i/
150 15000
0.25
1
Prob
abili
ty
After 1 year
Correct:
62.6%
662407150 150090
100
110
Ran
king
After 3 years
/A/
662
/ε/
407
/I//i/
150 15000
0.25
1
Prob
abili
tyAfter 3 years
Correct:
80.3%
662407150 150090
100
110
Ran
king
After 6 years
/A/
662
/ε/
407
/I//i/
150 15000
0.25
1
Prob
abili
ty
After 6 years
Correct:
88.9%
662407150 150090
100
110
Ran
king
After 18 years
/A/
662
/ε/
407
/I//i/
150 15000
0.25
1
Prob
abili
ty
After 18 years
Correct:
94.0%
Fig. 5. Simulated L2 acquisition of Spanish.Left: the rankings of the four constraint families �[F1=x] is not /vowel/D�.
Right: the identification curves.Dashed: /i/D; plain thick: /!/D; dotted: /"/D; plain thin: /#/D.

�17�
4. Two-dimensional vowel loss and shift of |!|DAfter the oversimplification of §3, our second simulation reflects a more realisticsituation, in which two auditory cues, namely both F1 (�height�) and F2 (�place�),contribute to the perception of the whole Dutch system of short vowels. We divide bothcontinua in 21 values, as shown in Figure 6. Some height-place combinations cannotoccur; these are left blank in the figure.
ε A A A A A A Aε ε ε A A A A A A A
ε ε ε ε ε A A A A A A A A Aε ε ε ε ε ε A A A A A A A A
ε ε ε ε ε ε ε A A A A A A A A Aε ε ε ε ε ε ε ε ε A A A A A A A A Aε ε ε ε ε ε ε ε ε A A A A A A A ç ç
I ε ε ε ε ε ε ε ε ε ε A A ç ç ç ç ç çI I I ε ε ε ε ε ε ε ε ç ç ç ç ç ç ç ç
I I I I I I ε ε ε Y Y Y ç ç ç ç ç ç ç çI I I I I I I Y Y Y Y Y ç ç ç ç ç ç ç çI I I I I I I Y Y Y Y Y ç ç ç ç ç ç ç ç
I I I I I I I I Y Y Y Y Y Y ç ç ç ç ç ç çi I I I I I I I Y Y Y Y Y Y ç ç ç ç ç ç çi i i I I I I I Y Y Y Y Y Y ç ç ç u u u ui i i i i i I I Y Y Y Y Y Y u u u u u u ui i i i i i i i y y y Y Y u u u u u u u ui i i i i i i i y y y y y u u u u u u u ui i i i i i i i y y y y y u u u u u u u ui i i i i i i i y y y y y u u u u u u u ui i i i i i i i y y y y y u u u u u u u u
← Place →
← H
eigh
t →
Fig. 6. Circles: the centres of the token distributions of the eight short Dutch vowels.Phonetic symbols: the most likely intended vowel for every place-height combination.
4.1. The 2-dimensional L1 language environment
Figure 6 summarizes the height and place distributions for native speakers of Dutch.The circles represent the centres of the token distributions of the eight vowels. Theirlocations are similar to those in Figure 1, but for the purposes of the present section wehave made each of them coincide with one of the 21!21 possible height-place values.We assume that the standard deviation of the place distribution is 2.0 columns along thehorizontal axis, and that the standard deviation of the height distribution is 2.0 rowsalong the vertical axis. We also assume that all vowels are equally common, except |y|D,which we take to be five times less common in Dutch than every other vowel. Figure 6then shows for each F1-F2 combination what the most likely intended vowel is. We candiscern �production boundaries� that run at equal distances to the nearest vowels, exceptfor the boundaries around |y|D, which reflect the low token frequency of this vowel.
4.2. Optimal 2-dimensional perception
Since Figure 6 shows the most likely intended productions, the boundaries in this figuremust indicate the optimal boundaries for perception. We can compute that a probability-matching listener would score 78.2% correct. The following section shows that GLAlearners can achieve this optimal perception.

�18�
4.3. L1 acquisition of the perception of 2-dimensional Dutch
Analogously to §3.3, we feed a virtual Dutch listener 10,000 F1-F2 tokens a year,drawn randomly from the distribution in Figure 6 (i.e. fewer tokens far away from thevowel centres than close to them, and fewer tokens of |y|D than of every other vowel).
The virtual learner�s grammar contains 336 constraints (= (21 height values + 21place values) ! 8 vowels), which start out being ranked at the same height. Theevaluation noise and plasticity regime are as in §3.3. There is no simple way to showthe grammars or identification curves, as there was in the 1-dimensional case of §3.3,but we can compute for every F1-F2 combination what the most likely perceived vowelis, by running each F1-F2 combination through the grammar 1000 times. The results arein Figure 7, which shows the development of the learner�s performance. While after
u A Y Y i y i uI ε ε ç u Y i u A ç
A y I ε ε A I u y I i ç ε εi u I y ç Y A Y i u u y i Y
A Y Y A ε y ç A Y i ε I ε i u Yi i i i i y u u I Y y i A ε u I u yi I I u ç ε I i ε Y ç A I Y I Y A ç
ε ε u A ç Y ç ε Y i ç i i i Y ε A i Aç I i y y I Y ç ç ε ç i I ε ε y u A Y
u y A I A I i A i ç u A ç I u I u ε Y yI ç y I Y ç i ε i A Y i A i Y Y ε i A εε i u y y y A i y ç Y I Y Y I ε ç i y I
ç Y I i Y y u y ε ε y i Y y Y Y u ε i A yI I u Y y I A i Y A ε y i ç ç y y y A i Yε u i ε I u A y ç ç ε y i y ε ç Y A I ç εy y Y I i ç A I y u ç Y i ç I i y y y u Yε u i y A A ε A y i I y u y I A ε y I i IY I I A A Y ε u ε ε ε Y y ç I y ε ε y y εA I I Y y ε I u ε i ç I y I ç Y Y u u I iY y Y i i Y y i ε A Y ε Y I ç y ç ç I u AA ε y Y y ε i ç Y i Y I ç i ε ç A y ç Y i
Correct:12.5%
After 0 years:
ε A A A A A A A
ε ε ε A A A A A A Aε ε ε ε ε ε A A A A A A A Aε ε ε ε ε ε ε A A A A A A A
ε ε ε ε ε ε A A A A A A A A A Aε ε ε ε ε ε ε ε ε A A A A A A A A Aε ε ε ε ε ε ε ε ε ε A A A A A A A A
I I ε I ε ε ε ε ε ε ε ç ç ç ç ç ç ç çI I ε I ε ε ε ε ε ε ç ç ç ç ç ç ç ç ç
I I I I I I I Y ε Y Y Y ç ç ç ç ç ç ç çI I I I I I I Y Y Y Y Y ç ç ç ç ç ç ç çI I I I I I I Y Y Y Y Y ç ç ç ç ç ç ç ç
I I I I I I I I I Y Y Y ç ç ç ç ç ç ç ç çi I I I I I I I Y Y Y Y Y ç ç ç ç ç ç ç çi i i i I I I I I Y Y Y Y ç u u u u u u ui i i i i i i I y y Y y Y Y u u u u u u ui i i i i i i I y y y y ç ç u ç u u u u ui i i i i i i i y y y y y u u u u u u u ui i i i i i i i y y y y y u u u u u u u ui i i i i i i i y y y y u u u u u u u u ui i i i i i i i y y y y y u u u u u u u u
Correct:76.1%
After 1 year:
ε A A A A A A Aε ε A A A A A A A A
ε ε ε ε ε ε A A A A A A A Aε ε ε ε ε A A A A A A A A A
ε ε ε ε ε ε ε A A A A A A A A Aε ε ε ε ε ε ε ε A A A A A A A A A Aε ε ε ε ε ε ε ε A A A A A A A A A A
I ε ε ε ε ε ε ε ε ε ç ç ç ç ç ç ç ç çI I ε ε ε ε ε ε ε ε ç ç ç ç ç ç ç ç ç
I I I I I I ε ε Y ε Y Y ç ç ç ç ç ç ç çI I I I I I Y Y Y Y Y Y ç ç ç ç ç ç ç çI I I I I I Y Y Y Y Y Y ç ç ç ç ç ç ç ç
i I I I I I I Y Y Y Y Y Y ç ç ç ç ç ç ç çi I I I I I I Y Y Y Y Y Y ç ç ç ç ç ç ç çi i i i i I I Y Y Y Y Y Y ç ç ç ç ç ç ç çi i i i i i i Y Y Y Y Y Y u u u u u u u ui i i i i i i y y y y y y u u u u u u u ui i i i i i i y y y y y y u u u u u u u ui i i i i i i y y y y y y u u u u u u u ui i i i i i i y y y y y y u u u u u u u ui i i i i i i y y y y y y u u u u u u u u
Correct:78.7%
After 3 years:
ε A A A A A A A
ε ε ε A A A A A A Aε ε ε ε ε A A A A A A A A Aε ε ε ε ε ε A A A A A A A A
ε ε ε ε ε ε ε A A A A A A A A Aε ε ε ε ε ε ε ε ε A A A A A A A A Aε ε ε ε ε ε ε ε ε A A A A A A A A ç
I I I ε ε ε ε ε ε ε ε A A ç ç ç ç ç çI I I ε ε ε ε ε ε ε Y ç ç ç ç ç ç ç ç
I I I I I I ε ε Y Y Y Y ç ç ç ç ç ç ç çI I I I I I I Y Y Y Y Y ç ç ç ç ç ç ç çI I I I I I I Y Y Y Y Y ç ç ç ç ç ç ç ç
I I I I I I I I Y Y Y Y Y Y ç ç ç ç ç ç çi I I I I I I I Y Y Y Y Y Y ç ç ç ç ç ç çi i i I I I I I Y Y Y Y Y Y ç ç ç ç u u ui i i i i i I I Y Y Y Y Y u u u u u u u ui i i i i i i y y y y y Y u u u u u u u ui i i i i i i y y y y y y u u u u u u u ui i i i i i i y y y y y y u u u u u u u ui i i i i i i y y y y y y u u u u u u u ui i i i i i i y y y y y y u u u u u u u u
Correct:78.2%
After 18 years:
Fig. 7. Simulated L1 Dutch vowel classification after 0, 1, 3, and 18 years.Grey disks: the eight Dutch short vowel centres in production.

�19�
one year the boundaries are still rather ragged, after 18 years they are smooth and veryclose to the optimal boundaries of Figure 6, leading to fractions correct that comparevery well with the optimum reported in §4.2. It turns out that the GLA is indeed capableof creating a stochastic OT grammar that exhibits optimal perceptual behaviour.
4.4. L2 acquisition of the perception of 2-dimensional Spanish
When the learner moves to Spain, her language environment becomes that of Figure 8,which shows the most likely intended Spanish vowels, under the assumption that thefive vowels have equal token frequencies. When the learner copies her Dutch constraintranking (i.e. the grammar in Figure 7, bottom right) to her Spanish interlanguagegrammar, her fraction correct, given the distributions in Figure 8, is 47.6% (cf. 56.6%for the 1-dimensional case of §3.4).
A A A A A A A AA A A A A A A A A A
A A A A A A A A A A A A A AA A A A A A A A A A A A A A
A A A A A A A A A A A A A A ç çA A A A A A A A A A A A A ç ç ç ç çε ε ε A A A A A A A A ç ç ç ç ç ç ç
ε ε ε ε ε ε ε A A A ç ç ç ç ç ç ç ç çε ε ε ε ε ε ε ε ε ç ç ç ç ç ç ç ç ç ç
ε ε ε ε ε ε ε ε ε ε ç ç ç ç ç ç ç ç ç çε ε ε ε ε ε ε ε ε ε ç ç ç ç ç ç ç ç ç çi i ε ε ε ε ε ε ε ε ç ç ç ç ç ç ç ç u u
i i i i i ε ε ε ε ε ε ç ç ç ç ç ç u u u ui i i i i i i ε ε ε ε ç ç ç ç u u u u u ui i i i i i i i i ε ε ç ç u u u u u u u ui i i i i i i i i i i u u u u u u u u u ui i i i i i i i i i i u u u u u u u u u ui i i i i i i i i i i u u u u u u u u u ui i i i i i i i i i i u u u u u u u u u ui i i i i i i i i i i u u u u u u u u u ui i i i i i i i i i i u u u u u u u u u u
← Place →
← H
eigh
t →
Fig. 8. The Spanish vowel environment, with Dutch labels.Circles: the Spanish vowel centers. Grey disks: Dutch short vowel centres.
As with the 1-dimensional case of §3.4, we immerse the learner in Spanish (10,000tokens a year, drawn from the distributions in Figure 8, with lexicon-guided correction)with a plasticity of 0.01. The development of classification behaviour is shown inFigure 9. We see that the learner gradually loses her /!/D and /"/D categories and shiftsher /#/D category towards the front, just as the real human subjects did in our listeningexperiment. Nativelike behaviour, which should follow the optimal boundaries inFigure 8 (and reach a fraction correct of 83.7%), is closely approached but nevercompletely attained, mainly as a result of the low plasticity relative to that of infants.

�20�
A A A A A A A Aε A A A A A A A A A
ε ε ε ε A A A A A A A A A Aε ε ε ε A A A A A A A A A A
ε ε ε ε ε ε A A A A A A A A A Aε ε ε ε ε ε ε ε A A A A A A A A A Aε ε ε ε ε ε ε ε A A A A A A A A ç ç
I I ε ε ε ε ε ε ε ε A A A A ç ç ç ç çI I ε ε ε ε ε ε ε ε ç ç ç ç ç ç ç ç ç
I I I I ε ε ε ε ε ε ε ç ç ç ç ç ç ç ç çI I I I I ε ε ε ε ε Y ç ç ç ç ç ç ç ç çI I I I I I ε ε ε Y Y ç ç ç ç ç ç ç ç ç
I I I I I I I I I Y Y Y ç ç ç ç ç ç ç ç çi i I I I I I i Y Y Y Y Y ç ç ç ç ç ç ç çi i i i i i i i Y Y Y Y Y ç u u u u u u ui i i i i i i i i Y Y Y Y u u u u u u u ui i i i i i i i y y y y u u u u u u u u ui i i i i i i i y y y y y u u u u u u u ui i i i i i i i y y y y y u u u u u u u ui i i i i i i i i y y y u u u u u u u u ui i i i i i i i y y y y y u u u u u u u u
Correct:63.4%
After 1 year:
A A A A A A A A
A A A A A A A A A Aε ε A A A A A A A A A A A Aε ε ε A A A A A A A A A A A
ε ε ε ε ε A A A A A A A A A A Aε ε ε ε ε ε A A A A A A A A A A A Aε ε ε ε ε ε ε A A A A A A A A A ç ç
I I ε ε ε ε ε ε ε A ç ç A A ç ç ç ç çI I ε ε ε ε ε ε ε ç ç ç ç ç ç ç ç ç ç
I I I ε ε ε ε ε ε ε ç ç ç ç ç ç ç ç ç çI I I ε ε ε ε ε ε ε ç ç ç ç ç ç ç ç ç çI I I I ε ε ε ε ε ε ç ç ç ç ç ç ç ç ç ç
i I I I I I ε ε ε ε ε ç ç ç ç ç ç ç ç ç çi i i i i i i i i Y Y ç ç ç ç u u u u u ui i i i i i i i i Y Y Y ç u u u u u u u ui i i i i i i i i y Y Y u u u u u u u u ui i i i i i i i i y y y u u u u u u u u ui i i i i i i i i y y y u u u u u u u u ui i i i i i i i i y y y u u u u u u u u ui i i i i i i i i y y y u u u u u u u u ui i i i i i i i i y y y u u u u u u u u u
Correct:75.4%
After 3 years:
A A A A A A A AA A A A A A A A A A
ε ε A A A A A A A A A A A Aε ε A A A A A A A A A A A A
ε ε ε A A A A A A A A A A A A Aε ε ε ε ε ε A A A A A A A A A A A Aε ε ε ε ε ε A A A A A A A A A ç ç ç
I I ε ε ε ε ε ε A A ç ç ç ç ç ç ç ç çI ε ε ε ε ε ε ε ε ç ç ç ç ç ç ç ç ç ç
I I ε ε ε ε ε ε ε ε ç ç ç ç ç ç ç ç ç çI I ε ε ε ε ε ε ε ε ç ç ç ç ç ç ç ç ç çI I ε ε ε ε ε ε ε ε ç ç ç ç ç ç ç ç ç ç
i i i i ε ε ε ε ε ε ε ç ç ç ç ç ç ç ç ç çi i i i i i i i ε ε ε ç ç ç ç u u u u u ui i i i i i i i i i ç ç u u u u u u u u ui i i i i i i i i i y Y u u u u u u u u ui i i i i i i i i y y y u u u u u u u u ui i i i i i i i i i y y u u u u u u u u ui i i i i i i i i y y y u u u u u u u u ui i i i i i i i i i y y u u u u u u u u ui i i i i i i i i y y y u u u u u u u u u
Correct:79.8%
After 6 years:
A A A A A A A A
A A A A A A A A A Aε A A A A A A A A A A A A Aε A A A A A A A A A A A A A
ε ε A A A A A A A A A A A A A Aε ε ε ε A A A A A A A A A A A A ç çε ε ε ε ε A A A A A A A A ç ç ç ç ç
I ε ε ε ε ε ε ε A ç ç ç ç ç ç ç ç ç çI ε ε ε ε ε ε ε ε ç ç ç ç ç ç ç ç ç ç
I I ε ε ε ε ε ε ε ε ç ç ç ç ç ç ç ç ç çI I ε ε ε ε ε ε ε ε ç ç ç ç ç ç ç ç ç çi i ε ε ε ε ε ε ε ε ç ç ç ç ç ç ç ç ç ç
i i i i ε ε ε ε ε ε ε ç ç ç ç ç ç ç ç u çi i i i i i i i ε ε ε ç ç ç ç u u u u u ui i i i i i i i i i ε ç u u u u u u u u ui i i i i i i i i i ç ç u u u u u u u u ui i i i i i i i i i y u u u u u u u u u ui i i i i i i i i i y u u u u u u u u u ui i i i i i i i i i y u u u u u u u u u ui i i i i i i i i i y u u u u u u u u u ui i i i i i i i i i y y u u u u u u u u u
Correct:82.6%
After 18 years:
Fig. 9. The perception of Spanish by a Dutch learner after 1, 3, 6, and 18 years.Grey disks: the Spanish vowel centres.
4.5. The need for negatively formulated constraints
In the present paper we have been using constraints with negative formulations, such as�an F1 of 400 Hz is not /!/D�. Couldn�t we just have used positively formulatedconstraints instead, like �an F1 of 400 Hz is /!/D�? There are two cases in which thismakes no difference. The first case is that of a single auditory continuum, as in §3: intableau (8), in which every candidate violates a single constraint, we can simply rankpositively formulated constraints in the reverse order of their negatively formulatedcounterparts, and the outcome will be the same. The second case is that of multipleauditory continua but only two different vowel categories (Escudero & Boersma 2003,2004): if we have only two categories /A/ and /B/, the constraint �an F1 of 400 Hz isnot /A/� is simply equivalent to the constraint �an F1 of 400 Hz is /B/�.
But the equivalence does not generalize to cases with two (or more) auditorycontinua and more than two categories. In Figure 7, the highest-ranked positivelyformulated constraints would have non-local influences throughout the height or place

�21�
continuum. For instance, an 18-year simulation of the acquisition of L1 Dutch withpositively formulated constraints leads to a grammar that exhibits the behaviour inFigure 10, with a fraction correct of 44.9% for the perception of Dutch, an achievementdramatically worse than that of the negatively formulated constraints of Figure 7, whichscored 78.2% (in Figure 10 we can see that �[height=6] is /!/D� and �[place=3] is /i/D�must have ended up as top-ranked).
ε Y Y Y Y A A çA A A A A A A A A A
A A A A A A A A A A A A A AA A A A A A A A A A A A A A
A A A A A A A A A A A A A A A Aε ε ε ε ε ε ε ε ε ε ε ε ε ε ε ε ε εi ε ε ε ε ε ε ε ε ε ε ε ε ε ε ε ε ε
i i I ε ε ε ε ε ε ε ε ε ε ε ç u ε ε εi i I I ε ε ε ε Y Y ε ε ç ç ç ç u u ε
i i i I I I ε ε ε Y Y Y ç ç ç ç ç u u çi i i I I I ç ç Y Y Y Y ç ç ç ç ç ç ç çç i I I I I ç Y Y Y Y Y ç ç ç ç ç ç ç ç
Y Y i I I I I I Y Y Y Y Y I ç ç ç ç ç ç YY i i i I I I I Y Y Y Y Y Y ç ç ç ç u u Yi i i i I I I I ε Y Y Y Y A A ç ç u u u ui i i i I I I ε ε ε Y Y Y A A ç ç u u u ui i i i i I I u u Y Y Y u u A u u u u u ui i i i i i u u u u u u u u u u u u u u ui i i i i i u u u u u u u u u u u u u u ii i i i i I I u u Y Y u u u u u u u u u ui i i i I I I ε ε ε Y Y Y u A ç ç u u u u
Correct:44.9%
After 18 years:
Fig. 10. The failure of learning L1 Dutch with positively formulated constraints.
5. ConclusionNegatively formulated OT constraints can handle the categorization of both 1-dimensional and 2-dimensional auditory continua as attested in listening experiments, atleast if every category spans a compact local region in the auditory space. Our OTperception model shares this property with several connectionist models, starting withthe perceptron (Rosenblatt 1962), and with Massaro�s (1987) fuzzy logical model ofperception. But unlike these other models of perception, it makes a connection withphenomena that phonologists have traditionally been interested in, as witnessed by theperceptual processes that have been modelled in OT: the interpretation of metrical feet,which requires structural constraints like IAMBIC and WEIGHT-TO-STRESS (Tesar 1997,1998; Tesar & Smolensky 2000; Apoussidou & Boersma 2003, 2004); sequentialabstraction, which can be handled by construction constraints like OCP and LCC(Boersma 1998, 2000); the interaction of structural constraints and auditory faithfulnessin the categorization of vowel height (Boersma 1998), consonant length (Hayes 2001),or vowel length (Broselow 2003 for loanword adaptation); and truncation by infants,which requires structural constraints like WORDSIZE (Pater 2004). Optimality-Theoreticaccounts of perception and its acquisition thus bridge the gap between phonologicaltheory and the computational modelling of human speech processing.

�22�
ReferencesApoussidou, Diana, & Paul Boersma (2003). The learnability of Latin stress. Proceedings of the Institute
of Phonetic Sciences Amsterdam 25: 101-148.Apoussidou, Diana, & Paul Boersma (2004). Comparing two Optimality-Theoretic learning algoithms for
Latin stress. WCCFL 23.Boersma, Paul (1997). How we learn variation, optionality, and probability. Proceedings of the Institute
of Phonetic Sciences Amsterdam 21: 43�58.Boersma, Paul (1998). Functional phonology. PhD thesis, University of Amsterdam. The Hague: Holland
Academic Graphics.Boersma, Paul (1999). On the need for a separate perception grammar. Ms. University of Amsterdam.
[Rutgers Optimality Archive 358]Boersma, Paul (2000). The OCP in the perception grammar. Ms. University of Amsterdam. [Rutgers
Optimality Archive 435]Boersma, Paul (2001). Phonology-semantics interaction in OT, and its acquisition. In Robert Kirchner,
Wolf Wikeley, & Joe Pater (eds.): Papers in Experimental and Theoretical Linguistics. Vol. 6.Edmonton: University of Alberta. 24�35.
Boersma, Paul, Paola Escudero, & Rachel Hayes (2003). Learning abstract phonological from auditoryphonetic categories: An integrated model for the acquisition of language-specific sound categories.Proceedings of the 15th International Congress of Phonetic Sciences. 1013�1016.
Boersma, Paul, & Bruce Hayes (2001). Empirical tests of the Gradual Learning Algorithm. LinguisticInquiry 32: 45�86.
Bradlow, Ann (1995). A comparative study of English and Spanish vowels. Journal of the AcousticalSociety of America 97: 1916�1924.
Bradlow, Ann (1996). A perceptual comparison of the |i|-|e| and |u|-|o| contrasts in English and in Spanish:Universal and language-specific aspects. Phonetica 53: 55�85.
Broselow, Ellen (2003). Language contact phonology: richness of the stimulus, poverty of the base.North-Eastern Linguistic Society 34.
Escudero, Paola, & Paul Boersma (2002). The subset problem in L2 perceptual development: Multiple-category assimilation by Dutch learners of Spanish. In Barbora Skarabela, Sarah Fish, & Anna H.-J. Do (eds.), Proceedings of the 26th annual Boston University Conference on LanguageDevelopment. Somerville, Mass.: Cascadilla Press. 208�219.
Escudero, Paola, & Paul Boersma (2003). Modelling the perceptual development of phonologicalcontrasts with Optimality Theory and the Gradual Learning Algorithm. In Sudha Arunachalam,Elsi Kaiser & Alexander Williams (eds.): Proceedings of the 25th Annual Penn LinguisticsColloquium. Penn Working Papers in Linguistics 8.1: 71�85.
Escudero, Paola, & Paul Boersma (2004). Bridging the gap between L2 speech perception research andphonological theory. Studies in Second Language Acquisition 26: 551�585.
Escudero & Boersma (to appear). Language modes in second-language acquisition of perception.Gerrits, Ellen (2001). The categorisation of speech sounds by adults and children. PhD thesis, University
of Utrecht.Hayes, Rachel (2001). An Optimality-Theoretic account of novel phonetic category formation in second
language learning. Ms., University of Arizona.Helmholtz, H. von (1910). Handbuch der physiologischen Optik. Vol. 3. Hamburg: Leopold Voss.Jusczyk, Peter W., Anne Cutler, & N.J. Redanz (1993). Infants� preference for the predominant stress
patterns of English words. Child Development 64: 675�687.Koopmans-van Beinum, Florien J. (1980). Vowel contrast reduction. An acoustic and perceptual study of
Dutch vowels in various speech conditions. PhD thesis, University of Amsterdam.Liljencrants, Johan & Björn Lindblom (1972). Numerical simulation of vowel quality systems: the role of
perceptual contrast. Language 48: 839�862.Lindblom, Björn (1986). Phonetic universals in vowel systems. In John J. Ohala & Jeri J. Jaeger (eds.)
Experimental phonology. Orlando: Academic Press. 13�44.McQueen, James M. & Anne Cutler (1997). Cognitive processes in speech perception. In William J.
Hardcastle & John Laver (eds.) The handbook of phonetic sciences. Oxford: Blackwell. 566�585.McQueen (in press). Speech perception. In K. Lamberts & R. Goldstone (eds.) The handbook of
cognition. London: Sage Publications.Massaro, Dominic William (1987). Speech perception by ear and eye: a paradigm for psychological
inquiry. Hillsdale: Lawrence Erlbaum.Pater, Joe (2004). Bridging the gap between perception and production with minimally violable
constraints. In René Kager, Joe Pater & Wim Zonneveld (eds.) Constraints in phonologicalacquisition. Cambridge University Press.
Polka, Linda & Janet F. Werker (1994). Developmental changes in perception of non-native vowelcontrasts. Journal of Experimental Psychology: Human Perception and Performance 20: 421�435.

�23�
Pols, Louis C.W., H.R.C. Tromp, & Reinier Plomp (1973). Frequency analysis of Dutch vowels from 50male speakers. Journal of the Acoustical Society of America 53: 1093�1101.
Rosenblatt, Frank (1962). Principles of neurodynamics; perceptrons and the theory of brain mechanisms.Washington: Spartan Books.
Tesar, Bruce (1997). An iterative strategy for learning metrical stress in Optimality Theory. In ElizabethHughes, Mary Hughes, & Annabel Greenhill (eds.), Proceedings of the 21st Annual BostonUniversity Conference on Language Development, 615�626. Somerville, Mass.: Cascadilla.
Tesar, Bruce (1998). An iterative strategy for language learning. Lingua 104: 131�145.Tesar, Bruce, & Paul Smolensky (2000). Learnability in Optimality Theory. Cambridge, Mass.: MIT
Press.Werker, Janet F., & R.C. Tees (1984). Cross-language speech perception: evidence for perceptual
reorganization during the first year of life. Infant Behavior and Development 7: 49�63.