leasing in europe and beyond state of play and outlook 2015/leasing i… · form of bank lending....
TRANSCRIPT

Leasing in Europe and Beyond
State of Play and Outlook
Cascais, Portugal | 15 October

o Leasing in Europe & Beyond
o Growth in Europe
o Leased Assets & Customers
o State of the Industry
o Industry Performance
o Business Development
Agenda
Leasing in Europe &
Beyond

9.5%
9.9%
9.5%
European leasing market - new volume growth (% YoY)
Growth rates are calculated based on a homogenous sample of members reporting from year to year & are adjusted for exchange rate fluctuations 2007 onwards Source: Leaseurope Annual Surveys
Total volumes Real Estate Equipment incl
vehicles
€275.7 bil €15.4 bil €260.3 bil
New
Volumes
2014
Total outstandings:
(2013 vs 2014)
1.7%
Evolution of the European Leasing Market

Annual growth of new leasing volumes per country
Members not
reporting & non -
members
Leaseurope’s 2013 Annual Survey
Growth rates are adjusted for exchange rate fluctuations
European Leasing Market in 2013
2013/2012
0.7%
0 to 5%
5 to 10%
-5 to 0%
Under - 10%
-10 to -5%
Over 10%
0 to 5%
-5 to 0%
Under - 10%
-10 to -5%

Annual growth of new leasing volumes per country
Members not
reporting & non -
members
Leaseurope’s 2014 Annual Survey
Growth rates are adjusted for exchange rate fluctuations
2014/2013
9.5%
0 to 5%
5 to 10%
-5 to 0%
Under - 5%
10 to 20%
0 to 5%
-5 to 0%
Over 20%
European Leasing Market in 2014

Biannual growth of new leasing volumes per country
Members not
reporting & non -
members
0 to 9%
10 to 20%
-9% to 0
Under -20%
-10 to -20%
Over 20%
H1 2015/2014
9.1%
Source: Leaseurope Member Associations
25 Member Associations reporting; growth rates adjusted for exchange rate fluctuations
European Leasing Market in H1 2015

Leased Assets &
Customers
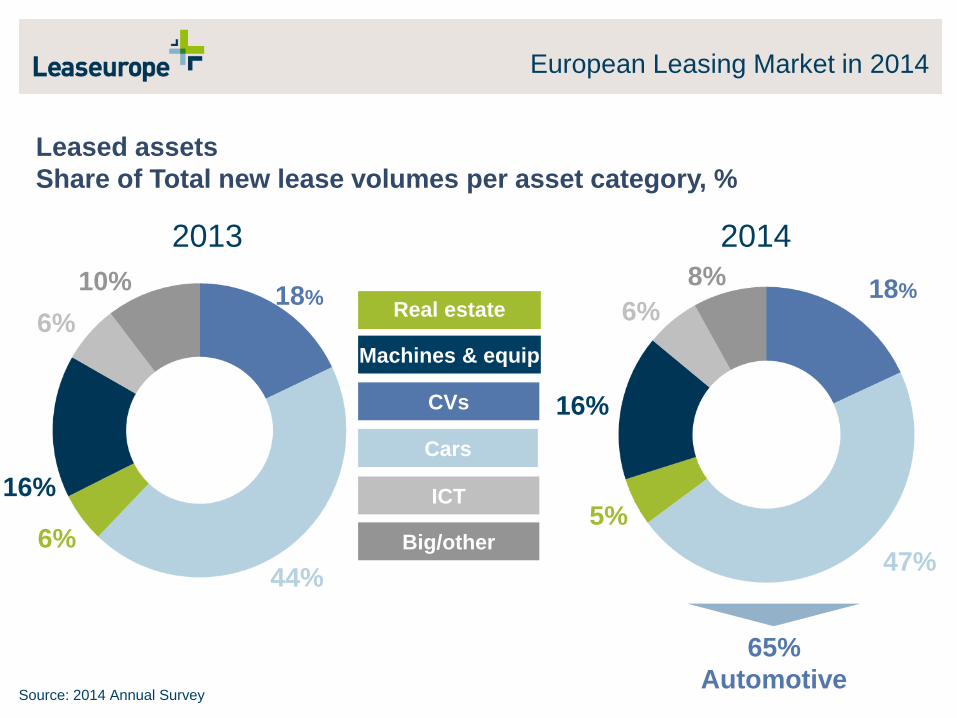
Leased assets
Share of Total new lease volumes per asset category, %
Source: 2014 Annual Survey
2013
65%
Automotive
Machines & equip
Cars
CVs
ICT
Big/other
Real estate
2014
6%
16%
6%
44%
18% 10% 18%
47%
5%
16%
6%
8%
European Leasing Market in 2014

-10%
-5%
0%
5%
10%
15%
20% Total
New lease volumes per asset type – % period on period
(2014/2013)
-15%
Real estate Movables
Growth rates are calculated based on a homogenous sample of members reporting from year to year & are adjusted for exchange rate fluctuations
Source: 2014 Annual Survey based on 33 members reporting
-10%
-5%
0%
5%
10%
15%
20%
-15%
9.5% 9.9% 9.5%
-5%
0%
5%
10%
15%
20%
25%
10.9%
0.9%
-10%
-15%
-20%
Machinery ICT CVs Cars Big Other
10.6%
14.6%
-21.9%
-0.2%
European Leasing Market in 2014

24%
NA
20% to 25%
25% to 30%
10% to 15%
15% to 20%
< 10 %
Lease penetration is the share of total investment financed by leasing calculated as new leasing volumes (excluding consumers)/ gross fixed capital formation in equipment Based on data from Leaseurope’s 2014 Annual Survey
Equipment
penetration
Share of equipment investment financed by leasing (2014)
> 30%
European Leasing Penetration

Evolution of leasing penetration in Europe
19 countries (1999-2014)
Lease penetration is the share of total investment (excluding residential real estate) financed by leasing calculated as new leasing volumes / gross fixed capital formation for the 19 associations reporting from ’99-’14 Source: Leaseurope, Eurostat and AMECO (GFCF)
European Leasing Penetration
10
30
50
70
90
110
130
150
170
190
1999 2000 2001 2002 2003 2004 2005 2006 2007 2008 2009 2010 2011 2012 2013 2014
No
rmali
sed
PR
1999 =
100
Total Equipment Real estate

Leasing clients
New movables leasing volumes by client sector
(2014)
Source: 2014 Annual Survey
European Leasing Market in 2014
Businesses
72%
Consumers
23%
Public sector
3%
Other
2%
% movable
leasing
volumes

Leasing is the most important external finance contributor to SME
investment spending
• SMEs financed 18.9% of their
total investment via leasing in
2013, more than any individual
form of bank lending.
• Bank loans of more than three
years accounted for 15.5% of
SME investment finance in
2013, with the proportion falling
as the bank loan duration
shortens.
• Leasing penetration rates
estimated to have grown in
2014, while cash/equity and all
forms of bank lending are to
decline.
18.9% 21.2%
30.5% 29.1%
7.3% 6.7%
10.0% 9.4%
15.5% 15.0%
17.8% 18.6%
0%
10%
20%
30%
40%
50%
60%
70%
80%
90%
100%
2013 2014
Leasing Cash/EquityShort-term credit Loan 1-3 yrsLoan >3 yrs Other debt
Investment finance in 2013-2014, all SMES
Proportion of investment financed by:
Source : Oxford Economics/EFG
Leasing to European SMEs
Source: "The Use of Leasing Amongst European SMEs", 2015
Percent of SME investment by finance type in 2013-2014

State of the Industry

2014 Ranking survey results • Value of total new contracts within Europe in 2014 (€ thousands)
*These companies also have operations outside Europe
Name Country EU
Countries
Value
2014
Value
2013
1 Société Générale Leasing Solutions (incl. ALD) * France 29 13,961,140 11,966,354
2 BNP Paribas Leasing Solutions (incl. Arval) * France 19 13,402,300 11,920,580
3 Volkswagen Leasing GmbH Germany 3 12,205,747 -
4 De Lage Landen International B.V. * Netherlands 21 10,036,511 9,735,033
5 Deutsche Leasing * Germany 19 7,436,400 7,386,827
6 UniCredit Leasing Italy 17 6,857,850 6,725,231
7 Nordea Finance Sweden 7 5,109,309 4,916,568
8 Alphabet International * Germany 13 4,780,000 4,190,000
9 LeasePlan Corporation N.V. * Netherlands 24 4,775,378 4,460,192
10 Crédit Agricole Leasing & Factoring * France 4 4,421,734 4,002,907
Characteristics of European Market Players

2014 Ranking survey results • Value of total new contracts within Europe in 2014 (€ thousands)
Name Country EU
Countries
Value
2014
Value
2013
11 CM-CIC BAIL France 7 3,577,095 3,540,810
12 DNB Finans Norway 3 3,076,198 2,949,638
13 LBBW Leasing * Germany 3 2,934,355 -
14 RCI Banque * France 36 2,901,783 2,843,589
15 ING Lease Netherlands 5 2,547,906 2,259,142
16 NATIXIS LEASE France 3 2,487,900 -
17 Siemens Financial Services GmbH * Germany 11 2,285,137 2,318,385
18 Raiffeisen Leasing * Austria 19 2,210,641 1,979,186
19 OJSC VEB Leasing * Russia 9 2,087,821 4,154,869
20 OJSC VTB Leasing Russia 4 1,777,099 1,342,517
*These companies also have operations outside Europe
Characteristics of European Market Players
Source: Leaseurope 2014 Ranking Survey of Top European Leasing Companies, BCS June 2015
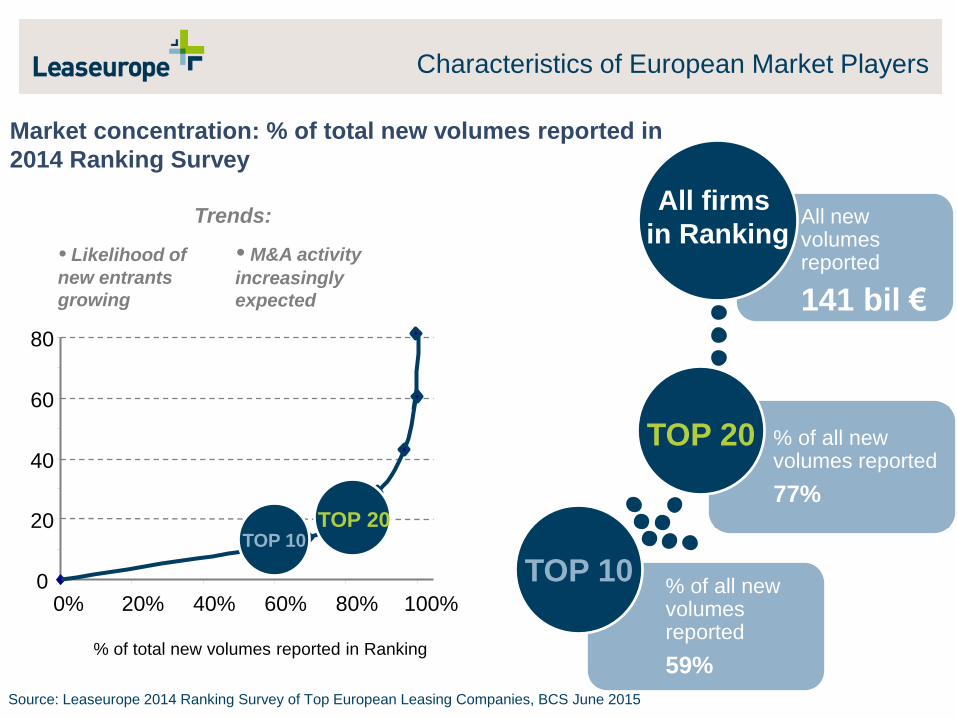
Market concentration: % of total new volumes reported in
2014 Ranking Survey
% of all new volumes reported
59%
% of all new volumes reported
77%
TOP 20
TOP 10
All new volumes reported
141 bil €
All firms
in Ranking Trends:
• Likelihood of
new entrants
growing
• M&A activity
increasingly
expected
% of total new volumes reported in Ranking
0
20
40
60
80
0% 20% 40% 60% 80% 100%
TOP 10 TOP 20
Characteristics of European Market Players

Source: Leaseurope 2014 Ranking Survey of Top European Leasing Firms
New Volumes granted
by TOP 20 (LHS) 2014
All firms
New volumes granted
by all firms (LHS)
Number of firms using
channel (RHS)
TOP 20 firms
2013
From 5% to 6% of
new volumes
From 32% to
31% of new
volumes
Distribution channels used by partaking firms in 2014 Ranking Survey
0
10
20
30
40
50
60
0
5
10
15
20
25
30
35
40
45
50
New
bu
sin
ess v
olu
me
s €
bill
0
2
4
6
8
10
12
14
16
18
20
0
5
10
15
20
25
30
35
40
45
50
New
bu
sin
ess v
olu
me
s €
bill
Characteristics of European Market Players

Industry Performance

Source: Leaseurope Index
The Leaseurope Index – median ratios (2013-Q2 2015)
Profitability ratio Cost / income ratio
Cost of risk ratio
Leaseurope Index

Source: Leaseurope Index
The Leaseurope Index – median ratios (2013-Q2 2015)
RoA RoE
Leaseurope Index

Leaseurope Index: Segment Survey 2014
• An annual supplement to the quarterly Index
• Financial ratios: profitability, cost/income, cost of risk and return on
assets
• Broken down by four asset types: equipment, real estate, passenger
cars and commercial vehicles
• The 2014 survey is the fourth edition of the project
Leaseurope Index

Profitability per asset segment, medians (2010-2014)
26.1%
32.5% 31.1% 34.0%
35.7%
39.6%
30.2%
5.3%
12.3%
24.8% 27.5%
34.8%
29.1% 32.1%
39.4%
31.3%
35.6%
31.9% 34.9%
29.1%
0%
5%
10%
15%
20%
25%
30%
35%
40%
45%
2010 2011 2012 2013 2014 2010 2011 2012 2013 2014 2010 2011 2012 2013 2014 2010 2011 2012 2013 2014
Equipment Real estate Passenger cars & LCVs Commercial vehicles
0%
5%
10%
15%
20%
25%
30%
35%
40%
45%
50%
Q12014
Q22014
Q32014
Q42014
Q12014
Q22014
Q32014
Q42014
Q12014
Q22014
Q32014
Q42014
Q12014
Q22014
Q32014
Q42014
Equipment Real estate Passenger cars & LCVs Commercial vehicles
Leaseurope Index

Cost/income per asset segment, medians (2010-2014)
39.2% 41.5%
43.2% 43.0%
35.7% 34.8%
39.2%
44.7% 45.3% 41.4% 41.6% 42.7%
50.9% 49.2%
45.3% 41.9%
36.4%
44.0%
49.0% 47.7%
0%
10%
20%
30%
40%
50%
60%
2010 2011 2012 2013 2014 2010 2011 2012 2013 2014 2010 2011 2012 2013 2014 2010 2011 2012 2013 2014
Equipment Real estate Passenger cars & LCVs Commercial vehicles
0%
5%
10%
15%
20%
25%
30%
35%
40%
45%
50%
Q12014
Q22014
Q32014
Q42014
Q12014
Q22014
Q32014
Q42014
Q12014
Q22014
Q32014
Q42014
Q12014
Q22014
Q32014
Q42014
Equipment Real estate Passenger cars & LCVs Commercial vehicles
Leaseurope Index

Cost of risk per asset segment, medians (2010-2014)
Leaseurope Index
1.0%
0.8% 0.8%
0.7%
0.5% 0.4%
0.3%
0.7% 0.7%
1.1%
0.6%
0.4%
0.3%
0.5%
0.3%
0.6%
0.4% 0.4%
0.6%
0.3%
0.0%
0.2%
0.4%
0.6%
0.8%
1.0%
1.2%
2010 2011 2012 2013 2014 2010 2011 2012 2013 2014 2010 2011 2012 2013 2014 2010 2011 2012 2013 2014
Equipment Real estate Passenger cars & LCVs Commercial vehicles
0.0%
0.1%
0.2%
0.3%
0.4%
0.5%
0.6%
0.7%
Q1
2014
Q2
2014
Q3
2014
Q4
2014
Q1
2014
Q2
2014
Q3
2014
Q4
2014
Q1
2014
Q2
2014
Q3
2014
Q4
2014
Q1
2014
Q2
2014
Q3
2014
Q4
2014
Equipment Real estate Passenger cars & LCVs Commercial vehicles

RoA per asset segment, medians (2010-2014)
Leaseurope Index
0.7%
1.1% 1.0%
1.1% 1.2%
0.6%
0.3% 0.3% 0.2%
0.1%
1.0%
1.3% 1.3% 1.3%
1.9%
0.9% 1.0%
1.1%
0.8% 0.7%
0.0%
0.2%
0.4%
0.6%
0.8%
1.0%
1.2%
1.4%
1.6%
1.8%
2.0%
2010 2011 2012 2013 2014 2010 2011 2012 2013 2014 2010 2011 2012 2013 2014 2010 2011 2012 2013 2014
Equipment Real estate Passenger cars & LCVs Commercial vehicles
0.0%
0.5%
1.0%
1.5%
2.0%
2.5%
Q1 2014
Q2 2014
Q3 2014
Q4 2014
Q1 2014
Q2 2014
Q3 2014
Q4 2014
Q1 2014
Q2 2014
Q3 2014
Q4 2014
Q1 2014
Q2 2014
Q3 2014
Q4 2014
Equipment Real estate Passenger cars & LCVs Commercial vehicles

Business
Development

The European market is one of the largest leasing markets in the
world. Leasing plays a central role at the heart of the real economy.
Future trends
Develop services and solutions (mobility…)
Finance new markets (cloud, third platform, new energy…)
Foster innovation (big data…)
Asset focus and specialisation (new energy…)
Support customers and vendors globally
Looking ahead, the European leasing industry must be a at the
forefront of innovative financing solutions in order to take
advantage of the shift from “ownership” to “usage”
Concluding Remarks From 2014

Balance of expectations for business over next six months
Balance between respondents expressing positive and negative opinions of the outlook over the next six months
Source: Leaseurope/Invigors Business Confidence Survey June 2015
Margins
Bad Debt
Business Confidence Survey
Net Profit
New Business Volumes

Leasing in Europe and Beyond
State of Play and Outlook
Cascais, Portugal | 15 October