leave nostone unturned. -...
TRANSCRIPT

Compiled for the Coachella Valley Economic Partnership by John E. Husing, Ph.D., Economics & Politics, Inc.
The Coachella Valley Economic Report. 2008
Leaveno stone
unturned.

CVEP, AS AN ORGANIZATION, was formed
approximately 12 years ago as primarily
a business-driven economic development
organization with an important, albeit
limited, role for local government. For
over a decade now our private sector has
done a remarkable job of attracting new
wealth, jobs and opportunity to our com-
munity. It was also during that decade
that our country, and Riverside County in
particular, had unprecedented economic
growth. Over the recent two years, as our
economic markets have gone through a
period of adjustment and budgets became
increasingly tight, funding for CVEP lev-
eled off to a point where our resources
could not keep pace with our success.
As a result, this past year we made a
concerted effort to provide greater
involvement for our regional govern-
mental entities and Native American
tribes – and they have stepped up in a big
way. We have roughly doubled the fund-
ing for the organization and financially
positioned it to move to the next level on
behalf of the entire Coachella Valley.
This level of commitment by our public
sector leaders is a testament to the vision,
entrepreneurship and leadership in our
valley. After all, economic development
is not just about creating jobs: it’s about
inculcating, molding and shaping our
future for decades to come. We are all
pulling the same oar. Nowhere has this
been better demonstrated than in the
increased contributions of our partners
this year. For example, at a time when
earnestly seeking to expand its desert
campus, UCR gave the first $50,000
towards our expansion effort. Desert Hot
Springs was next with a contribution of
$50,000, followed by Eisenhower Medical
Center. The list goes on and on, but I men-
tion these three organizations in particu-
lar because all of them are in the midst of
their own significant financial challenges,
yet they saw it fit and appropriate tomake
an investment in the future of our valley.
They realized that their success potential
is greatly enhanced by CVEP’s success
and that requires a cohesive, well-funded,
regional economic effort.
Palm Desert and Indian Wells each con-
tributed $50,000 and every other valley
city nearly tripled their previous contri-
butions to CVEP. Additionally, Imperial
Irrigation District has committed $100,000
per year over the next three years, making
them CVEP’s largest single contributor.
Simply put, we all pulled together toward
this one common goal. Congratulations.
This coming year, thanks to your increased
support, CVEPwill be proactively develop-
ing a new regional economic model and
restructuring our organization to better
reflect all of the stakeholders in our valley.
Together we can and will shape our
tomorrow with a renewed vigor.
Thank you for your support of the
Coachella Valley Economic Partnership.
A MESSAGE FROM THE CHAIRMAN
Jim Ferguson
Chairman of the Board

3
TOP IC PAGE
A Letter from Jim Ferguson, Chairman of the Board 1
Executive Committee and Board of Directors 2007-2008 4
A Message from John Soulliere, President/CEO 6
PENTA: Building a Foundation for Success 10
Career Pathways for a 21st Century Workforce 13
Coachella Valley Economy: Brief Analysis 14
Exhibit List 21
Demographics 24
Employment 32
Housing 44
Taxable Sales 50
Banking 54
Assessed Valuation 58
Crime Rates 62
Education 64
Colleges and Universities 66
Appendix (Employment & Payroll Detailed Tables) 68
Coachella Valley Economic Report, 2008
TABLE OF CONTENTS
PLAT INUM SPONSORS
GOLD SPONSORS
MED IA SPONSORS
MORNING KEYNOTE SPEAKER SPONSOR
BUILDING INDUSTRY ASSOCIATION - DESERT CHAPTER
SILVER SPONSORS
A.A. WEBB AND ASSOCIATES • AGUA CALIENTE CASINO RESORT SPA • CANYON NATIONAL BANKCITIBANK • CITY OF PALM SPRINGS • ORR BUILDERS • PETERSON SLATER & OSBORNERIVERSIDE COUNTY EDA • SOUTHERN CALIFORNIA EDISON • VERIZON FOUNDATION
NEW MEMBER SPONSOR HOSPITALITY SPONSOR
THE PENTA BUILDING GROUP THE CHANK GROUP
CITY SPONSORS
City of Cathedral City • City of Coachella • City of Desert Hot Springs • City of IndianWellsCity of Indio • City of La Quinta • City of Palm Desert • Town of Yucca Valley
PRESENTED BY
4
Coachella Valley Economic Partnership
EXECUT IVE COMMITTEE
2007-2008
Thank you to the following individuals and the organizations they represent, for
their dedication and commitment to CVEP this past year:
Chairman: Jim Ferguson, Ferguson Law Firm
Immediate Past Chair: Bob Marra, Wheeler’s Market Intelligence
Vice Chairperson: Michelle Krans, The Desert Sun
Secretary: Kevin McGuire, Palm Desert National Bank
Treasurer: Aubry Serfling, Eisenhower Medical Center
Member-at-Large: Ben Scholten, Rabobank
Member-at-Large: Lee Morcus, Kaiser Restaurant Group
Member-at-Large: Steve Pougnet
Member-at-Large: Kathy DeRosa, City of Cathedral City
Public (West): Agua Calliente Band of Cahuilla Indians
Public (East): City of La Quinta
EXECUTIVE LEVEL MEMBERS
City of Desert Hot Springs
City of Indian Wells
City of Palm Desert
Economic Development Agency of Riverside County
IID Energy
University of California Riverside/Palm Desert Campus
BOARD LEVEL MEMBERS
Agua Caliente Band of Cahuilla Indians Albert A. Webb Associates
Best Best & Krieger LLP Blytheco, LLC
Burrtec Waste & Recycling Services Citibank
City of Cathedral City City of Coachella
City of Indio City of La Quinta
City of Palm Springs City of Rancho Mirage
Delfino Palm Desert Desert Regional Medical Center
Eisenhower Medical Center Granite Construction
Integrated Wealth Management Kaiser Restaurant Group
Kaiser Permanente Pacific Western Bank
Palm Desert National Bank Rabobank
Southern California Edison Southern California Gas Company
Spotlight 29 Casino Sunline Transit Agency
The Desert Sun Time Warner Cable
Verizon Communications


A M E S S A G E F R OM
J O HN S O U L L I E R E , P R E S I D E N T / C E O
Leaveno stone
unturned.

I M A G I N E .
Envision what our future can be.
INSP IRE .Instill vision and motivate others towards action.
C O L L A B O R A T E .Lock arms and press toward our defined goals.
A C H I E V E .The outcomes of our hopes and dreams begin to appear.

8
Most of us have heard the expression
“the Devil is in the details.” No doubt
many of us have experienced the reality
of that phrase when some theoretically
“great” idea failed due to overlooking a
seemingly insignificant detail. Maybe a
lesser known fact is that this phrase is
believed to be a variation of “God is in
the details.” Whether you approach it
from a positive or negative perspective
the point is clear — details matter!
When it comes to the economy of the
Coachella Valley, the Coachella Valley
Economic Partnership (CVEP) has been
committed to working with its partners
to better understand those details in the
hope of moving our region towards a
sustainable, prosperous future.
Even as the country is facing
extraordinary economic chal-
lenges, we (CVEP and the
greater Coachella Valley
community) cannot afford to
be paralyzed by fears of what
may come. Wemust take control
of our destiny through utilizing this
down cycle to plan for eventual recov-
ery. Readiness will be a key to our suc-
cess as an organization and as a region in
the future. We will either uncover the
opportunities of change or allow “fate”
to take us forward to a destination that
may or may not be something we want.
The theme of CVEP’s expanded 2008
Economic Summit is “Leave No Stone
Unturned.” The phrase originates from a
Greek legend about a lost treasure. When
asked where to find this great prize, the
Oracle responded, “leave not one stone
unturned.”
For our purposes, the phrase suggests
that if we are to uncover the yet-to-be-
discovered treasures of the Coachella
Valley’s economic potential, we must
investigate every possibility, sparing no
effort. Moreover, we propose that there
are four great “stones” that must be
turned over to lead us to
our prize. These
stones are called
imagine, inspire,
collaborate, and
achieve.
I M A G I N E
We can only begin to
discover the economic potential of
our region by first daring to imagine
what it can be. The great sculptor
Michelangelo is reputed as having said,
“In every block of marble I see a statue as
plain as though it stood before me …. I
John Soulliere

9
have only to hew away the rough walls
that imprison the lovely apparition to
reveal it to other eyes
as mine see it.” To
imagine is to
envision.
I N S P I R E
Inspire is
comprised of
instilling vision and motivating others
towards action. Once we
imagine what we can
be, we are compelled to
ignite that vision in the
minds of others. When we
look at the Coachella Valley,
are we able to identify a com-
mon vision for an economically
sustainable future?
C O L L A B O R A T E
To collaborate is to lock arms and press
toward our defined goals. The most criti-
cal components of this idea are agree-
ment and resource allocation. If we agree
upon the goal and understand its impor-
tance, we focus our resources to both
develop and implement a strategy to
achieve it. Remember, after the planning
the real work begins.
A C H I E V E
Finally, we achieve. The outcomes of our
hopes and dreams begin to appear on
the horizon. More importantly, we
have been responsible at this
point in our regional
history to create
and pass on a
working model to the
next generation.
For 2008-09, CVEP has
been pledged financial
support to spearhead a
comprehensive
and candid
look at the
economic
potential of
the Coachella
Valley— its
strengths and weaknesses, its opportuni-
ties and threats. This analysis will create
a foundation from which a regional
“Blueprint for Economic Success” will be
developed. This Blueprint will enable
CVEP to focus its efforts on aggressive
business attraction while continuing to
influence development of community
amenities that will increase the region’s
draw to industry and higher wage jobs.
Regional economic development must
be approached holistically, taking into
account every asset of the
broader community and
presenting it to indus-
try decision makers as
a complete Coachella
Valley package.
I am honored to have served
with the Board of Directors, Executive
Committee and general members
throughout this, my first year with CVEP.
Special thanks go out to those organiza-
tions and individuals who determined
that continued and increased financial
support of CVEP in the face of these most
challenging times is an investment in
the future of the entire region.
Additionally, thanks to those who have
become partners this past year. Your
investment will help build a more effec-
tive organization to the benefit of our
Coachella Valley.
This Blueprint will enable CVEP to focus its efforts on aggressive
business attraction while continuing to influence development
of community amenities that will increase the region’s draw to
industry and higher wage jobs.
10
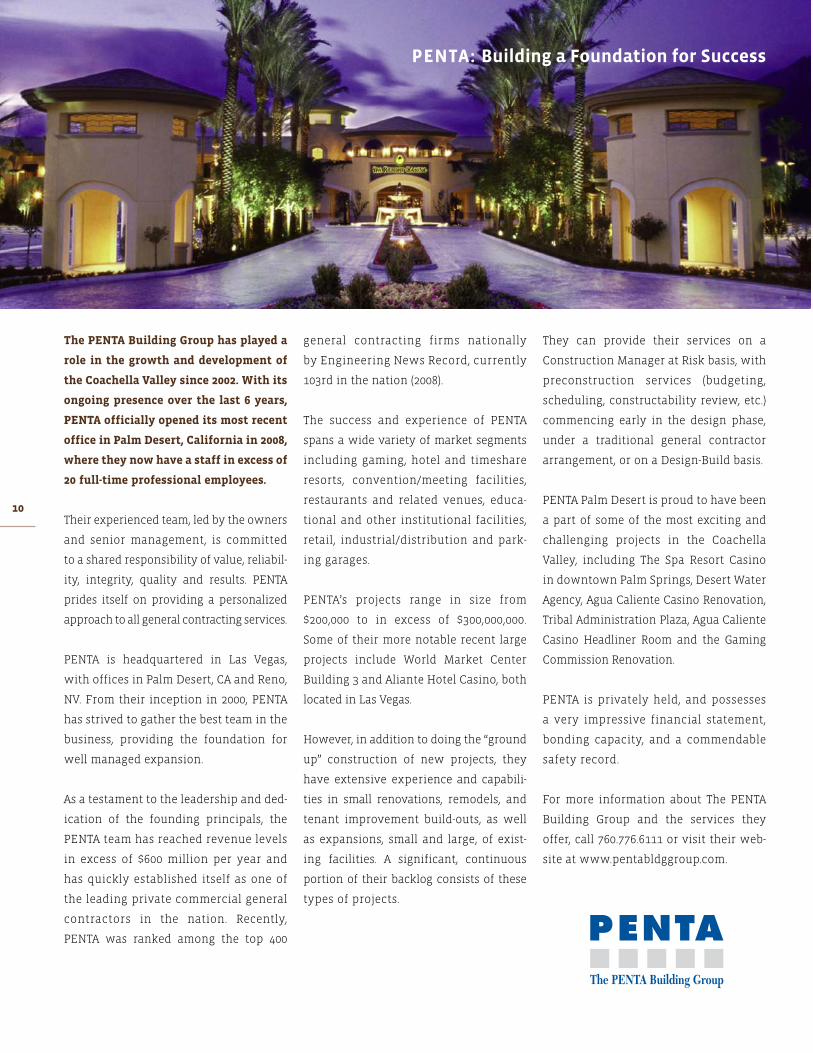
The PENTA Building Group has played a
role in the growth and development of
the Coachella Valley since 2002. With its
ongoing presence over the last 6 years,
PENTA officially opened its most recent
office in Palm Desert, California in 2008,
where they now have a staff in excess of
20 full-time professional employees.
Their experienced team, led by the owners
and senior management, is committed
to a shared responsibility of value, reliabil-
ity, integrity, quality and results. PENTA
prides itself on providing a personalized
approach toall general contracting services.
PENTA is headquartered in Las Vegas,
with offices in Palm Desert, CA and Reno,
NV. From their inception in 2000, PENTA
has strived to gather the best team in the
business, providing the foundation for
well managed expansion.
As a testament to the leadership and ded-
ication of the founding principals, the
PENTA team has reached revenue levels
in excess of $600 million per year and
has quickly established itself as one of
the leading private commercial general
contractors in the nation. Recently,
PENTA was ranked among the top 400
general contracting firms nationally
by Engineering News Record, currently
103rd in the nation (2008).
The success and experience of PENTA
spans a wide variety of market segments
including gaming, hotel and timeshare
resorts, convention/meeting facilities,
restaurants and related venues, educa-
tional and other institutional facilities,
retail, industrial/distribution and park-
ing garages.
PENTA’s projects range in size from
$200,000 to in excess of $300,000,000.
Some of their more notable recent large
projects include World Market Center
Building 3 and Aliante Hotel Casino, both
located in Las Vegas.
However, in addition to doing the “ground
up” construction of new projects, they
have extensive experience and capabili-
ties in small renovations, remodels, and
tenant improvement build-outs, as well
as expansions, small and large, of exist-
ing facilities. A significant, continuous
portion of their backlog consists of these
types of projects.
They can provide their services on a
Construction Manager at Risk basis, with
preconstruction services (budgeting,
scheduling, constructability review, etc.)
commencing early in the design phase,
under a traditional general contractor
arrangement, or on a Design-Build basis.
PENTA Palm Desert is proud to have been
a part of some of the most exciting and
challenging projects in the Coachella
Valley, including The Spa Resort Casino
in downtown Palm Springs, Desert Water
Agency, Agua Caliente Casino Renovation,
Tribal Administration Plaza, Agua Caliente
Casino Headliner Room and the Gaming
Commission Renovation.
PENTA is privately held, and possesses
a very impressive financial statement,
bonding capacity, and a commendable
safety record.
For more information about The PENTA
Building Group and the services they
offer, call 760.776.6111 or visit their web-
site at www.pentabldggroup.com.
PENTA: Building a Foundation for Success

11
12

13
Imagine a region that brings together all
systems of education, K to University, in
a collaborative effort with business to
create career pathways strategies for its
future economy. Then imagine this same
regional collaboration launching a $10
million scholarship and student support
system to move more students into and
through college in fields of study related
to the new economy.
The Coachella Valley, under the leadership
of CVEP, has done exactly that by creating
the Career Pathways Initiative and the
Pathways to Success scholarship support
program. With support from major foun-
dations and local partners, CVEP has
transformed the region’s understanding
of economic development in order to
achieve a workforce that is technically
competent and educated to meet the
needs of new industry.
CVEP has inspired the region to link
business, education, local governance
and social support systems in an all out
effort to make education relevant to the
world of business and to put educators
and business leaders into new relation-
ships through industry councils and col-
laborative relationships that change the
way we teach our students.
The models that are evolving in the
Coachella Valley have been widely rec-
ognized by organizations such as The
Ford Motor Company Fund, James
Irvine Foundation and the College
Access Foundation, to name a few. These
organizations recognize the work of
CVEP and its business and education
partners throughout the Coachella
Valley as the wave of the future for
developing a qualified, well educated
and prepared workforce.
Career Pathways for a 21st Century WorkforceLinked to a Regional Higher Education Scholarship and Student Support Strategy
We invite your business to join our team.
A commitment to the Coachella Valley
and CVEP assures direct linkages to the
educational innovations of the region
and access to a transformative approach
to economic development.
Join us as we explore and implement
these innovative new strategies. For
more information, refer to our website:
www.cvep.com.

14
Coachella Valley Economy: BR I EF ANALYS I S
John E. Husing, Ph.D.
15
In 2008, the Coachella Valley’s economy is caught up in the difficulties unleashed
by the excesses of the recent housing boom in Southern California. The current
situation began because Southern California’s home construction has not kept up
with its population growth over the past twenty years. As a result, once the
post-Cold War recession ended, home prices began rising primarily to chase away buyers
since there were not enough houses to fill all of the demand. In roughly 2004, speculators
began noticing how fast home prices had been rising and entered the market with a
vengeance. Sub-prime and alt-A financing also entered the picture that year. Together, they
helpedpower an existinghomeprice gain of 30.8% in theCoachella Valley in 2004. The jump
was 22.6% in 2005. Those high increases caused sales to slow, but prices continued upward
rising by 6.6% in 2006 and 1.6% in 2007 before the collapse of –21.3% through 2nd quarter
2008. That drop took the median price back to roughly its $365,000 level of 2004, leaving
many buyers who purchased from 2004-2007 upside down on their mortgages.
Home sales were affected by this pricing pattern. From
late 2001 until second quarter 2004, the Coachella
Valley’s seasonally adjusted existing home sales soared
98.4% to 2,061 quarterly units. However, as prices rose
rapidly through 2004-2007, volumes began falling, even-
tually reaching a modern low of 948 units by 4th quar-
ter 2007. Sales have since jumped 35.1% to 1,280 units as
foreclosure sales have shown that there is significant
demand at 2004 prices.
As the data in this report show, the decline in home
sales has led to difficulties in numerous aspects of the
Coachella Valley’s economy. Construction jobs and pay-
roll have decreased, hurting a crucial employment sec-
tor for the valley’s many blue collar workers. Retail
sales have fallen as people are not buying furniture,
appliances and home improvement supplies. High gaso-
line prices have contributed to the retail sales difficulty
as they have reduced vehicle purchases as well as the
retail spending of lower income consumers. As the
sales tax is the primary source of discretionary funding
for municipal governments, their budgets are being
commensurately hurt. Assessed valuation was not down
in 2008 but will be in 2009, adding to this difficulty.
Meanwhile, bank deposits are off, including on a per
capita basis, indicating the economic downturn is direct-
ly affecting household incomes.
Looking ahead, a return to economic prosperity will
take a housing market recovery. Here, the key is the sig-
nificant increase in home sales that has occurred in
2008 now that prices have returned to 2004 levels. This
is a sign that there remains a pent-up demand for
homes. Importantly, realtors report multiple offers
from families wanting to buy the repossessed homes
being offered at these prices. It indicates that this is
likely the level of pricing that will emerge once the
flow of foreclosures has halted. This situation gives the
Coachella Valley three short-term challenges:
� It needs to take advantage of recent federal legislation
to reduce the number of foreclosures as fast as possible.
Until that flow is significantly diminished, the current
economic difficulties will persist.
� It needs to find ways to ensure that home builders
can produce homes at 2004 prices. This is a challenge,
given the increases in fees, material and labor cost
since 2004. It will require adjustments in the sizes of
homes, sizes of lots, types of products built and the fees
charged to build homes.
� It needs to ensure that foreclosed homes that cannot
be easily inhabited are retrofitted and sold to families,
not sold “as is” at auction to landlord investors who
can upset the nature of single family neighborhoods by
injecting large numbers of renters into them.
Looking longer term, the data in this report show that
apart from the housing cycle, the Coachella Valley’s

16
The skills required to work in these sectors often do
not require well-educated workers. The major excep-
tion to this fact is the valley’s large health care sector.
� The Coachella Valley’s agricultural heritage has meant
that, historically, a significant blue collar population has
always lived in it. Though agriculture is now less of a
growth force, many people from these families consti-
tute a significant share of the local labor force. This
working population has tended to live in Indio,
Coachella, Desert Hot Springs and Cathedral City, while
their jobs have often been in the other five cities. Though
recent housing trends have tended to breakdown some
of this separation, the valley still has a significant divi-
sion between cities with high income people needing
services and cities with modest income residents
who provide them.
These facts about the economic life of the Coachella
Valley, today, present the area with its long-term eco-
nomic challenges:
� How to broaden the economy away from the exag-
gerated influence of the ebbs and flows of U.S. discre-
tionary income to even out the levels of its peaks
and valleys.
� How to plan for an economy with a much larger full-
time retirement population and use that emerging
trend to help stabilize the valley’s ebbs and flows.
� How to take advantage of the migration of the edge
of urbanized Southern California into the portions of
the valley closest to San Gorgonio Pass to help diversi-
fy the economy.
� How to develop industries that will employ well-edu-
cated and higher paid workers and help raise the
incomes of local workers.
� How to raise the educational aspirations and achieve-
ment of the region’s school children as well as its adult
workforce, given that higher paying jobs tend to require
greater levels of education and/or skill.
Dealing with these broad issues requires the develop-
ment and execution of economic strategies. This has
economy can still be thought of as a relatively isolated
economy operating according to dynamics that, while
related to the Inland Empire and Southern California,
have distinctive rhythms and elements. This is the case
for five reasons:
� The area is a national destination for tourists and
conventions plus people with seasonal second homes.
As the flow of these people to the Coachella Valley is
heavily dependent upon U.S. discretionary income, the
Coachella Valley’s economy has tended to have an
exaggerated business cycle: soaring in good times and
plunging in bad times. That said, in the past four years,
that fact has not been in evidence, with the valley actu-
ally fluctuating less than the surrounding Inland
Empire. This is likely the result of the Coachella Valley’s
growing a full time resident population.
� The region has grown up as an important Southern
California and national retirement center. As a result,
an important portion of its economy is devoted to pro-
viding services to an aging population. This is seen in
its health care industry as well as its retail, restaurant
and entertainment (including golf courses and tennis
clubs) sectors. With the baby boomer generation now
at 62 years old, residential construction has been added
as a major economic force. Meanwhile, the number of
full time residents of the area is growing as retirees,
many from Southern California, make the decision to
migrate to the valley.
� The expanding frontier of Southern California’s
urban economy has not yet reached the valley. Thus,
the jobs within the region tend to be filled by local res-
idents while relatively few local residents tend to be
commuters to jobs outside of it. This fact means that
the economy can be thought of as one that ebbs and
flows according to the volume of dollars flowing into it
from any location outside of it. That isolation will like-
ly break down now that the edge of the urban region is
in Beaumont and heading east along the I-10 freeway.
� An economy that evolves based upon providing
services to tourists, conventions, seasonal second
homeowners and a growing base of retirees is one in
which a significant share of the job base is in retailing,
consumer services, hotels, amusement and construction.

17
become the essential mission of the Coachella Valley
Economic Partnership. Some comments on the directions
which their work can and/or is taking are thus in order:
� Certainly, the valley will continue to welcome the
influx of spending by national tourists, conventions
and seasonal residents. These outside flows of dollars
are a key portion of the region’s prosperity, because as
this money changes hands locally, it has a multiplied
impact on the area’s economy. The issue is not how to
lower these flows of outside funds, but rather to broad-
en the economy with other sources of funds that are
not subject to the seasonal and national business cycle
fluctuations inherent in an economy heavily based on
this form of spending.
� One way to broaden and stabilize the Coachella
Valley’s economy is being naturally presented to it by
the aging of the baby-boomer population. Already,
numerous members of this generation are beginning
to eye the valley as their full-time retirement home.
Many of the couples making these decisions are
Southern Californians and are not afraid of the heat
that impacts desert areas in the summer. Their retire-
ment incomes will provide the region with a year-
round source of outside dollars that will serve to blunt
the Coachella Valley’s seasonal cycle. And, as pension
incomes are relatively stable, they will also have the
desired impact of blunting the ebbs and flows that
hit the local economy when the U.S.
economy goes through its business
cycles. In effect, this flow of
retirees is a trend that should be
encouraged by the valley’s leaders.
� Like it or not, the edge of urban
Southern California is now quite close to the Coachella
Valley. The outward migration of residential construc-
tion for a commuter population has now reached
Beaumont along the I-10 freeway. While the recent
building cycle has come to a difficult end, the shortage
of housing in Southern California makes the next up-
tick inevitable. When it occurs, Banning will be the
next city caught up in a building boom, followed by
north Palm Springs and Desert Hot Springs. This will
put added pressure on the valley’s I-10 linkage to the
balance of Southern California as many of these new
residents will be commuters. This pattern has already
emerged in the Victor Valley and its issues can be
instructive for leaders in the Coachella Valley.
The incomes brought home by these commuters will
have a stabilizing impact on the region’s economy as
they will ebb and flowwith Southern California’s econ-
omywhich often has beenmore stable than the nation-
al economy. There have been two exceptions to that
fact. The first was the aerospace/defense bust at the
end of the Cold War. The second is occurring nowwith
the exaggerated downturn in construction due to the
excesses of the most recent home building cycle.
� Meanwhile, the disappearance of industrial land in
the urbanized portion of the Inland Empire, combined
with the rapid rise of imports through the ports of Los
Angeles and Long Beach will likely open a new source
of jobs in the Coachella Valley in the next decade. These
will be in the logistics sector. In 2007, 43.2% of all con-
tainers entering the
country passed
through
Southern California’s
ports. There is a crying need for
facilities where the goods in these containers can be
unloaded, stored, managed and shipped as needed. The
Coachella Valley is the next place along the I-10 truck
route and UP Railroad mainline that will be asked by
the development community to host these facilities
once the San Bernardino-Redlands area runs out of
room. Already, large buildings are going up in San
Gorgonio Pass and UP Railroad is seeking a site for a
new intermodal yard along its mainline, a key piece of
18
logistics infrastructure since it is where containers
move between trucks and trains. Of late, the high price
of diesel fuel has slowed the outward move of build-
ings. That will be overcome once the available space in
area’s like Ontario is completely absorbed.
As the data following show, distribution is the blue collar
sector that pays more than either construction or manu-
facturing both in the Coachella Valley and in Southern
California. It can thus serve to provide a source of higher
pay to workers who do
not have good educations
and need a career path
based via on-the-job learn-
ing to reach the middle
class. It is also a sector
that can broaden the val-
ley’s economy and make
it less dependent upon
the flow of funds that are
seasonal or follow the U.S.
business cycle. However,
this sector brings impor-
tant issues. It will put
pressure on the I-10 free-
way. Unless its air quality
issues are addressed, it
will impact the levels of
diesel emissions. For the
Coachella Valley, it will
also provide higher wage
competition for the kinds
of workers now earning
less in the consumer serv-
ice sectors. Like com-
muter-based residents, the flow of this activity into the
valley is likely inevitable and leaders need to be planning
for it.
� Another way to raise the incomes of workers in the
Coachella Valley is to attempt to stimulate sectors that
pay better. The Coachella Valley Economic Partnership
has targeted five such parts of the economy: health
care, multi-media, advanced technology, education and
recreation.
� The health care sector is a natural for the valley
since it is already awell-defined cluster including hos-
pitals, out-patient care, rehabilitation, dentists and
related work. In addition, the valley has a national
reputation in these areas. What is lacking is a labor
force that can keep up with the expansion of the sec-
tor, given the educational and skill levels needed to
work within it. In addition, the maturity of the sector
plus the anticipated growth in base of local full-time
retirees, opens the possibility of research and devel-
opment on techniques and products needed by what
will be a growing segment of America’s population.
� The multi-media cluster is another natural for the
valley. Traditionally, it
has been home to the
stars of radio, television
and the cinema. It is
often the location for
major production shoots.
There are annual film
and music festivals that
are growing in industry
recognition. Today, many
of the technicians and
the artists who operate
within the sector are
relocating to the area.
This gives the region a
base of activity and
knowledge from which
to build. In addition, in
the virtual world, many
of the activities that can
drive this sector can be
located anywhere. Here,
an example is the remote
location of George Lucas’s
Industrial Light andMagic
in Marin County.
� One just has to drive by the windmill farms at the
entrance to the Coachella Valley or read about the
solar energy farms in Southern California’s deserts to
realize that alternative energy production is already
showing up in these areas. In addition, as a desert
region, the valley has long had to be aware of the
need for advanced water technology, a fact now
heightened by the need to preserve the Salton Sea.
With petroleum prices soaring, global warming and
energy independence emerging as issues, plus popu-
lation straining our water and electrical resources,
there is and will be a rising worldwide demand for
alternative energy and water solutions. Again, the

19
valley has an important base of knowledge and
activity from which to develop these sectors.
� There is no such thing as a poor, well-educated
region, unfortunately the opposite is also true. That is
why CVEP’s economic development strategy seeks to
tackle the relatively low educational level of the
area’s adult workforce as well as the marginal per-
formance of toomany of its school children. Strategies
for doing so must be partially driven from the busi-
ness community, given
its increasing under-
standing of the types
of workers it will need.
In addition, the devel-
opment of the strate-
gies just mentioned
has also involved the
framing of educational
strategies as they can-
not succeed without
them. Similarly, the
expansion of the logis-
tics sector will require
local access to work-
force training.
� A good sign is the
fact that test scores in
the area have been ris-
ing in all three local
school districts, with
particular success in
the Desert Sands dis-
trict. Meanwhile, each
of the three districts is in various stages of adding
facilities and a new Catholic high school has been
sited. Noteworthy is the interest and willingness of
College of the Desert to participate in working to
increase the skills of the adult workforce. The cam-
pus is expanding at its current site and at two addi-
tional locations.
� Ultimately, the expansion of the Cal State San
Bernardino campus aswell as UCR’s nearby Heckmann
Center for Entrepreneurial Studies will also be of
great significance in helping the Coachella Valley to
both hold its best students and boost its economy.
This year, Cal State will break ground on its third
building, a Health Sciences facility. It will provide
training in one of CVEP’s key target sectors. In addi-
tion, UCR has launched an MBA program plus an MFA
in Screenwriting. The second of these will be on point
to another of CVEP’s targeted sectors. UCR campus is
also assisting in the formation of an Angel Network to
assist entrepreneurs in acquiring funding.
� Recreation is CVEP’s other targeted sector. This is in
keeping with the Coachella Valley’s obvious strength
in serving retirees, tourists, conventioneers and
others wanting to enjoy
golf, tennis, gaming, bik-
ing and hiking, as well as
rock climbing in nearby
Joshua Tree National Park.
This sector already brings
huge amounts of tourists
dollars to the region. The
Indian gaming sector has
added a new element
that pays above average
for the sector group.
Affiliatedwith these activ-
ities is the possibility for
expanded design and
manufacturing of the
equipment associated
with these activities such
as the alternative energy
vehicles related to golf
carts and the specialized
equipment used in rock
climbing.
Today, the Coachella Valley
has an economy that is facing the short-term issues
from a housing cycle gone bad. Clearly, its leaders need
to deal with lowering the flow of foreclosure sales,
defending neighborhoods with a large number of
potential problem homes, and ensuring that builders
can succeed in the next housing cycle. Looking farther
ahead, the Coachella Valley’s underlying economy has
gained considerable strength. Over the long haul, its
leaders need to deal with the fact its composition has
historically made its business cycle unusually volatile
and the fact that a disproportionately large share of its
work is concentrated in modest paying sectors. Here,
conditions are developing in ways that could well
allow the region’s leaders to improve upon both of
these situations.
Over the long haul,
Coachella Valley leaders
need to deal with the fact
that its composition has
historically made its
business cycle unusually
volatile and the fact that
a disproportionately
large share of its work is
concentrated in modest
paying sectors.

20

21
NUMBER TOP IC PAGE
DEMOGRAPH ICS
1 Population Growth, Coachella Valley, 1990-2008 24
2 Population Growth Rates, Coachella Valley & Other Major Areas, 2000-2008 25
3 Population By City, Coachella Valley Communities, 2008 25
4 Population Growth By City, Coachella Valley Communities, 2000-2008 25
5 Age Distribution, Coachella Valley & Inland Empire, 2007 26
6 Adult Educational Level, Coachella Valley & So. California Counties, 2007 26
7 Ethnic Composition, Coachella Valley Cities, 2007 29
8 Income Estimates, Coachella Valley & Inland Empire, 2007 29
9 Median Income By City, Coachella Valley, 2007 30
10 Total Income By City, Coachella Valley, 2007 30
EMPLOYMENT
11 Employment, Coachella Valley, 1991-2007 32
12 Employment Gain By Sector, Coachella Valley, 2000-2007 32
13 Employment Growth Rates, Coachella Valley & Inland Empire, 1991-2007 33
14 Employment Distribution By Sector, Coachella Valley, 2007 34
15 Employment Distribution By Sector, Coachella Valley, 2000 34
16 Payroll, Coachella Valley, 1991-2007 34
17 Payroll Growth, Allowing for Inflation, Coachella Valley, 2000-2007 35
18 Payroll Gain By Sector, Coachella Valley, 2000-2007 36
19 Payroll Per Job, Coachella Valley, 1991-2007 36
20 Growth in Average Pay Per Job, Allowing for Inflation, Coachella Valley, 2000-2007 39
21 Average Pay Per Job By Sector, Coachella Valley, 2007 39
22 Number of Firms, Coachella Valley, 1991-2007 40
23 Change in Number of Firms, Coachella Valley, 2000-2007 40
24 Distribution of Firms By Sector, Coachella Valley, 2007 41
25 Average Workers per Firm, Coachella Valley, 1991-2007 41
26 Employment of Residents, By Sector, Coachella Valley, 2006 42
27 Employment of Residents, by Occupation, Coachella Valley & Inland Empire, 2006 42
HOUS ING
28 Existing Home Sales, Coachella Valley, Seasonally Adjusted, By Quarter, 1988-2008 44
29 Existing Home Sales, Coachella Valley Cities, 2007 v. 2008 44
30 New Home Sales, Coachella Valley, Annual, 1988-2008 45
31 New Home Sales, Coachella Valley Cities, 2007 v. 2008 45
32 Existing Home Price Trend, Coachella Valley, 1998-2008 2nd Qtr. 46
33 Existing Home Prices, 2008 2nd Qtr., Coachella Valley & So. Calif. Counties 47
34 New Home Price Trend, Coachella Valley, 1988-2008 2nd Qtr. 48
35 New Home Prices, 2008 2nd Qtr., Coachella Valley & So. Calif. Counties 49
36 Apartment Rental Rate, Investment Grade Units, Inland Empire Markets & Coastal Counties, 1st Qtr., 2008 49
Coachella Valley Economic Report, 2008
Exhibit List

22
NUMBER TOP IC PAGE
TAXABLE SALES
37 Taxable Retail Sales, Coachella Valley, 1990-2007 50
38 Taxable Sales Growth, Coachella Valley vs. Inland Empire, 1990-2007 50
39 Retail Sales By City, Coachella Valley, 2007 51
40 Retail Sales Growth & Growth Rates, By City, Coachella Valley, 2006-2007 51
41 Retail Sales Per Capita, Coachella Valley & Inland Empire, 1990-2007 52
42 Retail Sales Per Capita, Coachella Valley & Major Inland Cities, 2007 52
43 Retail Trade by Sector, Coachella Valley, 2007 53
BANK ING
44 Bank Deposits, Coachella Valley, 1992-2007 54
45 Bank Deposits by City, Coachella Valley Cities & Highest Inland Cities, 2007 54
46 Per Capita Bank Deposits, Coachella Valley, 1992-2007 55
47 Per Capita Bank Deposits, Coachella Valley Cities & Highest Inland Cities, 2007 55
48 Bank Deposits By Bank, Coachella Valley, 2007 56
ASSESSED VALUAT ION
49 Assessed Valuation, Coachella Valley Cities, 1990-2008 58
50 Assessed Valuation Growth, Coachella Valley & Riverside County, 1990-2007 58
51 Assessed Valuation by City, Coachella Valley, Fiscal year 2008-2009 59
52 Per Capita Assessed Valuation, Coachella Valley, 1990-2008 59
53 Assessed Valuation Per Capita, Riverside County Cities, FY 2008-2009 60
CR IME RATES
54 Reported Crime Rate Per 1,000 Residents, Coachella Valley, 1994-2006 62
55 Total Crime Report per 1,000 Residents, Coachella Valley Cities, 2006 62
56 Violent Crime Reported Per 1,000 Residents, Coachella Valley Cities, 2006 63
57 Property Crime Reported Per 1,000 Residents, Coachella Valley Cities, 2006 63
58 Types of Crime Reported, Coachella Valley Cities, 2006 63
EDUCAT ION
59 Academic Performance Index, All Schools, Coachella Valley School Districts, 2007 64
60 High School Exit Examination, Riverside County High School Districts, English, 10th Grade, 2007 65
61 Scholastic Assessment Test, Total Scores, Riverside County High School Districts, 2007 65
Colleges & Universities 66
APPEND IX : EMPLOYMENT & PAYROLL DETA I LS
62 Employment By Sector, Coachella Valley, 1991-2007 68
63 Payroll By Sector, Coachella Valley, 1991-2007 69
64 Average Pay Per Job, Coachella Valley, By Sector, 1991-2007 71

Environmental stewardship and conservation have long been a focus of the Imperial Irrigation District. Founded in 1911, IID’s commitment to the environment, conservation and protection of resources is part of the organization’s charter and mission.
This commitment lives on today as IID promotes green practices in our community. To help our customers, cities and businesses become greener IID offers several programs designed to promote smarter and more efficient uses of energy.
New Construction Energy Efficiency This program combines an integrated design process with financial incentives for all new construction and renovation projects. It is geared toward assisting customers in moving beyond initial cost considerations and toward the realization of long-term energy cost savings as well as avoiding lost opportunities as new buildings are designed and constructed.
Energy Management Program IID works with cities to develop energy-saving solutions that will create a greener and more efficient community. IID has assigned an energy management expert to each participating city in which we do business.
Energy Swing Shift New in 2008, the IID Energy Swing Shift program makes it easy for customers to help cut energy costs and maintain reliability by reducing the amount of electricity needed at critical times when high demand for power
strains the system. This reduces the need to generate additional peak-time power, which, in turn, helps reduce environmental impacts.
Agricultural Energy Efficiency This program is designed for irrigation, golf course and municipal water pumping needs. It promotes state-of-the-art methods for improving pump efficiency.
On-site Energy Efficiency Analysis We are the experts, therefore it’s important that we offer customers the technical expertise to identify energy efficiency and savings opportunities in their businesses. As a part of this program, customers are eligible for financial assistance for detailed project analysis and for the implementation of energy conservation projects.
Inspector Energy When residential customers need advice about energy efficiency they can turn to Inspector Energy. We’ll send a conservation specialist to your home to evaluate your current usage and give you suggested ways to save even more.
ENERGY STAR® Rebates Appliances have two costs, the price to take them home and the cost to run them each month. IID offers rebates on ENERGY STAR qualified appliances that use 10–50 percent less energy and water than standard models.
These are just a few of the energy efficiency programs IID offers its customers. For more information about our efficiency programs, visit www.iid.com.
23

24
� From 2000-2008, the Coachella Valley’s
population grew from 309,530 to 437,655.
That was a gain of 128,125 people in just
eight years (41.4%) (EXHIBIT 1).
DEMOGRAPH ICS

25� In 2008, the Coachella Valley’s cities
ranged in size from Indio with 81,512
people to Indian Wells with 5,025. Three
additional cities had over 45,000 people:
Cathedral City (52,465), Palm Desert
(50,907) and Palm Springs (47,251)
(EXHIBIT 3).
� From 2000-2008, Indio’s growth led the
Coachella Valley, up by 32,396 people
(EXHIBIT 4). La Quinta was second (19,264),
followed by Coachella (17,793). Each of
these cities had land to develop.
Cathedral City (9,818), Palm Desert (9,752)
and Desert Hot Springs (9,486) had modest
increases. The fewest people were added
by Palm Springs (4,446), Rancho Mirage
(3,808) and Indian Wells (1,209).
� The Coachella Valley’s 41.4% increase
in population from 2000-2008 was much
faster than the surrounding Inland
Empire (27.3%), California (12.3%) or
the U.S. (8.2%) (EXHIBIT 2).
26
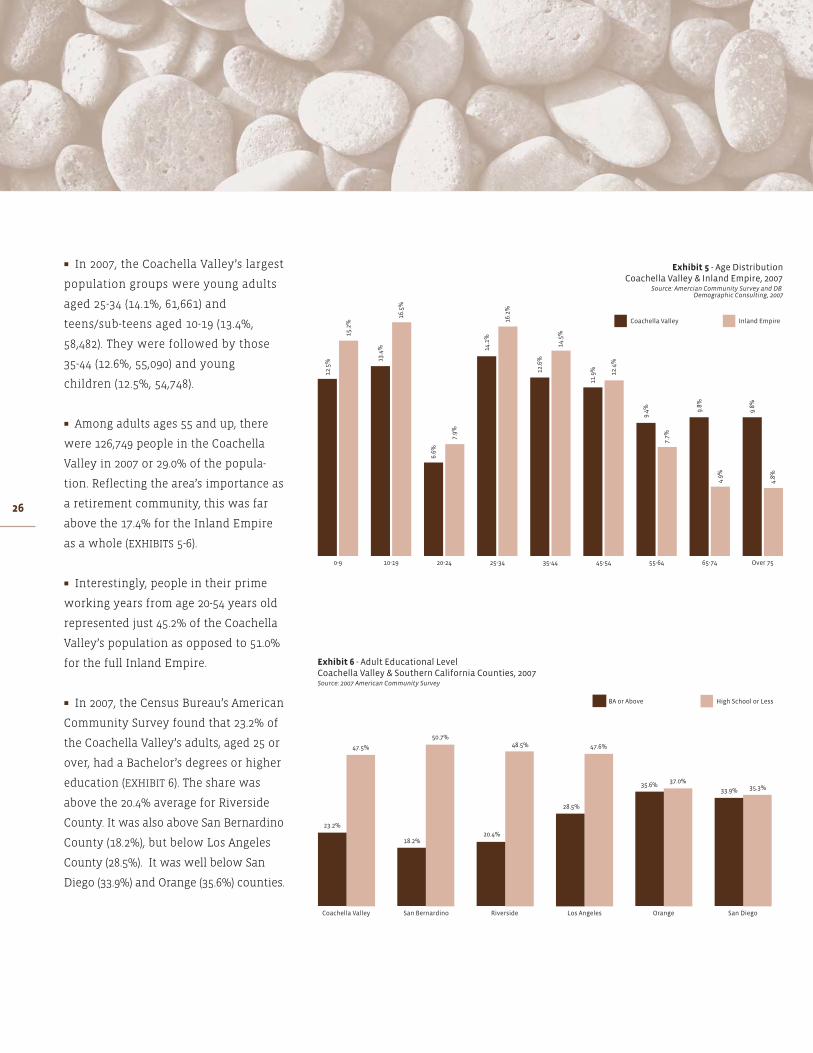
� In 2007, the Coachella Valley’s largest
population groups were young adults
aged 25-34 (14.1%, 61,661) and
teens/sub-teens aged 10-19 (13.4%,
58,482). They were followed by those
35-44 (12.6%, 55,090) and young
children (12.5%, 54,748).
� Among adults ages 55 and up, there
were 126,749 people in the Coachella
Valley in 2007 or 29.0% of the popula-
tion. Reflecting the area’s importance as
a retirement community, this was far
above the 17.4% for the Inland Empire
as a whole (EXHIBITS 5-6).
� Interestingly, people in their prime
working years from age 20-54 years old
represented just 45.2% of the Coachella
Valley’s population as opposed to 51.0%
for the full Inland Empire.
� In 2007, the Census Bureau’s American
Community Survey found that 23.2% of
the Coachella Valley’s adults, aged 25 or
over, had a Bachelor’s degrees or higher
education (EXHIBIT 6). The share was
above the 20.4% average for Riverside
County. It was also above San Bernardino
County (18.2%), but below Los Angeles
County (28.5%). It was well below San
Diego (33.9%) and Orange (35.6%) counties.
Leavingno stone
unturned.
I M A G I N E .
Envision what our future can be.
I N S P I R E .
Instill vision and motivate others towards action.
C O L L A B O R A T E .
Lock arms and press toward our defined goals.
A C H I E V E .
The outcomes of our hopes and dreams begin to appear.
Coachella Valley Economic Partnership
73-710 Fred Waring Drive, Suite 106
Palm Desert, California 92260
Phone: 760.340.1575 or 1.888.318.CVEP
Fax: 760.340.9212
www.cvep.com

28

29
� In 2007, the share of the valley’s adults with just a high school or less education
(47.5%) was nearly the same as Los Angeles County (47.6%). It was lower than
Riverside (48.5%) and San Bernardino (50.7%) counties but well over San Diego
(35.3%) and Orange (37.0%) counties.
� In 2007, the share of population in Coachella Valley cities that was White was
43.2% compared to 43.0% for all of Riverside County (EXHIBIT 7). Hispanics were
43.4% in the valley and 42.2% for the full county.
� In 2007, the 2007 American
Community Survey indicated that the
Coachella Valley’s total income was
$12.1 billion. That was 12.7% of the $95.0
billion in total income for the Inland
Empire (EXHIBIT 8).
� The Coachella Valley’s average house-
hold income of $77,058 was about $5,500
higher than the Inland Empire’s $72,546.
Its per capita income of $30,076 was
roughly $6,000 above the region’s $23,273.
However, Coachella Valley’s median
income of $51,915 (half above & below)
was lower than the regional figure as
medians are not pulled up by very
high incomes.
30
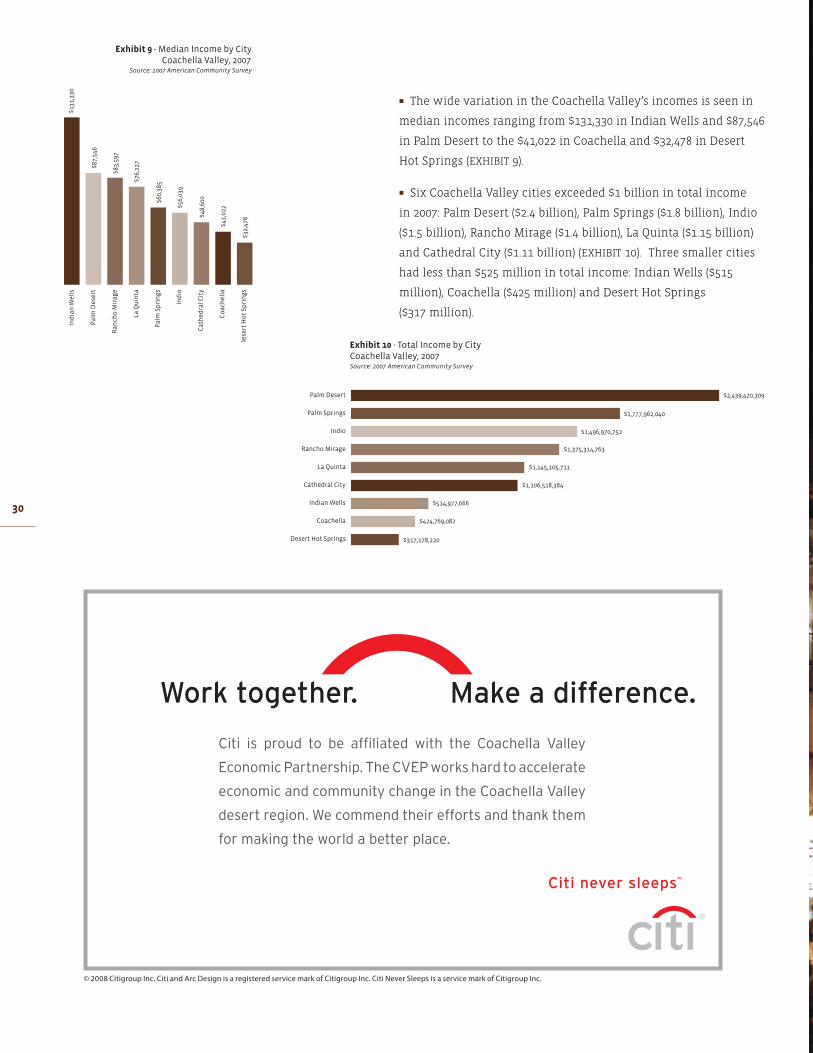
� The wide variation in the Coachella Valley’s incomes is seen in
median incomes ranging from $131,330 in Indian Wells and $87,546
in Palm Desert to the $41,022 in Coachella and $32,478 in Desert
Hot Springs (EXHIBIT 9).
� Six Coachella Valley cities exceeded $1 billion in total income
in 2007: Palm Desert ($2.4 billion), Palm Springs ($1.8 billion), Indio
($1.5 billion), Rancho Mirage ($1.4 billion), La Quinta ($1.15 billion)
and Cathedral City ($1.11 billion) (EXHIBIT 10). Three smaller cities
had less than $525 million in total income: Indian Wells ($515
million), Coachella ($425 million) and Desert Hot Springs
($317 million).


32
� From 2000-2007, the Coachella Valley’s
employment went from 109,400 to
140,162 a gain of 30,763 jobs or 28.1%
(EXHIBIT 11). In this period, the Inland
Empire was up 27.3%.
� The region’s economy grew because its
full time population has grown as has its
convention, tourism, health and retire-
ment activities expanded through this
period. Also, until 2007, its construction
industry had thrived. It has faltered with
the housing crisis.
� From 2000-2007, the Coachella Valley’s
retail trade added 8,259 jobs or 26.8% of
its 30,763 new positions due to growth
in both population and tourism (EXHIBIT
12). The hotel and amusement sectors
including casinos added 4,483 jobs or a
14.6% share. Construction was up 3,441
jobs or 11.2% of the job growth, despite
a loss of 3,075 positions in 2007. Distribu-
tion added 2,694 or 8.8%. This is important
as the region seeks to diversify its eco-
nomic base. The four sectors were 61.4%
of the area’s growth.
� Ultimately, distributors will likely
locate large facilities along the Union
Pacific Railroad’s right of way through
the valley to handle goods entering
Southern California through the ports
of Los Angeles and Long Beach.
EMPLOYMENT
33
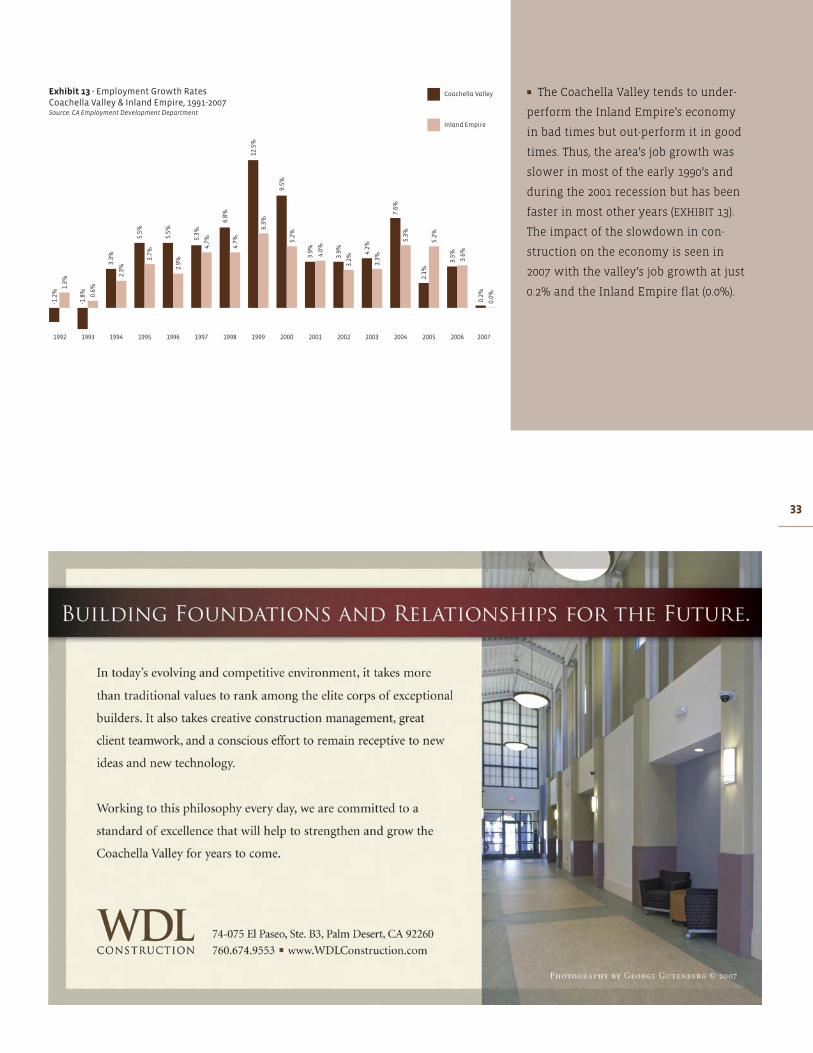
� The Coachella Valley tends to under-
perform the Inland Empire’s economy
in bad times but out-perform it in good
times. Thus, the area’s job growth was
slower in most of the early 1990’s and
during the 2001 recession but has been
faster in most other years (EXHIBIT 13).
The impact of the slowdown in con-
struction on the economy is seen in
2007 with the valley’s job growth at just
0.2% and the Inland Empire flat (0.0%).

34
� With the general expansion and diver-
sification of the Coachella Valley’s job
base from 2000-2007, its large and grow-
ing retail sector went from to 21.9% to
23.0% of employment (EXHIBITS 14-15). The
second largest sector, hotel and amuse-
ment (including casinos), saw its share
essentially unchanged, going from 15.1%
to 15.0%. Meanwhile, the recent decline in
construction projects meant that con-
struction employment, which had
reached 12.7% in 2007, only rose slightly
from 10.3% in 2000 to 10.5% in 2007.
� Increased urbanization and rising
costs caused agriculture to fall from
12.3% to 8.7% and drop from third to
fourth largest. Health care lost some
share from 2000 to 2007 going from 8.0%
to 7.7%. Education jumped up slightly
from 6.4% to 6.8%. Indicating some
increase in the valley’s diversification,
the smaller sectors combined went
from 11.5%t o 13.2%.
� From 2000-2007, the total payroll
released by the Coachella Valley’s firms
and agencies grew by $2.07 billion from
$2.8 billion to $4.9 billion or 73.8%
(EXHIBIT 16).
35
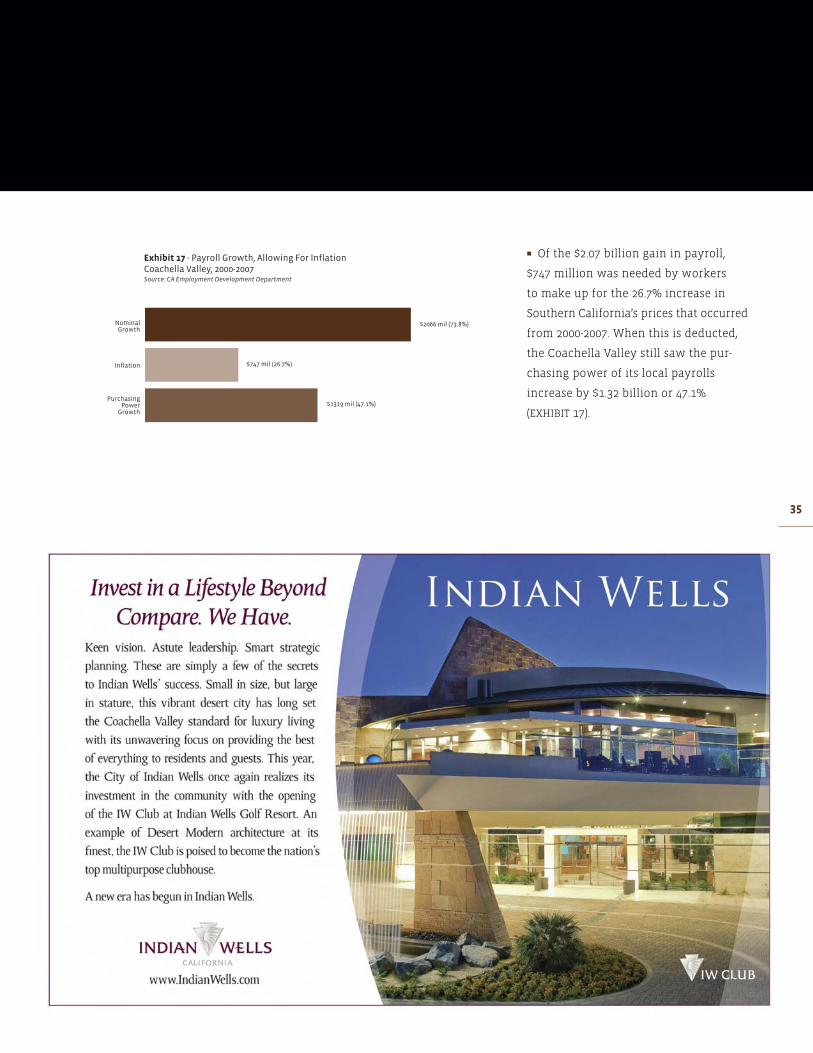
� Of the $2.07 billion gain in payroll,
$747 million was needed by workers
to make up for the 26.7% increase in
Southern California’s prices that occurred
from 2000-2007. When this is deducted,
the Coachella Valley still saw the pur-
chasing power of its local payrolls
increase by $1.32 billion or 47.1%
(EXHIBIT 17).

36
� From 2000-2007, the largest share
of the $2.07 billion increase in the
Coachella Valley’s payrolls (14.8%) was
from the $305.5 million gain in the retail
trade sector. Next was construction,
which was responsible for $262.4 mil-
lion (12.7%) of the increase, despite an
$85.1 million decline from 2007-2007
(EXHIBIT 18).
� The hotel and amusement sector
ranked third in payroll growth account-
ing for $249.2 million (12.1%). The health
services sector ranked fourth, up $223.9
million (10.8%). These four sectors
accounted for 50.4% of the Coachella
Valley’s payroll expansion.
� In 1991, the average pay per worker
in the Coachella Valley was $19,843. By
2000, this had reached $25,577. It then
moved on to $34,701 by 2007. That was
3.0% above the $33,679 for all Inland
Empire firms (EXHIBIT 19).
37

38

39
� The Coachella Valley’s average pay
per job increased by $9,124 (35.7%) from
2000-2007. Of this, $6,827 was needed to
keep up with the 26.7% gain in Southern
California’s prices. As a result, the average
worker’s purchasing power rose $2,296
or 9.0% (EXHIBIT 20).
� There is a correlation between
average pay by sector in the Coachella
Valley and the education or technical
training required by workers within it.
The highest paying sectors use well-edu-
cated or skilled workers: government
($65,243), utilities ($59,473), finance &
real estate ($52,099), health ($51,127),
engineering & management ($50,989)
and education ($44,346).
� Blue collar sectors paid relatively
well: distribution ($41,067), construction
($40,006) and manufacturing ($36,580).
The economy’s difficulty is that three
of its four largest sectors pay below
$30,000 per year: #2 hotel & amusement
($29,316), #1 retailing ($24,194) and #4
agriculture ($20,841) (EXHIBIT 21). The
exception was #3 construction ($40,006).

40
� The number of firms in the Coachella
Valley has risen from 5,384 in 1991 to
6,236 by 2000, and 7,846 by 2007. The
gain from 2000-2007 was 1,610 firms
or 25.8% (EXHIBIT 22).
� These numbers should be viewed as a
long-term “general trend” not “exact”
data as they do not include entrepre-
neurs with no payroll. For this reason,
upward or downward fluctuations from
year to year are not as significant as
they may appear as they generally
involve very small firms switching from
pure entrepreneurs to employers with
one or two workers.
� From 2000-2007, the largest number of
firms was added in construction (405). The
next largest gain was in engineering and
management (228). These were followed
by distribution (204), health services (198)
and finance and insurance (191). Only two
sectors lost jobs: agriculture (-4) and other
services (-2) (EXHIBIT 23).
41
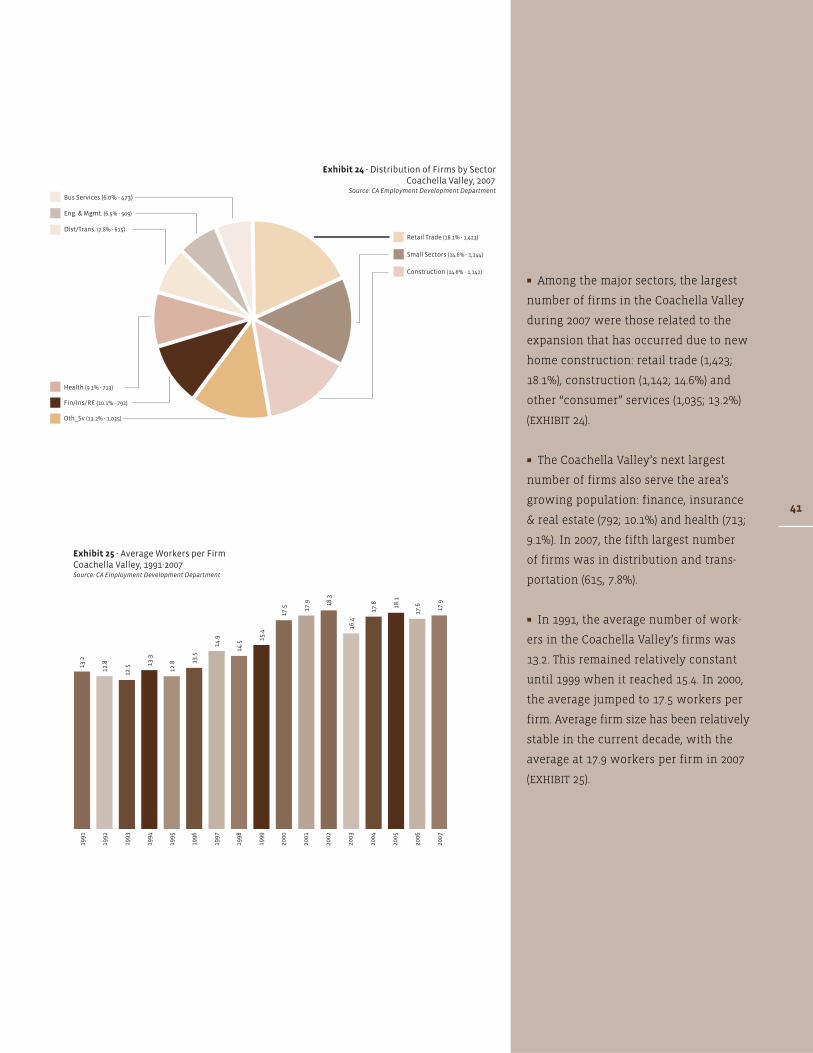
� Among the major sectors, the largest
number of firms in the Coachella Valley
during 2007 were those related to the
expansion that has occurred due to new
home construction: retail trade (1,423;
18.1%), construction (1,142; 14.6%) and
other “consumer” services (1,035; 13.2%)
(EXHIBIT 24).
� The Coachella Valley’s next largest
number of firms also serve the area’s
growing population: finance, insurance
& real estate (792; 10.1%) and health (713;
9.1%). In 2007, the fifth largest number
of firms was in distribution and trans-
portation (615, 7.8%).
� In 1991, the average number of work-
ers in the Coachella Valley’s firms was
13.2. This remained relatively constant
until 1999 when it reached 15.4. In 2000,
the average jumped to 17.5 workers per
firm. Average firm size has been relatively
stable in the current decade, with the
average at 17.9 workers per firm in 2007
(EXHIBIT 25).
42
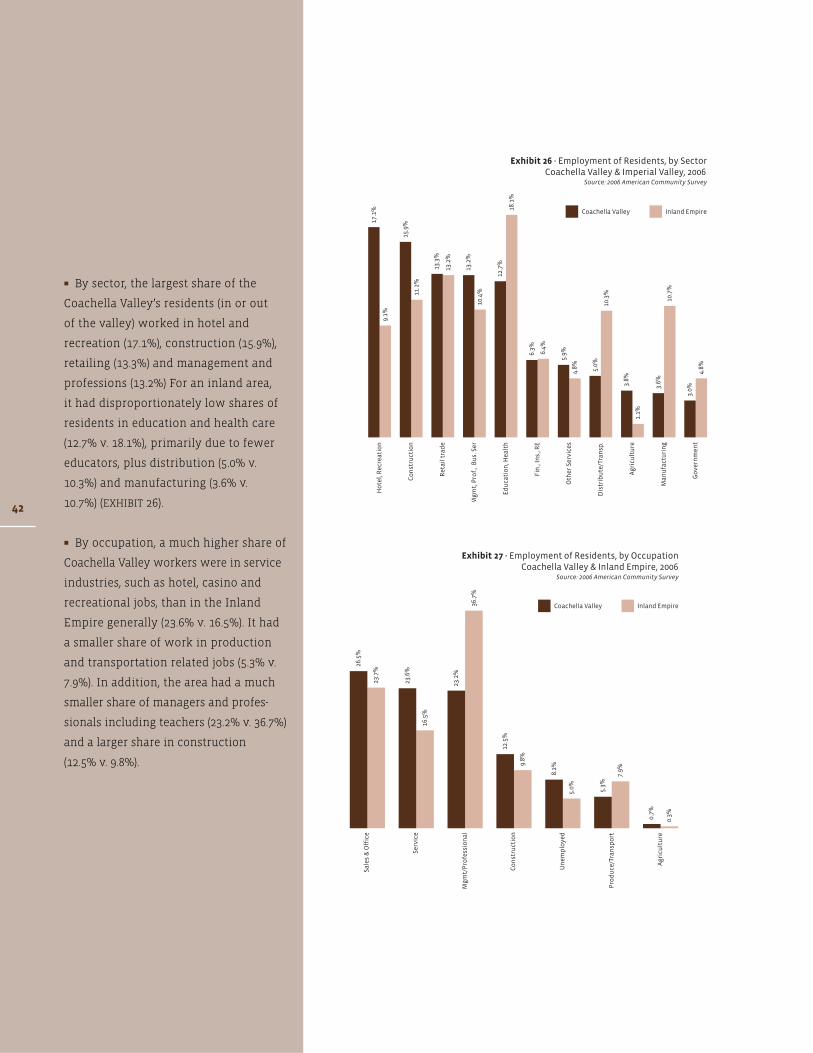
� By sector, the largest share of the
Coachella Valley’s residents (in or out
of the valley) worked in hotel and
recreation (17.1%), construction (15.9%),
retailing (13.3%) and management and
professions (13.2%) For an inland area,
it had disproportionately low shares of
residents in education and health care
(12.7% v. 18.1%), primarily due to fewer
educators, plus distribution (5.0% v.
10.3%) and manufacturing (3.6% v.
10.7%) (EXHIBIT 26).
� By occupation, a much higher share of
Coachella Valley workers were in service
industries, such as hotel, casino and
recreational jobs, than in the Inland
Empire generally (23.6% v. 16.5%). It had
a smaller share of work in production
and transportation related jobs (5.3% v.
7.9%). In addition, the area had a much
smaller share of managers and profes-
sionals including teachers (23.2% v. 36.7%)
and a larger share in construction
(12.5% v. 9.8%).

43

44
� From late 2001 until second quarter
2004, the Coachella Valley’s existing
homes sales soared. On a seasonally
adjusted basis, they reached 2,061
quarterly sales. With prices reaching
very high levels, due to speculators and
sub-prime financing, demand then
began to fall. It plunged starting in late
2007, ultimately causing prices to drop
as well. The valley’s existing home
market fell to a modern low of 948
quarterly sales in fourth quarter 2007.
Volume has since jumped 35.1% to 1,280
units as foreclosure sales have shown
that there is significant demand at
early 2004 prices.
� By city, the Coachella Valley’s estimat-
ed 2008 existing home sales are being
led by Indio (1,010) and La Quinta (858).
The cities of Palm Desert (680), Palm
Springs (539), and Cathedral City (489) are
next. The lowest volumes are occurring
in Desert Hot Springs (469), Rancho
Mirage (311), Coachella (220) and Indian
Wells (118) (EXHIBIT 29).
HOUS ING

45
� New home sales reached post-Cold
War recession lows of under 800 units in
the mid-1990s. Increasing demand then
sent sales to a modern record of 2,255
units in 1999. Sales stayed close to 2,000
units until they exploded to 4,065 in
2003, 5,535 in 2004 and a record 5,490 in
2005 (Exhibit 30). In 2007, the new home
market began to falter (4,913) as buyers
started to rebel against very high prices.
Production and prices plunged in 2007
with sales down to 2,771 units. Through
June 2008, volume was running at an
annual rate of just 1,366 units.
� By city, new home volume slowed
significantly throughout the Coachella
Valley from 2007 to its annualized 2008
rates (EXHIBIT 31). The highest volumes
are still occurring in Indio (1,018) and La
Quinta (512), two cities with significant
available land. Next is Coachella (341),
followed by Palm Springs (332) and
Desert Hot Springs (231). The valley’s
more developed cities added fewer
new homes: Palm Desert (162), Cathedral
City (90), as did its most expensive
communities: Rancho Mirage (68) and
Indian Wells (17).

46
� During this decade, the Coachella Valley’s median existing home price soared
from 2000-2007, rising at a compound annual rate of 18.4% from $170,756 to $470,191.
In 2007, as demand faltered, the price increase slowed to just 1.6% ($477,672). By 2nd
quarter 2008, demand had evaporated except for homes being sold at much lower
prices, often through the foreclosure process. The median price fell $104,313 or
–30.7% to just $376,045 (EXHIBIT 32).

47
� In 2nd quarter 2008, median existing home prices in Indian Wells ($890,000) and Rancho Mirage ($705,000) were still above
all of Southern California’s counties (Exhibit 33). La Quinta ($485,500) was below Orange County ($549,000) and Palm Springs
($445,090) was above Los Angeles County ($435,000) and San Diego ($417,500) counties. It was followed by Palm Desert ($405,455).
Indio ($243,509) and Cathedral City ($235,000) were below Riverside County ($270,000) and above San Bernardino County
($234,000). Coachella ($215,000) and Desert Hot Springs ($145,161) are among the Southland’s more affordable markets. So
was nearby Yucca Valley ($155,000), home to many commuters to the valley.

48
� From 2003-2007, the Coachella Valley’s new home median price jumped from $309,570 to a record $462,760, a compound annual
increase of 14.3%. In 2007, slowing demand plus the importance of more affordable markets like Indio and Coachella caused the
median price to fall –9.4% to $419,452. By second quarter 2008, the drop in housing demand and competition from existing
home prices hit by a glut of foreclosures sent the valley’s median new home price to $375,175, down another –10.6% to roughly
the 2004 level (EXHIBIT 34).

49
� Among cities, new homes in Rancho
Mirage ($827,000), Indian Wells ($740,500)
and La Quinta ($600,000) were more
expensive than San Diego ($472,500) or
Orange ($468,000) counties. Palm Springs
($457,672) was next, above Los Angeles
County ($435,000), while Cathedral City
($410,000) was well above Riverside
County ($338,500). Palm Desert ($323,615)
was just above San Bernardino County
($315,000). Indio ($313,127), Coachella
($250,000) and Desert Hot Springs
($192,912) were the most affordable new
home prices as was nearby Yucca Valley
($240,000) (EXHIBIT 35).
� The Coachella Valley’s class “A”
apartments are relatively affordable by
Inland Empire standards. The average
rental rate in 1st quarter 2008 was $958,
up 3.2% from 2007 and well below the
inland region’s $1,154 average (EXHIBIT
36). The market had a 5.6% vacancy
rate, matching 2007. Its price was far
below those in Southern California’s
coastal markets.

50
� With a growing population and its
continuing role as a regional and national
tourist and convention destination, the
Coachella Valley’s retail sales have soared.
In 2007, taxable sales in its nine cities
reached a record $5.98 billion. With the
housing market’s slowdown, sales fell to
$5.89 billion in 2007 (-0.9%). From 2000-
2007, sales growth was still $2.01 billion
or 51.9%, far above the 26.7% inflation
rate indicating that the underlying
volume of goods grew substantially
in this period (EXHIBIT 37).
TAXABLE SALES
� The Coachella Valley’s taxable sales are generally more volatile than the surrounding Inland Empire (EXHIBIT 38). In good times,
the valley’s sales have tended to grow faster than the region as in 1997-2000. In poor times, they tend to grow slower, as in 2001-2002
(3% vs. 6%). However, from 2004-2007, this pattern did not show up. The valley’s growth was slower in the good times of 2004
(14% v. 16%) and 2005 (9% v. 13%). With the housing crisis, it has essentially matched that of the region in 2006 (4.7% v. 5.4%)
and 2007 (-1.6% v. –1.8%).
51
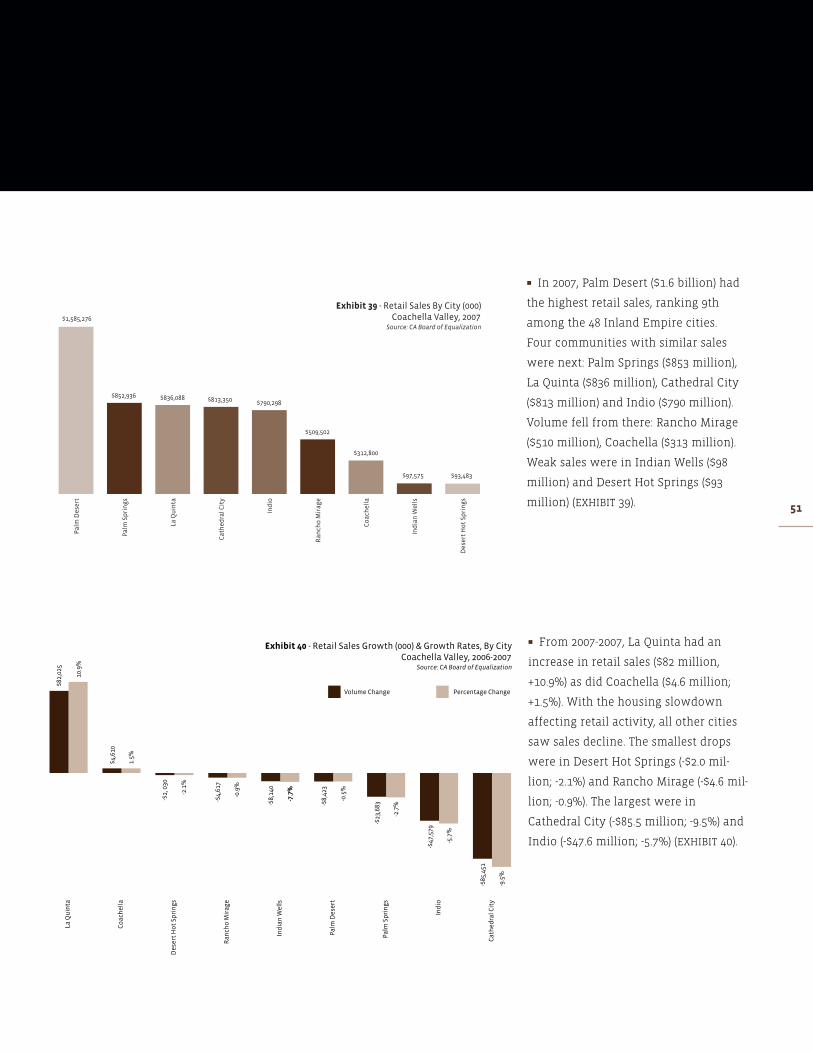
� In 2007, Palm Desert ($1.6 billion) had
the highest retail sales, ranking 9th
among the 48 Inland Empire cities.
Four communities with similar sales
were next: Palm Springs ($853 million),
La Quinta ($836 million), Cathedral City
($813 million) and Indio ($790 million).
Volume fell from there: Rancho Mirage
($510 million), Coachella ($313 million).
Weak sales were in Indian Wells ($98
million) and Desert Hot Springs ($93
million) (EXHIBIT 39).
� From 2007-2007, La Quinta had an
increase in retail sales ($82 million,
+10.9%) as did Coachella ($4.6 million;
+1.5%). With the housing slowdown
affecting retail activity, all other cities
saw sales decline. The smallest drops
were in Desert Hot Springs (-$2.0 mil-
lion; -2.1%) and Rancho Mirage (-$4.6 mil-
lion; -0.9%). The largest were in
Cathedral City (-$85.5 million; -9.5%) and
Indio (-$47.6 million; -5.7%) (EXHIBIT 40).
52
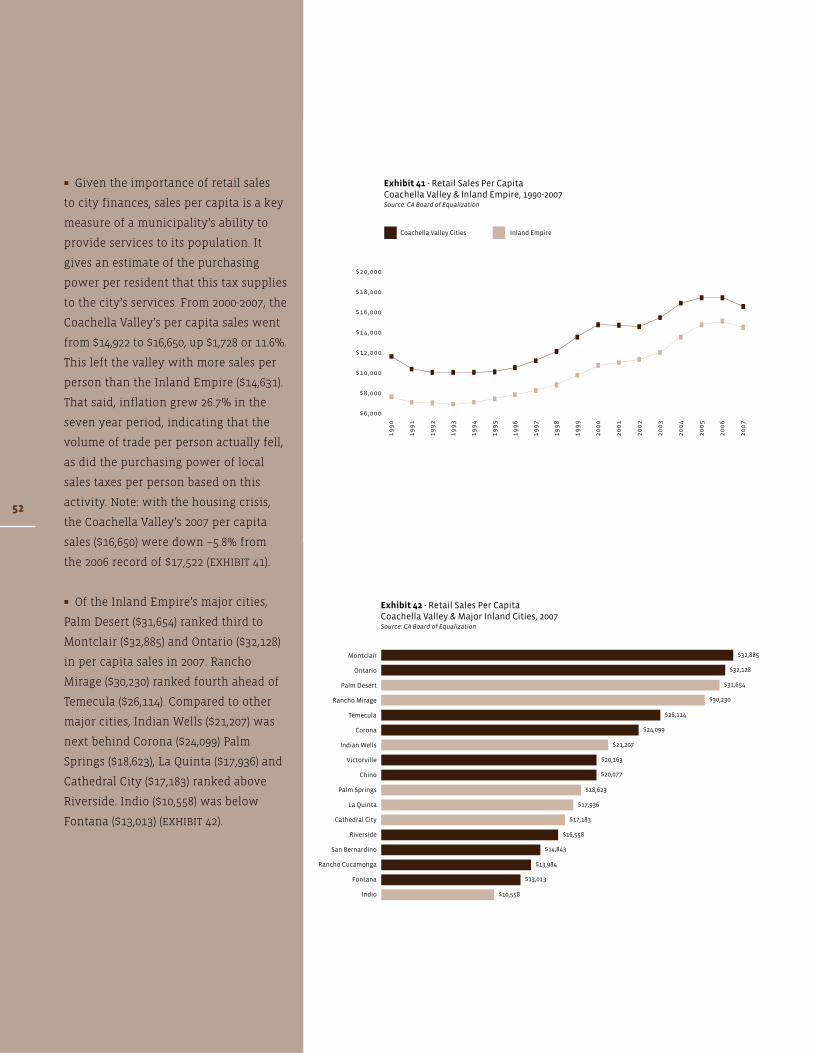
� Given the importance of retail sales
to city finances, sales per capita is a key
measure of a municipality’s ability to
provide services to its population. It
gives an estimate of the purchasing
power per resident that this tax supplies
to the city’s services. From 2000-2007, the
Coachella Valley’s per capita sales went
from $14,922 to $16,650, up $1,728 or 11.6%.
This left the valley with more sales per
person than the Inland Empire ($14,631).
That said, inflation grew 26.7% in the
seven year period, indicating that the
volume of trade per person actually fell,
as did the purchasing power of local
sales taxes per person based on this
activity. Note: with the housing crisis,
the Coachella Valley’s 2007 per capita
sales ($16,650) were down –5.8% from
the 2006 record of $17,522 (EXHIBIT 41).
� Of the Inland Empire’s major cities,
Palm Desert ($31,654) ranked third to
Montclair ($32,885) and Ontario ($32,128)
in per capita sales in 2007. Rancho
Mirage ($30,230) ranked fourth ahead of
Temecula ($26,114). Compared to other
major cities, Indian Wells ($21,207) was
next behind Corona ($24,099) Palm
Springs ($18,623), La Quinta ($17,936) and
Cathedral City ($17,183) ranked above
Riverside. Indio ($10,558) was below
Fontana ($13,013) (EXHIBIT 42).

53
� In 2007, the Coachella Valley’s $5.89
billion in retail sales were led by non-
retail outlets $942 million. That group
includes manufacturers, distributors,
builders and professionals selling direct
to consumers. Next was automotive
sales at $891 million. General merchan-
disers ($869 million) was third, followed
by restaurants ($636 million) and other
“specialty” retailers ($610 million)
(EXHIBIT 43).
54
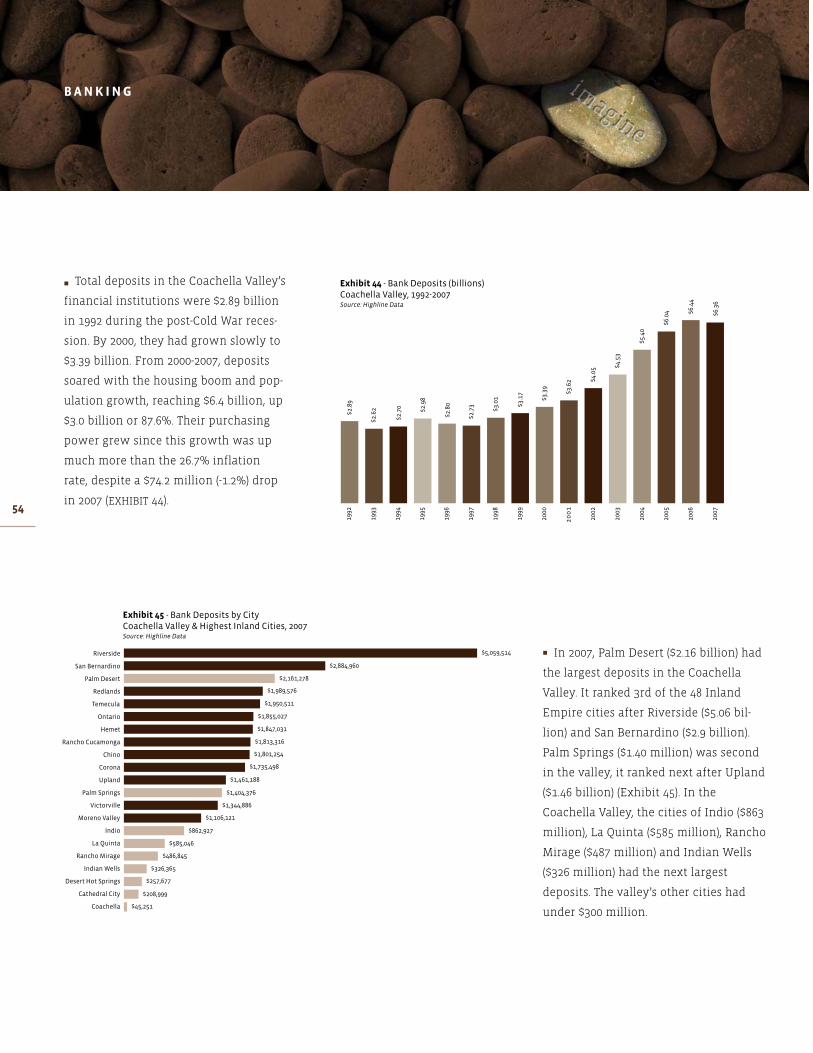
� Total deposits in the Coachella Valley’s
financial institutions were $2.89 billion
in 1992 during the post-Cold War reces-
sion. By 2000, they had grown slowly to
$3.39 billion. From 2000-2007, deposits
soared with the housing boom and pop-
ulation growth, reaching $6.4 billion, up
$3.0 billion or 87.6%. Their purchasing
power grew since this growth was up
much more than the 26.7% inflation
rate, despite a $74.2 million (-1.2%) drop
in 2007 (EXHIBIT 44).
BANK ING
� In 2007, Palm Desert ($2.16 billion) had
the largest deposits in the Coachella
Valley. It ranked 3rd of the 48 Inland
Empire cities after Riverside ($5.06 bil-
lion) and San Bernardino ($2.9 billion).
Palm Springs ($1.40 million) was second
in the valley, it ranked next after Upland
($1.46 billion) (Exhibit 45). In the
Coachella Valley, the cities of Indio ($863
million), La Quinta ($585 million), Rancho
Mirage ($487 million) and Indian Wells
($326 million) had the next largest
deposits. The valley’s other cities had
under $300 million.

55
� Deposits per capita in the Coachella
Valley rose consistently from a post-Cold
War recession low of $9,649 in 1997 to a
high of $15,402 in 2007 (EXHIBIT 46). Per
capita deposits dropped $664 to $14,738
(-4.3%) in 2007 with the economic slow-
down associated with the housing cri-
sis. For the full 2000-2007 period, per
capita deposits went from $10,759 to
$14,738, up $3,979 or 37.0%. The purchas-
ing power of deposits per person rose as
the inflation rate was only 26.7%.
� In 2007, Indian Wells ($66,732) and
Palm Desert ($43,912) ranked 1st and 2nd
in per capita deposits among the Inland
Empire’s 48 cities, ahead of Big Bear
Lake ($37,297). Palm Springs ($32,619) and
Rancho Mirage ($27,318) ranked 4th and
6th. Nearby, Yucca Valley ($24,832)
ranked 9th in the region. The valley’s
other cities, starting with La Quinta
($15,058), were below 14th ranked
Banning ($15,715) (EXHIBIT 47).

56
� In the Coachella Valley, three of
California’s mega-banks had the most
deposits in 2007. Bank of America led
with $1.13 billion in deposits for a 17.8%
share, down from 17.9% in 2007. Wells
Fargo was second with $763 million, a
12.0 % share, up from 11.9% in 2007.
Third was Washington Mutual with $717
million in deposits and a 11.3% share;
down from 11.5% in 2007. The merger of
Wachovia with World Savings Bank gave
it $486 million in deposits and a fourth
ranked 7.6% share; up from 5.9% in 2007.
� Several regional banks also had large
shares: #5 La Jolla Bank (5.7%), #6
Downey S&L (5.7%), #8 PFF Bank (4.3%)
and #9 First Bank (3.6%) (EXHIBIT 48).
� Palm Desert National Bank ($291
million), a local financial institution,
moved from ninth ranked in 2007 to
seventh ranked in 2007 as its deposits
rose 5.7% and its share market
increased from 4.2% to 4.6%.
Exhibit 48 Bank Deposits By Bank, Coachella Valley, 2007 (000)
Financial Institution 2007 Deposits (000) Market Share
Bank of America NA $1,131,838 17.8%
Wells Fargo Bk NA $763,170 12.0%
Washington Mutual Bank $717,064 11.3%
Wachovia Mortgage, FSB $484,553 7.6%
LA Jolla Bk FSB $365,346 5.7%
Downey S&LA FA $362,320 5.7%
Palm Desert NB $290,698 4.6%
PFF B&T $286,269 4.5%
Firstbank $231,801 3.6%
Canyon NB $231,277 3.6%
Union Bk of CA NA $219,946 3.5%
Rabobank, NA $219,741 3.5%
Pacific Western NB $195,492 3.1%
Guaranty Bk $167,890 2.6%
Citibank (West), FSB $164,441 2.6%
Frontier Bk FSB $128,859 2.0%
Provident Svgs Bk FSB $91,884 1.4%
Desert Commercial Bk $89,534 1.4%
California B&TC $74,783 1.2%
Other: Under 1% Each $144,064 2.3%
Total $6,360,970 100.0%
SOURCE : Highline Data

57
58
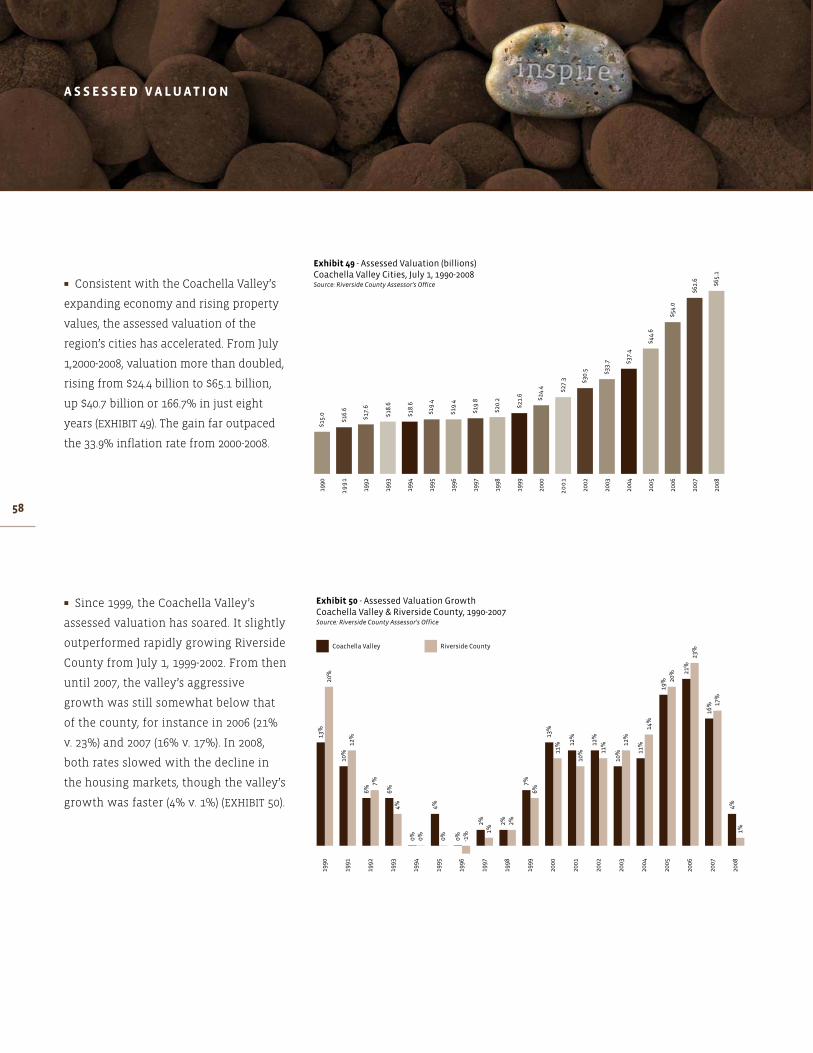
� Consistent with the Coachella Valley’s
expanding economy and rising property
values, the assessed valuation of the
region’s cities has accelerated. From July
1,2000-2008, valuation more than doubled,
rising from $24.4 billion to $65.1 billion,
up $40.7 billion or 166.7% in just eight
years (EXHIBIT 49). The gain far outpaced
the 33.9% inflation rate from 2000-2008.
� Since 1999, the Coachella Valley’s
assessed valuation has soared. It slightly
outperformed rapidly growing Riverside
County from July 1, 1999-2002. From then
until 2007, the valley’s aggressive
growth was still somewhat below that
of the county, for instance in 2006 (21%
v. 23%) and 2007 (16% v. 17%). In 2008,
both rates slowed with the decline in
the housing markets, though the valley’s
growth was faster (4% v. 1%) (EXHIBIT 50).
ASSESSED VALUAT ION

59
� In FY 2008-2009, Palm Desert ($13.8
billion) had the Coachella Valley’s
highest assessed valuation, followed
by La Quinta ($12.4 billion). Palm Springs
($10.1 billion) was third followed by
Rancho Mirage ($8.1) and Indio ($7.4
billion) (EXHIBIT 51).
� Indian Wells ($5.1 billion) was followed
by Cathedral City ($4.3 billion). The small-
est assessed valuations were in Desert
Hot Springs ($2.0 billion) and Coachella
($2.0 billion).
� Assessed valuation per capita is
another measure of a community’s
ability to finance governmental services
for each resident. This measure rose in
the Coachella Valley from $92,407 in 2000
to $173,615 in 2008, a gain of $81,208 per
person or 87.9% in just eight years
(EXHIBIT 52).
� As inflation was just 33.9% from 2000-
2008, there was a significant gain in the
purchasing power of the property taxes
collected per person due to this gain
in valuation.

60
� On July 1, 2008, five Coachella Valley
cities had the highest per capita
assessed valuations among Riverside
County’s 24 cities (EXHIBIT 53). Indian
Wells ($1,006,183) led, followed by
Rancho Mirage ($473,189), La Quinta
($289,027), Palm Desert ($270,170) and
Palm Springs ($213,930). They ranked
above Canyon Lake ($149,626) and
Temecula ($131,817).
� Per capita valuation in the valley’s
other cities were: Indio ($90,390),
Cathedral City ($82,653), Desert Hot
Springs ($77,929), and Coachella ($48,617).
The latter ranked 23rd of the county’s
24 cities above Blythe ($21,744).

61
62
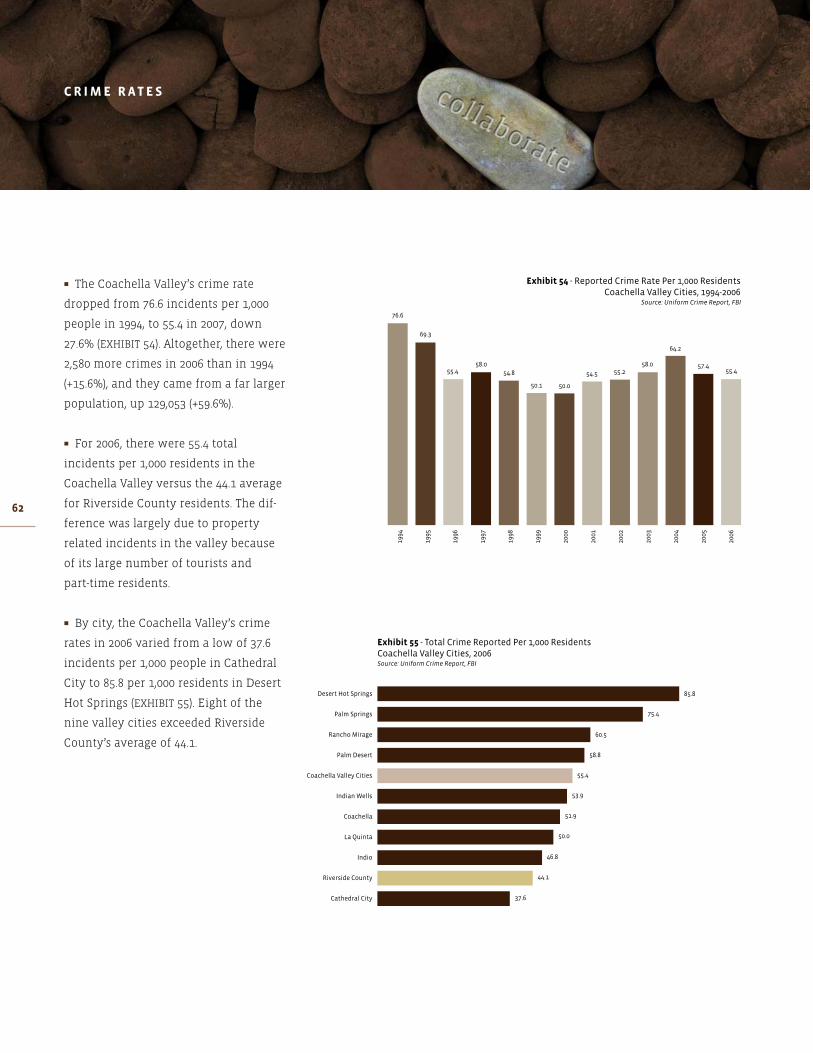
� The Coachella Valley’s crime rate
dropped from 76.6 incidents per 1,000
people in 1994, to 55.4 in 2007, down
27.6% (EXHIBIT 54). Altogether, there were
2,580 more crimes in 2006 than in 1994
(+15.6%), and they came from a far larger
population, up 129,053 (+59.6%).
� For 2006, there were 55.4 total
incidents per 1,000 residents in the
Coachella Valley versus the 44.1 average
for Riverside County residents. The dif-
ference was largely due to property
related incidents in the valley because
of its large number of tourists and
part-time residents.
� By city, the Coachella Valley’s crime
rates in 2006 varied from a low of 37.6
incidents per 1,000 people in Cathedral
City to 85.8 per 1,000 residents in Desert
Hot Springs (EXHIBIT 55). Eight of the
nine valley cities exceeded Riverside
County’s average of 44.1.
CR IME RATES
63
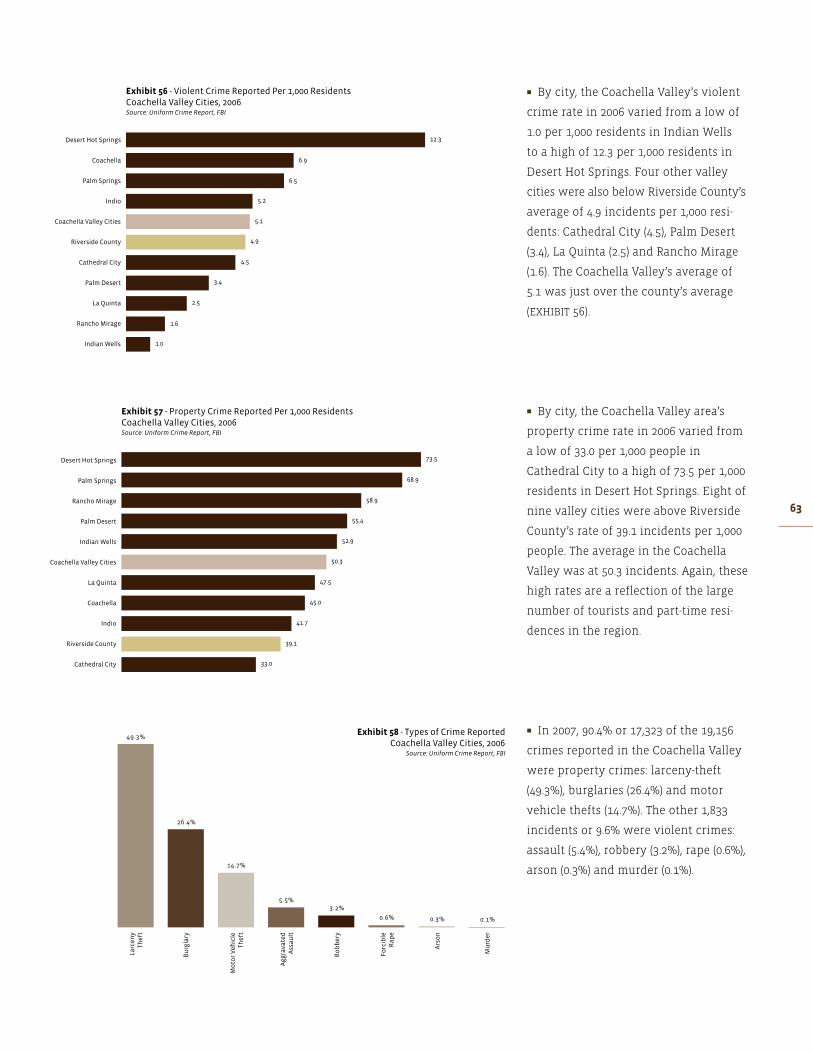
� By city, the Coachella Valley’s violent
crime rate in 2006 varied from a low of
1.0 per 1,000 residents in Indian Wells
to a high of 12.3 per 1,000 residents in
Desert Hot Springs. Four other valley
cities were also below Riverside County’s
average of 4.9 incidents per 1,000 resi-
dents: Cathedral City (4.5), Palm Desert
(3.4), La Quinta (2.5) and Rancho Mirage
(1.6). The Coachella Valley’s average of
5.1 was just over the county’s average
(EXHIBIT 56).
� By city, the Coachella Valley area’s
property crime rate in 2006 varied from
a low of 33.0 per 1,000 people in
Cathedral City to a high of 73.5 per 1,000
residents in Desert Hot Springs. Eight of
nine valley cities were above Riverside
County’s rate of 39.1 incidents per 1,000
people. The average in the Coachella
Valley was at 50.3 incidents. Again, these
high rates are a reflection of the large
number of tourists and part-time resi-
dences in the region.
� In 2007, 90.4% or 17,323 of the 19,156
crimes reported in the Coachella Valley
were property crimes: larceny-theft
(49.3%), burglaries (26.4%) and motor
vehicle thefts (14.7%). The other 1,833
incidents or 9.6% were violent crimes:
assault (5.4%), robbery (3.2%), rape (0.6%),
arson (0.3%) and murder (0.1%).
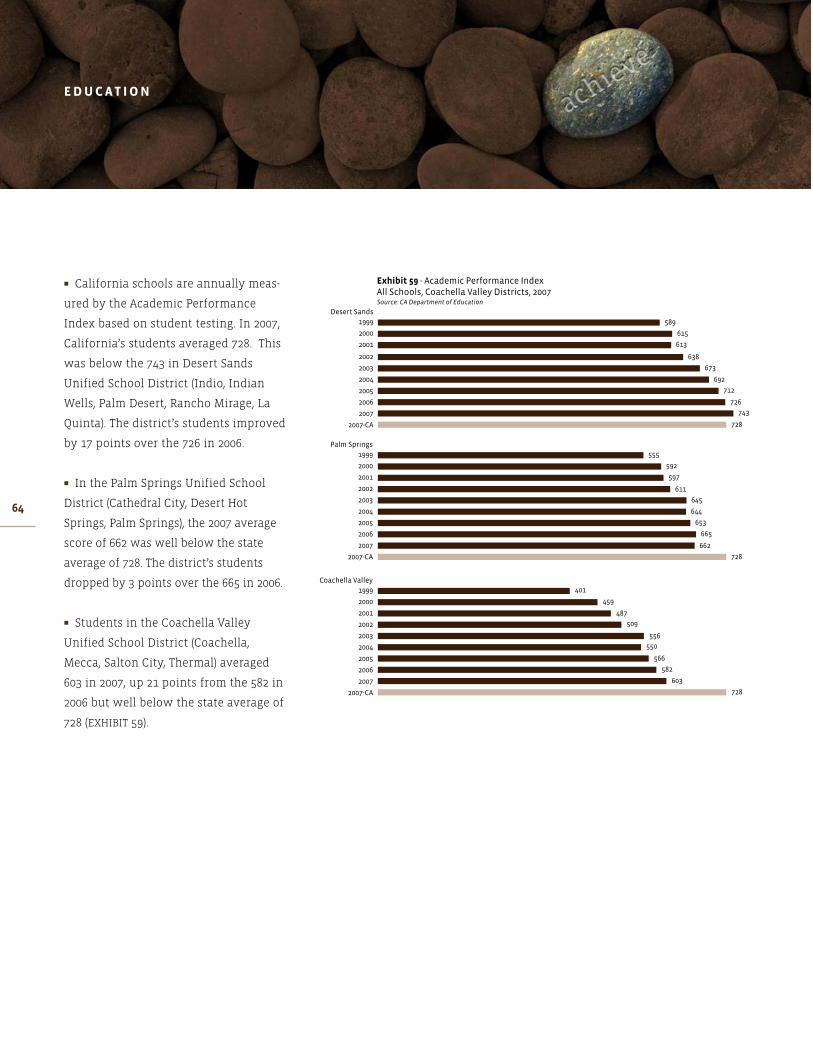
64
� California schools are annually meas-
ured by the Academic Performance
Index based on student testing. In 2007,
California’s students averaged 728. This
was below the 743 in Desert Sands
Unified School District (Indio, Indian
Wells, Palm Desert, Rancho Mirage, La
Quinta). The district’s students improved
by 17 points over the 726 in 2006.
� In the Palm Springs Unified School
District (Cathedral City, Desert Hot
Springs, Palm Springs), the 2007 average
score of 662 was well below the state
average of 728. The district’s students
dropped by 3 points over the 665 in 2006.
� Students in the Coachella Valley
Unified School District (Coachella,
Mecca, Salton City, Thermal) averaged
603 in 2007, up 21 points from the 582 in
2006 but well below the state average of
728 (EXHIBIT 59).
EDUCAT ION
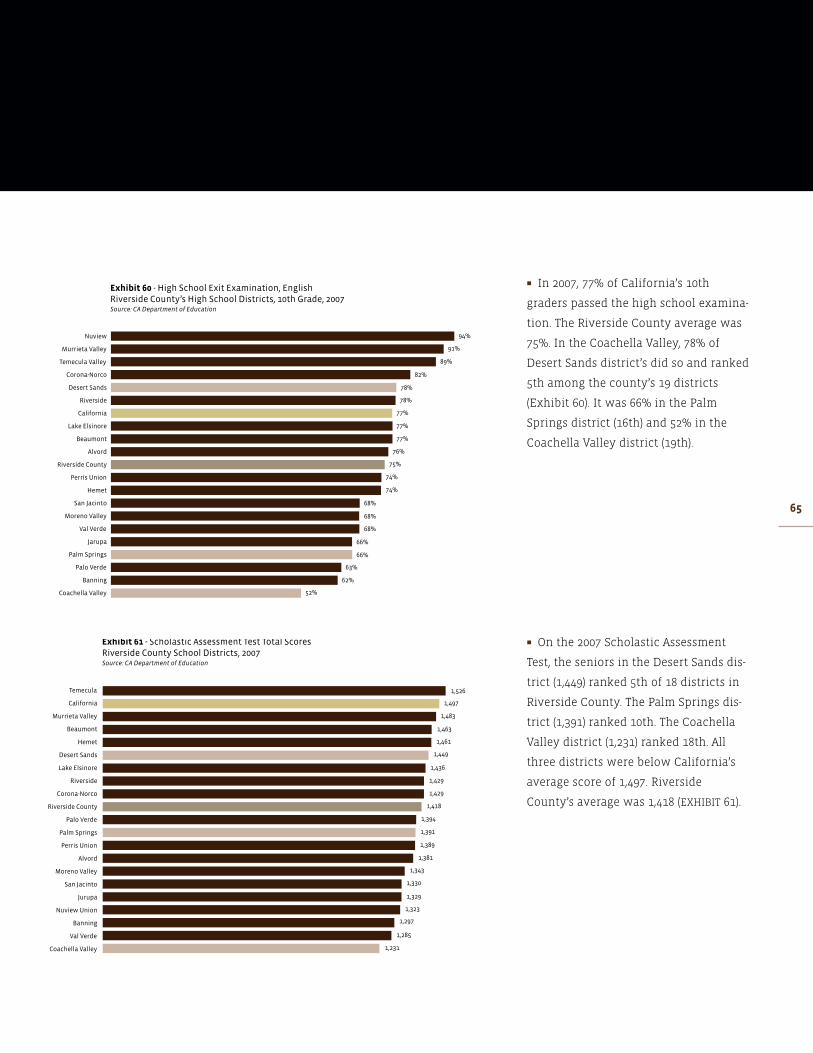
65
� In 2007, 77% of California’s 10th
graders passed the high school examina-
tion. The Riverside County average was
75%. In the Coachella Valley, 78% of
Desert Sands district’s did so and ranked
5th among the county’s 19 districts
(Exhibit 60). It was 66% in the Palm
Springs district (16th) and 52% in the
Coachella Valley district (19th).
� On the 2007 Scholastic Assessment
Test, the seniors in the Desert Sands dis-
trict (1,449) ranked 5th of 18 districts in
Riverside County. The Palm Springs dis-
trict (1,391) ranked 10th. The Coachella
Valley district (1,231) ranked 18th. All
three districts were below California’s
average score of 1,497. Riverside
County’s average was 1,418 (EXHIBIT 61).

66
COLLEGES AND UNIVERS I T I ES
College of the Desert
The Coachella Valley has been served by
the 160-acre College of Desert since 1958.
The school offers the first two years of a
four year college education, as well as two
year technical degrees and certificated
skill programs. In addition, the college
works with employers to offer workforce
training programs to enhance the abilities
of the existing labor force. To support its
academic, occupational/vocational, devel-
opmental and community programs, the
college offers classes in basic skill devel-
opment. In fall 2007, the enrollment was
10,903, up 917 or 9.2%. In 2005, voters
authorized $346.5 million in bonds to
renovate and expand the campus.
Students can major in a wide range of
practical and academic fields. A sam-
pling includes: agricultural specialties,
automotive technology, air conditioning,
architecture and environmental design,
life and physical sciences, business/hos-
pitality management, communications,
culinary arts, health science, math, sci-
ence, social sciences, law enforcement
and fire science.
UCR Palm Desert
In 2001, a $6 million gift was made to the
University of California Riverside to estab-
lish the Richard J. Heckmann International
Center for Entrepreneurial Management
and launch a satellite campus in the
Coachella Valley. An additional $10 million
from the State of California and a donation
of 20 acres of land from the city of Palm
Desert allowed the building to begin in
January 2005. Construction is now com-
pleted. The inaugural class of students
began classes in 2007 in both MBA and
MFA academic programs. The campus
has state-of-the-art facilities including a
high-tech 300-seat conference hall, tele-
conferencing and distance learning
capabilities, classrooms and seminar
rooms and computer labs.
California State University
San Bernardino
CSU San Bernardino began offering classes
in the Coachella Valley via leased land at
College of the Desert in 1986. The first of
three buildings on donated land in Palm
Desert was opened in 2002. In 2007, ground
was broken for the campus’s phase two.
Undergraduate degrees can be earned in
accounting, communications, criminal jus-
tice, English, finance, human development,
management, nursing, liberal studies and
psychology, as well as masters degrees in
public administration and education, plus
educational credentials.
UCR - PALM DESERT

67
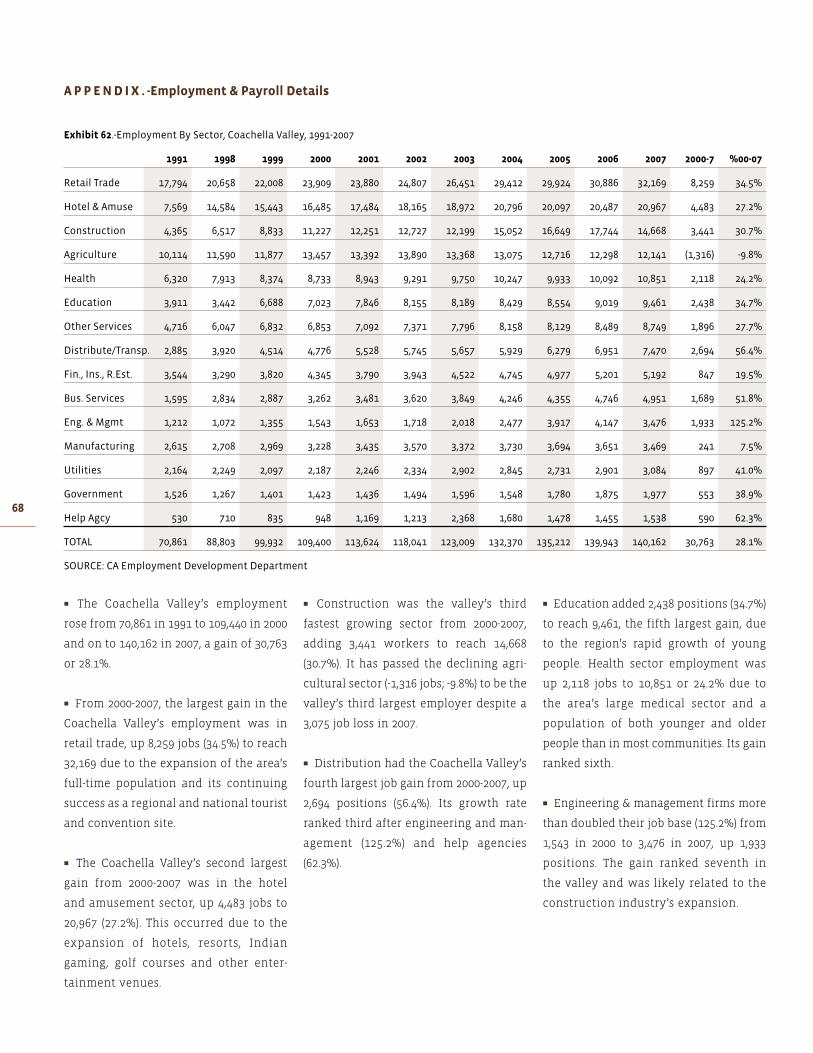
68
� Construction was the valley’s third
fastest growing sector from 2000-2007,
adding 3,441 workers to reach 14,668
(30.7%). It has passed the declining agri-
cultural sector (-1,316 jobs; -9.8%) to be the
valley’s third largest employer despite a
3,075 job loss in 2007.
� Distribution had the Coachella Valley’s
fourth largest job gain from 2000-2007, up
2,694 positions (56.4%). Its growth rate
ranked third after engineering and man-
agement (125.2%) and help agencies
(62.3%).
� The Coachella Valley’s employment
rose from 70,861 in 1991 to 109,440 in 2000
and on to 140,162 in 2007, a gain of 30,763
or 28.1%.
� From 2000-2007, the largest gain in the
Coachella Valley’s employment was in
retail trade, up 8,259 jobs (34.5%) to reach
32,169 due to the expansion of the area’s
full-time population and its continuing
success as a regional and national tourist
and convention site.
� The Coachella Valley’s second largest
gain from 2000-2007 was in the hotel
and amusement sector, up 4,483 jobs to
20,967 (27.2%). This occurred due to the
expansion of hotels, resorts, Indian
gaming, golf courses and other enter-
tainment venues.
� Education added 2,438 positions (34.7%)
to reach 9,461, the fifth largest gain, due
to the region’s rapid growth of young
people. Health sector employment was
up 2,118 jobs to 10,851 or 24.2% due to
the area’s large medical sector and a
population of both younger and older
people than in most communities. Its gain
ranked sixth.
� Engineering & management firms more
than doubled their job base (125.2%) from
1,543 in 2000 to 3,476 in 2007, up 1,933
positions. The gain ranked seventh in
the valley and was likely related to the
construction industry’s expansion.
APPEND IX . -Employment & Payroll Details
Exhibit 62.-Employment By Sector, Coachella Valley, 1991-2007
1991 1998 1999 2000 2001 2002 2003 2004 2005 2006 2007 2000-7 %00-07
Retail Trade 17,794 20,658 22,008 23,909 23,880 24,807 26,451 29,412 29,924 30,886 32,169 8,259 34.5%
Hotel & Amuse 7,569 14,584 15,443 16,485 17,484 18,165 18,972 20,796 20,097 20,487 20,967 4,483 27.2%
Construction 4,365 6,517 8,833 11,227 12,251 12,727 12,199 15,052 16,649 17,744 14,668 3,441 30.7%
Agriculture 10,114 11,590 11,877 13,457 13,392 13,890 13,368 13,075 12,716 12,298 12,141 (1,316) -9.8%
Health 6,320 7,913 8,374 8,733 8,943 9,291 9,750 10,247 9,933 10,092 10,851 2,118 24.2%
Education 3,911 3,442 6,688 7,023 7,846 8,155 8,189 8,429 8,554 9,019 9,461 2,438 34.7%
Other Services 4,716 6,047 6,832 6,853 7,092 7,371 7,796 8,158 8,129 8,489 8,749 1,896 27.7%
Distribute/Transp. 2,885 3,920 4,514 4,776 5,528 5,745 5,657 5,929 6,279 6,951 7,470 2,694 56.4%
Fin., Ins., R.Est. 3,544 3,290 3,820 4,345 3,790 3,943 4,522 4,745 4,977 5,201 5,192 847 19.5%
Bus. Services 1,595 2,834 2,887 3,262 3,481 3,620 3,849 4,246 4,355 4,746 4,951 1,689 51.8%
Eng. & Mgmt 1,212 1,072 1,355 1,543 1,653 1,718 2,018 2,477 3,917 4,147 3,476 1,933 125.2%
Manufacturing 2,615 2,708 2,969 3,228 3,435 3,570 3,372 3,730 3,694 3,651 3,469 241 7.5%
Utilities 2,164 2,249 2,097 2,187 2,246 2,334 2,902 2,845 2,731 2,901 3,084 897 41.0%
Government 1,526 1,267 1,401 1,423 1,436 1,494 1,596 1,548 1,780 1,875 1,977 553 38.9%
Help Agcy 530 710 835 948 1,169 1,213 2,368 1,680 1,478 1,455 1,538 590 62.3%
TOTAL 70,861 88,803 99,932 109,400 113,624 118,041 123,009 132,370 135,212 139,943 140,162 30,763 28.1%
SOURCE: CA Employment Development Department

69
� Hotel and amusement firms had the
Coachella Valley’s second largest pay-
roll in 2007 at $614.7 million. The sector’s
growth ranked third, up $249.2 million or
68.2%. The sector’s size and growth have
occurred because of the expansion of
the valley’s hotel resorts, its new Indian
gaming operations and its successful
golf courses and tennis clubs.
� The construction sector had the
Coachella Valley’s third largest 2007 pay-
roll at $586.8 million. Its 2000-2007 payroll
ranked second, up $262.4 million (80.9%).
This was the result of the area’s strong
residential, hotel, office and shopping
center markets in most of this decade.
However, it occurred despite a $85.1 mil-
lion slowdown from 2000-2007.
� The payroll released by firms and agen-
cies located in the Coachella Valley rose
from $1.41 billion in 1991 to $2.88 billion in
2000 and on to $4.86 billion in 2007. The
2000-2007 gain was $2.07 billion or 73.8%.
Inflation of 26.7% took $747 million of the
gain, leaving a payroll purchasing power
increase of $1.32 billion or 47.1%.
� In 2007, the valley’s largest payroll was
in its retail sector at $778.3 million, due to
the area’s growing full-time population
and its many convention and tourist
visitors. The sector had the valley’s
largest payroll increase from 2000-2007,
up $305.5 million (64.6%).
� In 2007, the health services group,
including hospitals, out-patient care,
senior care facilities and dentist’s
offices, had a total 2007 payroll of $554.8
million to rank fourth in size. The
group’s 2000-2007 payroll increase of
$223.9 million (67.7%) was valley’s fourth
largest increase.
� The education sector had the valley’s
fifth largest payroll at $425.2 million. Its
2000-2007 payroll growth of $186.1 mil-
lion (77.8%) was the fifth largest gain in
the Coachella Valley.
Exhibit 63.-Payroll By Sector, Coachella Valley, 1991-2007 (million)
1991 1998 1999 2000 2001 2002 2003 2004 2005 2006 2007 2000-7 %00-07
Retail Trade $267.6 $367.8 $410.2 $472.8 $481.5 $523.2 $576.0 $665.9 $686.9 $723.6 $778.3 $305.5 64.6%
Hotel & Amuse $122.8 $292.2 $320.0 $365.5 $395.9 $430.2 $463.9 $713.6 $524.9 $570.0 $614.7 $249.2 68.2%
Construction $108.0 $180.4 $244.9 $324.4 $380.0 $412.8 $403.3 $525.8 $586.9 $671.9 $586.8 $262.4 80.9%
Health $208.6 $295.9 $302.6 $330.9 $351.5 $381.9 $408.2 $481.0 $472.6 $490.6 $554.8 $223.9 67.7%
Education $92.4 $119.2 $216.2 $239.2 $288.5 $314.0 $320.1 $355.7 $350.2 $387.7 $425.2 $186.1 77.8%
Distribute/Transp. $64.4 $106.9 $137.5 $149.2 $181.8 $197.5 $198.4 $231.5 $248.2 $283.3 $306.8 $157.5 105.6%
Fin., Ins., R.Est. $92.2 $122.6 $144.5 $165.2 $164.0 $178.1 $197.0 $232.2 $253.8 $276.9 $270.5 $105.2 63.7%
Other Services $78.5 $115.7 $124.8 $143.0 $156.9 $170.4 $200.3 $218.3 $225.7 $244.9 $254.8 $111.8 78.2%
Agriculture $99.8 $170.8 $184.7 $201.7 $195.2 $212.0 $225.0 $239.2 $235.1 $242.7 $253.0 $51.3 25.4%
Utilities $69.5 $91.8 $92.6 $97.9 $107.1 $116.3 $148.3 $156.3 $148.1 $165.9 $183.4 $85.5 87.4%
Eng. & Mgmt $36.4 $35.6 $43.5 $53.1 $63.1 $68.6 $93.1 $132.5 $165.9 $174.7 $177.2 $124.1 233.5%
Bus. Services $44.7 $71.1 $77.1 $78.1 $86.0 $93.5 $107.7 $128.2 $150.7 $169.1 $173.8 $95.6 122.4%
Government $48.9 $54.2 $57.4 $59.9 $64.4 $69.9 $82.9 $95.6 $98.5 $112.5 $129.0 $69.0 115.2%
Manufacturing $66.0 $81.2 $90.3 $103.8 $106.8 $116.0 $115.5 $136.1 $131.5 $126.8 $126.9 $23.1 22.2%
Help Agcy $6.4 $7.0 $9.2 $13.3 $17.2 $18.7 $45.0 $29.1 $27.8 $24.7 $28.6 $15.3 115.3%
TOTAL $1,406.1 $2,112.5 $2,455.4 $2,798.2 $3,040.1 $3,303.2 $3,584.8 $4,340.9 $4,306.7 $4,665.4 $4,863.8 $2,065.6 73.8%
SOURCE: CA Employment Development Department

70
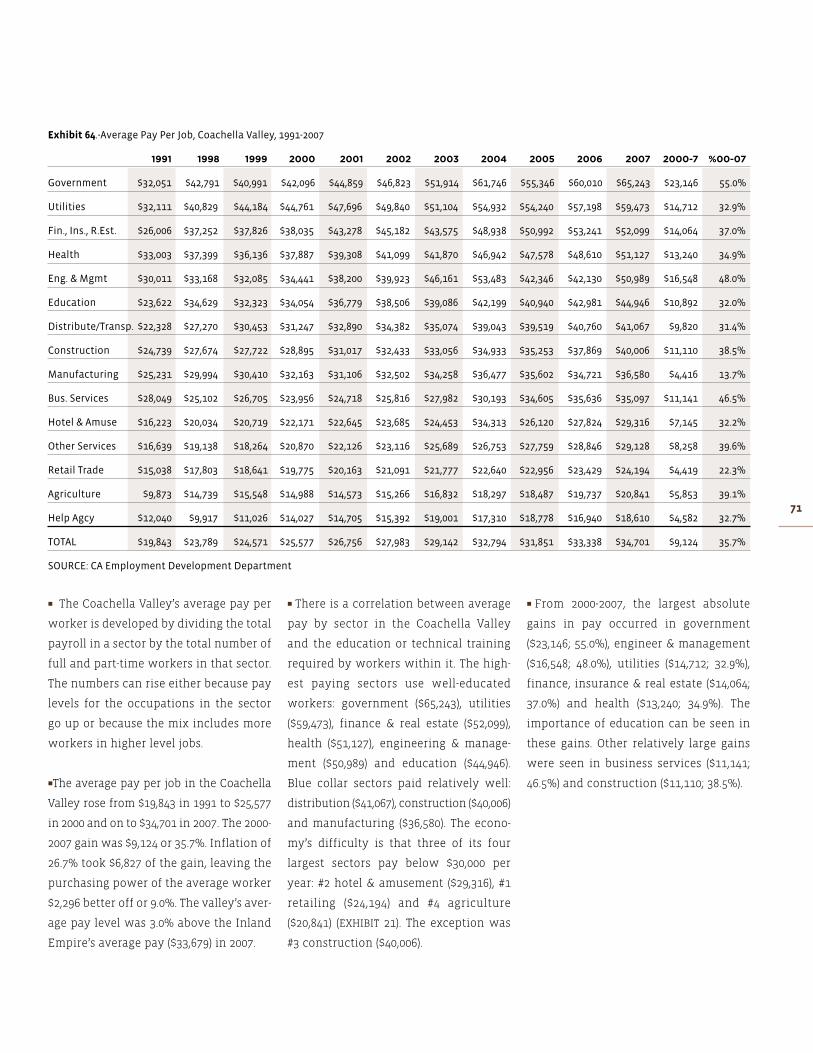
71
� There is a correlation between average
pay by sector in the Coachella Valley
and the education or technical training
required by workers within it. The high-
est paying sectors use well-educated
workers: government ($65,243), utilities
($59,473), finance & real estate ($52,099),
health ($51,127), engineering & manage-
ment ($50,989) and education ($44,946).
Blue collar sectors paid relatively well:
distribution ($41,067), construction ($40,006)
and manufacturing ($36,580). The econo-
my’s difficulty is that three of its four
largest sectors pay below $30,000 per
year: #2 hotel & amusement ($29,316), #1
retailing ($24,194) and #4 agriculture
($20,841) (EXHIBIT 21). The exception was
#3 construction ($40,006).
� The Coachella Valley’s average pay per
worker is developed by dividing the total
payroll in a sector by the total number of
full and part-time workers in that sector.
The numbers can rise either because pay
levels for the occupations in the sector
go up or because the mix includes more
workers in higher level jobs.
�The average pay per job in the Coachella
Valley rose from $19,843 in 1991 to $25,577
in 2000 and on to $34,701 in 2007. The 2000-
2007 gain was $9,124 or 35.7%. Inflation of
26.7% took $6,827 of the gain, leaving the
purchasing power of the average worker
$2,296 better off or 9.0%. The valley’s aver-
age pay level was 3.0% above the Inland
Empire’s average pay ($33,679) in 2007.
� From 2000-2007, the largest absolute
gains in pay occurred in government
($23,146; 55.0%), engineer & management
($16,548; 48.0%), utilities ($14,712; 32.9%),
finance, insurance & real estate ($14,064;
37.0%) and health ($13,240; 34.9%). The
importance of education can be seen in
these gains. Other relatively large gains
were seen in business services ($11,141;
46.5%) and construction ($11,110; 38.5%).
Exhibit 64.-Average Pay Per Job, Coachella Valley, 1991-2007
1991 1998 1999 2000 2001 2002 2003 2004 2005 2006 2007 2000-7 %00-07
Government $32,051 $42,791 $40,991 $42,096 $44,859 $46,823 $51,914 $61,746 $55,346 $60,010 $65,243 $23,146 55.0%
Utilities $32,111 $40,829 $44,184 $44,761 $47,696 $49,840 $51,104 $54,932 $54,240 $57,198 $59,473 $14,712 32.9%
Fin., Ins., R.Est. $26,006 $37,252 $37,826 $38,035 $43,278 $45,182 $43,575 $48,938 $50,992 $53,241 $52,099 $14,064 37.0%
Health $33,003 $37,399 $36,136 $37,887 $39,308 $41,099 $41,870 $46,942 $47,578 $48,610 $51,127 $13,240 34.9%
Eng. & Mgmt $30,011 $33,168 $32,085 $34,441 $38,200 $39,923 $46,161 $53,483 $42,346 $42,130 $50,989 $16,548 48.0%
Education $23,622 $34,629 $32,323 $34,054 $36,779 $38,506 $39,086 $42,199 $40,940 $42,981 $44,946 $10,892 32.0%
Distribute/Transp. $22,328 $27,270 $30,453 $31,247 $32,890 $34,382 $35,074 $39,043 $39,519 $40,760 $41,067 $9,820 31.4%
Construction $24,739 $27,674 $27,722 $28,895 $31,017 $32,433 $33,056 $34,933 $35,253 $37,869 $40,006 $11,110 38.5%
Manufacturing $25,231 $29,994 $30,410 $32,163 $31,106 $32,502 $34,258 $36,477 $35,602 $34,721 $36,580 $4,416 13.7%
Bus. Services $28,049 $25,102 $26,705 $23,956 $24,718 $25,816 $27,982 $30,193 $34,605 $35,636 $35,097 $11,141 46.5%
Hotel & Amuse $16,223 $20,034 $20,719 $22,171 $22,645 $23,685 $24,453 $34,313 $26,120 $27,824 $29,316 $7,145 32.2%
Other Services $16,639 $19,138 $18,264 $20,870 $22,126 $23,116 $25,689 $26,753 $27,759 $28,846 $29,128 $8,258 39.6%
Retail Trade $15,038 $17,803 $18,641 $19,775 $20,163 $21,091 $21,777 $22,640 $22,956 $23,429 $24,194 $4,419 22.3%
Agriculture $9,873 $14,739 $15,548 $14,988 $14,573 $15,266 $16,832 $18,297 $18,487 $19,737 $20,841 $5,853 39.1%
Help Agcy $12,040 $9,917 $11,026 $14,027 $14,705 $15,392 $19,001 $17,310 $18,778 $16,940 $18,610 $4,582 32.7%
TOTAL $19,843 $23,789 $24,571 $25,577 $26,756 $27,983 $29,142 $32,794 $31,851 $33,338 $34,701 $9,124 35.7%
SOURCE: CA Employment Development Department