lecture 1 intro to gis and gis vector and raster data...
TRANSCRIPT

Lecture 1 Intro to GIS and
GIS Vector and Raster Data Models
Tomislav Sapic GIS Technologist
Faculty of Natural Resources Management Lakehead University
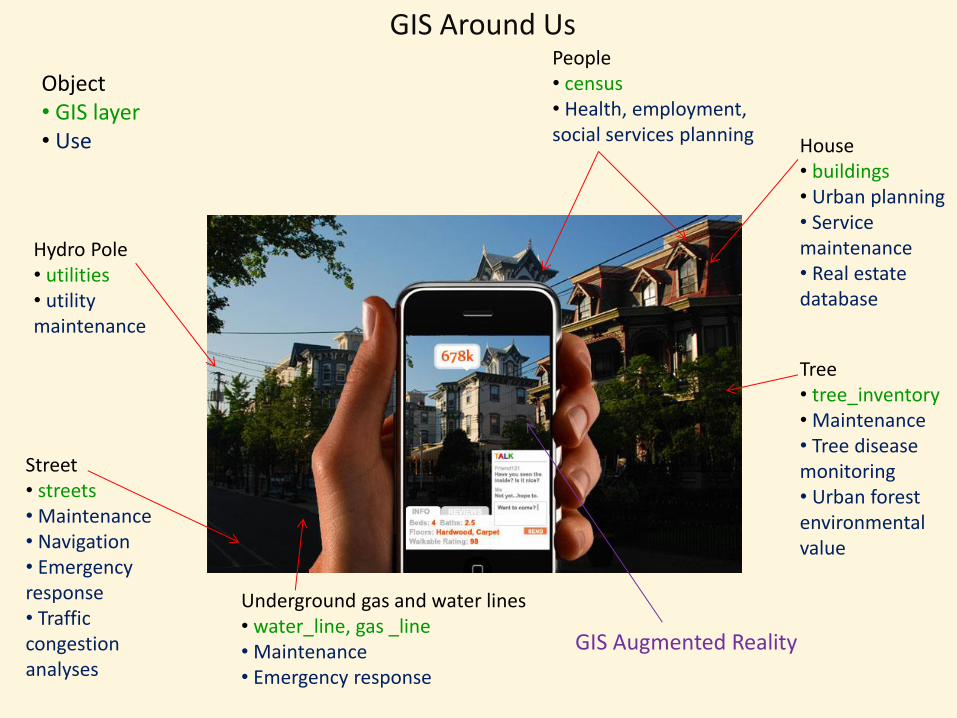
Hydro Pole • utilities • utility maintenance
GIS Around Us
Object • GIS layer • Use
Tree • tree_inventory • Maintenance • Tree disease monitoring • Urban forest environmental value
Street • streets • Maintenance • Navigation • Emergency response • Traffic congestion analyses
Underground gas and water lines • water_line, gas _line • Maintenance • Emergency response
House • buildings • Urban planning • Service maintenance • Real estate database
People • census • Health, employment, social services planning
GIS Augmented Reality

Definition: … a computer system capable of assembling, storing, manipulating, and displaying geographically referenced information. (United States Geological Survey (USGS 2005)).
Data – a collection of facts or figures that pertain to places, people, things, events and concepts. Data are usually represented by numerical values, alphanumeric characters, logical values, etc. In GIS, there are also locational data – x,y,z coordinates representing positions on the surface of the Earth. Information – data structured, formatted, converted and modelled to become meaningful to a user. System – many interrelated parts, which may themselves be operational systems, constructed together to achieve certain objectives or functions.
Geographic Information Systems
Source: Heywood et al. (2006)
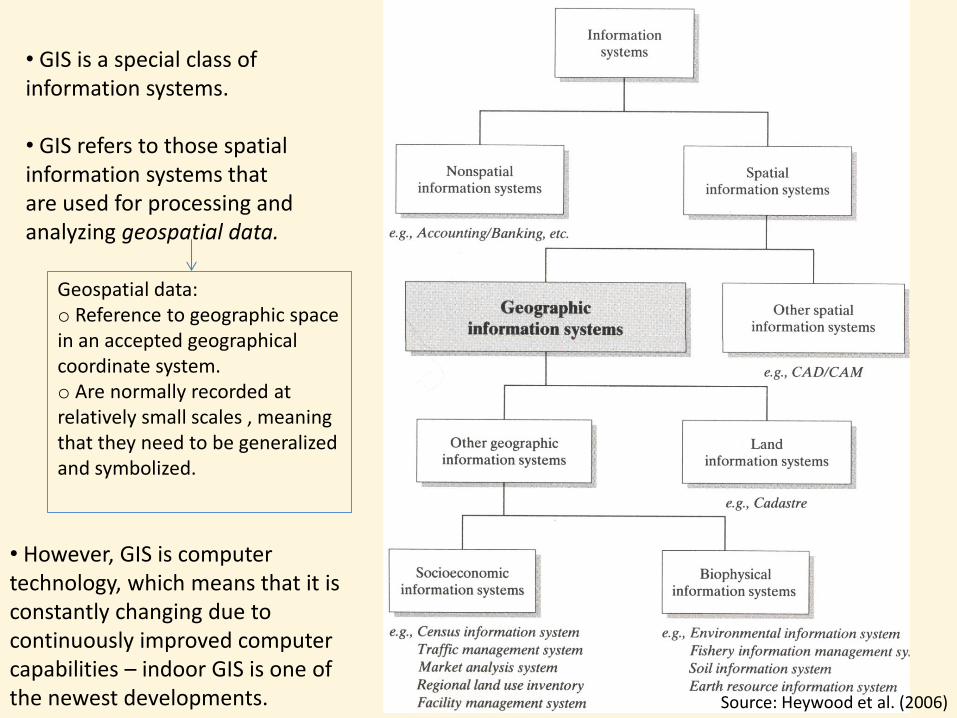
• GIS is a special class of information systems. • GIS refers to those spatial information systems that are used for processing and analyzing geospatial data.
Geospatial data: o Reference to geographic space in an accepted geographical coordinate system. o Are normally recorded at relatively small scales , meaning that they need to be generalized and symbolized.
• However, GIS is computer technology, which means that it is constantly changing due to continuously improved computer capabilities – indoor GIS is one of the newest developments. Source: Heywood et al. (2006)

Non-spatial information
Geospatial or non-spatial information?
Geospatial information – GIS!
Geospatial vs. non-spatial information

GIS
Data Capture and Input
Data Storage and
Management
Something is missing
Hardware and GIS Software

People!
Depending on our interests and needs we decide on:
•What type of geographic features to collect.
•How to store information, in what format, for what purpose.
•How to analyze data
•How to present data

GIS Components
• Data Capture and Input • Hardware • GIS Software • Data Storage and Management • Spatial and Attribute Analyses • Visualization • People

History of GIS
http://www.youtube.com/watch?v=eAFG6aQTwPk

History of GIS Canadian connection: The Canada Geographic Information System (CGIS), which was conceptualized in the early 1960s and became operational in 1972, as reported by Tomlinson et al. (1976), has been widely recognized as the first GIS ever produced.
Source: Heywood et al. (2006)

The Canada Geographic Information System (CGIS)
• Developed as a digital technological alternative to paper storage of spatial (maps) and attribute data collected through Canada Land Inventory (CLI).
• CLI was designed to overcome inter-provincial differences and classify the land across Canada according to productive capability, be able to measure the areas and encourage the use of the collected data in planning, in the post-WW2 period of urban expansion
• CGIS was fully operational in 1972 after 10 years of development.
• Roger Tomlinson was one of the main actors in the development; IBM was brought to the table to provide computer programming and data management.
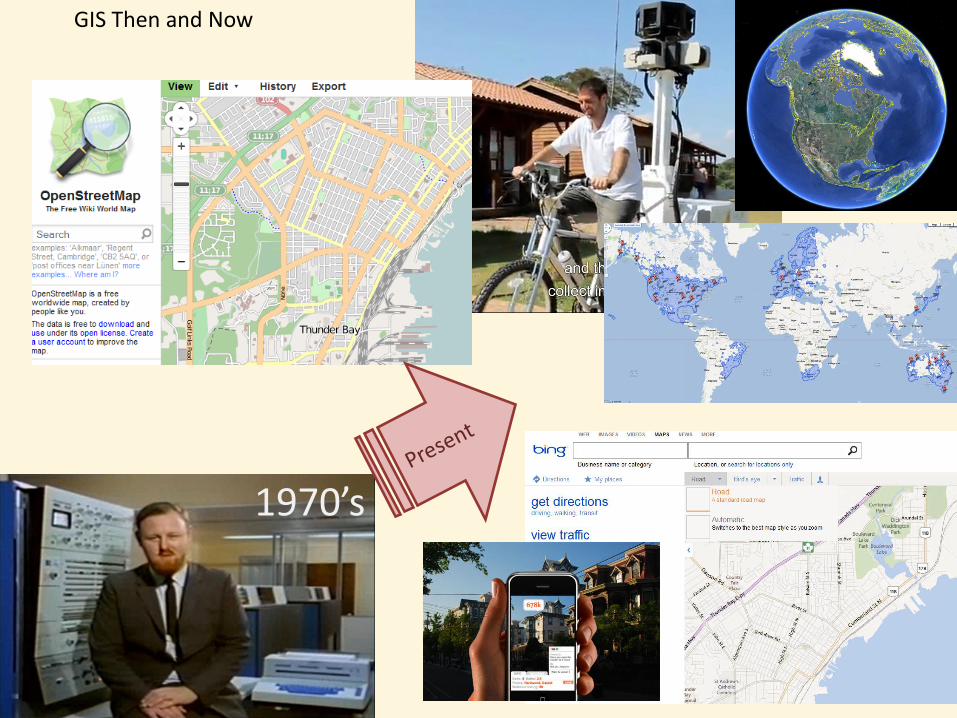
GIS Then and Now
1970’s

1982 • ArcINFO released. • Command prompt based • Datasets: coverages, grids. • Discontinued in 1999.
1992 • ArcView 3.x released. • Graphical User Interface. • New dataset: shapefile. • Discontinued in 2002.
1999 • ArcGIS 8.0 released. • Combination between ArcINFO and ArcView 3.x • New dataset: geodatabase.
2004 • ArcGIS 9.3 released.
2010 • ArcGIS 10 released.
History of ESRI GIS Software • Practical GIS work for the course has been delivered mostly on ESRI GIS software.
• There are other, including free and open source, GIS software available to GIS users.

GIS Applications
Source: Heywood et al. (2006)

Vector and Raster Data Models

Vector and Raster Data Models • Spatial data can represent real-world features that have discrete boundaries (such as roads, buildings, lakes, rivers, administrative boundaries) as well as real-world phenomena/features that have non-discrete boundaries (such as precipitation and nutrient levels, terrain).
• In general, the vector data model is used to represent the former and the raster data model to represent the latter.
• However, the lines od separation are sometimes crossed.
•As well, a typical GIS process involves moving back-and-forth between the two models. Source: Lo et al.
(2007)

Raster vs. Vector Data Model
Representations of the Real
World
Source: Heywood et al. (2006)
• Although discrete objects such as buildings, ski lifts, roads, are usually not represented by a raster data model, they are handy for illustrating a direct comparison of representation between a raster and a vector data model.
• Elevation, as a continuous land (field) characteristic, is usually stored in a vector file for easier data management, but is more suitable to be represented by a raster data model.

Roads are typically stored in a separate line vector GIS file, called, e.g., roads
Rivers would typically be stored in a separate line vector GIS files, called, e.g., rivers or streams.
Lakes would typically be stored in a polygon (poly) vector GIS file, called, e.g., lakes.
A small pond might be stored as part of a wetlands GIS file.
A forest area (stand) is usually delineated and stored in a separate poly GIS file, often called fri.
Vector Data Model
• Spatial features are usually stored in separate theme GIS files.

Vector Data Model The three main geometric shapes used in the vector data model, to represent real world features are:
• Point • Line • Polygon • Points, lines and polygons are
stored in separate, point, line, and polygon, GIS files. • Each GIS file along with spatial features also contains a table in which each row (record) represents one of the spatial features. • (An exception to the above are so called multipart features, where one row represents multiple features.) • Columns (fields) in the table are used to store data (attributes) describing each feature.
Line Point Polygon
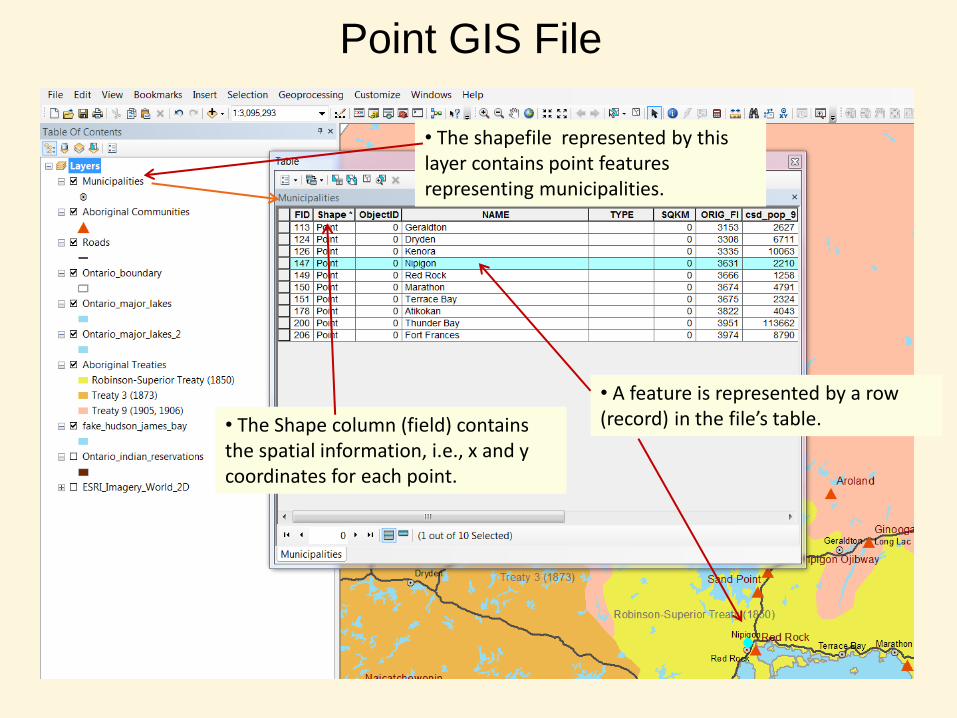
Point GIS File
• The shapefile represented by this layer contains point features representing municipalities.
• A feature is represented by a row (record) in the file’s table. • The Shape column (field) contains
the spatial information, i.e., x and y coordinates for each point.

Line GIS File • Line features are made of two or more vertices (sing. vertex). • A vertex is a point georeferenced by an x,y pair. • Each record (row) in the table represents a whole line (all vertices composing the line), which is often just a segment of a longer line.
End vertices are called nodes.
In ArcGIS, vertices are not usually visible but can be made visible during the editing of the line.

Polygon GIS File
• Polygon features are made of one or more lines that enclose(s) an area.
• Since lines are made up of vertices that means that polygons are, in the end, made up of vertices (points), i.e. they are represented by a group of x.y coordinates.
• Each polygon is represented by one record in the file’s table.

• Circles, as well, are actually a series of vertices, i.e. a series of straight edges (not consisting of an infinite number of points!).
• This is changing as well, with GIS software now giving an option to connect vertices with parameterized segments, such as circular arcs, elliptical arcs, and Bézier curve.

x,y Pairs as Spatial Representation
• Ultimately, GIS vector files, point, line or polygon files, have their spatial representation stored in the computer memory through x,y coordinate pairs.
• There are no ‘lines’ stored – the GIS software recognizes the type of the file (a point, line, or a polygon GIS file) and displays the features as points only or connects the points (vertices) with lines and displays them as lines or fills the line-enclosed areas with a colour and displays the features as polygons.
Separate GIS files.
Source: Lo et al. (2007)

Singleparts vs.Multiparts
Singlepart • One feature is represented by one record.
Multipart • Multiple features are represented by one record. • Applications for multipart features are for example, multiple polygons representing protective buffers around the same type of features (e.g. eagle nests). • A downside of a multipart: only one attribute is assigned to all multipart parts, which, e.g. for areas, can be deceiving when looking at individual parts.

Vector Data Model Attributes
• In GIS vector files attributes are, in a simple form, stored in tables (databases). • A table consists of records (rows) representing individual features, fields (columns) representing a particular theme describing the feature, and attributes – an intersection between a record and a field. • In ArcGIS, FID and Shape fields, although shown in the Table of Attributes, are not actually part of the attributes, but rather represent the spatial and index information (e.g. the .shp and .shx content in shapefiles). Because of it FID and Shape fields cannot be deleted from the table, unlike any other pure attribute field.
Record Field
Attribute

Typical Storages of Vector Data • All here presented happen to be created by ESRI.
Vector File Format
Description
Coverage
- first vector file format developed by ESRI - it was the main vector file format of, at the time, major ESRI software, ArcINFO - composite - has inherent topology - discontinued but can still be found in older GIS databases
Shapefile
- developed as a simpler file format than coverages, at first meant only for converting coverages into it and viewing it in a more user friendly GIS software called ArcView - composite - become wide spread and adopted by all newly developed GIS software, including open source - often less stable than coverages, doesn`t have inherent topology
Feature Class (not a true file but
a geodatbase
component)
- successor to shapefile - composite but residing in a geodatabase, in the form of bit tables - can only exist within a geodatabase - as part of a geodatabase can have, e.g., table joins and topology defined.

Shapefile Vector File Format
• Shapefiles are vector composite files, made up of 3-13 separate files.
• In Windows Explorer all shapefile components are shown, in ArcCatalog entire shapefile is shown as one item.
Shapefile
* Basic shapefile elements (a shapefile is defunct without any of them).
• All components of a shapefile need to be present together (important when transferring files!), otherwise the shapefile can be defunct or incomplete.
• The projection file is a beneficial addition to a shapefile, although not a necessary one—shapefiles can be used without a projection file but this is to be avoided.
• All elements have the same filename (e.g., roads).
• Shapefiles can be either a point or a line (arc) or a polygon file -- they cannot contain more than one shape type!
Possible composite file extensions:
*.dbf – dBase table (database) file, containing attributes.
*.shp – the file that stores the feature geometry, i.e., x,y coordinates.
*.shx – the file that stores the index connecting .dbf and .shp files.
.prj – projection file.
.shp.xml – metadata file.
.sbn, .sbx – spatial index files – sometimes present.
.ain and .aih – attribute index file.
.atx – new, ArcGIS,atribute index file.
.lxs, .mxs – geocoding index files.
.cpg – specifies character set code page.

Raster Data Model • Raster data model is represented by square cells of same size organized in horizontal rows
and vertical columns (rows and columns are never slanted).
Spatial resolution of a raster is
defined by the cell size (1 m , …
20 m , … 100 m, …).
Nominal or ordinal values can be used
in the raster when something is not
measured but classified into categories
(themes).
Each cell contains a value. Values are
always numeric and can be either integer
or decimal numbers (or nodata in grids).
A raster’s position (geographic location) is defined by
assigning x,y coordinates to one or two corners -- positions
of the cells themselves flow from this reference point and
the overall Cartesian coordinate system structure.

An ArcMap layer representing a raster that contains elevation values. The raster itself
doesn’t contain colours – colours are assigned to raster cells by software for interpretation
purposes and are based on cell vales.
• A raster dataset representing terrain.
The raster converted into a simple text raster format, ASCII.

Raster’s Spatial Resolution • Expresses the size of the earth surface represented
by one (square) cell.
• A 10 m raster is a raster whose each cell represents 10 x 10 meters of the earth surface.
• Because of the nature of rasters and their easy computational resampling, raster spatial resolution does not necessarily represent the spatial variability on the ground.
• The measure of represented spatial variability is expressed with Ground Sampling Distance.
• For example, the 80 m raster in the example on the right can be taken and resampled into a 40 m raster, but in that case all four new 40 m cells within each original 80 m cell area would have the same cell value – the spatial resolution would become 40 m, but the Ground Sampling Distance would stay 80 m.
• Chosen coarseness of raster resolution has implications on the feature representation.

Raster Types Based on Cell Values
• In terms of the cell values, generally, rasters can be divided into four broad groups: image rasters, interpolated rasters, thematic rasters, and derivatives of each of the group.
• Image rasters have values that represent measurements of energy (reflections) captured by a sensor (camera).
• Image raster cell values are usually whole numbers (integers).

• Image raster files are often multiband
• Values representing different electromagnetic spectrum segments (i.e., primary colours, NIR, etc.), are stored in separate bands (channels) – spectral resolution!
~ 610 – 660 nm
~ 530 – 590 nm
~ 430 – 490 nm
One byte (0-255) per pixel, per channel , if an 8 bit image; three bytes per pixel (0-16,777,215) per channel , if a 24 bit image, etc.
Source: ESRI, ArcGIS Help File, 2011.

• Thematic rasters have cell values that represent a theme, category, class. Usually these are whole, integer numbers. • Cell values in interpolated rasters represent interpolated measurements such as terrain elevations, precipitation levels, soil pH levels, etc. Usually the cell values are decimal numbers (floats), although they can be integers as well.
Raster Types Based on Cell Values
Cell value 1 = steep slope Cell value 100 = not steep slope
• Thematic and interpolated rasters can be multi-band but are predominantly one-band.

Raster Types Based on Cell Values • Examples of derivative rasters:
• A slope raster created from a digital terrain (interpolated) raster http://desktop.arcgis.com/en/arcmap/10.3/tools/spatial-analyst-toolbox/how-slope-works.htm . • A pansharpened raster created from an image raster http://desktop.arcgis.com/en/arcmap/10.3/manage-data/raster-and-images/fundamentals-of-panchromatic-sharpening.htm . • A zonal statistics raster can be created from a thematic and an interpolated raster http://desktop.arcgis.com/en/arcmap/10.3/tools/spatial-analyst-toolbox/h-how-zonal-statistics-works.htm .

Interpolated raster.
Image raster.
Classification into classes
Thematic
raster.
Raster Types Based on Cell Values
Derivative raster.
E.g., slope raster

Regular pattern of sizes and distances
in the raster data model means that
topology is inherent to it, allowing for
a range of spatial, topological
analyses.
Relation Analyses Through Overlapping
Neighbourhood Analyses
Cost-Path Analyses

Raster Dataset Properties
• Format: the type of file used to store the raster (for example, .jpg, .tiff). • Number of Bands: the number of layers in the raster file, representing the same area but through different values. • Data Type: the type of data assigned to raster cells; integer (whole number), float (decimal number), etc. The data type is assigned to the entire raster, all cells have the same data type – there can’t be one cell having an integer value and the next cell a float number value. • Data Depth: also known as pixel or bit depth – the per-cell binary range assigned to the raster; e.g., an 8-bit integer raster can have integers (whole numbers) from 0 – 255 (8 bits = 255) assigned to a cell, only. • Statistics: include minimum and maximum value, mean, and standard deviation of all values assigned to raster cells. • Extents: left, right, top and bottom coordinates of the raster dataset. • Projection: raster’s coordinate system (map projection). • Size of the Raster: the number of rows and columns in the raster.

Raster Data Model
• In the raster data model, attributes are limited to the numeric values of the cells themselves,
and while it is possible to link additional attributes to the groups of cells having same values,
this is rarely done in practice for the reasons of low utilization value and cumbersome data
management.
• Raster data models often take more memory space than the spatial component of the vector
data models (attributes attached to the vector data models can tip the balance the other way).
• Rasters can also have NoData values, which indicates absence of data (not the same as
zero!).
Typical Raster Data Formats in ArcGIS
GRID – a raster data format used by ESRI platforms; can contain both integers and floats;
usually one-band but can be stacked into so called grid stacks.
.img – a raster file format created for ERDAS, a remote sensing software.; can contain both
integers (up to 32 bit) and floats; can be both one-band or multiband (including > 3 bands).
.tiff - can contain both integers (up to 32 bit) and floats; can be both one-band or multiband
(including > 3 bands).
.jpg - cannot contain > 8-bit (unsigned) values and cannot have > 3 bands.
ASCII – uncompressed, simple raster data format, used to transfer information.

Vector Data Model
Suitable for:
• Recording discrete features with
definable boundaries.
• Attaching both textual and numerical
attributes to spatial features, and
managing and analyzing these attributes
and through them the features
themselves.
• Editing, update, and management of
the spatial features.
•Representing natural shapes.
Raster Data Model
Suitable for:
• Representing continuous spatial
features.
• Containing images (aerial, satellite) .
• Analyzing relations between
continuous phenomena taking place on
the same geography.
• Analyzing spatial relations between
features (cost-path, density,
interspersion, edge contact, etc.).
• Neighbourhood analyses.
In many respects, vector and raster data models complement each other and
get switched between along the processes of data collection, observation,
analyses, and presentation.
Vector and Raster Data Models and Their Advantages

References: Heywood, I., S. Cornelius, and S. Carver. 2006. Introduction to Geographical Information
Systems. Pearson Prentice Hall, New York. Lo, C. P. and A. K. W. Yeung. 2007. Concepts and Techniques of Geographic Information
Systems. Pearson Education Inc. 532 pp. Tomlinson, R. F., H. W. Calkins, D. F. Marble. 1976. CGIS: A mature, large geographic
information system. Computer Handling of Geographical Data. Paris: UNESCO Press.