lecture 14 - reliability centered maintenance-2012
DESCRIPTION
Reliability CenteredTRANSCRIPT
MAINTENANCE MANAGEMENTIM – 503
Lecture – 14: Reliability Centered M i (RCM)Maintenance (RCM)
D M h d F h dDr Muhammad Fahad
Associate Professor/Director Product Development Centre
Dept of Industrial & ManufacturingDept of Industrial & Manufacturing
NED University of Engineering & Technology
Slide 1-2
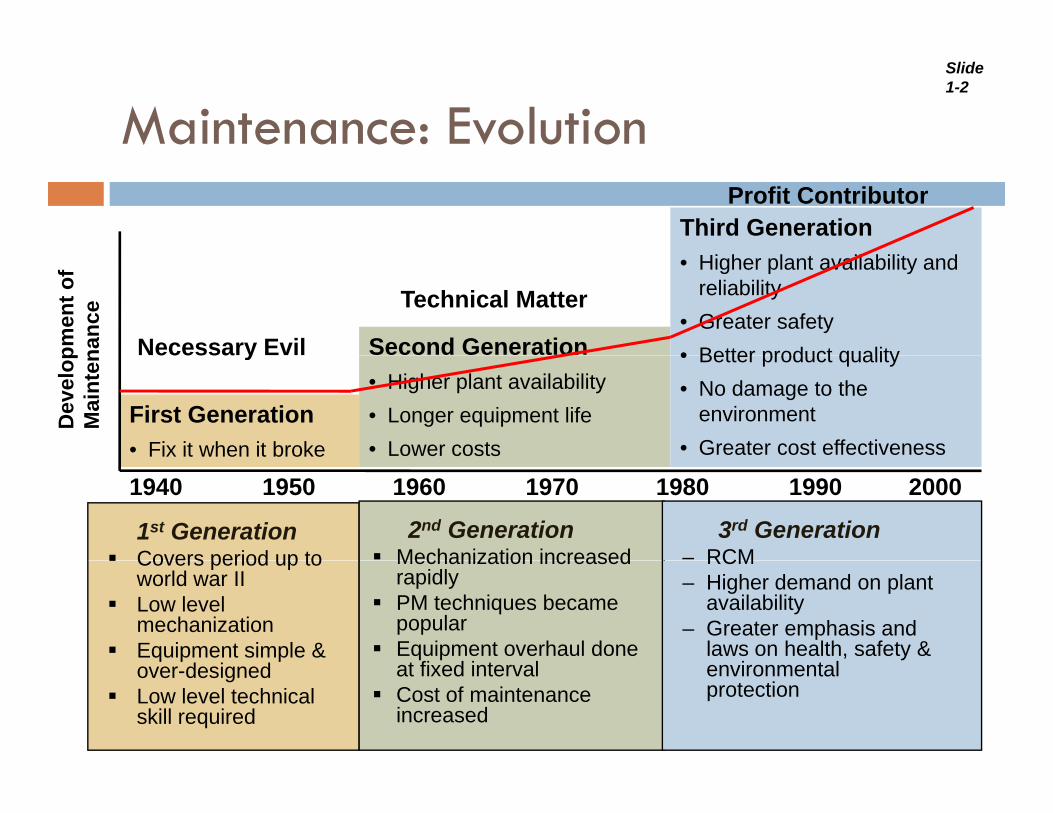
Maintenance: Evolution
Third GenerationProfit Contributor
Second Generation
• Higher plant availability and reliability
• Greater safety• Better product qualitypm
ent o
f na
nce
Necessary Evil
Technical Matter
First Generation• Fix it when it broke
• Higher plant availability• Longer equipment life• Lower costs
• Better product quality• No damage to the
environment• Greater cost effectiveness
Dev
elop
Mai
nten
ecessa y
1940 1950 1960 1970 1980 1990 2000
1st GenerationCovers period up to
2nd GenerationMechanization increased
3rd Generation– RCMCovers period up to
world war IILow level mechanizationEquipment simple &
d i d
Mechanization increased rapidlyPM techniques became popularEquipment overhaul done t fi d i t l
RCM– Higher demand on plant
availability– Greater emphasis and
laws on health, safety & i t lover-designed
Low level technical skill required
at fixed intervalCost of maintenance increased
environmental protection
Slide 1-3
Reliability Centered Maintenance
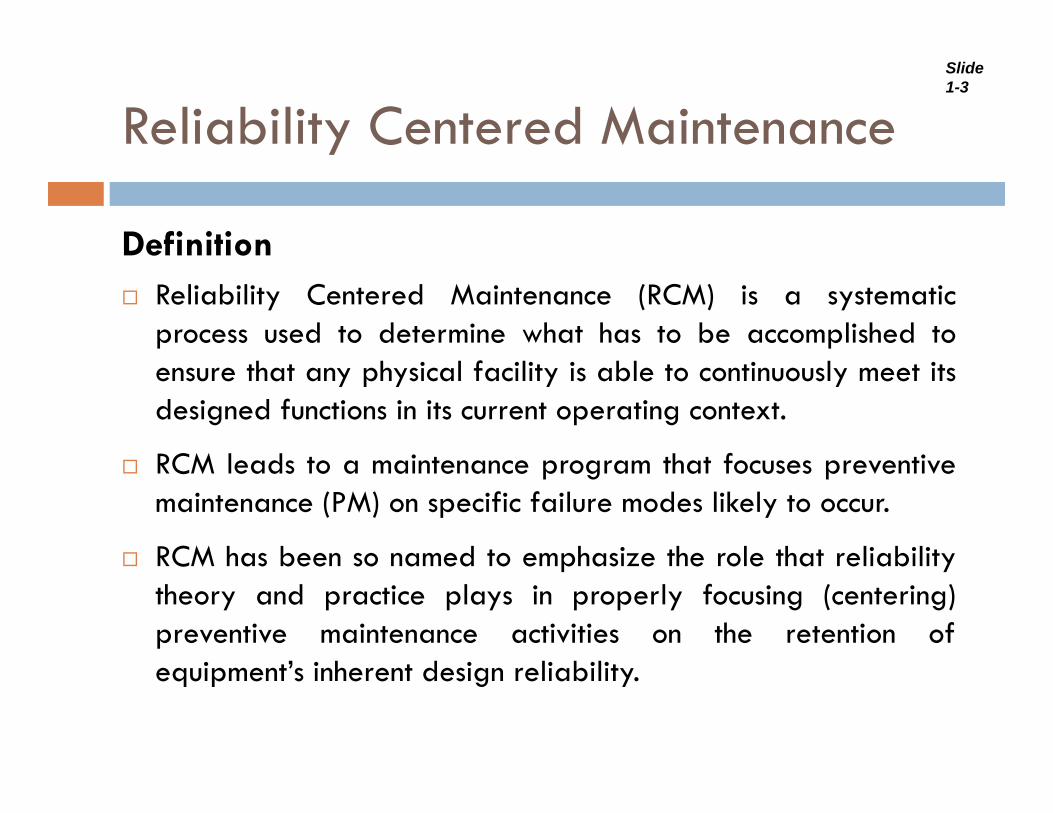
Definition
y
DefinitionReliability Centered Maintenance (RCM) is a systematicprocess used to determine what has to be accomplished toensure that any physical facility is able to continuously meet itsdesigned functions in its current operating context.
RCM l d t i t th t f tiRCM leads to a maintenance program that focuses preventivemaintenance (PM) on specific failure modes likely to occur.
RCM has been so named to emphasize the role that reliabilityRCM has been so named to emphasize the role that reliabilitytheory and practice plays in properly focusing (centering)preventive maintenance activities on the retention of
i ’ i h d i li biliequipment’s inherent design reliability.
Slide 1-4
Reliability Centered Maintenance
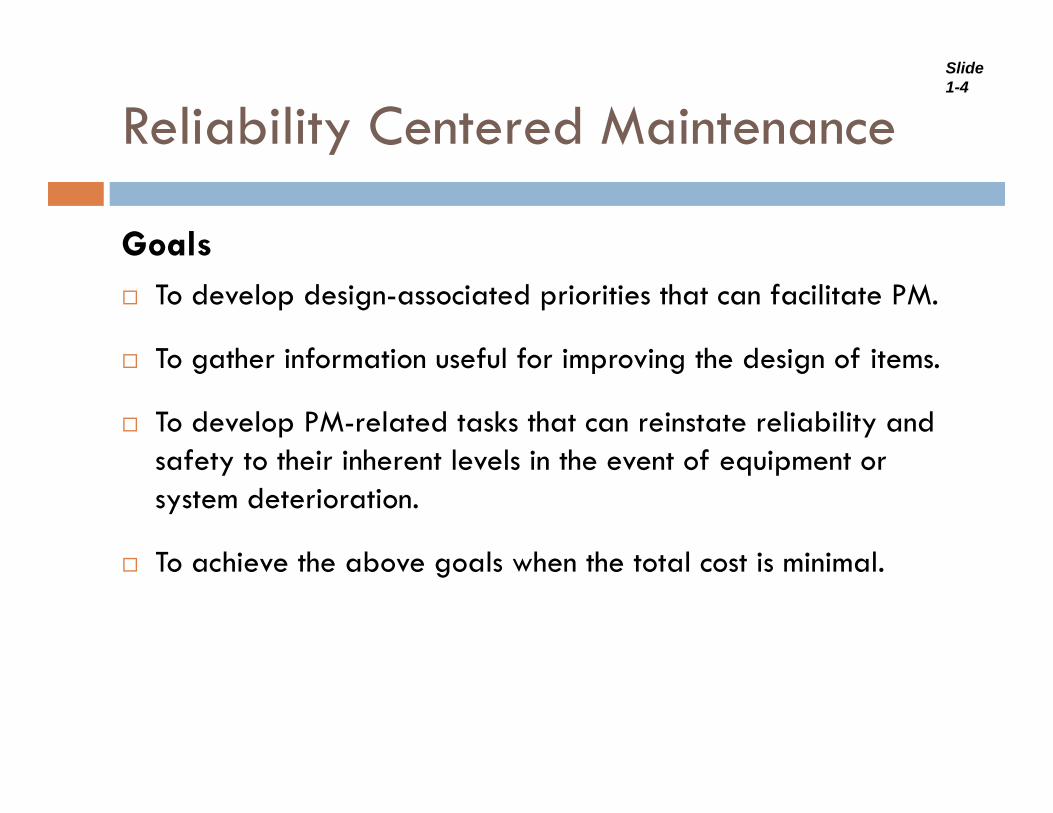
Goals
y
GoalsTo develop design-associated priorities that can facilitate PM.
To gather information useful for improving the design of itemsTo gather information useful for improving the design of items.
To develop PM-related tasks that can reinstate reliability and safety to their inherent levels in the event of equipment or safety to their inherent levels in the event of equipment or system deterioration.
To achieve the above goals when the total cost is minimalTo achieve the above goals when the total cost is minimal.
Slide 1-5
Reliability Centered Maintenance
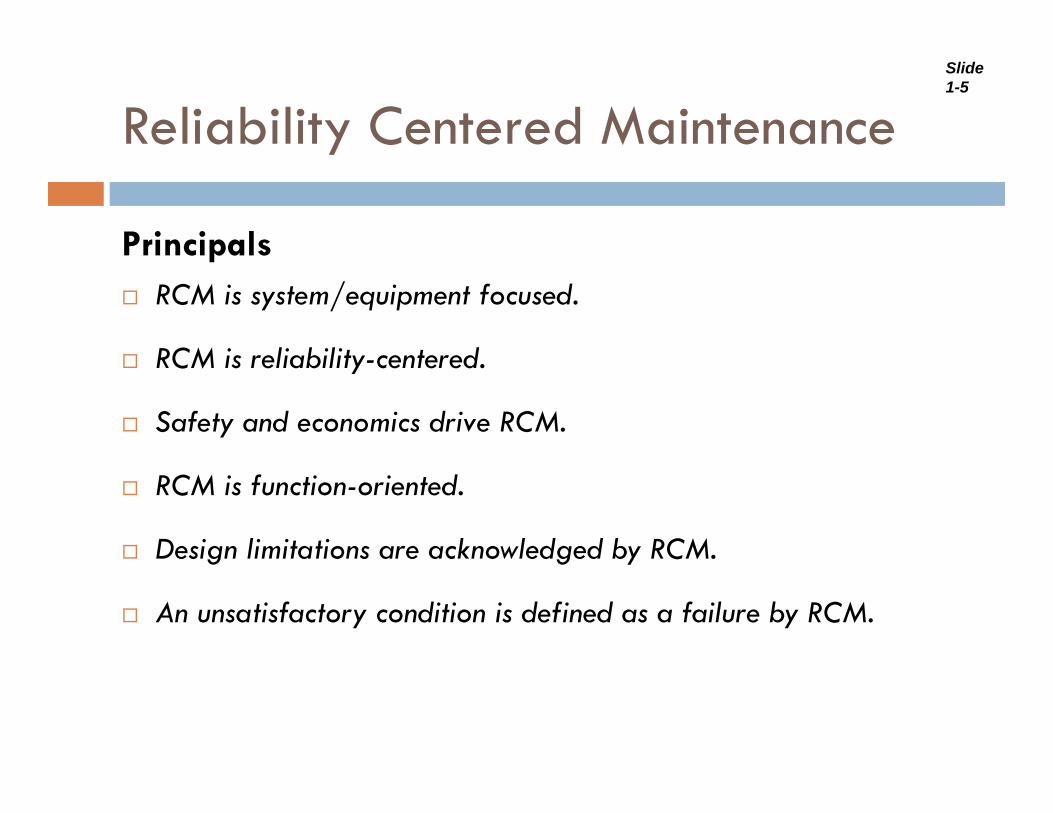
Principals
y
PrincipalsRCM is system/equipment focused.
RCM is reliability centeredRCM is reliability-centered.
Safety and economics drive RCM.
RCM is function-oriented.
Design limitations are acknowledged by RCM.g g y
An unsatisfactory condition is defined as a failure by RCM.
Slide 1-6
Reliability Centered Maintenance
Questions
y
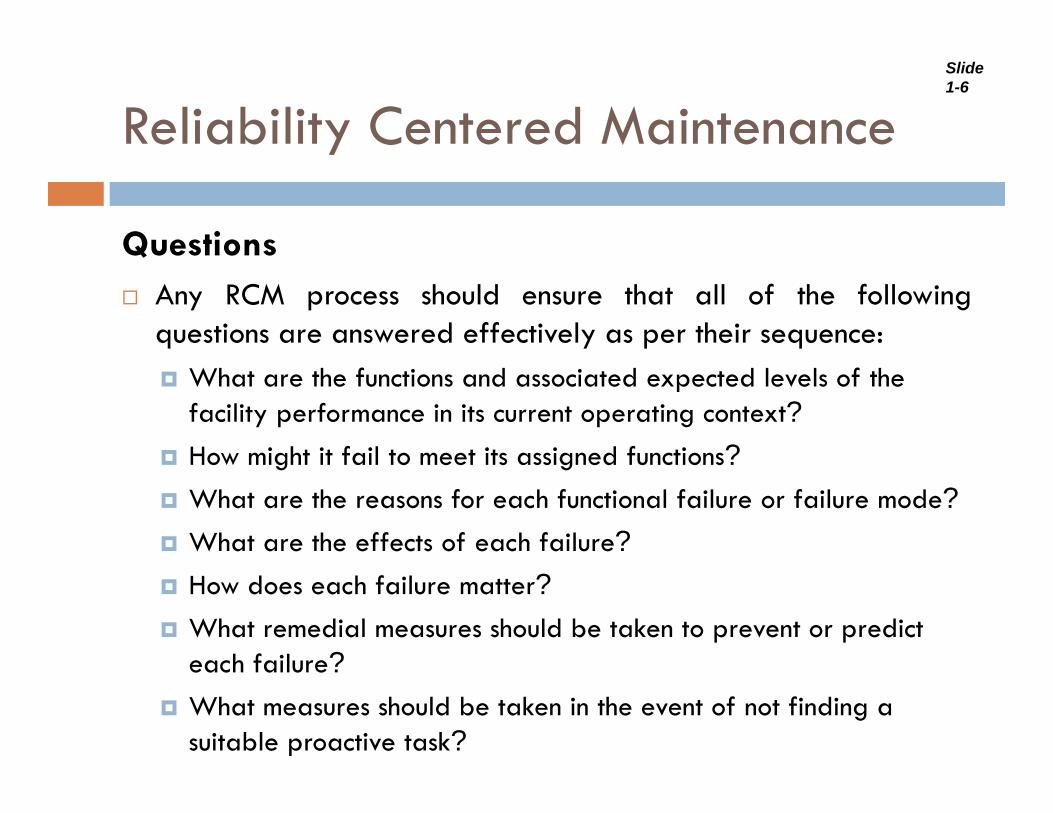
QuestionsAny RCM process should ensure that all of the followingquestions are answered effectively as per their sequence:
What are the functions and associated expected levels of the facility performance in its current operating context?How might it fail to meet its assigned functions?How might it fail to meet its assigned functions?What are the reasons for each functional failure or failure mode?What are the effects of each failure?How does each failure matter?What remedial measures should be taken to prevent or predict each failure?each failure?What measures should be taken in the event of not finding a suitable proactive task?
Slide 1-7
Reliability Centered Maintenance
Steps
y
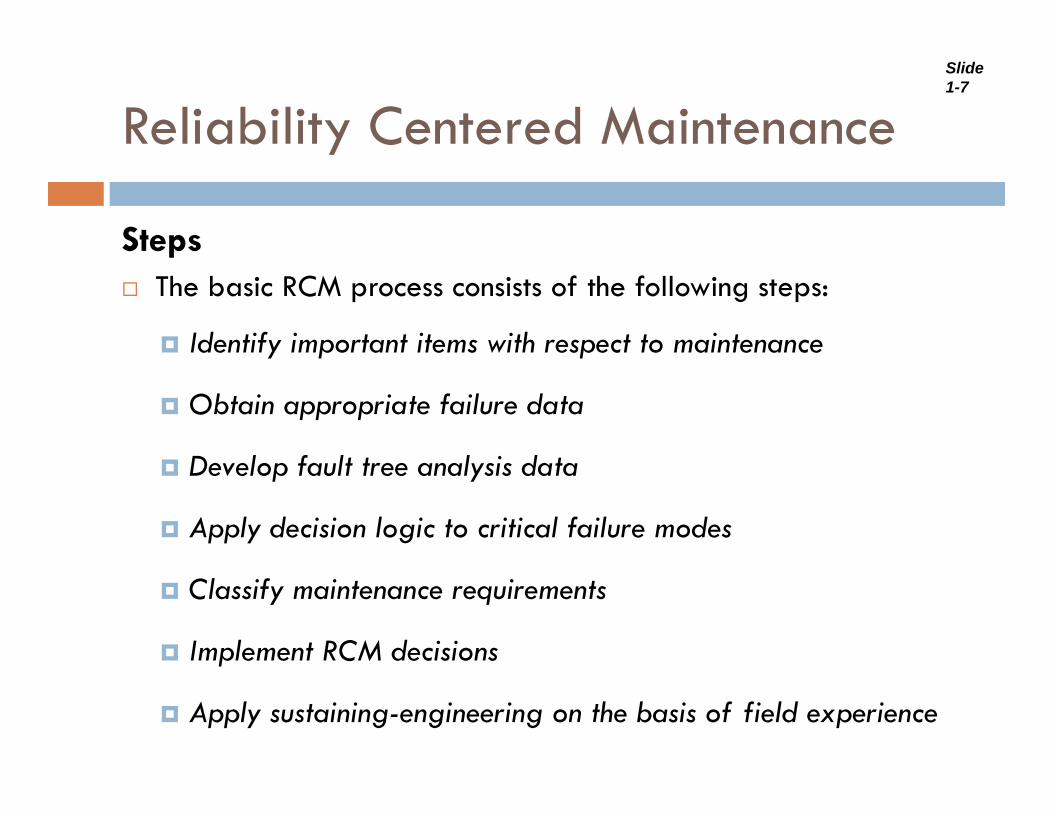
pThe basic RCM process consists of the following steps:
Identify important items with respect to maintenancey p p
Obtain appropriate failure data
D l f lt t l i d tDevelop fault tree analysis data
Apply decision logic to critical failure modes
Classify maintenance requirements
Implement RCM decisionsp
Apply sustaining-engineering on the basis of field experience
Slide 1-8
Reliability Centered Maintenance
Operation Types
y
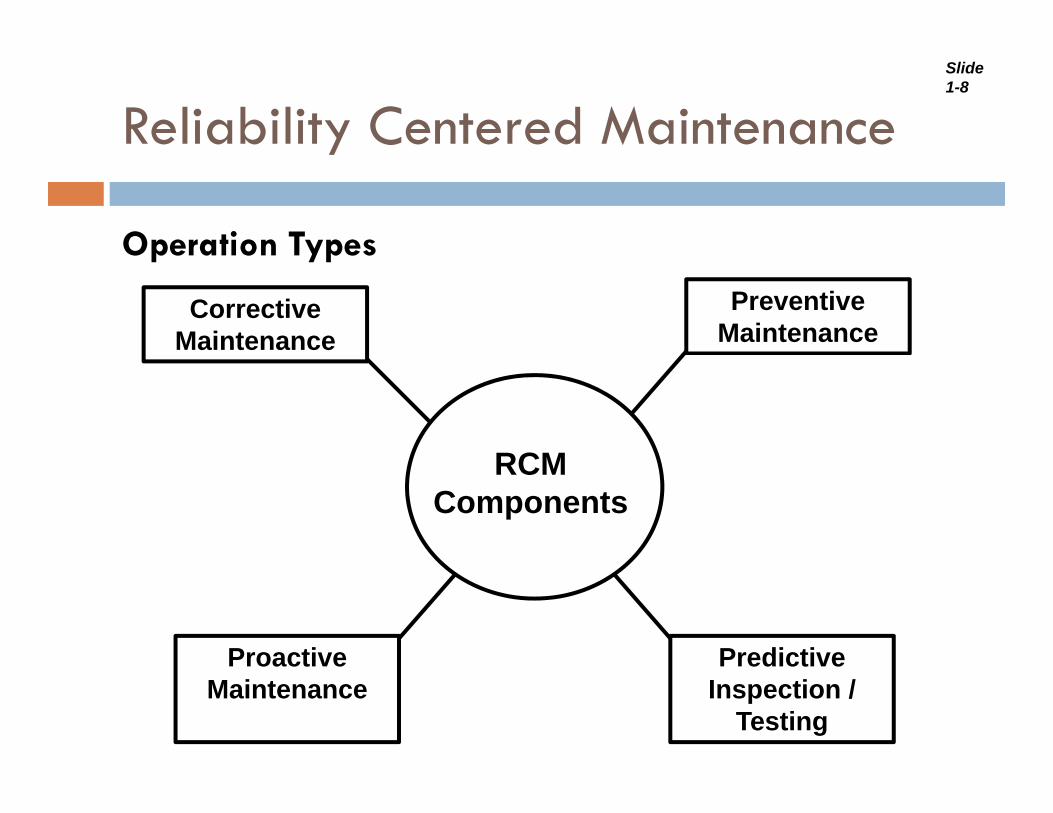
Operation Types
Corrective Maintenance
Preventive Maintenance
RCMRCM Components
PredictiveProactive Predictive Inspection /
Testing
Proactive Maintenance
Slide 1-9
Reliability Centered Maintenance
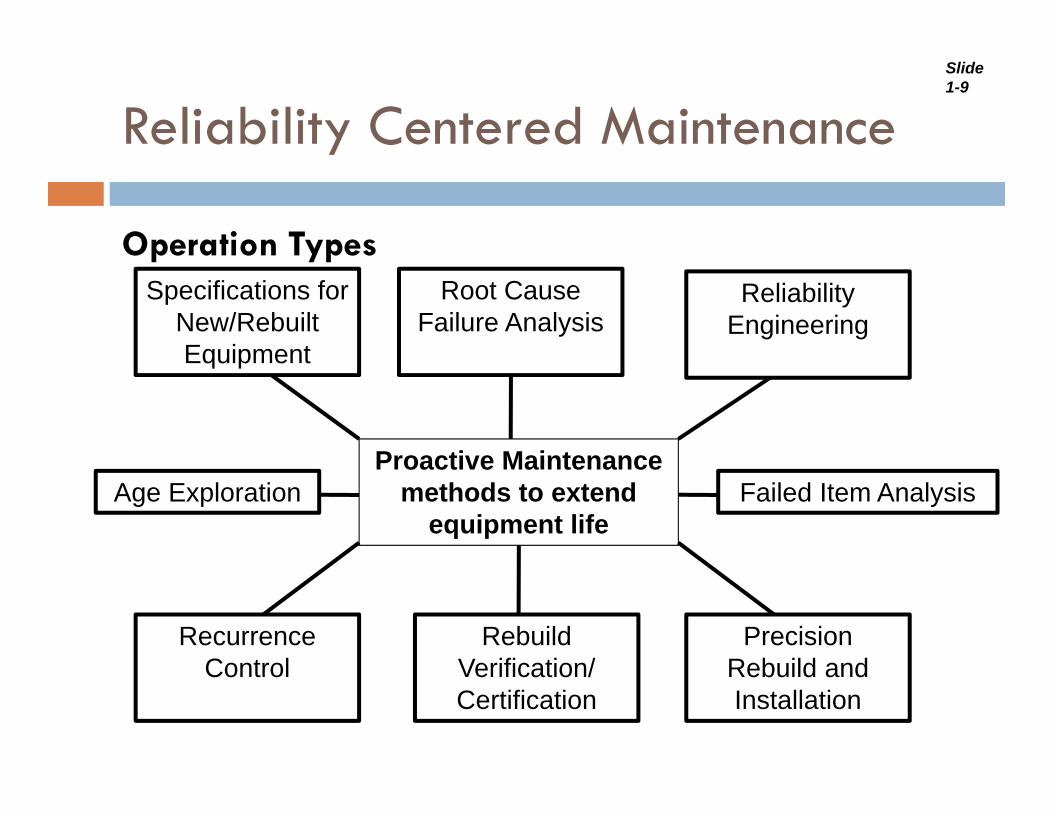
Operation Types
y
Operation TypesSpecifications for
New/Rebuilt Equipment
Root Cause Failure Analysis
Reliability Engineering
Equipment
Proactive MaintenanceProactive Maintenance methods to extend
equipment lifeFailed Item AnalysisAge Exploration
Rebuild Verification/
Recurrence Control
Precision Reb ild andVerification/
CertificationControl Rebuild and
Installation
Slide 1-10
Reliability Centered Maintenance
Failure Mode and Effect Analysis
y
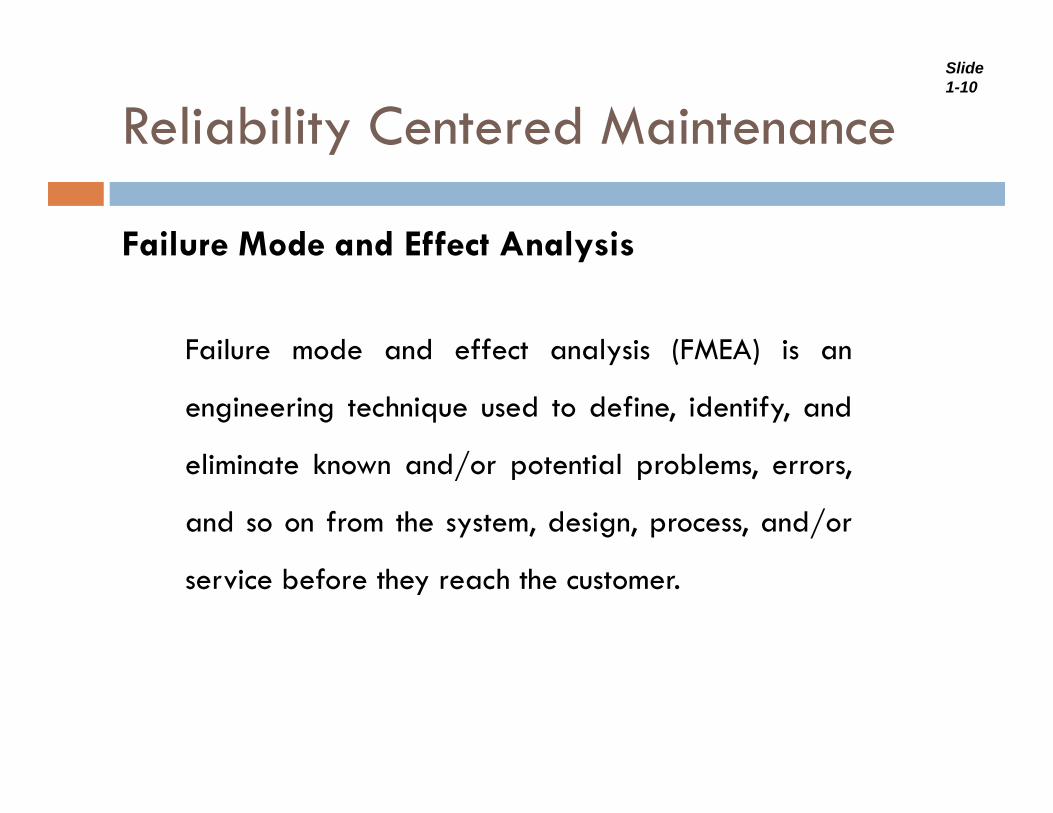
Failure Mode and Effect Analysis
Failure mode and effect analysis (FMEA) is anFailure mode and effect analysis (FMEA) is an
engineering technique used to define, identify, and
li i t k d/ t ti l bleliminate known and/or potential problems, errors,
and so on from the system, design, process, and/or
service before they reach the customer.
Slide 1-11
Reliability Centered Maintenance
Failure Mode and Effect Analysis
y
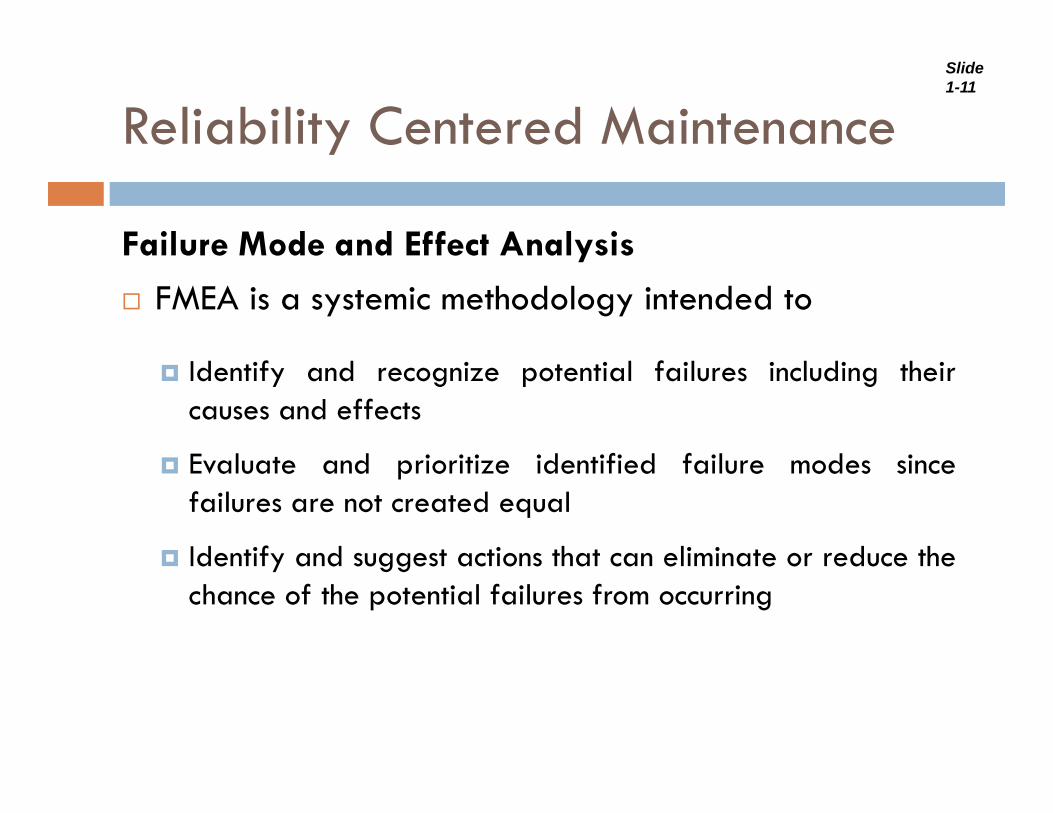
Failure Mode and Effect Analysis
FMEA is a systemic methodology intended to
Identify and recognize potential failures including theircauses and effects
E l t d i iti id tifi d f il d iEvaluate and prioritize identified failure modes sincefailures are not created equal
Identify and suggest actions that can eliminate or reduce theIdentify and suggest actions that can eliminate or reduce thechance of the potential failures from occurring
Slide 1-12
Reliability Centered Maintenance
Failure Mode and Effect Analysis
y
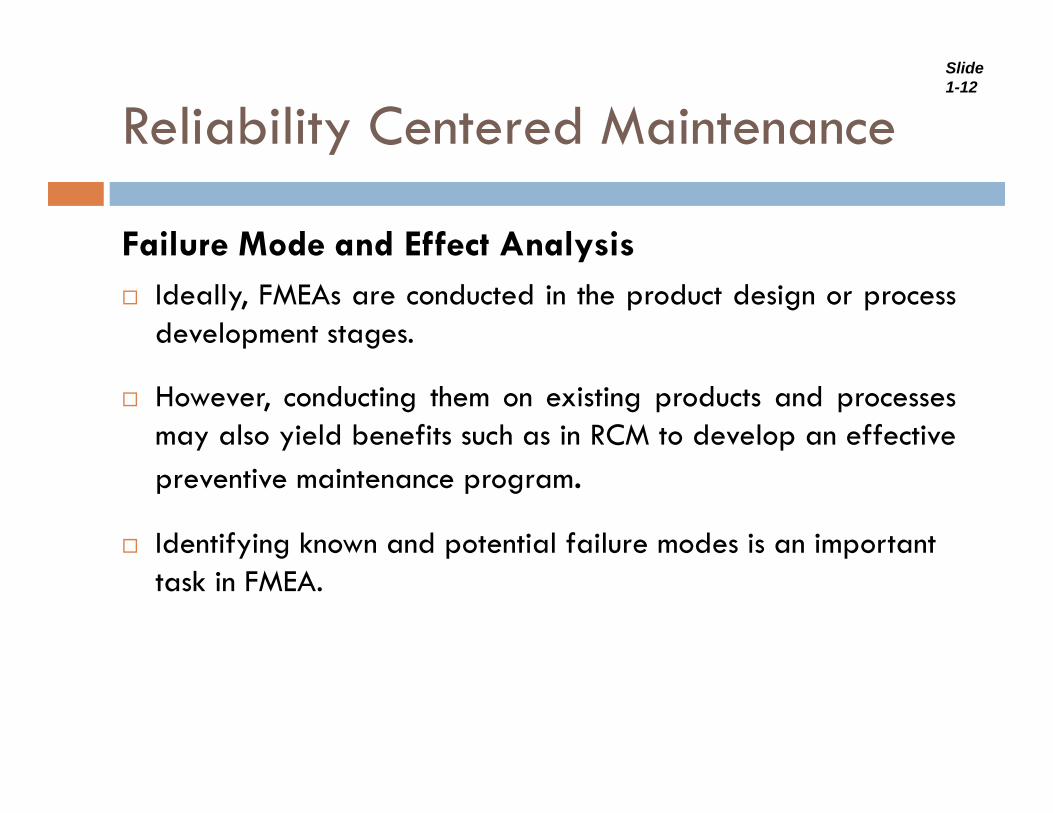
Failure Mode and Effect AnalysisIdeally, FMEAs are conducted in the product design or processdevelopment stages.
However, conducting them on existing products and processesmay also yield benefits such as in RCM to develop an effectivepreventive maintenance program.
Identifying known and potential failure modes is an important task in FMEA.
Slide 1-13
Reliability Centered Maintenance
Failure Mode and Effect Analysis
y
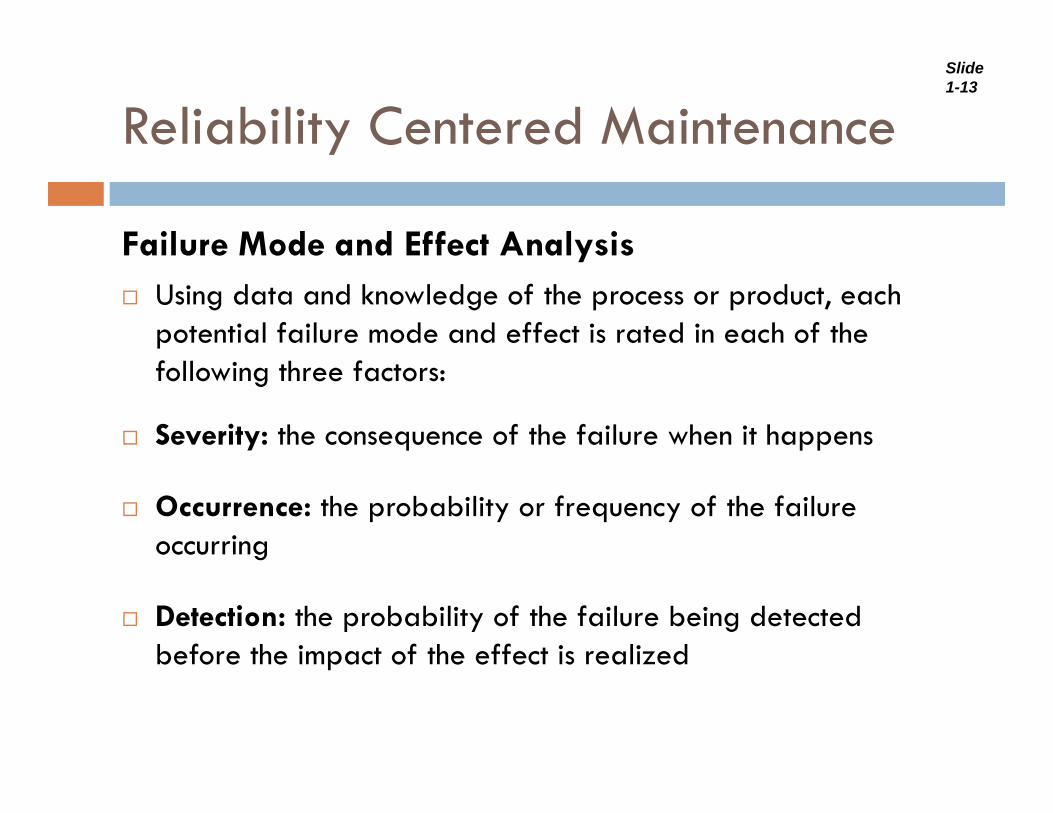
Failure Mode and Effect AnalysisUsing data and knowledge of the process or product, each potential failure mode and effect is rated in each of the following three factors:
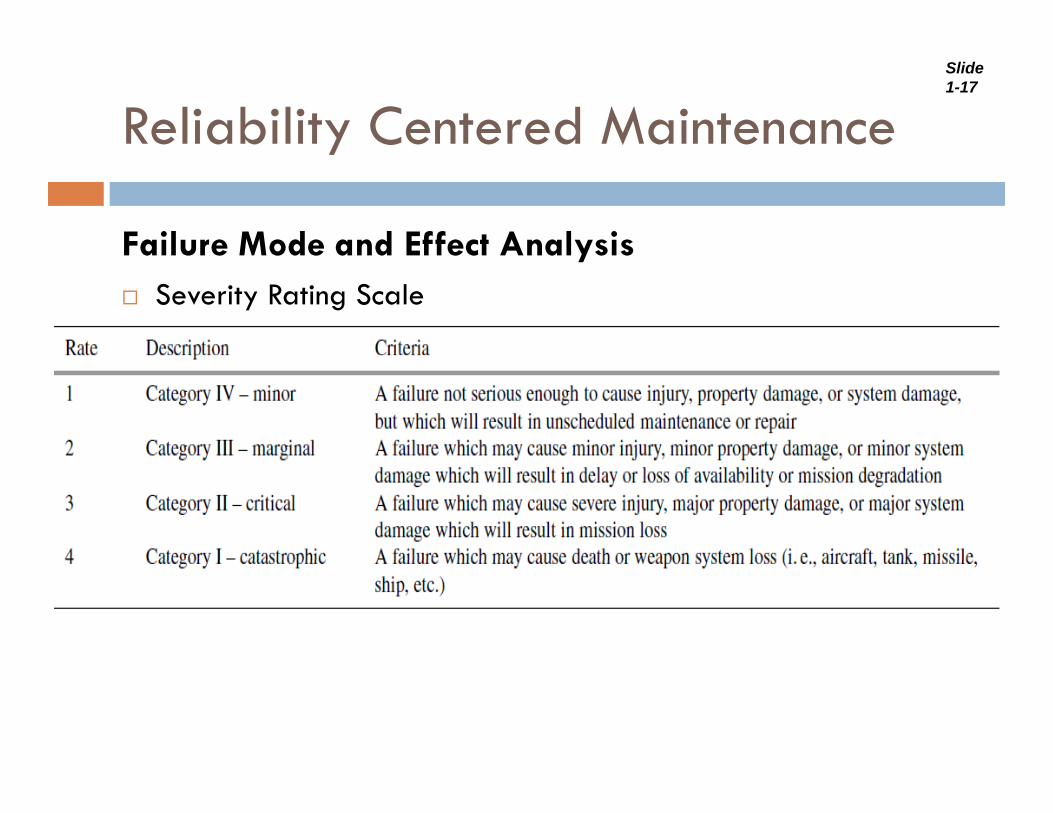
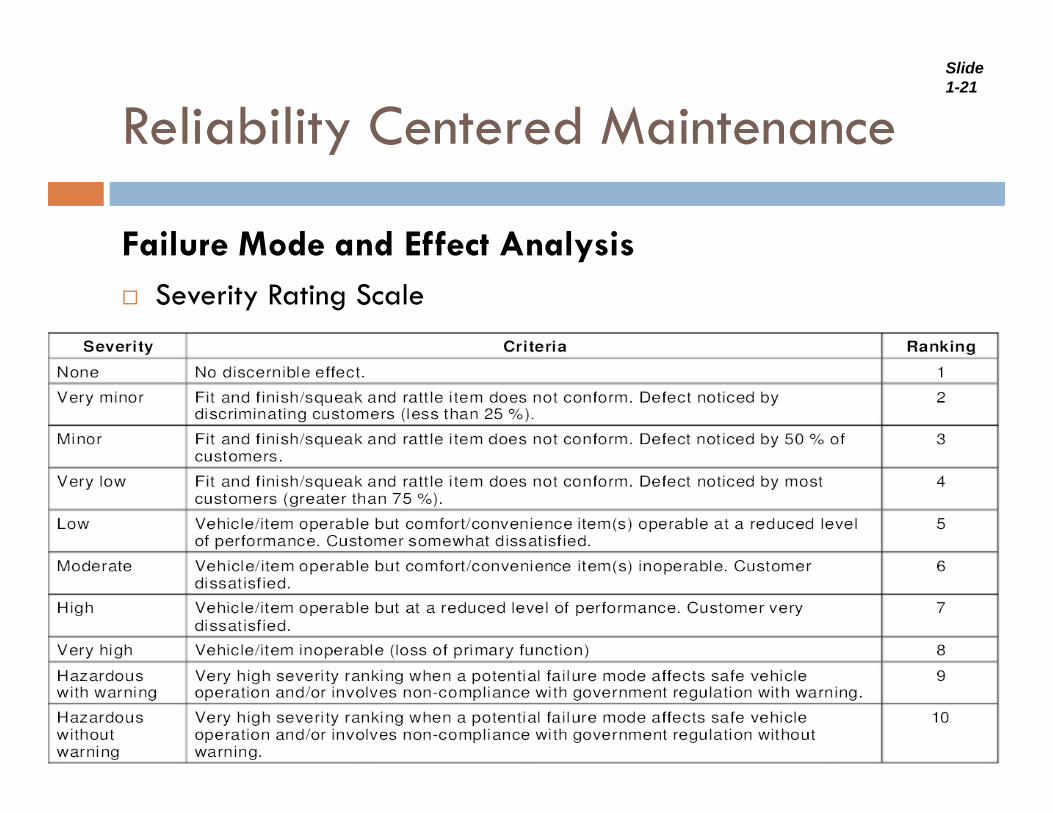
Severity: the consequence of the failure when it happens
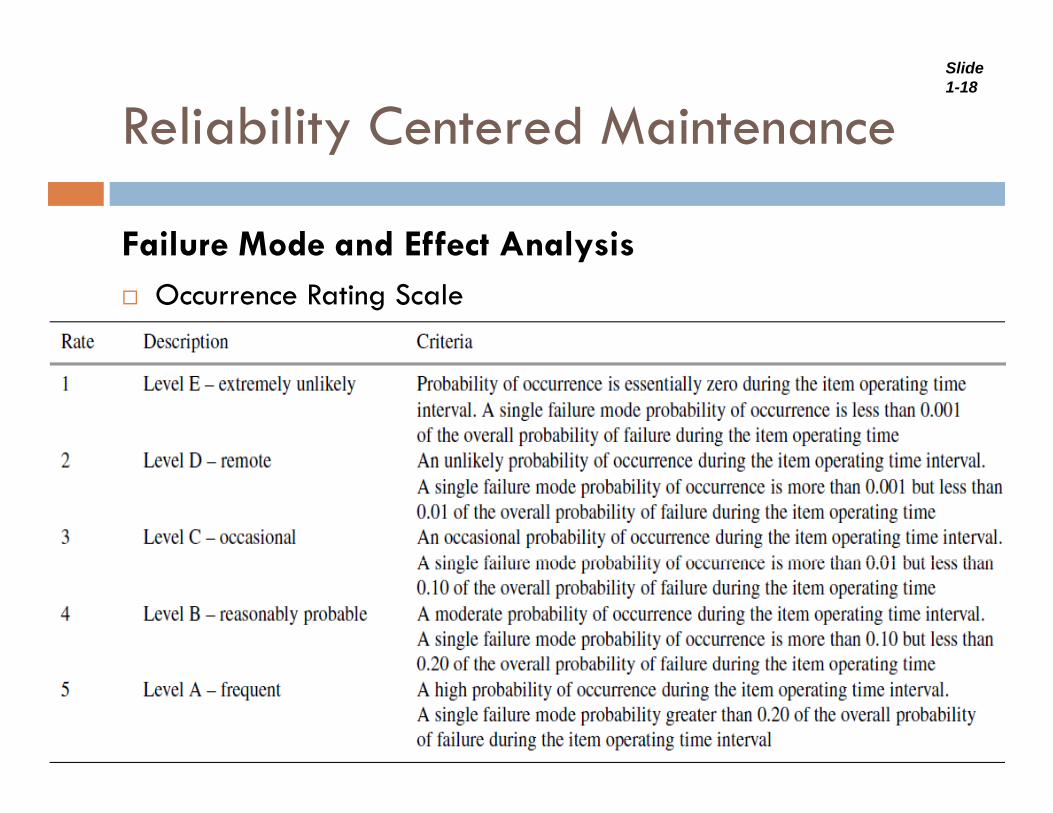
Occurrence: the probability or frequency of the failure occurring
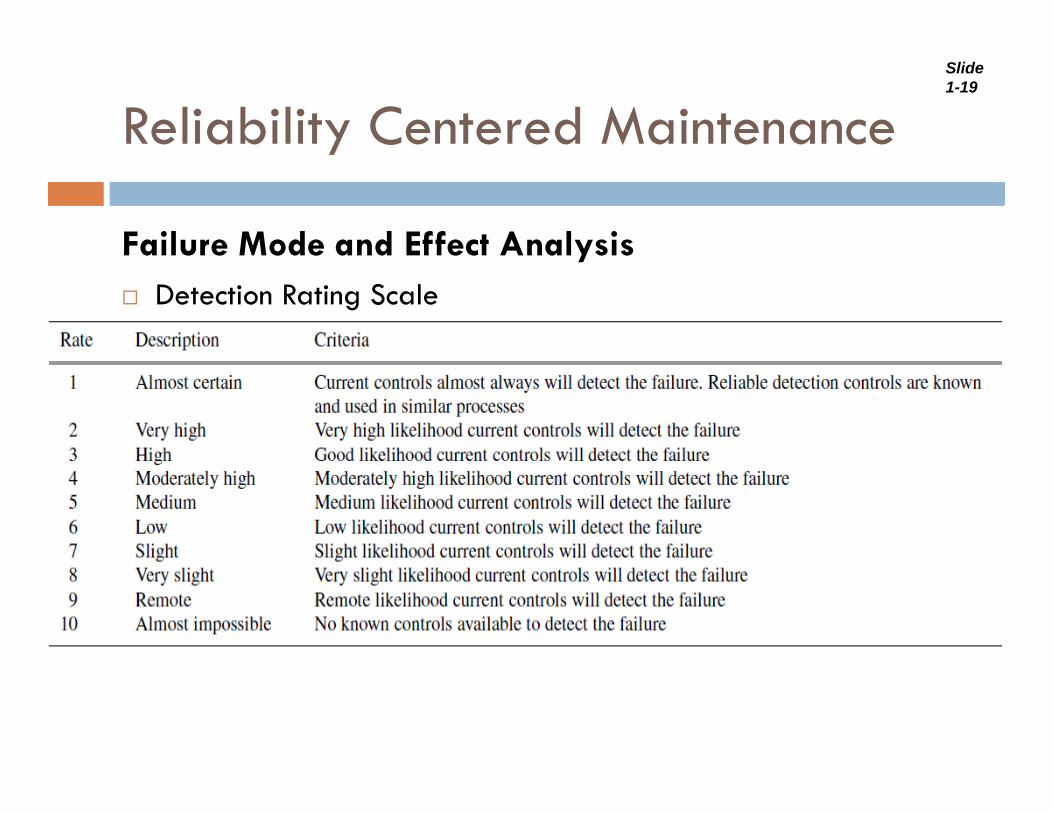
Detection: the probability of the failure being detected before the impact of the effect is realizedbefore the impact of the effect is realized
Slide 1-14
Reliability Centered Maintenance
Failure Mode and Effect Analysis
y
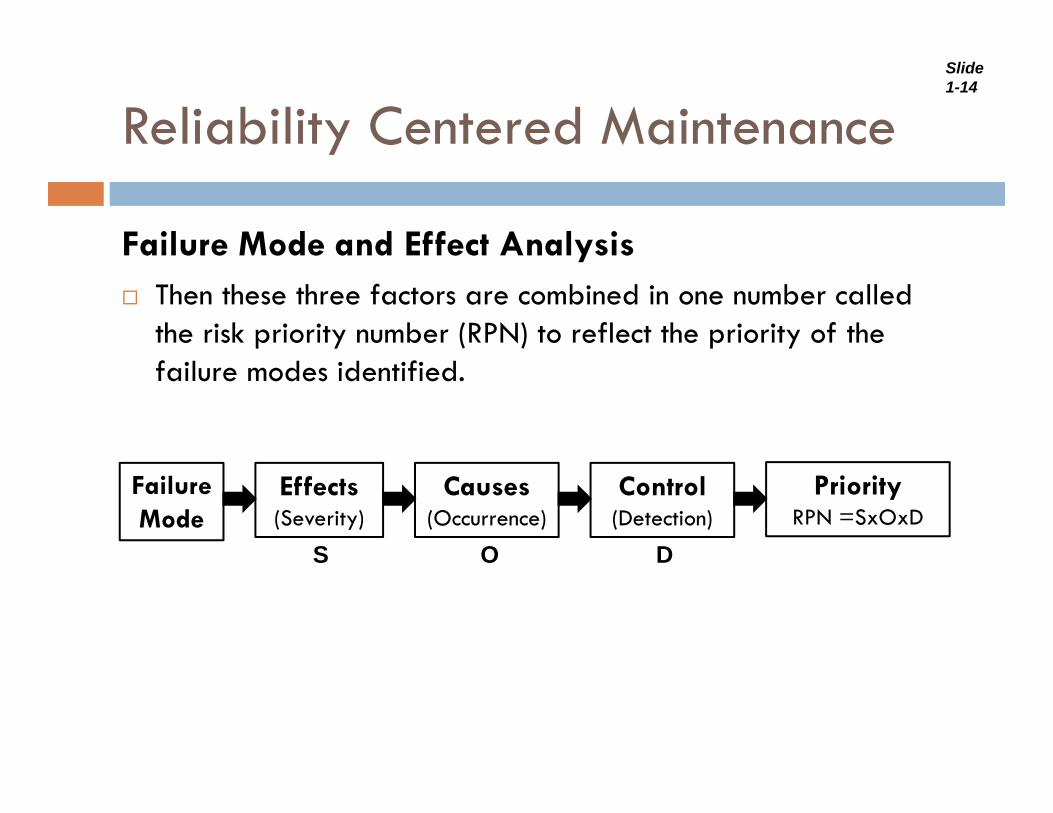
Failure Mode and Effect AnalysisThen these three factors are combined in one number called the risk priority number (RPN) to reflect the priority of the failure modes identified.
Failure Mode
Effects(Severity)
Causes(Occurrence)
Control(Detection)
Priority RPN =SxOxD
S O DS O D
Slide 1-15
Reliability Centered Maintenance
Failure Mode and Effect Analysis
y
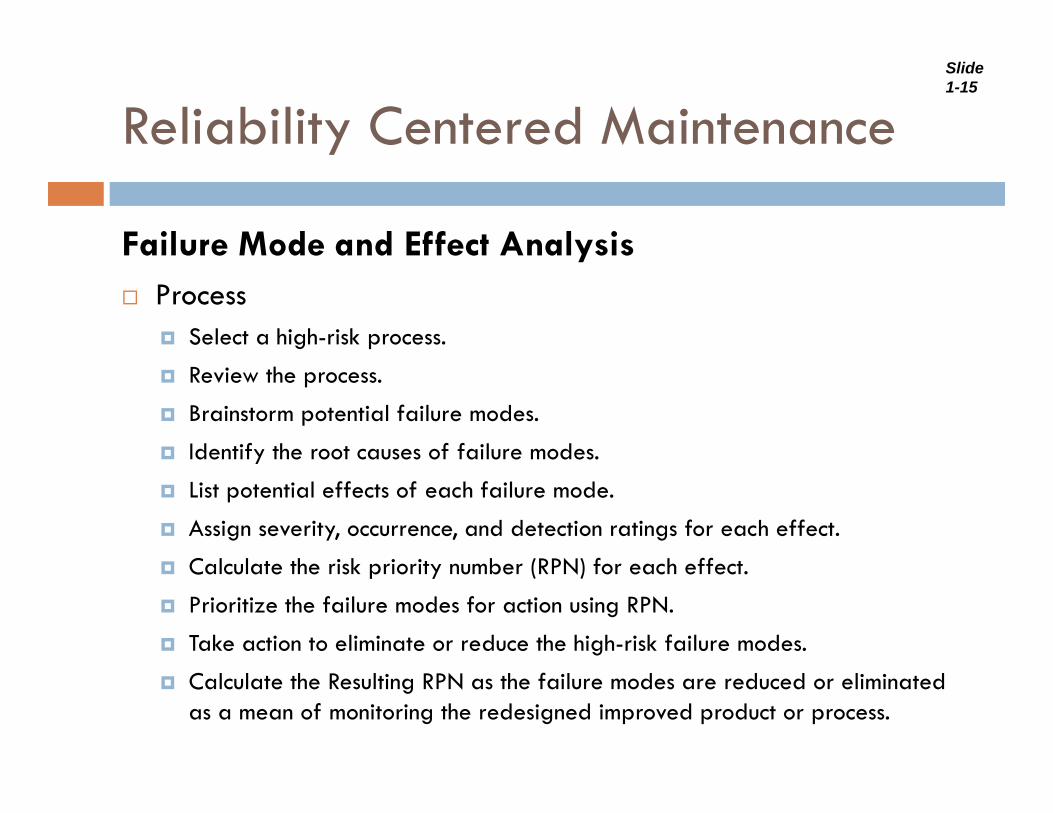
Failure Mode and Effect AnalysisProcess
Select a high-risk process.
Review the process.
Brainstorm potential failure modes.
Identify the root causes of failure modes.Identify the root causes of failure modes.
List potential effects of each failure mode.
Assign severity, occurrence, and detection ratings for each effect.
C l l h i k i i b (RPN) f h ffCalculate the risk priority number (RPN) for each effect.
Prioritize the failure modes for action using RPN.
Take action to eliminate or reduce the high-risk failure modes.
Calculate the Resulting RPN as the failure modes are reduced or eliminated as a mean of monitoring the redesigned improved product or process.
Slide 1-16
Reliability Centered Maintenance
Failure Mode and Effect Analysis
y
Failure Mode and Effect AnalysisStandards
MIL-STD-1629A (1984)BS 5760 (1991)BS EN 60812 (IEC 60812) 2006
Slide 1-17
Reliability Centered Maintenance
Failure Mode and Effect Analysis
y
Failure Mode and Effect AnalysisSeverity Rating Scale
Slide 1-18
Reliability Centered Maintenance
Failure Mode and Effect Analysis
y
Failure Mode and Effect AnalysisOccurrence Rating Scale
Slide 1-19
Reliability Centered Maintenance
Failure Mode and Effect Analysis
y
Failure Mode and Effect AnalysisDetection Rating Scale

Slide 1-20
Reliability Centered Maintenance
Failure Mode and Effect Analysis
y
Failure Mode and Effect AnalysisDetection Rating Scale
Slide 1-21
Reliability Centered Maintenance
Failure Mode and Effect Analysis
y
Failure Mode and Effect AnalysisSeverity Rating Scale
Slide 1-22
Reliability Centered Maintenance
Failure Mode and Effect Analysis
y
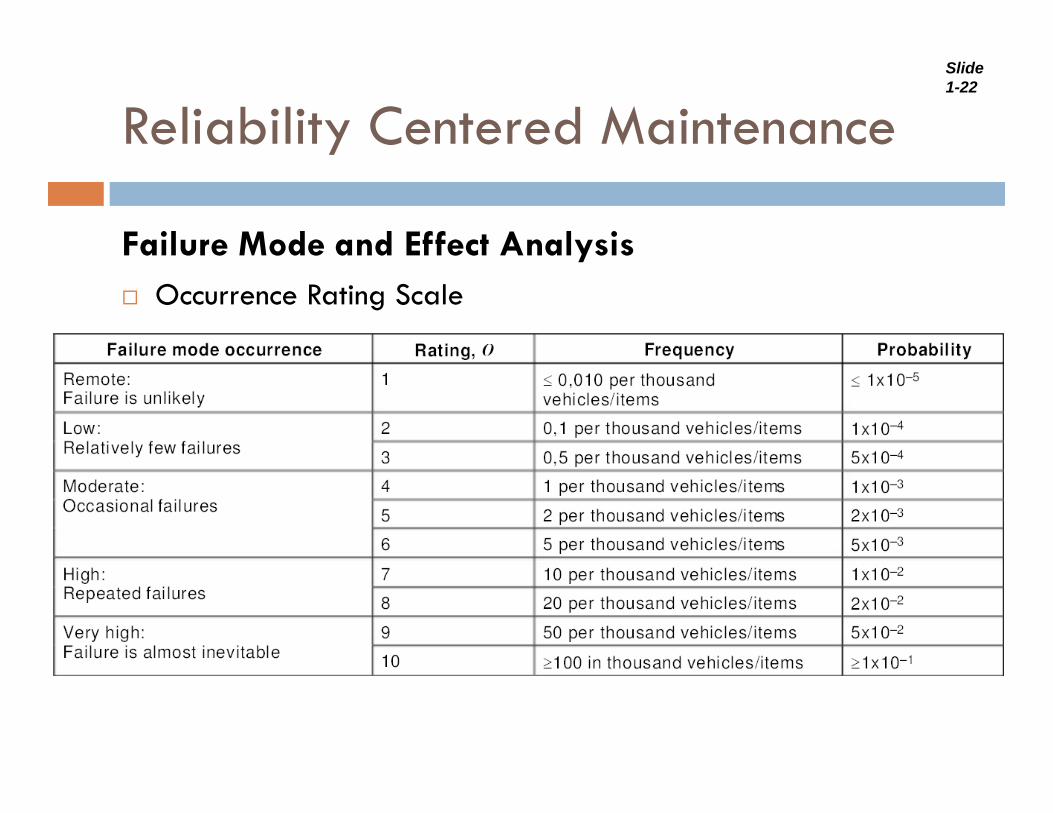
Failure Mode and Effect AnalysisOccurrence Rating Scale
Slide 1-23
Reliability Centered Maintenance
Failure Mode and Effect Analysis
y
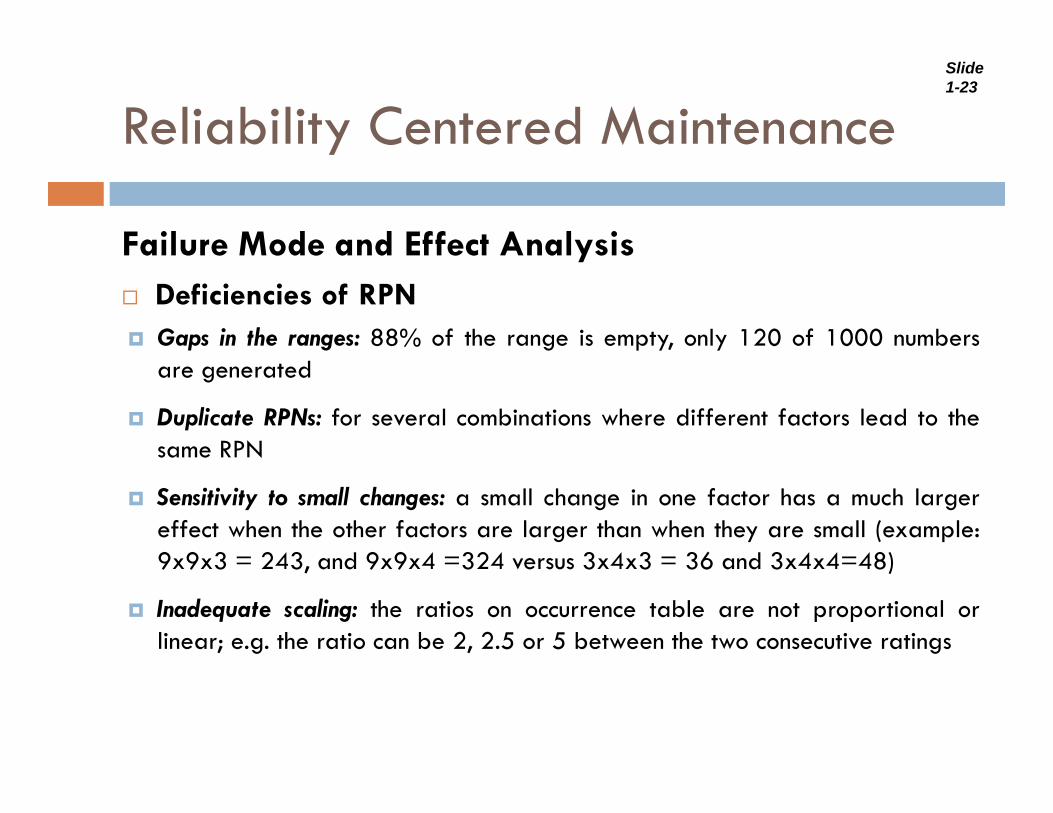
Failure Mode and Effect AnalysisDeficiencies of RPNGaps in the ranges: 88% of the range is empty, only 120 of 1000 numbersare generated
Duplicate RPNs: for several combinations where different factors lead to thesame RPNN
Sensitivity to small changes: a small change in one factor has a much largereffect when the other factors are larger than when they are small (example:9x9x3 = 243 and 9x9x4 =324 versus 3x4x3 = 36 and 3x4x4=48)9x9x3 = 243, and 9x9x4 =324 versus 3x4x3 = 36 and 3x4x4=48)
Inadequate scaling: the ratios on occurrence table are not proportional orlinear; e.g. the ratio can be 2, 2.5 or 5 between the two consecutive ratings

Slide 1-24
Reliability Centered Maintenance
Failure Mode and Effect Analysis
y
Failure Mode and Effect AnalysisDeficiencies of RPNInadequate scale of RPN.
The differences in RPN number might appear negligible while in fact significant.
An example would be: the values: S = 6, O = 4, D = 2, would produce an RPN = 48,while S = 6, O = 5, and D = 2 would produce RPN = 60.
The second RPN is not twice the first number, while in fact O = 5 is twice the probabilityof occurrence with O = 4.
Therefore the RPN numbers should not be compared linearly.
Slide 1-25
Reliability Centered Maintenance
Measurement Indicators
y
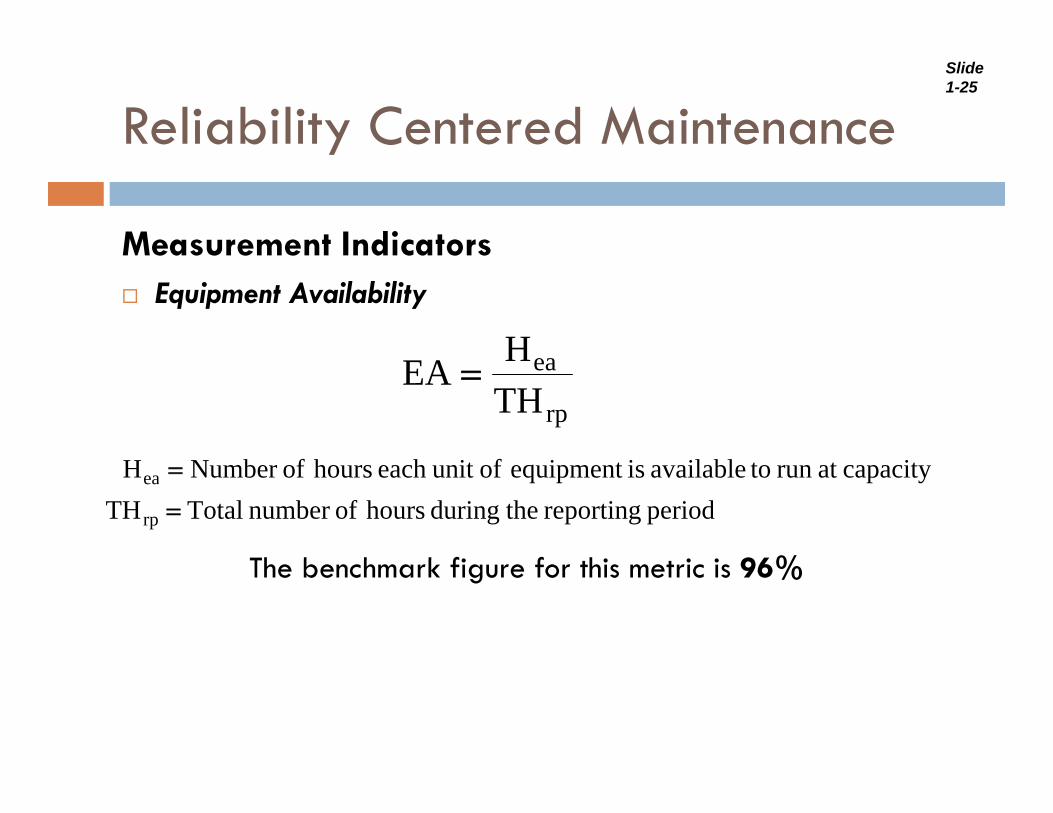
Measurement IndicatorsEquipment Availability
H
rp
eaTHHEA =
capacityat run toavailable isequipment ofunit each hours ofNumber Hea =
period reporting theduring hours ofnumber Total THrp =
Th b h k fi f hi i i 96%The benchmark figure for this metric is 96%
Slide 1-26
Reliability Centered Maintenance
Measurement Indicators
y
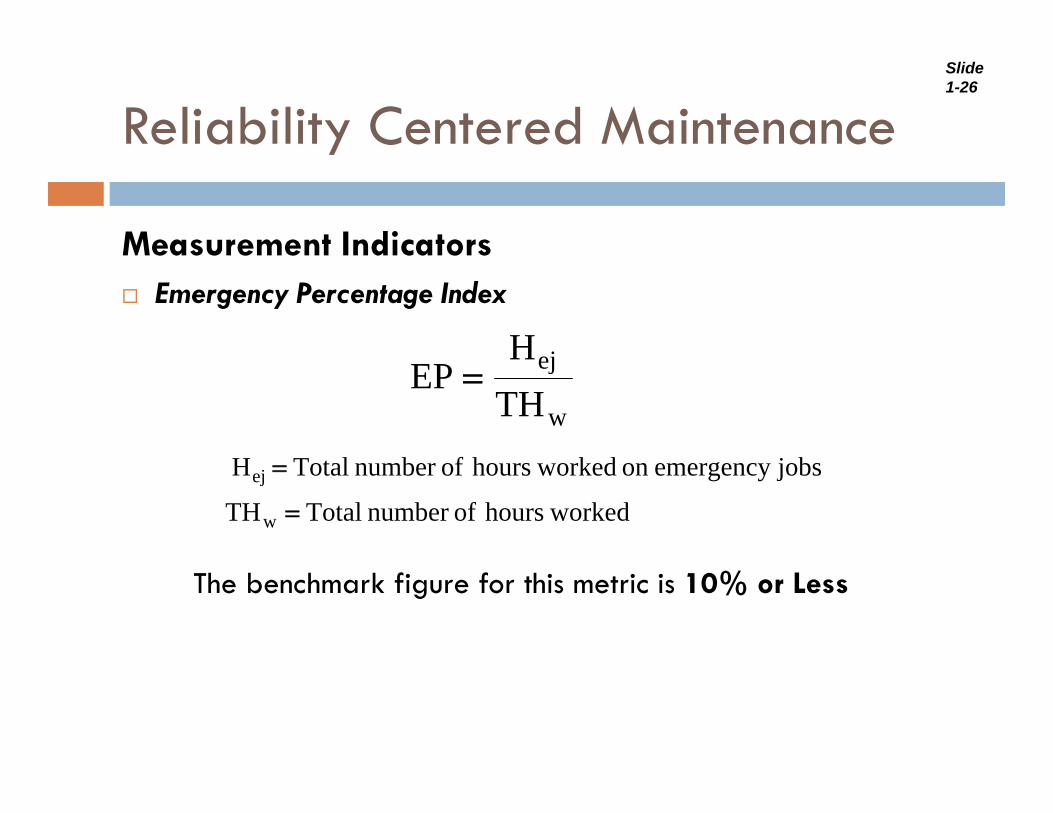
Measurement IndicatorsEmergency Percentage Index
jH
w
ej
THH
EP =
j bk dhfbT lH jobsemergency on workedhoursofnumber Total Hej =
workedhours ofnumber Total THw =
The benchmark figure for this metric is 10% or Less
Slide 1-27
Reliability Centered Maintenance
Measurement Indicators
y
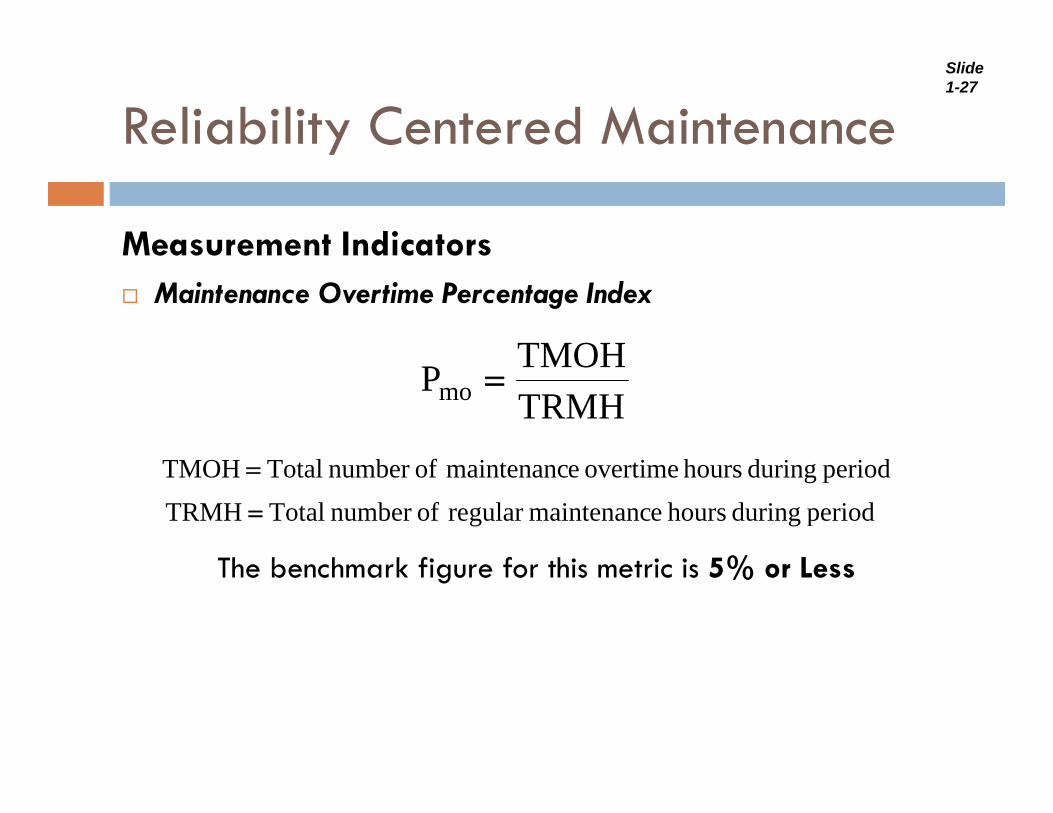
Measurement IndicatorsMaintenance Overtime Percentage Index
TMOHTRMHTMOHPmo =
periodduringhoursovertimeemaintenancofnumber Total TMOH =
periodduringhoursemaintenancregular ofnumber Total TRMH =
Th b h k fi f hi i i 5% LThe benchmark figure for this metric is 5% or Less
Slide 1-28
Reliability Centered Maintenance
Measurement Indicators
y
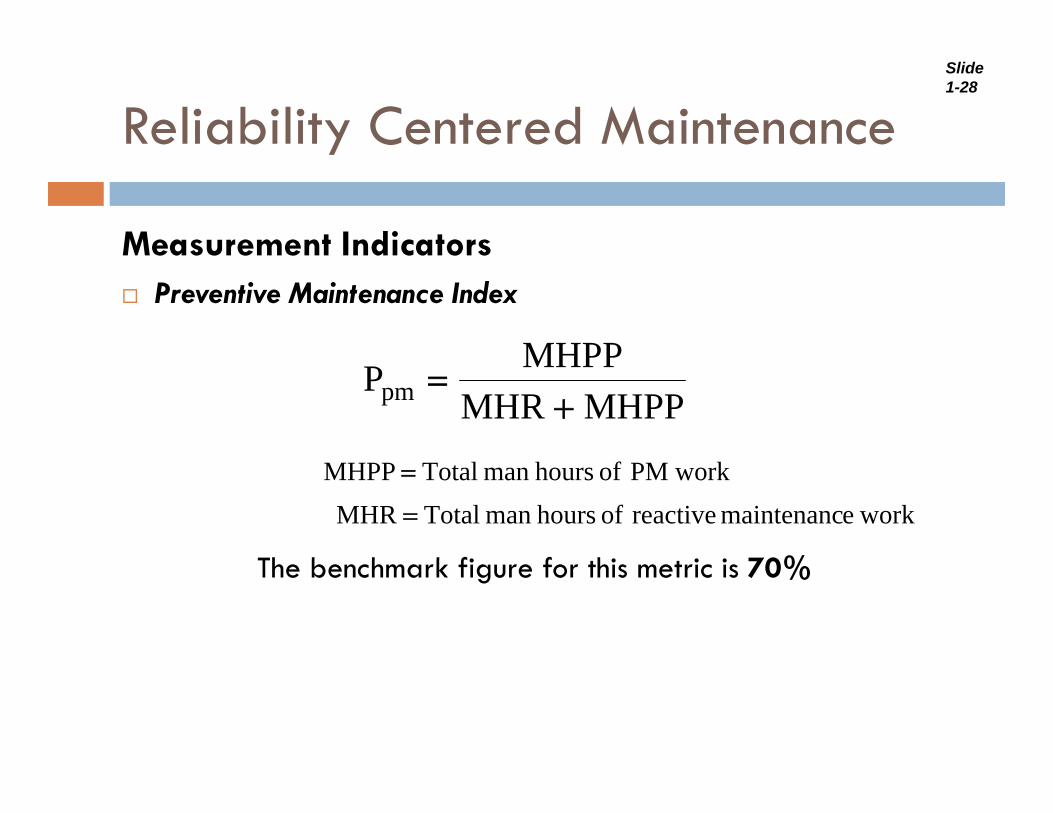
Measurement IndicatorsPreventive Maintenance Index
MHPPMHPPMHR
MHPPPpm +=
workPM ofhoursman TotalMHPP =
workemaintenancreactive ofhoursman TotalMHR =
Th b h k fi f hi i i 70%The benchmark figure for this metric is 70%

Slide 1-29
Reliability Centered Maintenance
Measurement Indicators
y
Measurement IndicatorsReactive Maintenance Index
MHRMHPPMHR
MHRPrm +=
workPM ofhoursman TotalMHPP =
workemaintenancreactive ofhoursman TotalMHR =
Th b h k fi f hi i i 30%The benchmark figure for this metric is 30%
Slide 1-30
Reliability Centered Maintenance
Benefits
y
Benefits
Improvement in product quality
Improvement in useful life of products
Improvement in safety/environmental protection
Development of a maintenance database
I t i i t t ff tiImprovement in maintenance cost effectiveness
Higher plant availability and reliability
Slide 1-31
Reliability Centered Maintenance
Problems
y
Problems
The application was superfluous or hurried
Computers were used to drive the process
Only one individual was assigned to apply RCM
Only maintenance department on its own applied RCM
M f t / d k d t l RCM th iManufacturers/vendors were asked to apply RCM on their own.