lecture 2: descriptive statistics, normalizations & testing€¦ · • shannon index for a...
TRANSCRIPT
7/6/16
1
Lecture2:Descriptivestatistics,normalizations&testing
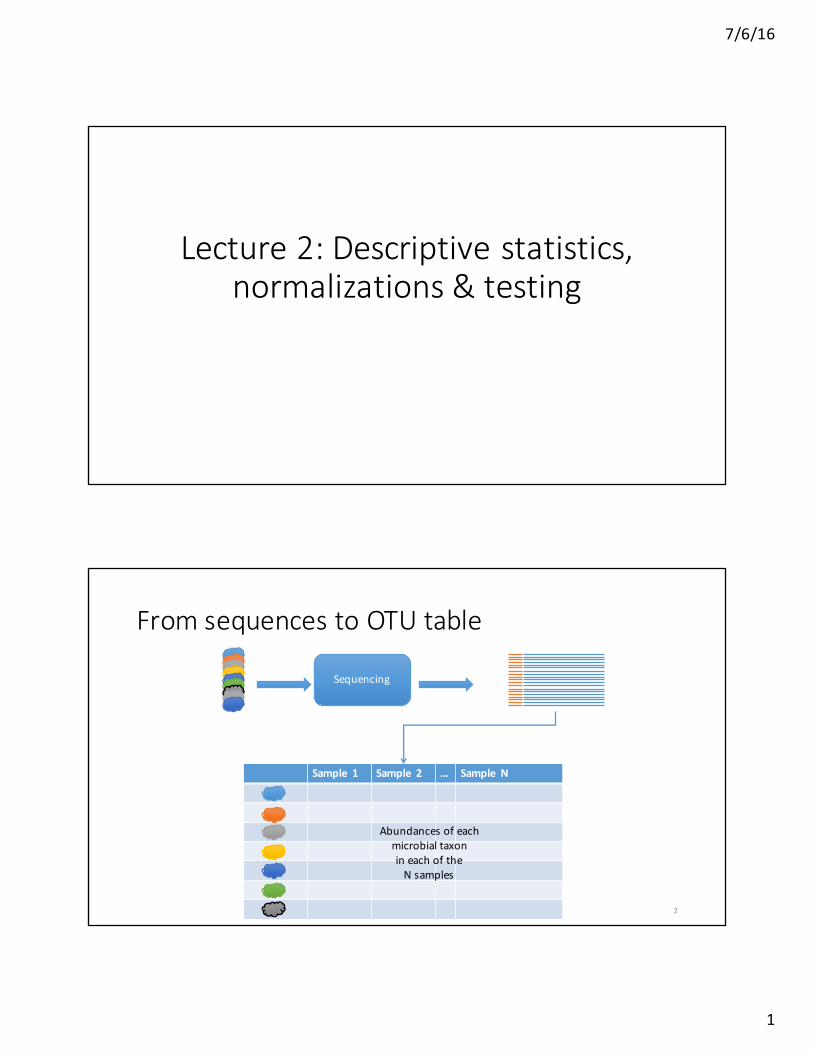
FromsequencestoOTUtable
Sequencing
Sample1 Sample2 ... Sample N
AbundancesofeachmicrobialtaxonineachoftheNsamples
2

7/6/16
2
NormalizingOTUtablesforsequencingeffortRawCounts Proportions
Sample1 ... Sample N
n11 n1N
n21 n2N
n31 n3N
n41 n4N
n51 n5N
n61 n6N
n71 n7N
n.1 n.1
pij =nij/n.j
Sample1 ... Sample N
p11 p1N
p21 p2N
p31 p3N
p41 p4N
p51 p5N
p61 p6N
p71 p7N
1 1
3
Othernormalizations
• Normalizedby1component, nd• 𝑦"# = log ()*
(+*= log 𝑛"# − log 𝑛.#
• ndj >0foralld• AssumingthetrueabundanceofOTUdisthesameacrossallsamples
• Normalizedbygeometricmean(centered)• 𝑦"# = log( ()*
1 (2*,…,(5*= log 𝑛"# − log(𝑔 𝑛7#,… , 𝑛8# )
• 𝑔 𝑛7#, … ,𝑛8# = ∏ 𝑛"#8";7
7/8
• Note:log[0]->-∞;sooftenweadd‘pseudo-counts’ beforethesetransformations.
4

7/6/16
3
Othernormalizations
• DESeq2:normalizesbyestimatingthenegativebinomial distributionforeachtaxonineachsample;• MetagenomeSeq:uses samplequantiles tonormalizeaccountingforundersampling.
5
Describingmicrobiomic community isaliketotakingademographiccensus
• Howmanyprofessions arerepresented?• Howwellrepresentedarethedifferentprofessions?• Aresomeprofessions morepopular?
Town1 ... TownN
carpenter p11 p1N
banker p21 p2N
student p31 p3N
teacher p41 p4N
doctor p51 p5N
police p61 p6N
chef p71 p7N
1 1
6

7/6/16
4
Alphadiversitydefinition(s)
• Alphadiversitydescribes thediversityofasinglecommunity(specimen).• Instatisticalterms,itisascalarstatisticcomputedforasingleobservation (column) thatrepresentsthediversityofthatobservation.• Therearemanystatisticsthatcandescribediverstiy:e.g.taxonomicalrichness, evenness, dominance, etc.
7
Speciesrichness
• Suppose weobserveacommunity thatcancontainuptok‘species’.• Therelativeproportions ofthespecies areP={p1,…,pk}.• Richness iscomputedas
R=1(p1)+1(p2)+…+1(pk) ,where1(.)isanindicatorfunction, i.e.1(x)=1ifpi≠0,and0otherwise.
• HigherRmeansgreaterdiversity• Verydependentupondepthofsampling andsensitive topresenceofrarespecies
8

7/6/16
5
Rarefactioncurves
• Note:rareficationasameansfornormalizationisfromstatisticalstandpointabadidea.Don’tthrowawayinformation!• Rarefactioncurvesarenotthesame!• Usefultoassesssensitivityofsamplesizetoobservedalpha-diversityestimates.• Idea:
• LetN1,…,NK beasetofnumbersNi <Ni+1;• Letn’ij(k) beabundanceoftaxoni insamplejsubsampledtoNk totalcountspersample;
• Estimateaverage alphadiversityforeachNk overaseveralrepeatedsubsamplings;• Plottheaveragealphadiversityasafunctionofsamplesize.
9
Rarefactions
Cho, I . ,Meth,BA.,Nondorf, L.,Li,K.,Alekseyenko, AV.,Blaser, MJ."Subtherapeutic antibiotics alterthemurinecolonicmicrobiomeandearlylifeadiposity", Nature488,621 -- 626(30August2012).
10

7/6/16
6
Chao1index
• Species richnessindexisoftentoosensitive todepthofsampling,• Chao1indexovercomesthisproblembyapplying acorrection
• 𝑅> = 𝑆@AB + (D2E
FDE),
• Where𝑓7 isthenumberoftaxawithasingleobservation (singletons),𝑓F isthenumber oftaxawithexactlytwoobservations.• Ifasamplecontainsalotofsingletontaxa,thenthereisagreaterchancethatthissampleisundersampled.
Shannon index• Supposeweobserveacommunitythatcancontainup tok‘species’.• TherelativeproportionsofthespeciesareP={p1,…,pk}.• Shannon indexisrelatedtothenotionofinformationcontentfrominformationtheory. Itroughly representstheamountofinformationthatisavailableforthedistributionofP.• Whenpi =pj,foralli and j,thenwehaveno informationaboutwhichspeciesarandomdrawwillresultin.Astheinequalitybecomesmorepronounced, wegainmoreinformationaboutthepossibleoutcomeofthedraw.TheShannonindexcapturesthisproperty ofthedistribution.• Shannon indexiscomputedas
Sk=– p1log2p1 – p2log2p2 – …– pklog2pkNoteaspiè0,log2piè –∞,wethereforedefine pilog2pi=0.
• HigherSk meanshigherdiversity
12

7/6/16
7
FromShannon toEvenness
• Shannon indexforacommunity ofkspecies hasamaximumatlog2k• Wecanmakedifferentcommunitiesmorecomparableifwenormalizebythemaximum• Evennessindexiscomputedas
Ek=Sk/log2k• Ek=1meanstotalevenness
13
Simpsonindex
• Supposeweobserveacommunitythatcancontainuptok‘species’.• TherelativeproportionsofthespeciesareP={p1,…,pk}.• Simpsonindexistheprobabilityofresamplingthesame specieontwoconsecutivedrawswithreplacement.• Supposeonthefirstdrawwepickedspecie i,thiseventhasprobabilitypi,hencetheprobabilityofdrawingthatspecies twiceispi*pi.• Simpsonindexisthuscomputedas
D=1– (p12 +p2
2 +…+pk2)
• D=0meansnodiversity(1species iscompletelydominant)• D=1meanscompletediversity
14

7/6/16
8
PhylogeneticDiversity(Faith’sD)
• Faith(Biological Conservation1992,61,1-10)considered theproblem ofselectingspeciesforconservation soastopreservediversity.
• FaithdefinesPD(phylogeneticdiversity)asthesumofallthebranch lengths.PDisanalogoustototalinformation inthetree.
• Themarginalcontribution ofatipxisthenmini,j(Dx,i +Dx,j – Di,j).Highervaluesuggestagreaterimpactonconservation.
15
Conservation evaluation and phylogenetic diversity 5
The rationale for this formula is clarified using the example of Fig. 2. The pairwise D values are represented by the arrows along the branches in the diagram. These branches show how the for- mula above provides a value equal to the gain in PD with the addition of x to the subset. Note that the value for the gain in phylogenetic diversity is based on complementarity (cf. Vane-Wright et al., 1991), in that the contribution of a given taxon to PD will depend on which other taxa are already in the subset. In practice, the taxon providing the largest G value might be added to the subset of reserved taxa.
The same formula can be used to build up a subset of a required number of taxa from scratch. Here, the building process would begin by taking those two taxa that have maximum distance, D, apart and then consecutively adding the taxon to the subset that maximises G. Such calculations would be useful, for example, in incrementally building up a set of reserve areas such that phylo- genetic diversity is maximised at each step.
Finally, the formula can be used to evaluate the PD of a pre-defined subset of taxa. This option will be useful, for example, when a given reserve system is to be evaluated relative to the overall phylogenetic diversity for a number of different groups of taxa. An estimate of the cladogram for each group of related taxa is used to calculate the PD value corresponding to the particular subset of these taxa found in the reserve system. These PD values for individual cladograms would then be summed together for an overall phylogenetic di- versity score that could be compared to that for
J
Fig. 2. A hypothetical cladogram of four taxa. Taxa i and j are already in the reserve system, and the potential contri- bution of taxon x is to evaluated. The thickened arrows cor- respond to the path-length distances Dx.i, Dx.j, and Di. j. The amount that x adds to the total length of the minimum span- ning path (the phyiogenetic diversity, PD) can be calculated by adding together the lengths between x and i and x and j, subtracting the length between i and j, and dividing the result
by 2. For further information see text.
other nominated reserve systems. One requirement of this multiple-cladogram approach is that the branch lengths for the different cladograms be measured in comparable units. I will return to this strategy in the Discussion section below.
It is noteworthy that informative distance val- ues can be prepared even in the absence of exact estimates of branch lengths, as when the exact length of a terminal branch (corresponding to the number of uniquely derived features for the termi- nal taxon) is regarded as poorly known. Length estimates for terminal branches will often be poorly estimated in cladistic analyses because fea- tures unique to a single taxon are usually deleted from the analysis. In such cases, the branches may be assigned unit length, or lengths according to an assumption of equal rates of feature derivation in all lines of descent.
When all branch length information is unknown or ignored, the lengths can all be assigned unit length so that phylogenetic diversity then depends only on the branching pattern on the cladogram, The PD value, for any subset of taxa of size N, reduces to a simple function of the number of different nodes on the cladogram that lie along the corresponding minimum spanning path:
PD = (N - 1) + no. of internal nodes (branching points) on the minimum spanning path.
Thus, the best subset of N taxa is the one that spans the greatest number of nodes on the clado- gram, and the best addition to a subset is the taxon adding the greatest number of nodes to the minimum spanning path.
These different methods of branch length as- signment are illustrated for the bumble bee (Api- dae) example discussed below.
A computer program 'PHYLOREP' , written in Fortran 77, for PD calculations is available from the author.
EXAMPLES
Bumble bees of the sibiricus group
Vane-Wright et al. (1991) used a cladogram for species of bumble bees in the sibiricus group of Bombus Latreille (Williams, in press) to demon- strate their method of taxic diversity weighting. This sample was also used in the discussion by May (1990) to highlight differences between equal weighting to all species and taxic diversity weight-
Numbersequivalentdiversity
• Oftenitisconvenient totalkaboutalphadiversityintermsofequivalentunits:• Howmanyequallyabundanttaxawillittaketogetthesamediversityasweseeinagivencommunity?
• Forrichness thereisnodifferenceinstatistic• ForShannon, rememberthatlog2kisthemaximumwhichisattainedwhenallspecies areequallyrepresented.Hencethediversityinequivalentunitsis2Sk
• ForSimpson theequivalentunitsmeasureofdiversityis1/(1-D)
16

7/6/16
9
Hypothesistesting
MotivatingexampleControl(water)
Tetracycline
Vancomycin
Tetracycline+Vancomycin
Microbiotafromfecalandcecalcontents
Weaning Sacrifice
HormonelevelsFatlevelsBonemineral content
Sub-TherapeuticAntibioticTreatment (STAT)
Cho,I.,Meth,BA.,Nondorf,L.,Li,K.,Alekseyenko,AV.,Blaser,MJ.“Subtherapeutic antibioticsalter thecolonicmicrobiome andearlylifeadiposityinmice”.Nature.2012Aug30;488(7413):621-6.
18
Penicillin

7/6/16
10
Questions• Arethereanyspecific taxa,whichareassociatedwithantibiotictreatment?• Bypresence/absencepatterns• Byrelativeabundance
• Istherecorrelationbetweenabundanceofanytaxaandmetabolicphenotypes (hormone levels, fat,bone)?
STAT
Microbiome
?
Microbiome
Phenotypes
?
19
Hypotheses
• Areprecise statementsthatareamenabletobeingprovenfalseusingdata.• Nullhypothesis:aproposition thatcorresponds todefaultposition.(“Nothingspecialishappening”)• Alternativehypothesis:aproposition thatdescribes anondefaultoutcome(“Somethinginteresting isgoingon”)• TheinferenceisobtainedbyrejectingtheNullhypothesis. Nullhypothesis canneverbeconfirmedbythedata,nordoesithavetobe!
20

7/6/16
11
Exampleofhypotheses• Generalquestion:Areanytaxa associatedwithantibiotictreatment?
• Univariatehypothesisquestion:Istaxon Tassociatedwithantibiotictreatment?
• Nullhypothesis:abundanceoftaxon Tfollowthesamedistributionintreatedandcontrolgroups.
• Alternativehypothesis1:abundanceoftaxon Tfollowdistributionofdifferentforminthetwogroups.
• Alternativehypothesis2:abundanceoftaxonTfollowthesameformofdistributionbutwithdifferentmean/medianbetweengroups.
• Alternativehypothesis3:abundanceoftaxonTfollowthesameformofdistributionbutwithdifferentvariancebetweengroups.
STAT Microbiome(manytaxa)
?
STAT TaxonT?
−4 −2 0 2 4 −4 −2 0 2 4
−4 −2 0 2 4 −4 −2 0 2 4
−4 −2 0 2 4 −4 −2 0 2 4
21
P-values• IftheNullHypothesiswas infacttrue astatistic, used toperformthetest,wouldfollowacertaindistribution:thenulldistribution.
• P-value isthe tailprobabilityunderthe nulldistribution.
−3 −2 −1 0 1 2 3
0.0
0.1
0.2
0.3
0.4
Two−tail p−value
statistic
density
−3 −2 −1 0 1 2 3
0.0
0.1
0.2
0.3
0.4
One−tail p−value
statistic
density
22

7/6/16
12
DistributionofOTUabundance data
• Justifiabledistributionassumptionsoftenallowforbetterstatistical tests.• PropertiesofOTUabundancedata:
• Correlated:Sumsto1,hencetoincreasesomething,somethingelsehastodecrease• Variableacrosssubjects
• CanpossiblybemodeledthroughcompoundDirichlet-Multinomialdistribution(wewilltalkaboutthisdistributionlaterinthecourse).Marginalunivariate (Beta-binomial)testshavetobederived.• Whendistributionspecifictestsarenotavailable,wehavetorelyonnon-parametric(distributionfree)tests,possiblyatthecostofdecreasingthepowerofthetests.
23
ChiSquaredtestfortaxon incidence• RawCounts
Sample1 ... Sample N
n11 n1N
n21 n2N
n31 n3N
n41 n4N
n51 n5N
n61 n6N
n71 n7N
n.1 n.1
• IncidencetableSample1 ... Sample N
111 11N
121 12N
131 13N
141 14N
151 15N
161 16N
171 17N
1ij = {1, if nij > 0
0, otherwise24

7/6/16
13
ChiSquaredtestfortaxon incidence• Wefocusonasingletaxon• Supposetheobservationsofthetaxoncomefromtwogroups(e.g.controlvs.STAT)• Question:Isthefrequencyofoccurrenceofthistaxonintwogroupsdifferent?• Nullhypothesis:thefrequencyisthesame.• SignificantChiSquaretest indicatesadifferenceintherateofoccurrenceofthetaxon.• InR:chisq.test
Tax Lab
1or0 Control
… …
1or0 STAT
Control STAT
Present n11 n21 n2.
Absent n12 n22 n1.
n.1 n.2 N
25
Mann-WhitneyUorWilcoxon rank-sumtwo-sampletest
• Assumptions:• Independentobservations• Observationscanbeorderedwithrespecttoeachother
• Nullhypothesis:Thedistributionintwosamplesisthesame.IfonerandomlydrawsoneobservationfromeachsampleX,Y;thenPr(X>Y)=Pr(Y>X)• Two-sidedalternativehypothesis:Pr(X>Y)≠Pr(Y>X)• Interpretation:forcontinuousobservations,significanttests indicatechangeinthemedian• Example:Istheabundanceofataxon differentbetweenSTATandControl?• InR:wilcox.test
26

7/6/16
14
Connectionwithpredictivity
• Mann-WhitneyU-statisticcalculation:• Converttheobservationstoranks• Computethesumofranksineachsample,R1 andR2
• U1 =R1 – n1(n1 +1)/2• U2 =R2 – n2(n2 +1)/2• U=min(U1,U2)
• OnecanshowthatUstatisticisequivalenttoAUC.AUC=U/(n1 n2)
• AUC,area underreceiveroperatorcharacteristic(ROC)curve,measureshowwellwecandistinguishonesamplefromanother.AUC=0.5meanspredictivitynobetterthanrandom,AUC=1.0perfectpredictivity.
Sample1 Sample2 Ranks1 Ranks20.135 2.680 8 1-0.907 1.078 18 2-0.801 0.080 16 90.452 0.493 6 5-0.523 0.010 15 110.075 -0.322 10 131.038 -0.370 3 14-1.140 0.633 19 4-2.308 -0.020 20 12-0.808 0.368 17 7
RankSums 132 78U 77 23Ustatistic 23AUC 0.77 0.23
27
Kruskal-Wallisone-wayanalysisofvariance(morethantwosamples/groups)
• Assumptions:• Independentobservations thatfollowdistributionwiththesameshapeandscale
• Observationscanbeorderedwithrespecttoeachother• Nullhypothesis: Thelocation(median) ofallthegroupsisthesame.• Alternativehypothesis: Locationforatleastonegroupisdifferentfromlocationofatleastoneothergroup• Example:IstheabundanceofataxondifferentinSTAT/controlover3sampledtimepoints?• InR:kruskal.test
28

7/6/16
15
Correlationcoefficients,rankcorrelations• Linearcorrelationcoefficient(Pearson)assumeslineardependencebetween twovariables• Rankcorrelationcoefficientmeasuretheextentofmonotonicitybetweentwovariables• Nullhypothesisforcorrelationtesting:correlationcoefficient isequalto0.
● ● ● ● ●
●
0.0 0.5 1.0 1.5 2.0 2.5
0e+
00
2e+
08
4e+
08
x
1/(
exp(−
x))
^8
●
●
●
●
●
●
0.0 0.5 1.0 1.5 2.0 2.5
1e+
00
1e+
04
1e+
08
x
1/(
exp(−
x))
^8 (
log−
scale
)
Pearsoncorrelationcoefficient:0.66(notsignificant,p=0.15)
Diaconis,P.(1988),GroupRepresentationsinProbabilityandStatistics,LectureNotes-MonographSeries,Hayward,CA:InstituteofMathematicalStatistics,ISBN0-940600-14-5 29
Rankcorrelationcoefficients
• Spearman’s ρ:RankcorrelationmeasuredefinedasthePearsoncorrelationofthetwovariablesafterconversiontoranks• Kendall’s τ:Rankcorrelationmeasurebasedoncountingconcordantpairs.[(x1,y1) and(x2,y2)areconcordantifx1>x2 wheny1>y2]• Example:Istherecorrelationbetweenanygiventwotaxa?Istherecorrelationbetweenagivenmetabolicvariableandagiventaxon?• InR:• cor.test(x, y, method=‘spearman’) • cor.test(x, y, method=‘kendall’)
30

7/6/16
16
Problemswithtestingmanyhypothesessimultaneously
• WehavemanyOTUs thatwewouldliketoapplythetestto.• Ifthetestisappliedatspecifiedsignificancelevel(probabilityoffalselyrejectingthenull,whenitistrue),wecannotguaranteethatcombinedresultisatthesignificanceleveloriginallyspecified.• Sincep-valuesaredistributeduniformlyifthenullhypothesisistrue,theexpectednumberofrejectionsbymerechancem*α• Howdowecontrol significanceformultipletests?
● ●● ●● ●● ●● ● ●● ●●● ●●● ●● ●● ● ●●● ● ●● ● ● ●● ●● ● ●● ● ● ●● ● ●●●● ●● ● ●● ● ●● ● ●● ●●●● ●● ●●●● ●● ●●● ●● ●●●● ●●●● ● ●●●● ●● ●● ● ●● ●● ●● ●
p
0.0 0.2 0.4 0.6 0.8 1.0
a=runif(100, 0, 1)plot(a, rep(1, length(a)),
axes=F, ylab=“”, xlab=“p”, pch=19)
axis(1)abline(v=0.05, col=“red”,
lty=“dotted”)
31
FWER:Family-wiseerrorrate#not-rejected
#rejected
Total
# truenullhypotheses U V m0
#non-truenullhypotheses
T S m-m0
Total m-R R m
• Supposeweperformm tests(e.g.m taxa aretestedforassociationwithantibiotictreatment)• Thenumberoftruenullhypothesesisunknownm0
• Visfalsepositiverate(TypeIerror)• Tisfalsenegativerate(TypeIIerror)• WeobserveR,butS,T,U,Vareunobserved• FWER=Pr(V≥1)
FWERcontrolmethodsadjustthesignificanceofeachindividualtesttoensureoverallsignificanceatgivenα.FWERresultinmorestringenttests.
32

7/6/16
17
Example:Bonferroni correction
• Toensureoverallsignificance atagivenα,oneperformseachindividual testatα’=α/m• Verystringent,resultsinloss ofpower(increaseinTypeIIerror)
33
FDR:falsediscoveryrate• ModifiestheideaofcontrollingType Ierror, toinsteadcontroltherateatwhichtype Ierrorsdooccur• FDRistheexpectedvalueofV/R• Methods forFDRcontrol
• Benjamini–Hochberg• Assumestestsareindependent
• Benjamini–Hochberg–Yekutieli• Assumesthattestsareuniformlycorrelated:• Positivelycorrelated:ifonetesthaslow
p-value,othertestsaremorelikelytoalsobesignificant
• Negativelycorrelated:ifonetesthaslowp-value,othertestsareless likelytobesignificant
#not-rejected
#rejected
Total
# truenullhypotheses U V m0
#non-truenullhypotheses
T S m-m0
Total m-R R m
34

7/6/16
18
FDRinR
• FDRisimplementedinRasap-valueadjustmentprocedure.• Input:p-values forasetofunivariate tests• Output:p-valuesthatareadjustedtoFDR• E.g.0.05adjustedp-valuemeansthatexpectedrateoffalsepositivesis0.05fortestssignificantatthatadjusted level• p.adjust• Methods:
• method = ‘fdr’: Benjamini-Hochberg• method = ‘BY’: Benjamini-Hochberg-Yekutieli
35
Filtering:reducingthenumberoftests• Wecanimprovetheoverallpowerofthetestsbyperforminglesssimultaneoustests.• Eliminate“uninteresting”taxa,e.g.ataxondoesnothavedeeptaxonomicresolution.• Eliminatetaxathatshowlowvariability.Thesearenotchangingmuchoverallthusarenotlikelytobedifferentacrossfactorlevels.• Eliminatetaxawithlowabundance.Theseareusuallynotmeasuredverywellandarelikelytohavelittlebiologicalsignificanceanyway.• Note:Acareneedstobetakenwithfilteringproceduressoasnottointroduceselectionbias,whichwillinvalidatemultiplecomparisonassumptions.Asafepracticeisforfilteringtobeblindtowardsthefactoryouwouldliketotest.
36