lecture 2- road user and vehicle characteristicswebpages.iust.ac.ir/amiripour/materials/lecture 2-...
TRANSCRIPT
2
Traffic System Components• Road users-drivers, pedestrians, bicyclists, and
passengers• Vehicles- private and commercial• Streets and highways• Traffic control devices• The general environment
3
Road Users
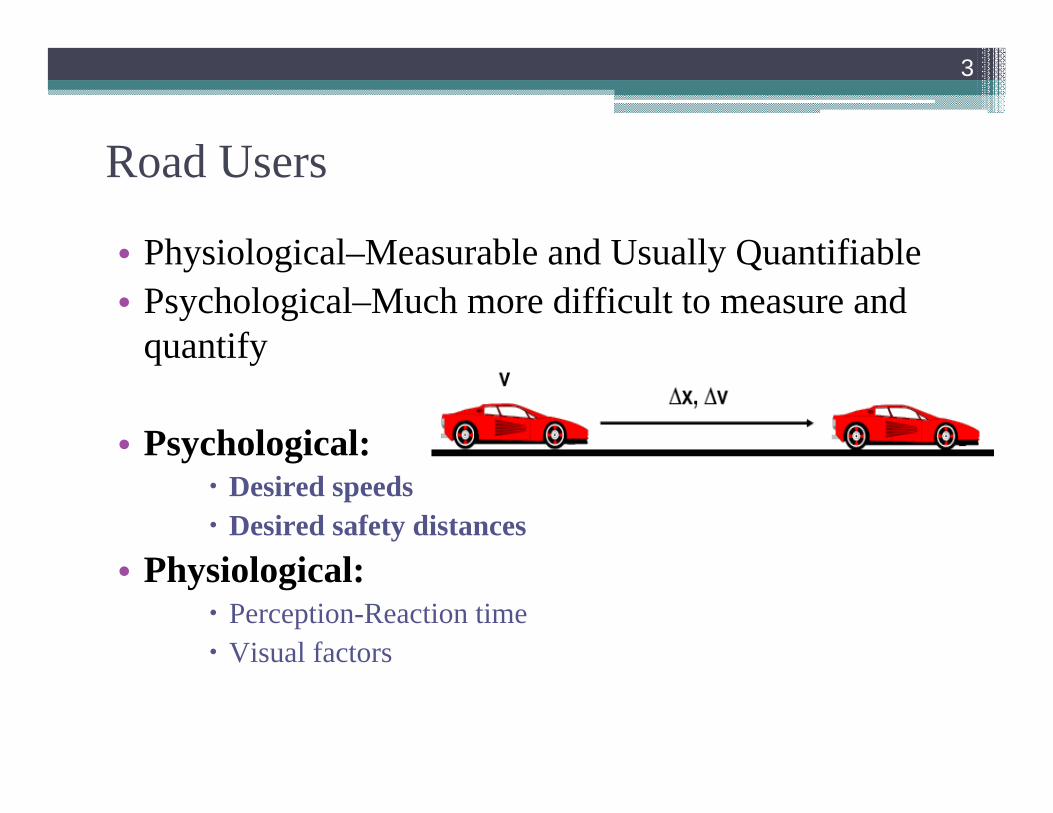
• Physiological–Measurable and Usually Quantifiable• Psychological–Much more difficult to measure and
quantify
• Psychological:Desired speedsDesired safety distances
• Physiological:Perception-Reaction timeVisual factors
4
Diversity (behaviors)
• Drivers and other road users have widely varying characteristics.
• Traffic controls could be easily designed if all drivers reacted to them in exactly the same way.
• Safety could be more easily achieved if all vehicles had uniform dimensions, weights, and operating characteristics.▫ The traffic engineer must deal with elderly drivers as
well as 18-year-olds, aggressive drivers and timid drivers, and drivers subject to myriad distractions both inside and outside their vehicles.
5
Diversity (behaviors)
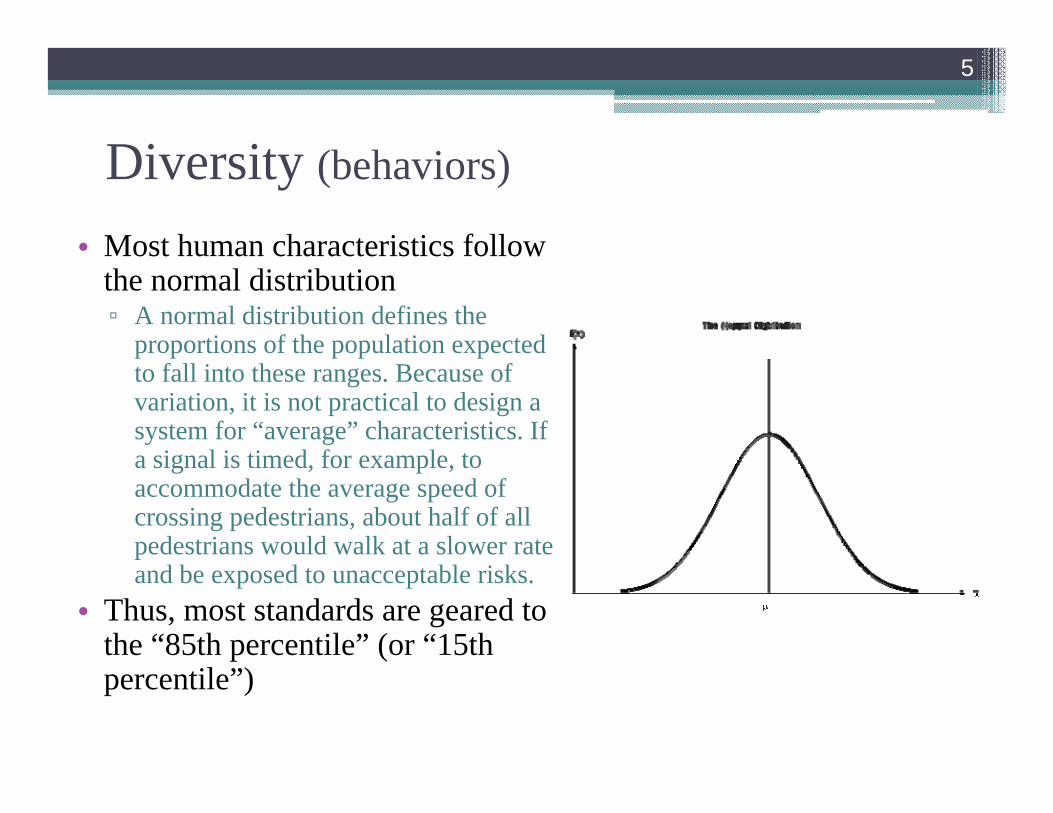
• Most human characteristics follow the normal distribution▫ A normal distribution defines the
proportions of the population expected to fall into these ranges. Because of variation, it is not practical to design a system for “average” characteristics. If a signal is timed, for example, to accommodate the average speed of crossing pedestrians, about half of all pedestrians would walk at a slower rate and be exposed to unacceptable risks.
• Thus, most standards are geared to the “85th percentile” (or “15th percentile”)

6
Diversity (Vehicles)
• Highways must be designed to accommodate motorcycles, the full range of automobiles, and a wide range of commercial vehicles, including double-and triple-back tractor-trailer combinations.
• Thus, lane widths, for example, must accommodate the largest vehicles expected to use the facility.

7
Uniformity for Diversity• design of roadway systems and traffic controls is in
the core of their professional practice.▫ Roadways of a similar type and function should have a
familiar “look” to drivers; traffic control devices should be as uniform as possible. Traffic engineers strive to provide information to drivers in uniform ways.
8
Drivers• Visual Acuity factors• Reaction Process
• Hearing• Physical Strength
• Personality and Psychology
9
Visual Acuity factors• The most important characteristic of drivers is their
ability to see!• Field of Vision• Color Blindness▫ … (other factors can be found at table 2.1of the
textbook)
10
Field of Vision
11
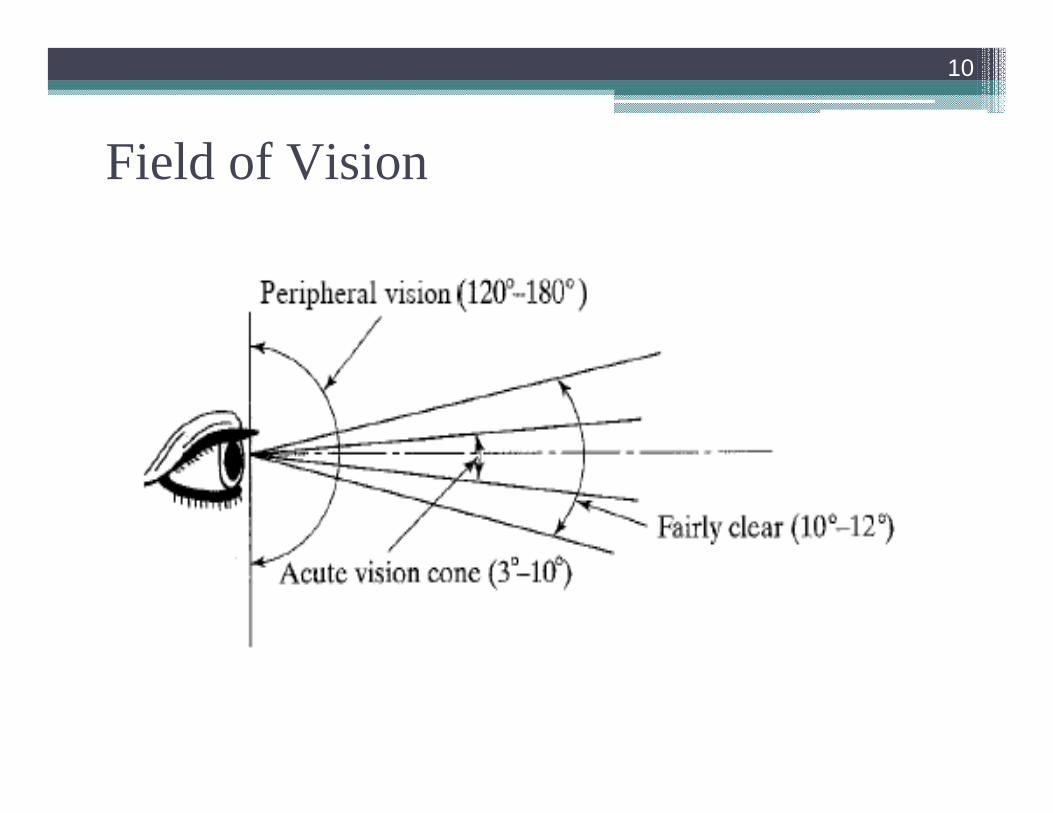
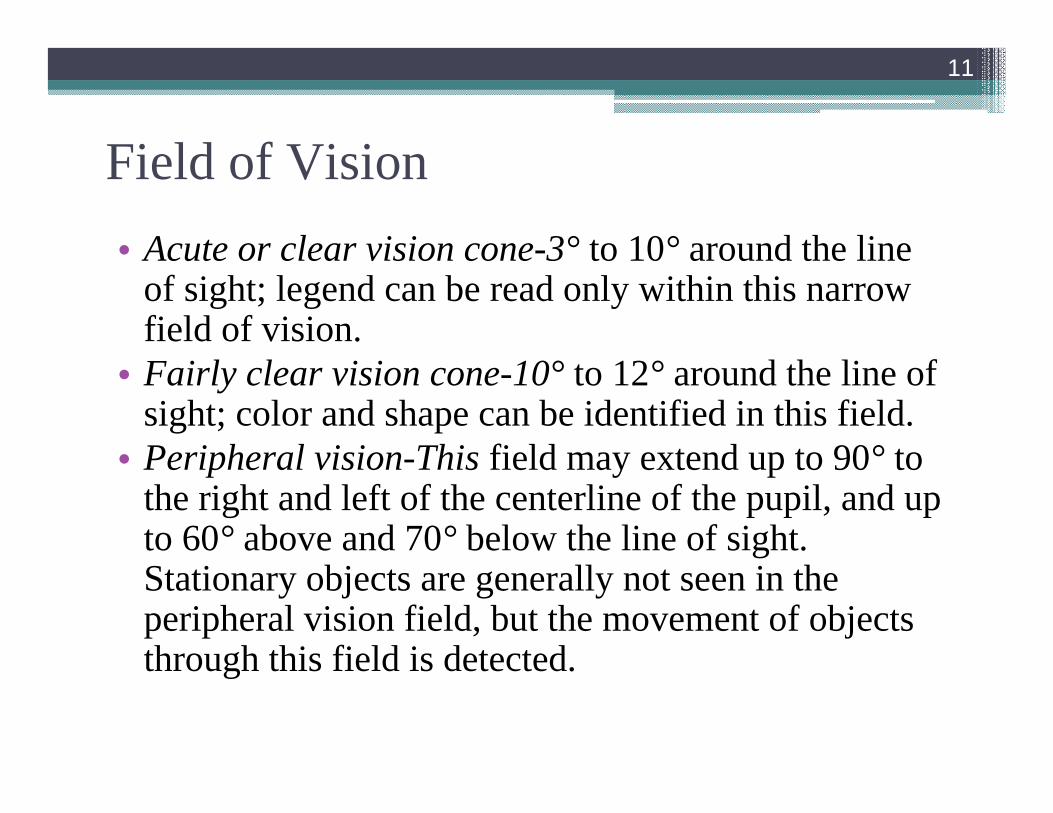
Field of Vision• Acute or clear vision cone-3° to 10° around the line
of sight; legend can be read only within this narrow field of vision.
• Fairly clear vision cone-10° to 12° around the line of sight; color and shape can be identified in this field.
• Peripheral vision-This field may extend up to 90° to the right and left of the centerline of the pupil, and up to 60° above and 70° below the line of sight. Stationary objects are generally not seen in the peripheral vision field, but the movement of objects through this field is detected.

12
Field of Vision• Objects or other vehicles located in the fairly clear and
peripheral vision fields may draw the driver’s attention to an important event occurring in that field, such as the approach ofa vehicle on an intersection street or driveway or a child running into the street after a ball. Once noticed, the driver may turn his/her head to examine the details of the situation.
• Traffic Signs: Location, Height, Shapes, Colors
• The peripheral vision field narrows, as speed increases, to as little as 100° at 20 mi/h and to 40° at 60 mi/h.

13
Visual Dificits• Some of the more common problems involve
cataracts, glaucoma, peripheral vision deficits, ocular muscle imbalance, depth perception deficits, and color blindness.
• Unfortunately, one of the most common forms of color blindness involves the inability to discern the difference between red and green.▫ The location of colors on signal heads has long been
standardized, with red on the top and green on the bottom of vertical signal heads. On horizontal heads, red is on the left and green on the right.

14
Perception-Reaction Time• The second critical driver characteristic is perception-reaction
time (PRT). ▫ Detection. In this phase, an object or condition of concern enters
the driver’s field of vision, and the driver becomes consciously aware that something requiring a response is present.
▫ Identification. In this phase, the driver acquires sufficient information concerning the object or condition to allow the consideration of an appropriate response.
▫ Decision. Once identification of the object or condition is sufficiently completed, the driver must analyze the information and make a decision about how to respond.
▫ Response. After a decision has been reached, the response is now physically implemented by the driver.
15
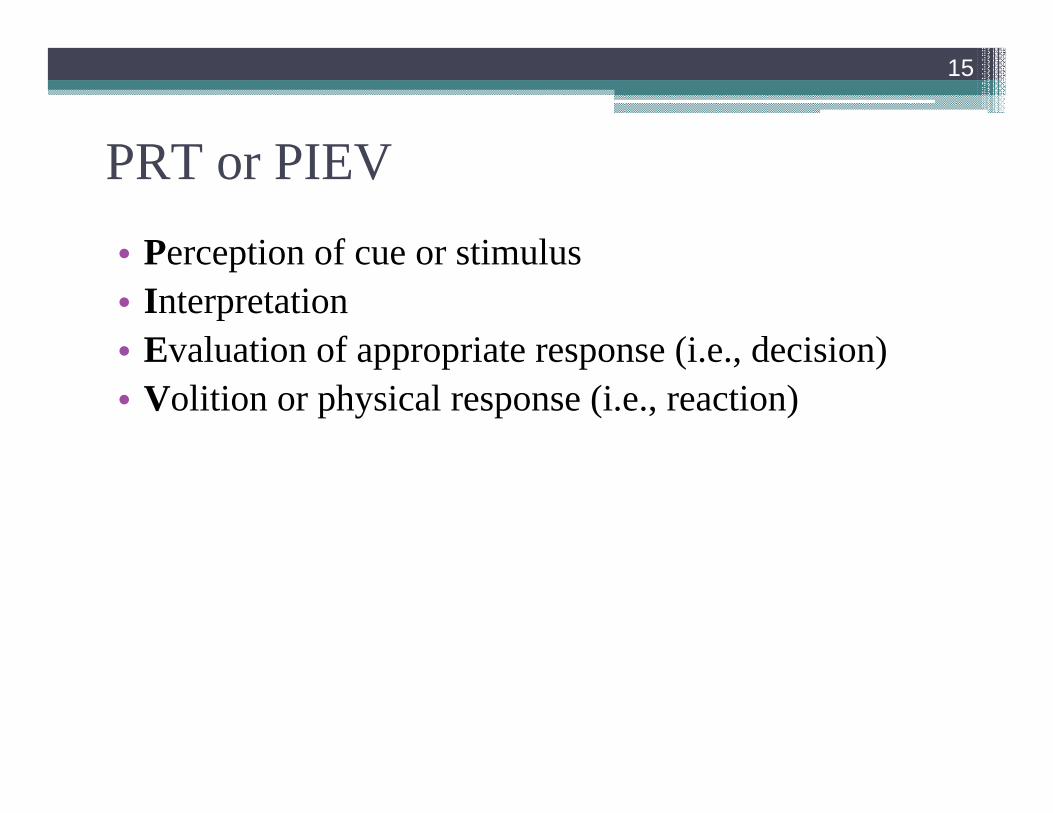
PRT or PIEV• Perception of cue or stimulus• Interpretation• Evaluation of appropriate response (i.e., decision)• Volition or physical response (i.e., reaction)
16
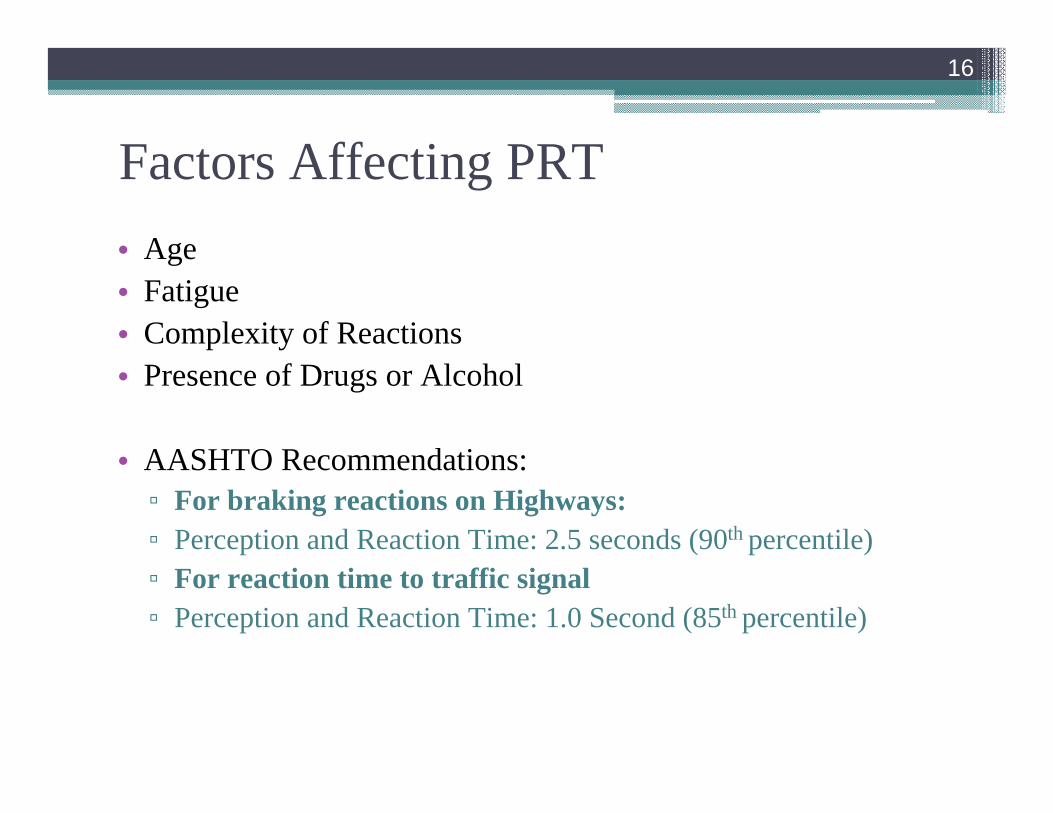
Factors Affecting PRT• Age• Fatigue• Complexity of Reactions• Presence of Drugs or Alcohol
• AASHTO Recommendations:▫ For braking reactions on Highways:▫ Perception and Reaction Time: 2.5 seconds (90th percentile)▫ For reaction time to traffic signal ▫ Perception and Reaction Time: 1.0 Second (85th percentile)
17
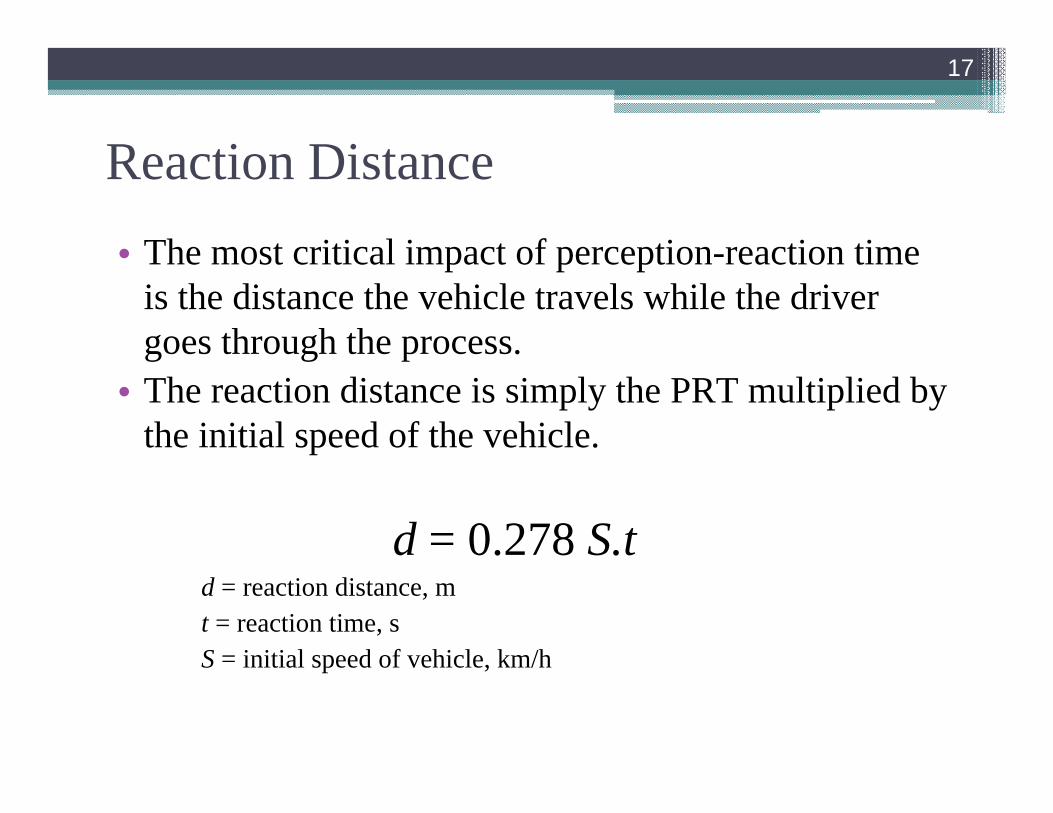
Reaction Distance• The most critical impact of perception-reaction time
is the distance the vehicle travels while the driver goes through the process.
• The reaction distance is simply the PRT multiplied by the initial speed of the vehicle.
d = 0.278 S.td = reaction distance, mt = reaction time, sS = initial speed of vehicle, km/h
18
Reaction Distance• The importance of this factor is illustrated in the following sample
problem: A driver rounds a curve at a speed of 60 mi/h and sees a truck overturned on the roadway ahead. How far will the driver’s vehicle travel before the driver’s foot reaches the brake? Applying the AASHTO standard of 2.5 s for braking reactions:
dr = 1.47 * 60 * 2.5 = 220.5 ft
• The vehicle will travel 220.5 ft (approximately 11-12 car lengths) before the driver even engages the brake. The implication of this is frightening. If the overturned truck is closer to the vehicle than 220.5 ft when noticed by the driver, not only will the driver hit the truck, he or she will do so at full speed-60 mi/h. Deceleration begins only when the brake is engaged-after the perception-reaction process has been completed.
19
Pedestrian Characteristics• One of the most critical safety problems in any
highway and street system involves the interactions of vehicles and pedestrians.
• Walking Speeds▫ 1 to 1.2 m/s for 85%
• Gap Acceptance▫ 38 m
• Pedestrian Comprehension of Controls
20
Vehicle Categories• AASHTO - Four main categories :▫ Passenger curs-all passenger cars, SUVs, minivans,
vans, and pickup trucks.▫ Buses-intercity motor coaches, transit buses, school
buses, and articulated buses▫ Trucks-single-unit trucks, tractor-trailer, and tractor-
semi-trailer combination vehicles▫ Recreational vehicles-motor homes, cars with various
types of trailers (boat, campers, motorcycles, etc.)

21
Vehicle Characteristics• Braking and deceleration• Acceleration• Low-speed turning characteristics• High-speed turning characteristics
• Size• Weight
22
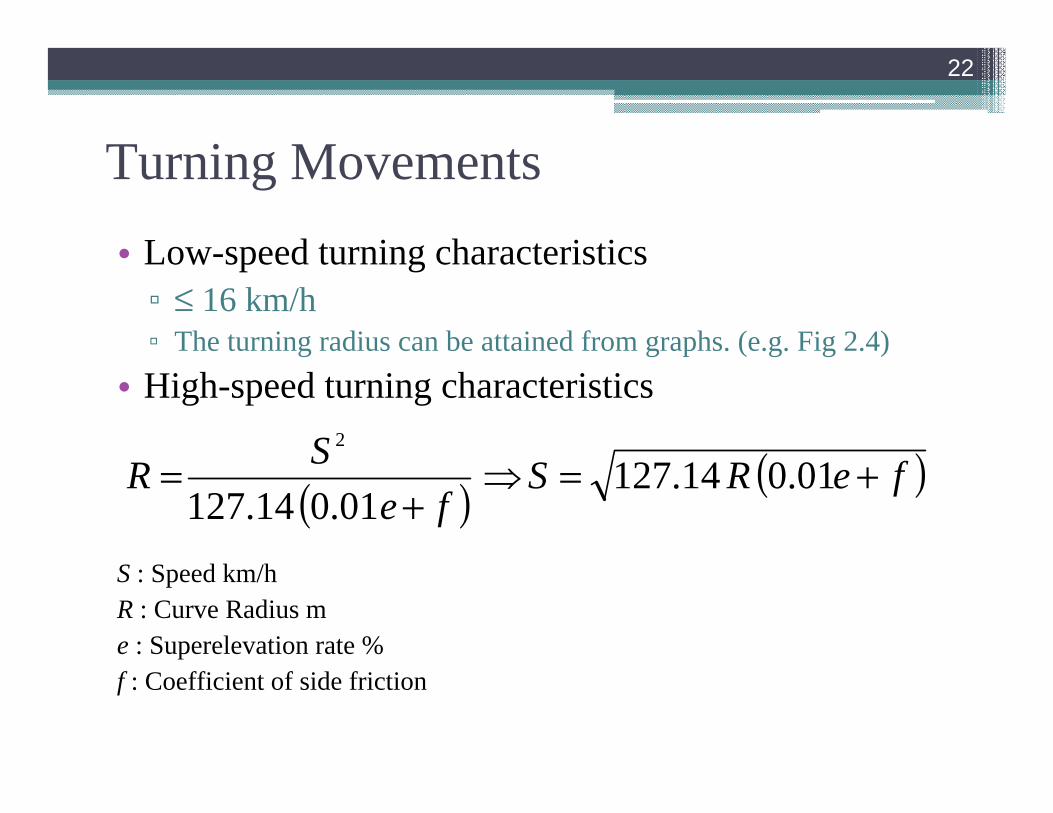
Turning Movements• Low-speed turning characteristics▫ ≤ 16 km/h▫ The turning radius can be attained from graphs. (e.g. Fig 2.4)
• High-speed turning characteristics
S : Speed km/hR : Curve Radius me : Superelevation rate %f : Coefficient of side friction
( ) ( )feRSfe
SR +=⇒+
= 01.014.12701.014.127
2
23
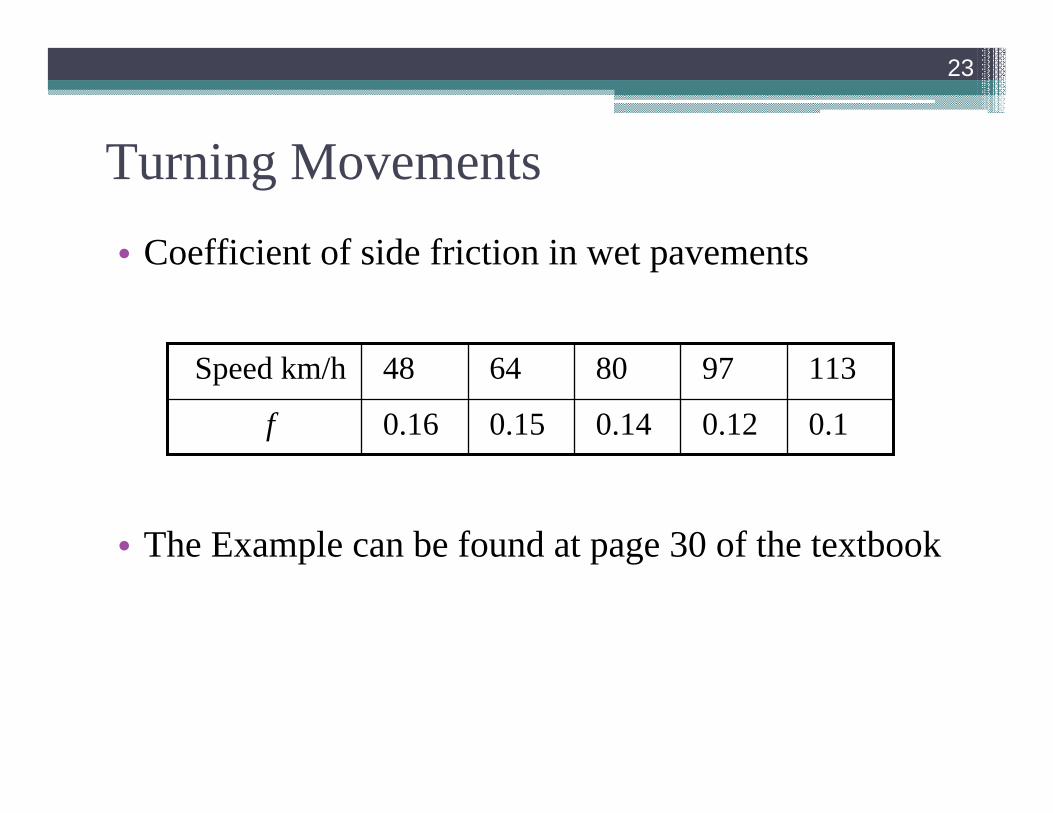
Turning Movements• Coefficient of side friction in wet pavements
• The Example can be found at page 30 of the textbook
0.10.120.140.150.16f
11397806448Speed km/h
24
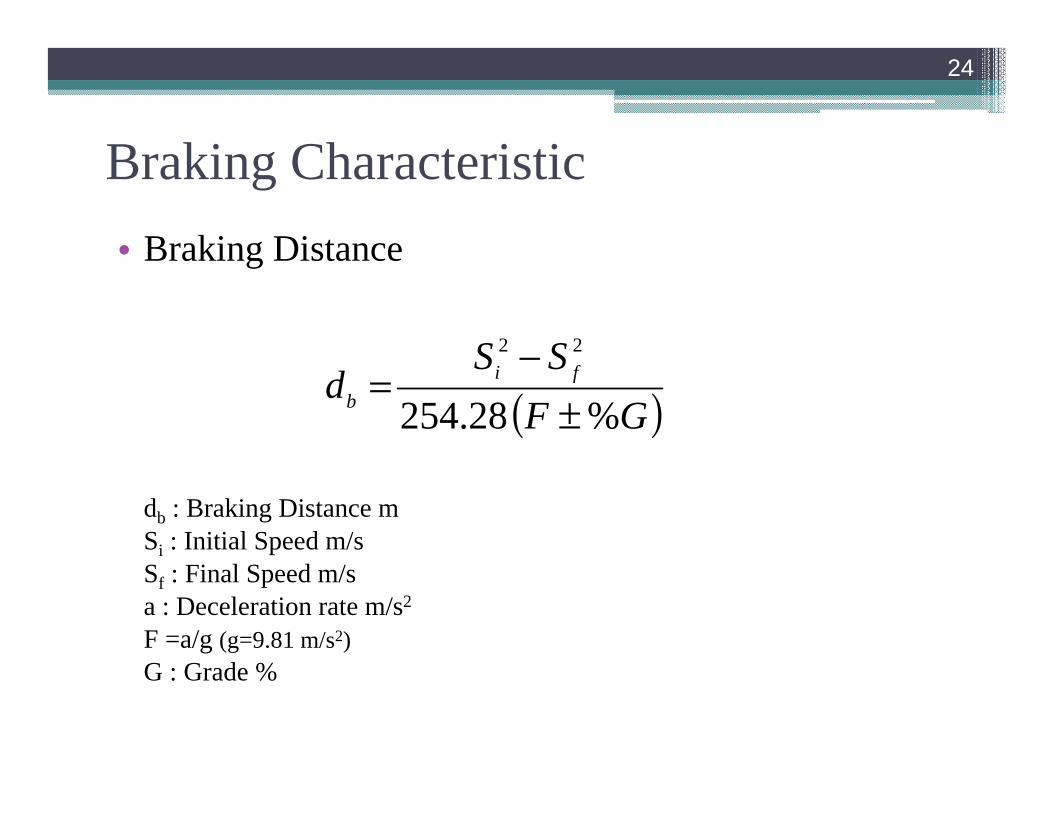
Braking Characteristic• Braking Distance
db : Braking Distance mSi : Initial Speed m/sSf : Final Speed m/sa : Deceleration rate m/s2
F =a/g (g=9.81 m/s2)G : Grade %
( )GFSS
d fib %28.254
22
±−
=
25
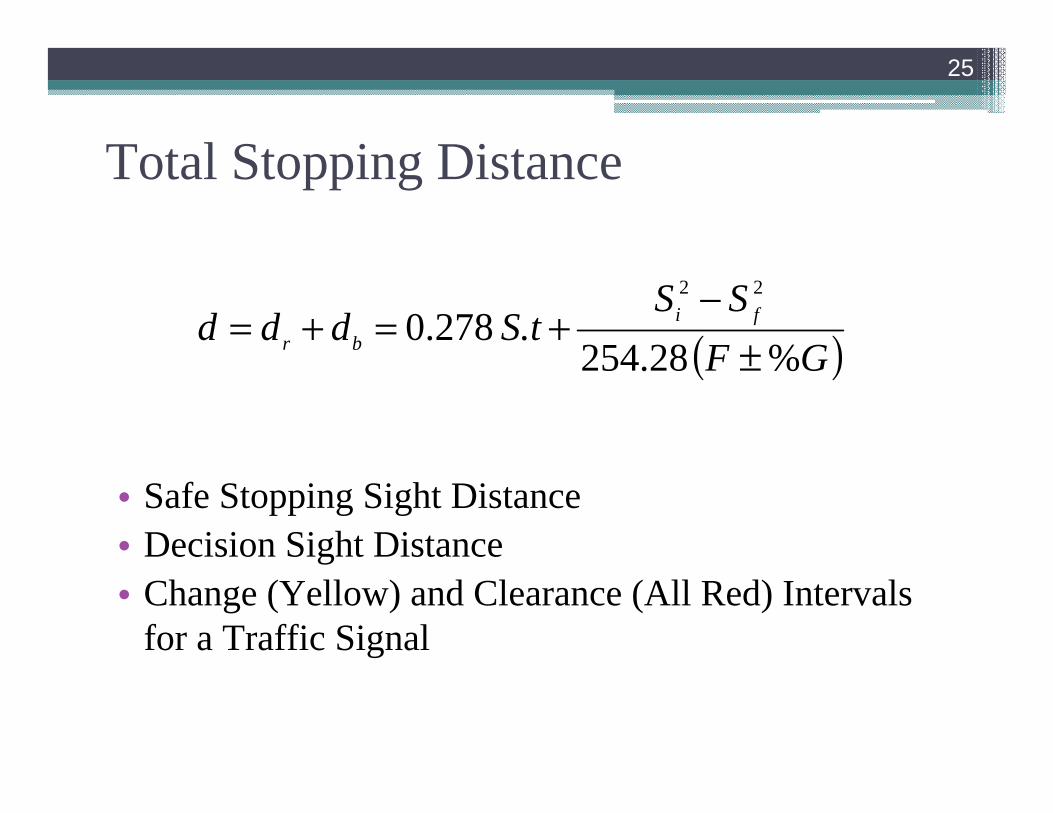
Total Stopping Distance
• Safe Stopping Sight Distance• Decision Sight Distance• Change (Yellow) and Clearance (All Red) Intervals
for a Traffic Signal
( )GFSS
S.tddd fibr %28.254
0.27822
±−
+=+=

26
Safe Stopping Sight Distance• One of the most fundamental principles of highway
design is that the driver must be able to see far enough to avoid a potential hazard or collision. Thus, on all roadway sections, the driver must have a sight distance that is at least equivalent to the total stopping distance required at the design speed.
• The Example can be found at page 33 of the textbook

27
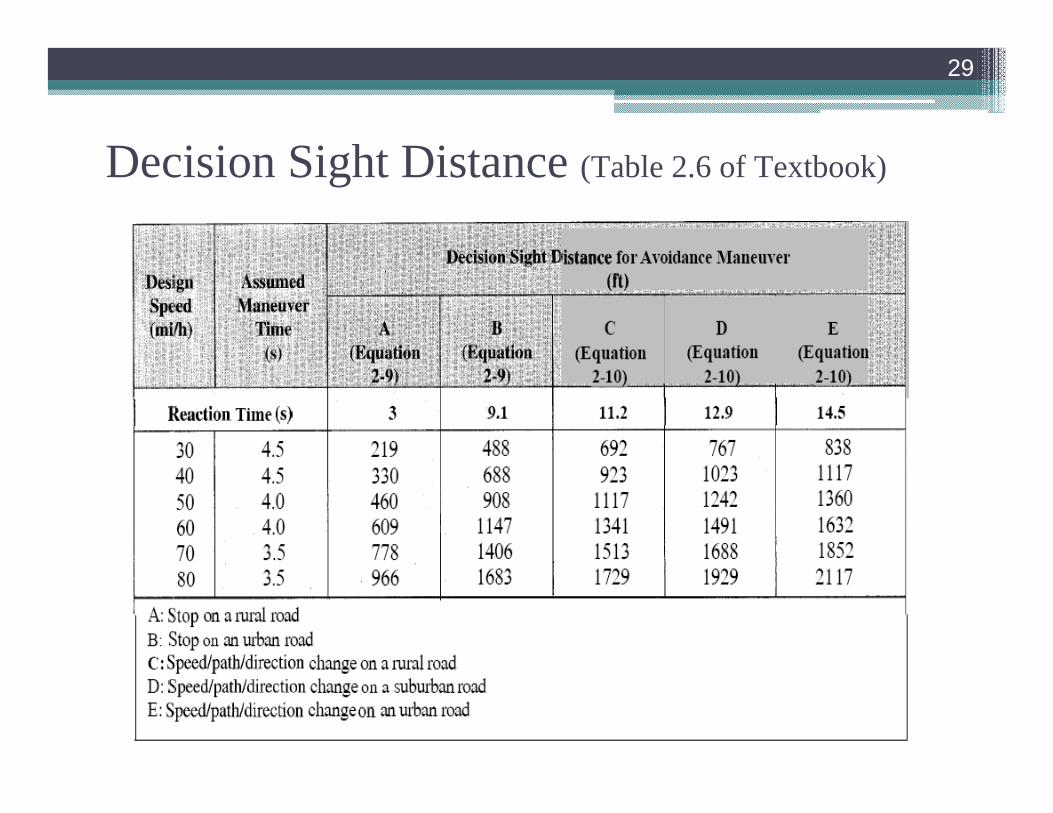
Decision Sight Distance• there are some sections that should provide greater sight
distance to allow drivers to react to potentially more complex situations than a simple stop.
• AASHTO recommends that decision sight distance be provided at interchanges or intersection locations where unusual or unexpected maneuvers are required; changes in cross-section such as lane drops and additions, toll plazas, and intense-demand areas where there is substantial “visual noise”from competing information (e.g., control devices, advertising, roadway elements).
28
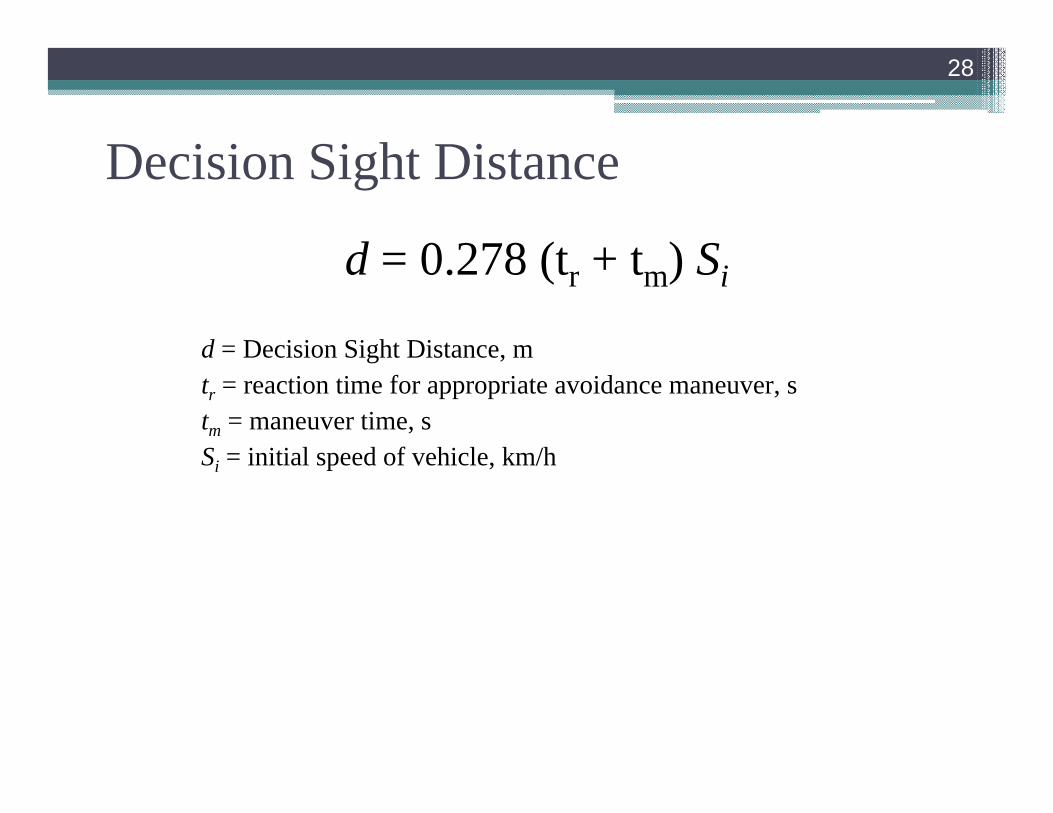
Decision Sight Distance
d = 0.278 (tr + tm) Si
d = Decision Sight Distance, mtr = reaction time for appropriate avoidance maneuver, stm = maneuver time, sSi = initial speed of vehicle, km/h
29
Decision Sight Distance (Table 2.6 of Textbook)

30
Change (Yellow) and Clearance (All Red) Intervals for a Traffic Signal
31
Reading• Traffic Engineering, Roess, Prassas, McShane, [1]
pp. 17-37