lecture 23 performance, slide 1eecs40, fall 2004prof. white lecture #23 performance outline timing...
Post on 21-Dec-2015
219 views
TRANSCRIPT

Lecture 23 Performance, Slide 1EECS40, Fall 2004 Prof. White
Lecture #23 Performance
OUTLINE• Timing diagrams (from Lecture 22)• Delay analysis (from Lecture 22)• Maximum clock frequency - three figures of
merit• Continuously-switched inverters• Ring oscillators
Reading (Rabaey et al.) Parts of Ch. 5: Pages 179-184; 193-203; 212-217; 220-227; 230-232 Perspective and Summary

Lecture 23 Performance, Slide 2EECS40, Fall 2004 Prof. White
A F
Propagation Delay in Timing Diagrams
• To simplify the drawing of timing diagrams, we can approximate the signal transitions to be abrupt (though in reality they are exponential).
tA 1
0
tF 1
0
tpHL tpLH
2/pLHpHLp ttt To further simplify timing analysis, we can define the
propagation delay as
Lecture 23 Performance, Slide 3EECS40, Fall 2004 Prof. White
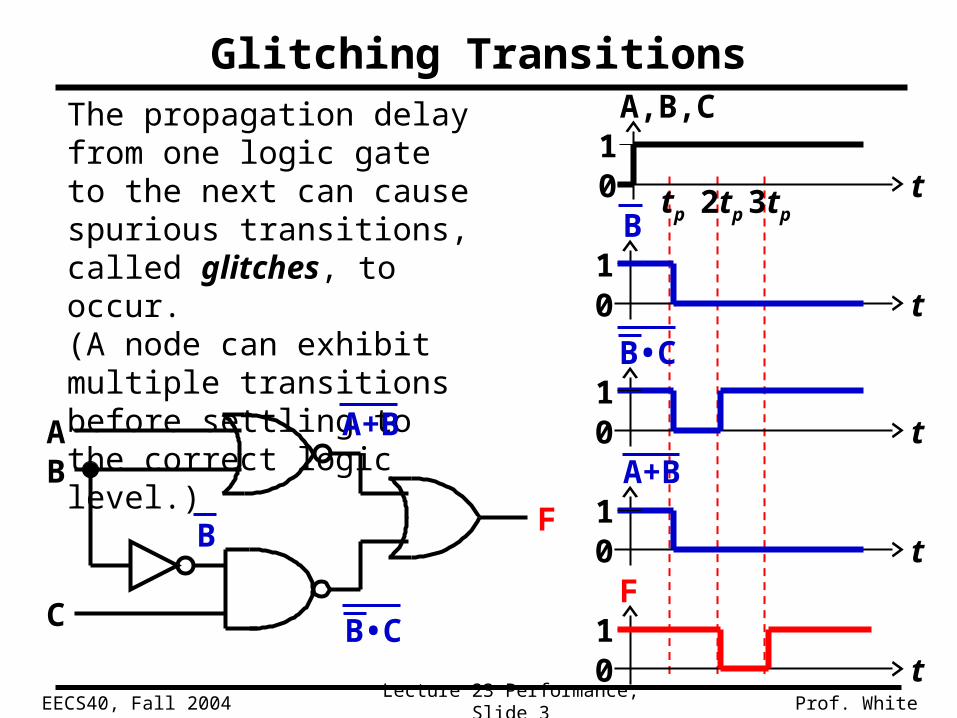
Glitching TransitionsThe propagation delay from one logic gate to the next can cause spurious transitions, called glitches, to occur. (A node can exhibit multiple transitions before settling to the correct logic level.)
AB
C
F
t
A,B,C10
0 t
B1
B
B•C
A+B t10
B•C
t10
A+B
t01
F
tp 2tp 3tp

Lecture 23 Performance, Slide 4EECS40, Fall 2004 Prof. White
Glitch Reduction
• Spurious transitions can be minimized by balancing signal paths
Example: F = A•B•C•D

Lecture 23 Performance, Slide 5EECS40, Fall 2004 Prof. White
MOSFET Layout and Cross-Section
Top View:
Cross Section:
Lecture 23 Performance, Slide 6EECS40, Fall 2004 Prof. White
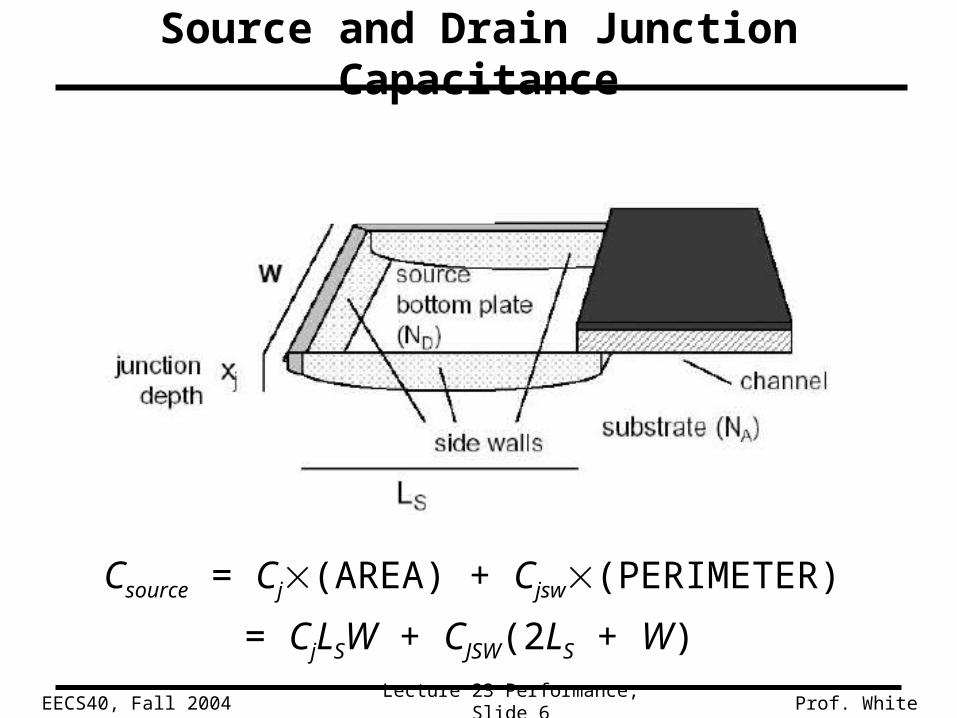
Source and Drain Junction Capacitance
Csource = Cj(AREA) + Cjsw(PERIMETER)
= CjLSW + CJSW(2LS + W)

Lecture 23 Performance, Slide 7EECS40, Fall 2004 Prof. White
Computing the Output Capacitance
In Out
Metal1
VDD
GND
Poly-Si PMOSW/L=9/2
In Out
Example 5.4 (pp. 197-203)
NMOSW/L=3/2
2=0.25m

Lecture 23 Performance, Slide 8EECS40, Fall 2004 Prof. White
In Out
VDD
GND
PMOSW/L=9/2
NMOSW/L=3/2
2=0.25m
Capacitances for 0.25m technology:Gate capacitances:• Cox(NMOS) = Cox(PMOS) = 6 fF/m2 Overlap capacitances:• CGDO(NMOS) = Con = 0.31fF/m• CGDO(PMOS)= Cop = 0.27fF/mBottom junction capacitances:• CJ(NMOS) = KeqbpnCj = 2 fF/m2
• CJ(PMOS) = KeqbppCj = 1.9 fF/m2
Sidewall junction capacitances:• CJSW(NMOS) = KeqswnCj = 0.28fF/m• CJSW(PMOS) = KeqbppCj = 0.22fF/m

Lecture 23 Performance, Slide 9EECS40, Fall 2004 Prof. White

Lecture 23 Performance, Slide 10EECS40, Fall 2004 Prof. White
Typical MOSFET Parameter Values
• For a given MOSFET fabrication process technology, the following parameters are known:– VT (~0.5 V)
– Cox and k (<0.001 A/V2)
– VDSAT ( 1 V)
– ( 0.1 V-1)
Example Req values for 0.25 m technology (W = L):

Lecture 23 Performance, Slide 11EECS40, Fall 2004 Prof. White
Compute propagation delays

Lecture 23 Performance, Slide 12EECS40, Fall 2004 Prof. White
Examples of Propagation Delay
ProductCMOS
technology generation
Clock frequency, f
Fan-out=4 inverter
delay
Pentium II 0.25 m 600 MHz ~100 ps
Pentium III 0.18 m 1.8 GHz ~40 ps
Pentium IV 0.13 m 3.2 GHz ~20 ps
Typical clock periods:• high-performance P: ~15 FO4 delays• PlayStation 2: 60 FO4 delays

Lecture 23 Performance, Slide 13EECS40, Fall 2004 Prof. White
STATIC CMOS DRIVING LARGE LOADS
We have seen that the typical driving resistance R for a minimum sized inverter is in the range of 10 K. A 1 K resistor driving a 50pF load would have a stage delay of 35nsec, huge in comparison to normal stage delays.
The load, CL , may be the capacitance of a long line on the chip (e.g. up to
1pF, or may be the load on one of the chip output pins (e.g. up to 50pF).
vout
vin+ -
VDD
MN1
MP1
CL
Thus we need to use larger devices to drive large capacitive loads, that is greatly increase W/L.
However, increasing W/L of a stage will increase the load it presents to the stage driving it, and we just move the delay problem back one stage.

Lecture 23 Performance, Slide 14EECS40, Fall 2004 Prof. White
STATIC CMOS DRIVING LARGE LOADS
CL PROPOSED SOLUTION: Insert several simple inverter stages with increasing W/L between Inverter 1
and the load CL. The total delay through the multiple stages will be less than
the delay of one single stage driving CL.
PROBLEM: A minimum sized inverter drives a large load, CL, leading to excessive
delay, even with a buffer stage.
vin+ -
VDD
MN1
MP1vout
VDD
MNB
MPB
vout
vin+ -
CL
VDD
MN1
MP1
MNB1
MPB1
MNB2
MPB2
MNB3
MPB3

Lecture 23 Performance, Slide 15EECS40, Fall 2004 Prof. White
STATIC CMOS DRIVING LARGE LOADS
Example: The 2.5V 0.25m CMOS inverter driving 50 pF load.
Properties: W/L|N =1/.25, W/L|P =2/.25, VDD = 2.5V, VT = 0.5V.
Rn = 13 KKRp = 31 KK5nm oxide thickness , Cox =6.9 fF/m2.
NMOS: CGp = W x L x Cox =1.7 fF.
PMOS : CGp = W x L x Cox =3.4 fF. Thus CIN= 5.2 fF
Thus the gate delay for the first stage is (50000/5.2)X10pS = 96.1nS.
Total delay = 96.1 + .01 = 96.11nS. TOO LONG and NO IMPROVEMENT!
W/L = 4 W/L = 9615
Basic gate delay (0.69RC) is about 10pS.
If we size one inverter to drive the load with this time constant it requires a W/L increase by a factor of 50pF/5.2fF =9615. So CIN= 50000fF =50pF for the buffer gate!
Note: We are ignoring drain capacitance in these examples.
vin+ -
VDD
MN1
MP1vout
MNB
MPB
50 pF

Lecture 23 Performance, Slide 16EECS40, Fall 2004 Prof. White
STATIC CMOS DRIVING LARGE LOADSSame example with tapered device sizes (geometric series)
vout
vin+ -
CL
VDD
MN1
MP1
MNB1
MPB1
MNB2
MPB2
MNB3
MPB3
Case 2: Now taper through 3 buffer stages with W/L ratios of 9.9 (9.94=9615)
Case 1: Same example, but with buffer devices scaled by factor of 98 (982=9615 )
Stage 1 load = 98 X 5.2fF, (R= 3.5K)
Stage 2 load = 50 pF , (R = 3.5K /98)
Delay = 98 X 10pS + 96nS/98 =0.98 +0.98 nS ~2nS
4 equal gate delays of 9.9 x 10pS =99pS Total = 4 X .099nS ~0.4nS
Gate delay through 4 gates is much less than through 2!Note: We are ignoring drain
capacitance in these examples.
Lecture 23 Performance, Slide 17EECS40, Fall 2004 Prof. White
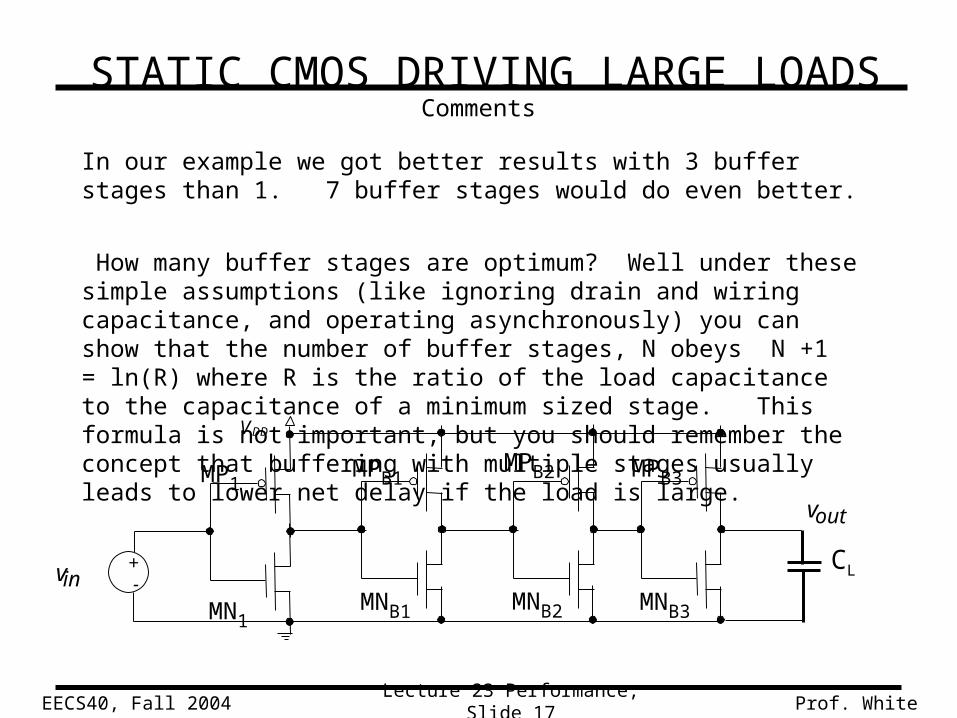
STATIC CMOS DRIVING LARGE LOADSComments
In our example we got better results with 3 buffer stages than 1. 7 buffer stages would do even better.
How many buffer stages are optimum? Well under these simple assumptions (like ignoring drain and wiring capacitance, and operating asynchronously) you can show that the number of buffer stages, N obeys N +1 = ln(R) where R is the ratio of the load capacitance to the capacitance of a minimum sized stage. This formula is not important, but you should remember the concept that buffering with multiple stages usually leads to lower net delay if the load is large.
vout
vin+ -
CL
VDD
MN1
MP1
MNB1
MPB1
MNB2
MPB2
MNB3
MPB3

Lecture 23 Performance, Slide 18EECS40, Fall 2004 Prof. White
How to measure inverter performance?
2) The stage delay when the input is a continuous square-wave clock input.
vout1
= v in2
vin1+ -
VDD
MN1MN2
MP3MP4
There are two other measures of performance which we can also consider:
1) We have defined the unit delaytp as the time until Vout1 reaches VDD /2
starting at either 0V (rising) or VDD (falling) . Vin1 is a step function.
3) The delay of a pulse through a multi-stage “ring oscillator”,
Lecture 23 Performance, Slide 19EECS40, Fall 2004 Prof. White
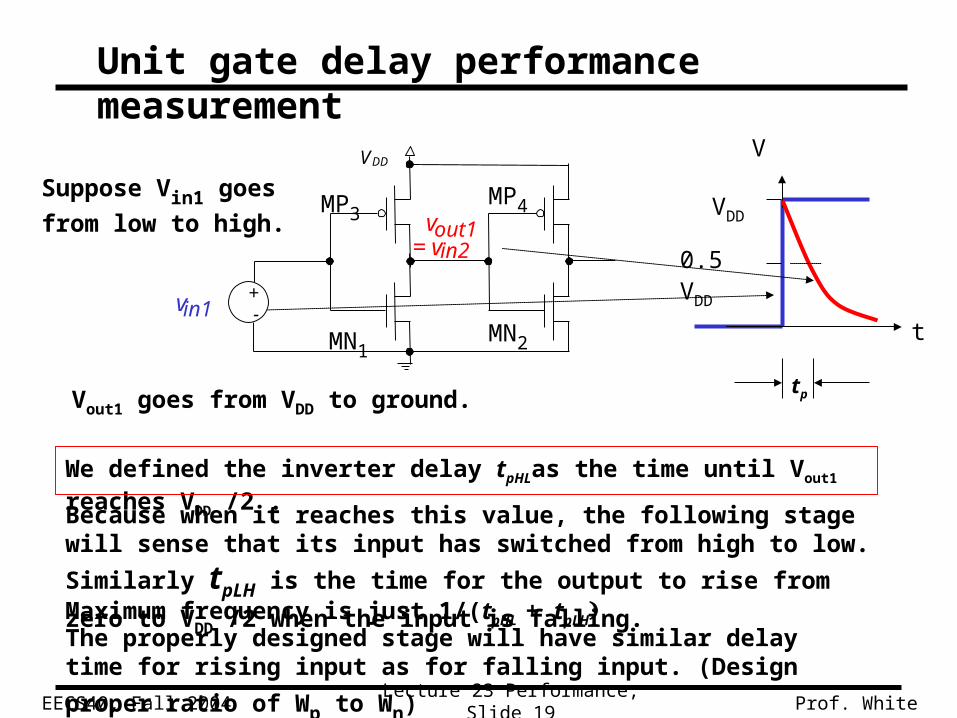
Unit gate delay performance measurement
t
Suppose Vin1 goes
from low to high.
The properly designed stage will have similar delay time for rising
input as for falling input. (Design proper ratio of Wp to Wn)
V
vout1
= v in2
vin1+ -
VDD
MN1MN2
MP3MP4 VDD
Because when it reaches this value, the following stage will sense that
its input has switched from high to low. Similarly tpLH is the time for the
output to rise from zero to VDD /2 when the input is falling.
Vout1 goes from VDD to ground.
We defined the inverter delay tpHLas the time until Vout1 reaches VDD /2 .
tp
0.5 VDD
Maximum frequency is just 1/(tpHL + tpLH

Lecture 23 Performance, Slide 20EECS40, Fall 2004 Prof. White
Driving Inverters (or gates) with Square-Wave Clock
INV
t
DDVtt
1/f
VDD
In X
Node X loaded by CX
Inverter 1 has output resistance Rp or Rn
Output slowly converges to sawtooth waveform. Let’s find relationship between max and min values vh and vl after many many cycles:
(1) Pull down:XnCΔt/R
hl evv (2) Pull up:
XpCΔt/RDDlDDh )eV(vVv
Example:
can solve simultaneously given t/RC
t1
t
t
t4t3t2t5
etc.
VIN , VX
Lets follow VX for VIN
starting at t=0
Vl
Vh
DDhDDlXnpn 0.73V v,0.27V v CRΔt ,RR

Lecture 23 Performance, Slide 21EECS40, Fall 2004 Prof. White
Square-Wave DriveINV
t
DDVtt
1/f
VDD
In YX
Inverter 2 will operate correctly so long as VX passes through vil and vih.We approximate response of devices in inverter 2 as instantaneous (remember the steep transfer curve). Let’s look at VX after a long time.
XV
DDV
ihV
ilV
When VX crosses down through vil, inverter 2 switches, and when it crosses up through vih, it switches back
XV
t1
t
t
t4t3t2t5
etc.

Lecture 23 Performance, Slide 22EECS40, Fall 2004 Prof. White
If frequency increases when will inverter fail?
If VX does not pass through Vil or Vih, because frequency is too high.
MAXIMUM CLOCK FREQUENCY fmax : Increase f until inverter 2 fails to toggle because its input does not pass through its threshold(s). In general, Rp Rn, so rise or fall is slower.

Lecture 23 Performance, Slide 23EECS40, Fall 2004 Prof. White
Example:
Now consider the square-wave drive case:
Take VDD=2.5V, Vih = 1.5, Vil = 1V , so in this symmetric case:CΔt/R
DDilDDihCΔt/R
ihilpn )eV-V(V vand eVv
Solving either equation with RC = 15pS, t = 6.1pS; fmax2 = 1012/12.2=82GHz
(obviously this result depends on our somewhat arbitrary choice for Vih and Vil )
Take R = 3 K, C = 5 fF, tpHL = tpLH = 0.69 RC = 10pS ;
So fmax1 = 50GHz
XV
DDV
ihV
ilV

Lecture 23 Performance, Slide 24EECS40, Fall 2004 Prof. White
Ring Oscillator
As soon as the inverter 1 drives inverter 2’s input past Vil (falling) or Vih (rising), inverter 2 switches and starts driving input node of toward its switch point, etc.
Result: Signal propagates along chain at another kind of maximum clock frequency fmax* (really maximum propagation frequency )
Odd number of stages
Let the average delay per stage be tMIN then the time around loop is N tMIN .
One period is twice around the loop, so , something very
easy to measure. [ If tMIN is 20pSec but N is 1001, the period 1/ fRO is 40 nSec.].O.R
MIN f1
tN2
Nf*f R.O.MAX easy to measure (low frequency)could be 1001
1 2 3 n…4
*2f
1Δt
MAXMIN Now we. define fmax* by ,so
Note: V starts at 0V (rising) or VDD (falling) WHY?
NOTE:
fmax *< fmax2
WHY?

Lecture 23 Performance, Slide 25EECS40, Fall 2004 Prof. White
Ring Oscillator
As soon as the switch closes inverter 5 drives inverter 1’s input up (starting at 0 V). When it reaches Vih inverter 1 switches and starts driving input node of inverter two down, starting at VDD. . We note that the transient always starts at 0 or VDD and ends at Vih or Vil , respectively.
This clearly takes longer than the clock-driven chain of inverter transient.
Need to solve same exponential equations as in square-wave drive, but with different limits:
Up: Start at 0, end at Vih.
Down: Start at VDD, end at Vil.
Vih = VDD[1-exp(-tLH/RpC)]
Vil = VDD[exp(-tHL/RnC)]
Solve for tLH and tHL and avg. to get tMIN : tMIN = (tLH + tHL )/2
Odd number of stages
0=0V 1 0 1 1=VDD0
close switch

Lecture 23 Performance, Slide 26EECS40, Fall 2004 Prof. White
Ring Oscillator Example
From Vih = VDD[1-exp(-tLH/RpC)] we find tLH = 13.7pS
Similarly from Vil = VDD[exp(-tHL/RnC)] tHL = 13.7pS
Thus the delay through 101 stages, twice is 202 X 13.7 =2.78nS.
The ring oscillator frequency is 109/2.78 = 360 MHz.
Finally, fmax* = 360 X 101 = 36 GHz.
This is of course less than either the 50GHz estimated from unit gate delay or the 82 GHz estimated from square-wave driven max toggle frequency.
101 Stages, same parameters: (RC = 15 pS)
0=0V 1 0 1 1=VDD0
close switch