lecture 3: hydration mechanisms physical structure · lecture 3: hydration mechanisms physical...
TRANSCRIPT

Cement Chemistry for Engineers, Cape Town 31st January 2013
Lecture 3: Hydration Mechanisms
Physical structure
Mechanism – Induction period and beyond
Pore structure

Kinetics are key, but underlying mechanisms not well understood
~10 h
Accele
rati
on
peri
od
~3 h
Ind
ucti
on
peri
od
Decele
rati
on
peri
od
~24 h
He
at e
vo
lutio
n
Why does the initial
rapid reaction slow down? What limits this
phase of reaction?

0
1
2
3
4
0 3 6 9 12 15 18 21 24
He
at F
low
(m
W/g
)
Age of Specimen (Hours)
sta
ge
1
sta
ge
2
sta
ge
3
sta
ge
4
Alite reaction
3

A) PROTECTIVE MEMBRANE LAYER
1. Anhydrous grain 2. Formation of a
protective layer
around the grain
preventing
further dissolution
3.a) Disruption of the protective
layer by osmotic pressure due to
the difference of ion concentration
between the inner solution and
the pore solution creating an osmotic
pressure.
3.b) Disruption of the protective
layer due to the nucleation and
growth of more stable hydrates
in the protective membrane
[Stein & Stevels, 1964], [de Jong, 1967], [Kondo & Daimon, 1968], [Brown et al. 1985]
[Stein & Stevels, 1964]
[Gartner & Jennings, 1987]
[Powers], [Double et al., 1980]
No direct evidence
Different theories about the induction period

100 nm
Image from Luc Nicoleau of BASF.
Portland cement observed in the cryo SEM

AFM wet cell
Thesis Helène di Murro U. Bourgogne

B) NUCLEATION THEORY
Formation of nuclei on surface
controls early reaction.
Growth of the nuclei is the rate
limiting factor.
[Fierens and Verhaegen, 1976],[Odler and Dorr, 1979],[Gauffinet et al., 1998]
[Garrault et al., 2007]
What explains initial slow down?
Different theories about the induction period
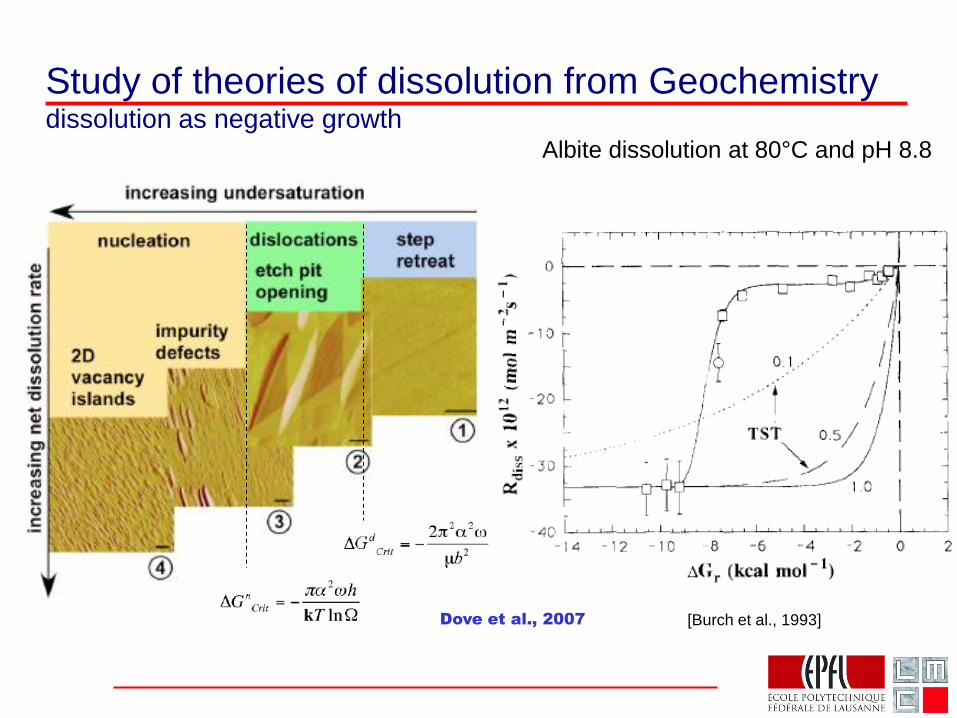
Study of theories of dissolution from Geochemistry dissolution as negative growth
Albite dissolution at 80°C and pH 8.8
[Burch et al., 1993] Dove et al., 2007

Does this apply to alite?
Fresh alite
Alite 2 minutes in pure water
Multiple etch pits
2 minutes in saturated lime sol.
Smooth surface
Juilland et al 2009

0 6 12 18 24 30
0.0
0.5
1.0
1.5
2.0
Ra
te o
f h
ea
t [m
W/g
]
Time [h]
Alite, 82 m: reference
Alite, 82 m: 650°C during 6h
Alite, 38 m: reference
Alite, 38 m: 650°C during 6h
w/c = 0.4
Hand mixing for 2 min
Effect of annealing
Juilland 2009
Critical role of defects in reactivity:
Cannot be explained by protective membrane theory

-45
-40
-35
-30
-25
-20
-15
-10
-5
0
-140 -120 -100 -80 -60 -40 -20 0
lnP
r (µ
M/s
/g)
G*first pit/RT
-45
-40
-35
-30
-25
-20
-15
-10
-5
0
-140 -120 -100 -80 -60 -40 -20 0
lnP
r (µ
M/s
/g)
G*first pit/RT
Evolution of the rate of dissolution
Juilland et al 2009
From theory Nicoleau et al 2011
From experiment
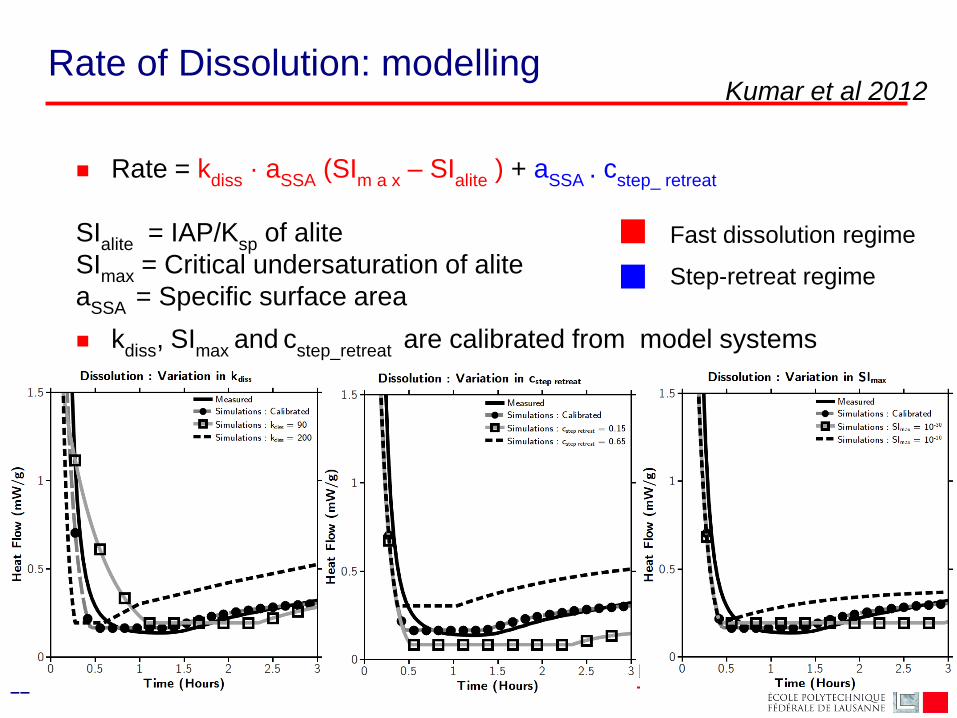
Rate of Dissolution: modelling
Rate = kdiss
· aSSA
(SIm a x
– SIalite
) + aSSA
. cstep_ retreat
SIalite
= IAP/Ksp
of alite
SImax
= Critical undersaturation of alite
aSSA
= Specific surface area
kdiss
, SImax
and c
step_retreat are calibrated from model systems
12
Fast dissolution regime
Step-retreat regime
Kumar and Scrivener 2011
Kumar et al 2012

Induction period, summary
No evidence for protective layer,
cannot explain many experimental results
Dissolution as a function of undersaturation:
Based on solid theoretical foundation from geochemistry;
Excellent agreement between, theory, experimental measurement
of dissolution and modelling fit to calorimetry curves;
Can explain all experimental observations.
13

Kinetics are key, but underlying mechanisms not well understood
~10 h
Accele
rati
on
peri
od
~3 h
Ind
ucti
on
peri
od
Decele
rati
on
peri
od
~24 h
He
at e
vo
lutio
n
Why does the initial
rapid reaction slow down? What limits this
phase of reaction?

2 hrs
End of induction period growth of C-S-H (& CH)
5 hrs
10 hrs 15 hrs

16
Need model to handle complexity µic: vector model covering wide range of PSDs
Bishnoi 2008
• Not digitised – no lower resolution micron to nanometre
• Products in pore space and around grains
• Integrated kinetics
• Fast and flexible
2 hours for 20,000,000 particles
down to <0.1 µm size

Fully flexible microstructural development
x% on reacting particle
y% in pores
z% on filler particles
or
Deposit in proportion to area available
on reactive and filler particles
Variants
?
Bishnoi 2008
17


classic, compact product
Bishnoi 2008
Modelling Nucleation and growth

Classic Boundary Nucleation and Growth
Deceleration not captured
Bishnoi 2008
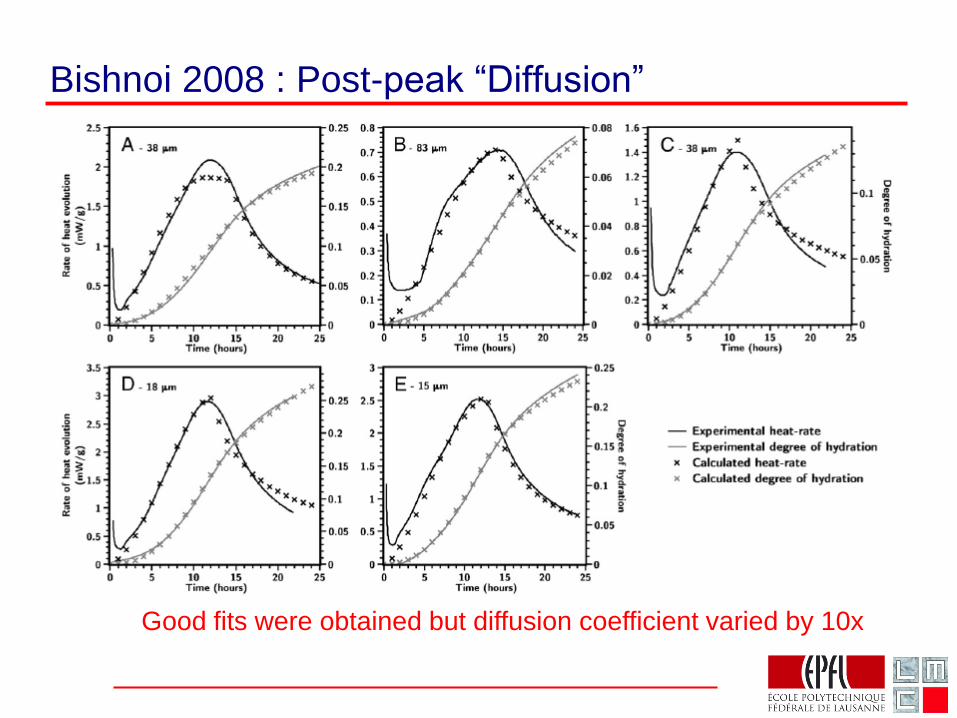
Bishnoi 2008 : Post-peak “Diffusion”
Good fits were obtained but diffusion coefficient varied by 10x

Layer at peak
0
0.5
1
1.5
2
2.5
3
3.5
4
4.5
5
5.5
0 0.2 0.4 0.6 0.8 1 1.2
e (C-S-H thickness), microns
Rate
of
Hyd
rati
on
, %
PSD-6microns PSD-18microns PSD-38microns PSD-82microns
Costoya 2008

• Same C-S-H for different particle sizes, why should diffusion coefficient
vary by 10X
• Success of maturity approaches: same activation energy throughout
main hydration peak
• Bond breaking / making processes typically have Ea > 40 kJ/mol
• Transport controlled processes have Ea <~20 kJ/mol
• Low density region inside “shell”
does not fill in until much later
Evidence that diffusion control does not occur at peak maximum

In fact C-S-H hydrates do not grow in uniform compact manner
Richardson 1999
Richardson 1999

Mechanism of rapid outward growth in diffuse manner (low packing density) then densification
Bishnoi 2008

Diffuse nucleation and growth
Studying nucleation and gowth of C-S-H using µic - Shashank Bishnoi, Karen L. Scrivener
Cement and Concrete Research, 39, (10), October 2009, 849-860
Bishnoi 2008 :
Insights on C-S-H from 1H NMR

Solid echo pulse sequence: Water in Portlandite
CPMG pulse sequence: interlayer water, C-S-H gel, capillary pore water
[ P. J. McDonald]
1H Nuclear Magnetic Resonance

-0.5
1.5
3.5
5.5
7.5
9.5
1.000E-06 1.000E-05 1.000E-04 1.000E-03 1.000E-02 1.000E-01
Sig
na
l In
ten
sit
y (
a.u
)
T2 Relaxation time
2 d.
6 d.
7 d.
14 d.
62 d.
24 h.
12 h.
6 h.
28 m.
10 µs 100 µs 1 ms 10 ms 0.1 s
Interlayer water (1 nm) Gel water (3-4 nm)
Water in Ca(OH)2
1.05
9.53
9.87
8.72
5.45
8.67
7.02
4.22
Capillary
water
Evolution of pore structures with hydration

0.0
0.1
0.2
0.3
0.4
0.5
0.6
0.7
0.8
0.9
1.0
0.0 0.1 1.0 10.0 100.0
Sig
na
l fr
ac
tio
n
Age (days)
Water in Portlandite
Interlayer water
Gel water
Capillary water
TRANSCEND ITN: project 7 Arnaud Muller, EPFL with Peter McDonald and Agata Gajewicz, U Surrey, UK
White Cement paste W/C = 0.40

0.0
0.1
0.2
0.3
0.4
0.5
0.6
0.7
0.8
0.9
1.0
0.0 0.1 1.0 10.0 100.0
Sig
na
l fr
ac
tio
n
Age (days)
Water in Portlandite
Interlayer water
Gel water
Capillary water
3 nm
White Cement paste W/C = 0.40
TRANSCEND ITN: project 7 Arnaud Muller, EPFL with Peter McDonald and Agata Gajewicz, U Surrey, UK
Evolution of pore structures with hydration

0
0.1
0.2
0.3
0.4
0.5
0.6
0.7
0.8
0.9
1
0.00 0.20 0.40 0.60 0.80 1.00
Cu
mm
ula
tive
vo
lum
e (
cc
) / g
of
an
hyd
rou
s c
em
en
t
Degree of Hydration
C1.69-S-H1.77
ρ = 2.44 ± 0.07
Voids
Ca(OH)2 Cement
Gel water
Inter-
hydrate Cap. water
TRANSCEND ITN: project / Arnaud Muller, EPFL with Peter McDonald and Agata Gajewicz, U Surrey, UK

C-S-H “density”
33
Nanocrystalline “solid”
“bulk” including gel pores
Substantial experimental evidence for “densification”
However current mathematical representation of densifying
growth does not fit all evidence
Little evidence to support conventional views of diffusion
control.
34
PHYSICAL STRUCTURE: Pore structure
35

Conventional categories of pores structure
10-10
10-9 10
-8 10
-7 10
-6 10
-5 10
-4 10
-3 10
-2
nm m mm
gel
pores
Air voids
and compaction voids capillary pores

HRLn
1cosT2
RT
MR lpK
0.1 µm
99 % RH
Filled pores as a function of RH: Kelvin Laplace equation

Problems of characterising pore structure
Conventional methods require prior drying
Mercury Intrusion porosity most widely used, but much maligned
New results from proton NMR show what is happening in undried
materials
Turns out MIP is not too bad if you understand what is happening

Mercury porosimetry
Intrusion of non-wetting fluid: mercury
Rp
Increasing presssure
Pr
2 cos
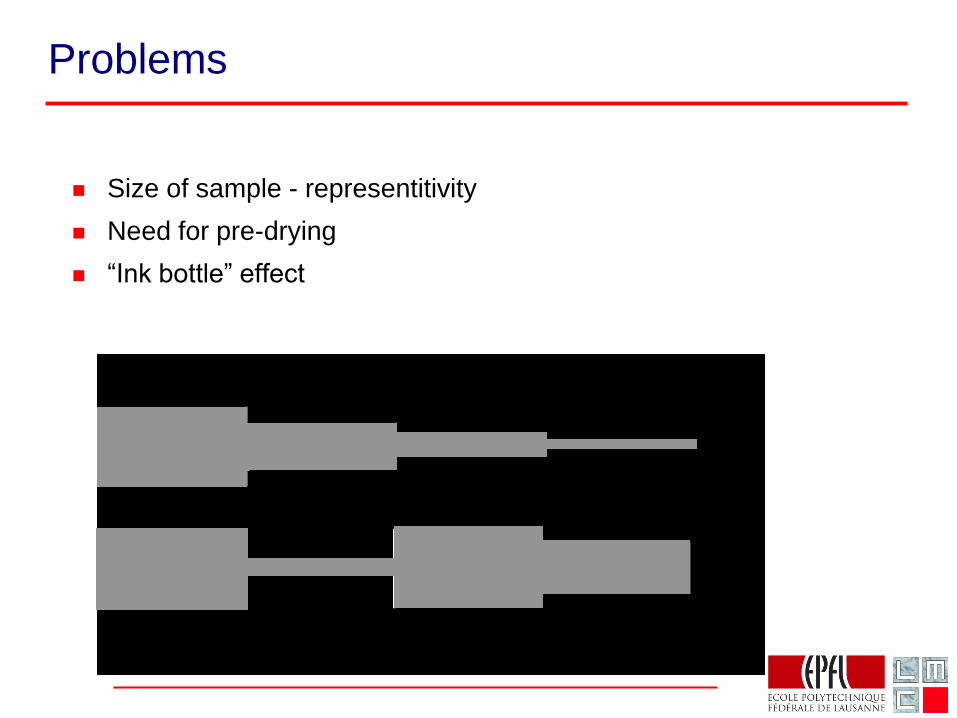
Problems
Size of sample - representitivity
Need for pre-drying
“Ink bottle” effect

Increasing presssure
1 pixel =
1nm
512x512
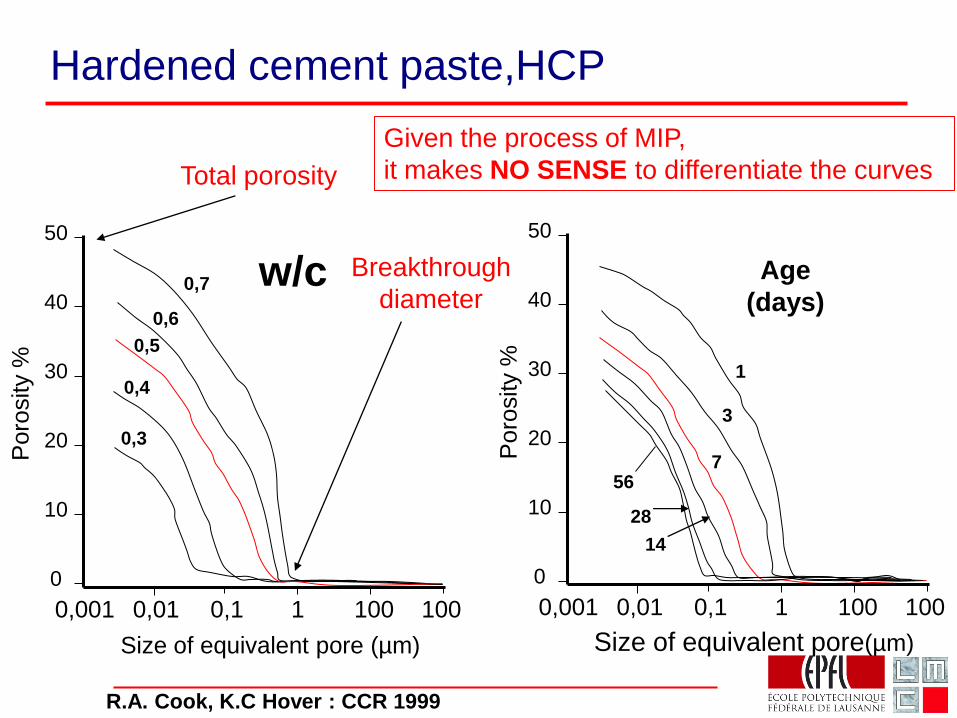
Hardened cement paste,HCP
R.A. Cook, K.C Hover : CCR 1999
Poro
sity %
0,7
0,6
50
40
30
20
10
0
100 100 1 0,1 0,01 0,001
Size of equivalent pore (µm)
0,5
0,4
0,3
50
40
30
20
10
0
100 100 1 0,1 0,01 0,001
Size of equivalent pore(µm)
Po
rosity %
1
3
7
14
28
56
Age
(days) w/c Breakthrough
diameter
Total porosity
Given the process of MIP,
it makes NO SENSE to differentiate the curves

MIP experiment and MIP simulation results of pore-structure
0
0.1
0.2
0.3
0.4
0.5
0.001 0.01 0.1 1
Radius (micron)
Vo
lum
e f
ra
cti
on
(%
)
8% (6hours) DoH experiment 23% (12hours) DoH experiment 60% (3 days) DoH experiment
8% DoH, Simulation (C-S-H den=0.9) 23% DoH, Simulation (C-S-H den=1.5) 60% DoH, Simulation (C-S-H den=1.9)
Comparison of MIP and model output
Need to assume changing density of C-S-H

C-S-H “density”
44
Nanocrystalline “solid”
“bulk” including gel pores

0.0
0.1
0.2
0.3
0.4
0.5
0.6
0.7
0.8
0.9
1.0
0.0 0.1 1.0 10.0 100.0
Sig
na
l fr
ac
tio
n
Age (days)
Water in Portlandite
Interlayer water
Gel water
Capillary water
3 nm
White Cement paste W/C = 0.40
TRANSCEND ITN: project 7 Arnaud Muller, EPFL with Peter McDonald and Agata Gajewicz, U Surrey, UK
Evolution of pore structures with hydration

MIP experiment and MIP simulation results of pore-structure
0
0.1
0.2
0.3
0.4
0.5
0.001 0.01 0.1 1
Radius (micron)
Vo
lum
e f
ra
cti
on
(%
)
8% (6hours) DoH experiment 23% (12hours) DoH experiment 60% (3 days) DoH experiment
8% DoH, Simulation (C-S-H den=0.9) 23% DoH, Simulation (C-S-H den=1.5) 60% DoH, Simulation (C-S-H den=1.9)
Comparison of MIP and model output
Wide discrepancy in breakthrough diameter

Is this really surprising when we see how C-S-H is growing.
No currently available
microstructural model can
capture this complexity
Alite paste 25 hours

Slag blend w/c =0.45 at 5 years.

5 year old white cement paste w/c=0.4

Summary
Induction period is governed by the undersaturation of the solution –
there is no protective layer. The theoretical support for this
mechanism is well established and allows the effects of many
experimental parameters to be explained and modelled.
The mechanisms governing the main heat evolution peak still need
clarification. However space filling almost certainly plays and
important role – we will come back to this when we talk about SCMs
The new findings on the space filling of C-S-H have important
implications . Powers model needs to be refined to take into account
that the capillary and gel porosity are not linear functions of the
degree of hydration.
There are also profound implications for durability. Beam bending
experiments to measure permeability in pastes show very low values-
Practical measurements on concrete are almost certainly dominated
by (micro)cracks.

Cement Chemistry for Engineers, Cape Town 31st January 2013
End Lecture 3