lecture 3 mass spectrometry 2013 - ndsumcclean/plsc411/lecture 3 mass... · 11/29/2012 2 principles...
TRANSCRIPT
11/29/2012
1
Mass Spectrometry
MALDI-TOF
ESI/MS/MS
Mass spectrometer
• Basic components– Ionization source
– Mass analyzer
– Detector
11/29/2012
2
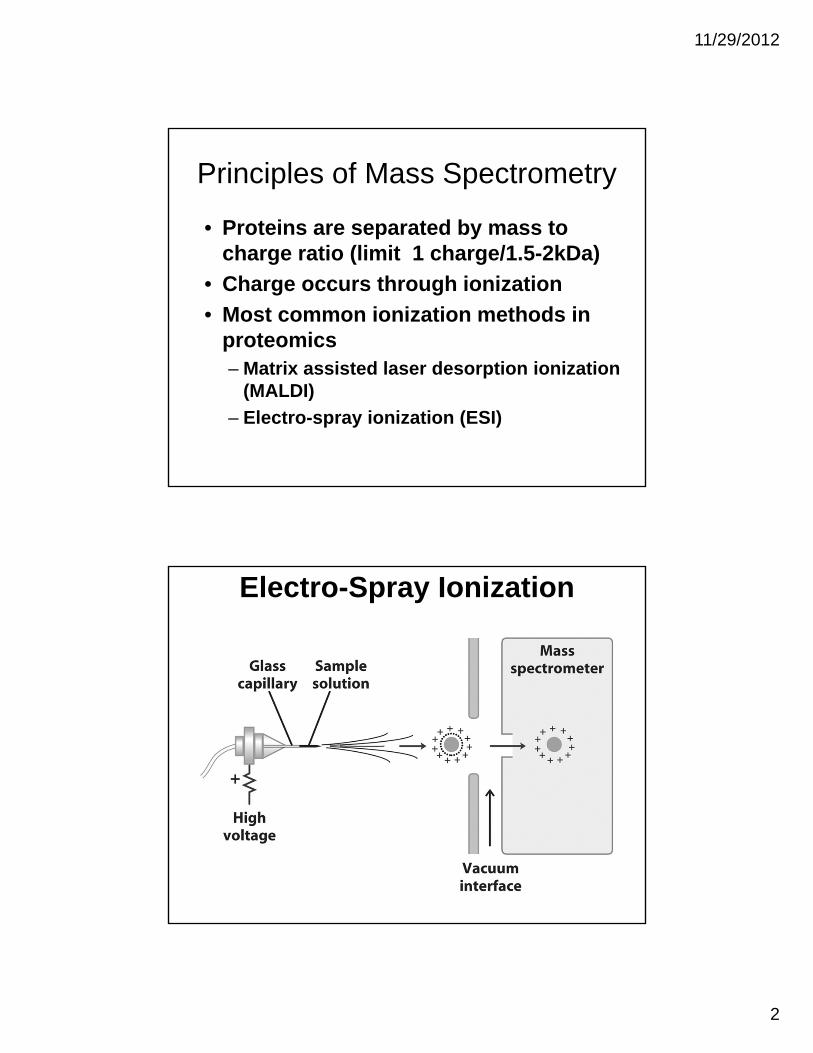
Principles of Mass Spectrometry
• Proteins are separated by mass to charge ratio (limit 1 charge/1.5-2kDa)
• Charge occurs through ionization
• Most common ionization methods in proteomics– Matrix assisted laser desorption ionization
(MALDI)
– Electro-spray ionization (ESI)
Electro-Spray Ionization

11/29/2012
3
ESI• Advantages
– Samples are in solution– Small sample volumes and sizes (l/min)– Can be coupled to HPLC
• (nano-HPLC or UHPLC)
– Can be run in both positive and negative mode– Results in multiple charging so larger proteins
can be measured
• Disadvantages– Not all molecules will ionize– High maintenance– Only uses small fraction of the sample
Multiple charging of Proteins
200 1000 2000m/z
+7
1766.6
+8
1545.7
+9
1374.2
+10
1236.9
+11
1124.6
+12
1031.0
+13
951.8
+14
884.0
+15
825.0
+16
772.4
+17
727.5
0
50
100
Re
lativ
e A
bu
nda
nce
Cytochrome C
Charge size est MW
17 727.50 12367.50
16 772.40 12358.40
15 825.00 12375.00
14 884.00 12376.00
13 951.80 12373.40
12 1031.00 12372.00
11 1124.60 12370.60
10 1236.90 12369.00
9 1374.20 12367.80
8 1545.70 12365.607 1766.60 12366.20
Avg 12369.23
Stdev 4.77
11/29/2012
4
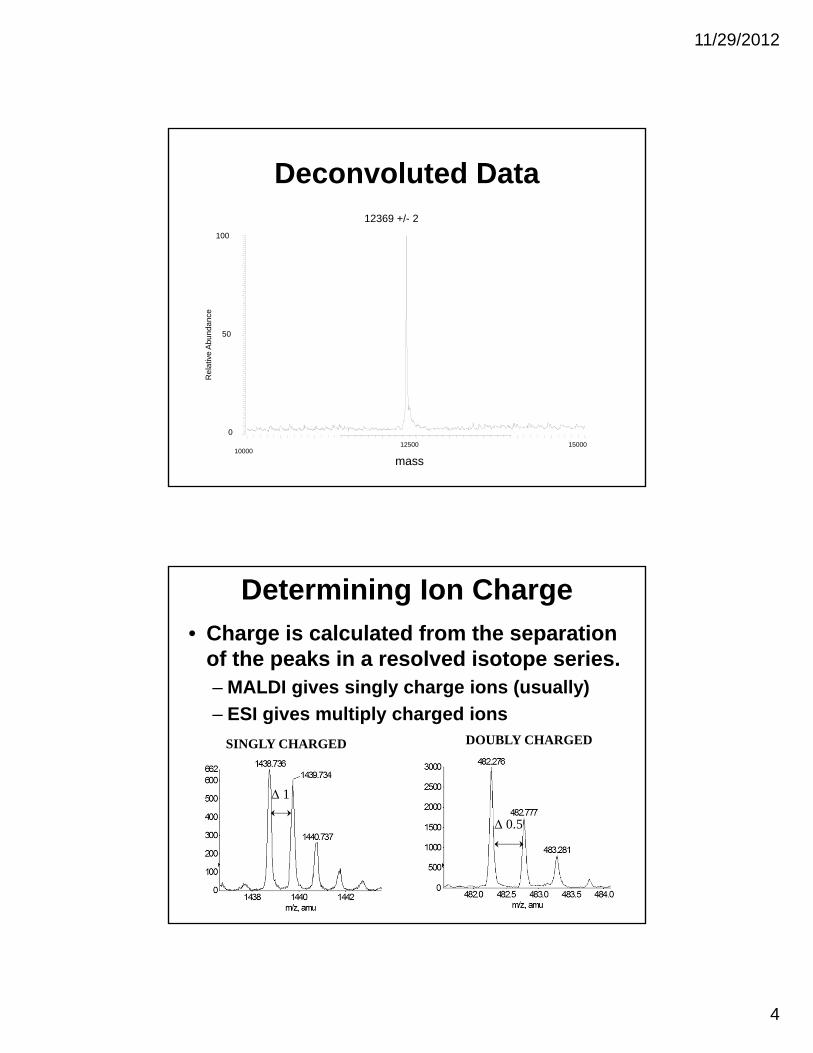
Deconvoluted Data
10000
mass
12500 15000
0
50
100
Re
lativ
e A
bu
nda
nce
12369 +/- 2
Determining Ion Charge
• Charge is calculated from the separation of the peaks in a resolved isotope series. – MALDI gives singly charge ions (usually)
– ESI gives multiply charged ions
SINGLY CHARGED
1
DOUBLY CHARGED
0.5

11/29/2012
5
Matrix Assisted Laser Desorption Ionization
• Samples are mixed with a matrix and placed on the surface of a target
• Target is placed inside the vacuum of MS
• Samples are ionized by high energy laser
• Most/all samples ionize
• Usually single charge
MALDI
11/29/2012
6
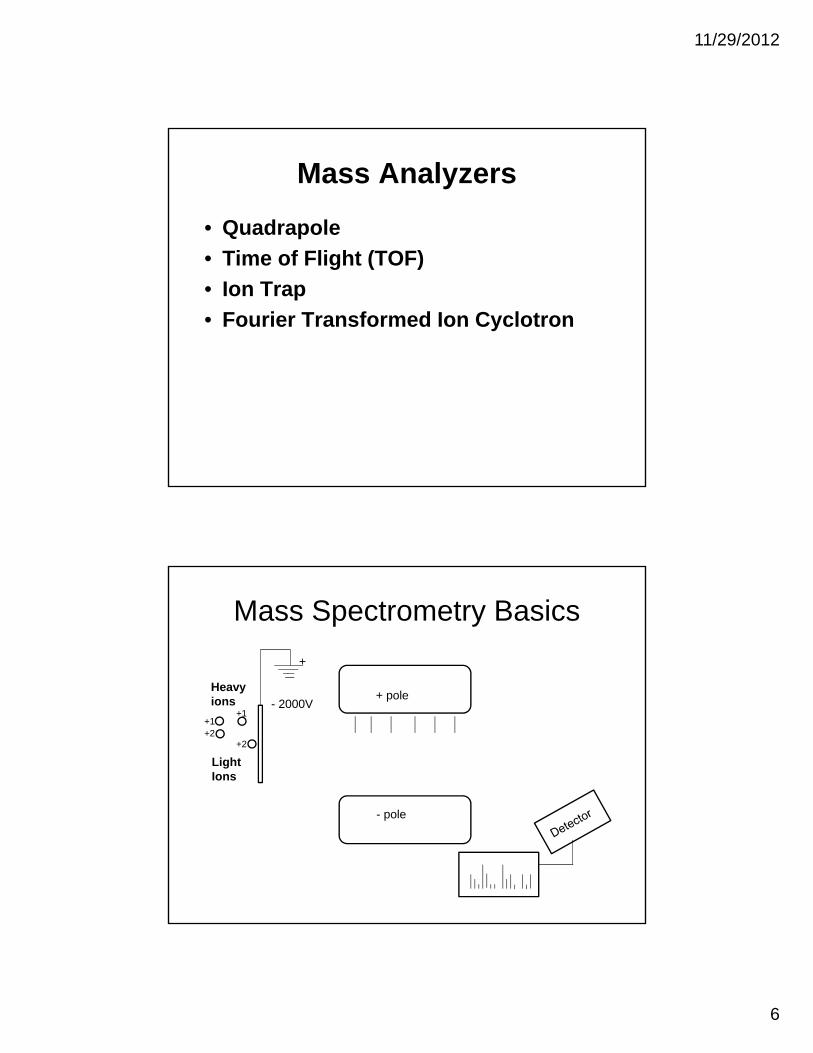
Mass Analyzers
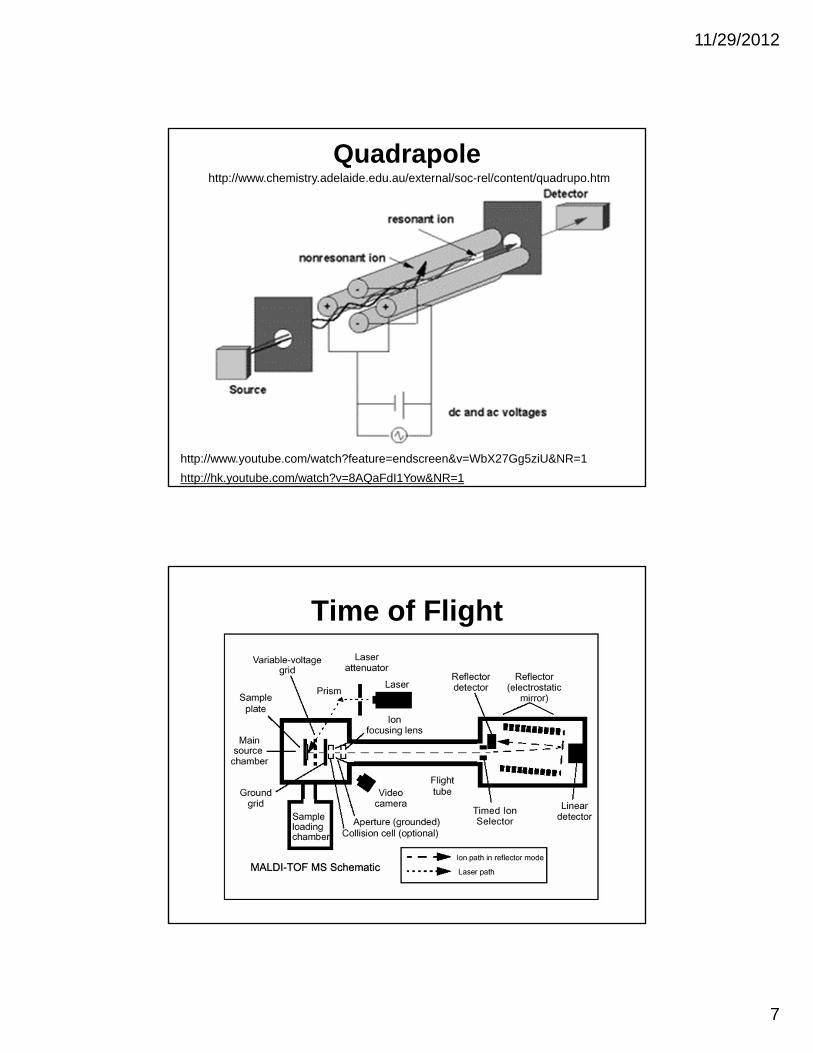
• Quadrapole
• Time of Flight (TOF)
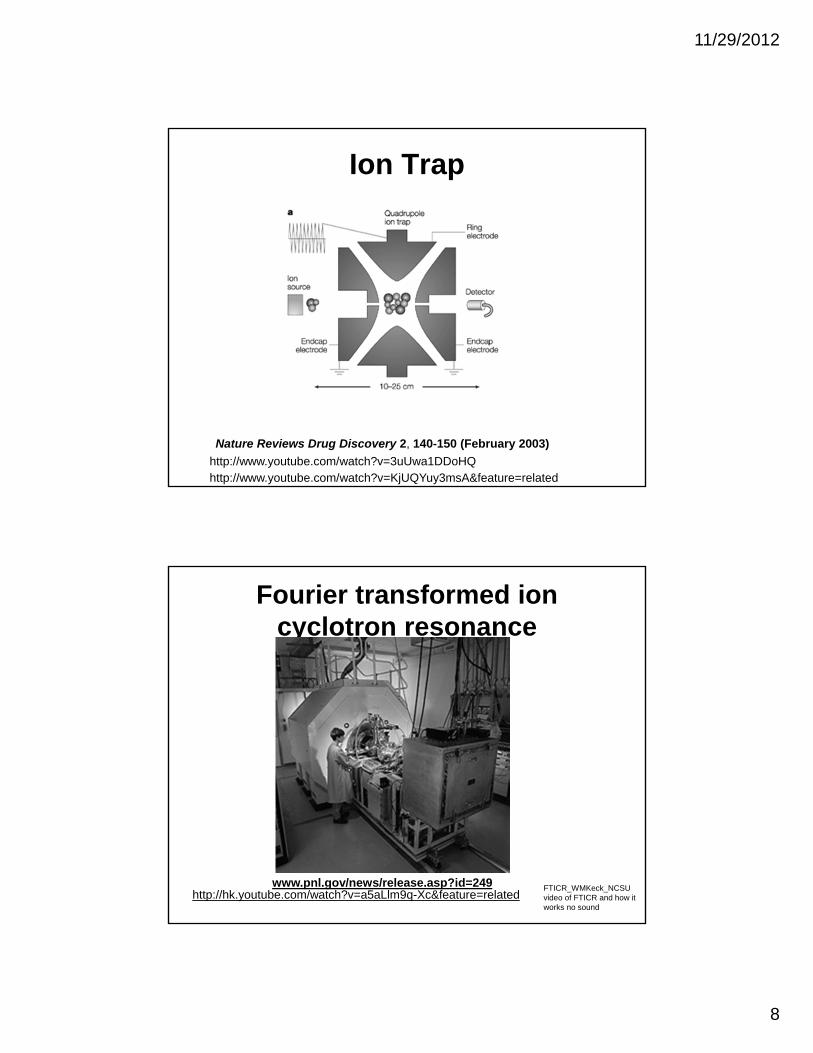
• Ion Trap
• Fourier Transformed Ion Cyclotron
- 2000V
+
Mass Spectrometry Basics
+2+2
+1+1
+ pole
- pole
Heavy ions
Light Ions
11/29/2012
7
Quadrapole
http://hk.youtube.com/watch?v=8AQaFdI1Yow&NR=1
http://www.chemistry.adelaide.edu.au/external/soc-rel/content/quadrupo.htm
http://www.youtube.com/watch?feature=endscreen&v=WbX27Gg5ziU&NR=1
Time of Flight
11/29/2012
8
Ion Trap
Nature Reviews Drug Discovery 2, 140-150 (February 2003)
http://www.youtube.com/watch?v=KjUQYuy3msA&feature=relatedhttp://www.youtube.com/watch?v=3uUwa1DDoHQ
Fourier transformed ion cyclotron resonance
http://hk.youtube.com/watch?v=a5aLlm9q-Xc&feature=relatedwww.pnl.gov/news/release.asp?id=249 FTICR_WMKeck_NCSU
video of FTICR and how it works no sound
11/29/2012
9
Using MS Data
• So how do we use these?– Full mass
– Mass of complexes
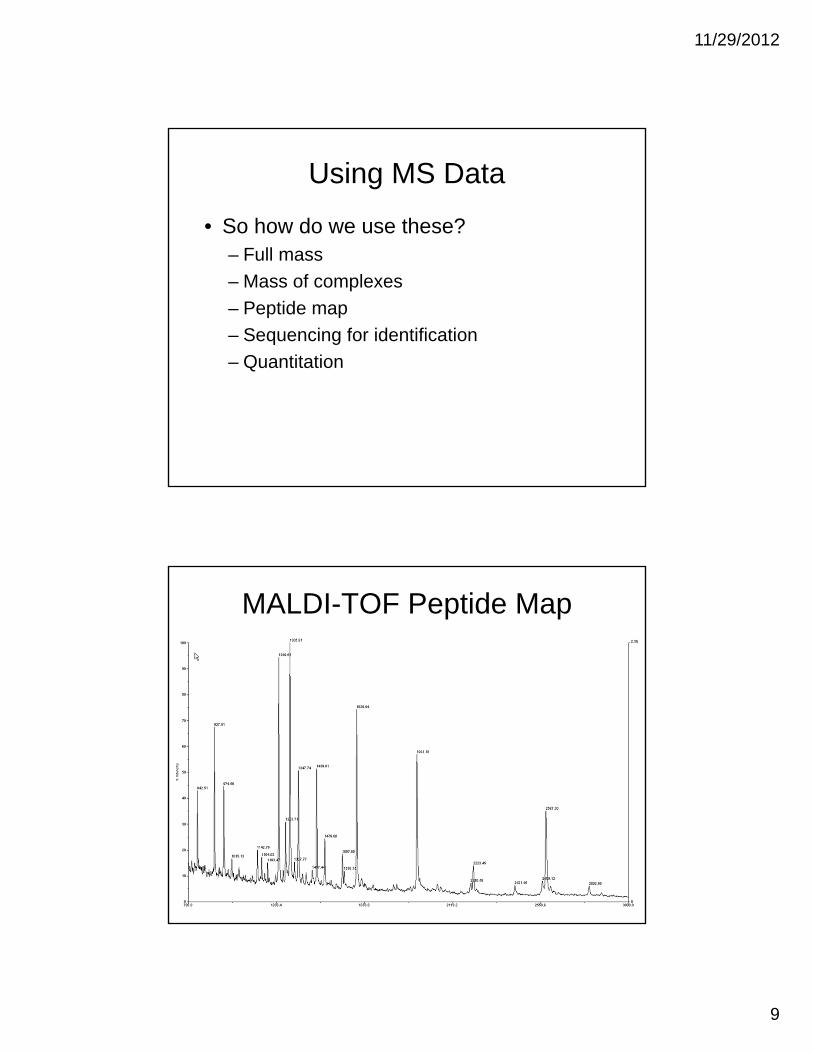
– Peptide map
– Sequencing for identification
– Quantitation
MALDI-TOF Peptide Map

11/29/2012
10
Protein Sequencing
• Process– Protein digested with protease
• Typically trypsin which cleaves at K and R
– Peptides separated by HPLC (nano-HPLC)– Analyzed by MS/MS
• Several problems exist– De novo sequencing is very difficult– Fragments may be too large or not sufficiently
charged– Poor ionization of fragments– Post translational modifications
MS sequencing1. Sample is injected into
reverse phase HPLC and peptides separated.
2. Fragments are separated by mass in first quadrapole mass analyzer
3. Selected ions enter second quadrapole analyzer and mixed with argon to fragment peptides.
4. Daughter ions are analyzed by TOF mass spectrometer.

11/29/2012
11
Fragmentation of Peptides
http://www.matrixscience.com/help/fragmentation_help.html
Peptide Sequence
100
0250 500 750 1000
m/z
% I
nten
sity
K
1166
L
1020
E
907
D
778
E
663
E
534
L
405
F
292
G
145
S
88 b ions
147260389504633762875102210801166 y ions

11/29/2012
12
Amino Acid Masses
Amino acid Mass(avg) Amino acid Mass(avg)
G 57.0520 D 115.0886
A 71.0788 Q 128.1308
S 87.0782 K 128.1742
P 97.1167 E 129.1155
V 99.1326 M 131.1986
T 101.1051 H 137.1412
C 103.1448 F 147.1766
I 113.1595 R 156.1876
L 113.1595 Y 163.1760
N 114.1039 W 186.2133
Ambiguous MassesAmino acid combination
Mass
(amu)
Single amino acid
Acetylated amino acid
Mass
(amu)
Unmodified amino acid
G-G 114.104 N 114.1039
Ac-G 99.09 V 99.1236
G-A 128.1308 K/Q 128.1308 128.1742
Ac-A 113.1225 L/I 113.1595
V-G 156.1378 R 156.1876
Ac-S 129.1219 E 129.1155
G-E 186.1675 W 186.2133
Ac-N 156.1509 R 156.1876
A-D 186.1674 W 186.2133
S-V 186.2108 W186.2133
11/29/2012
13
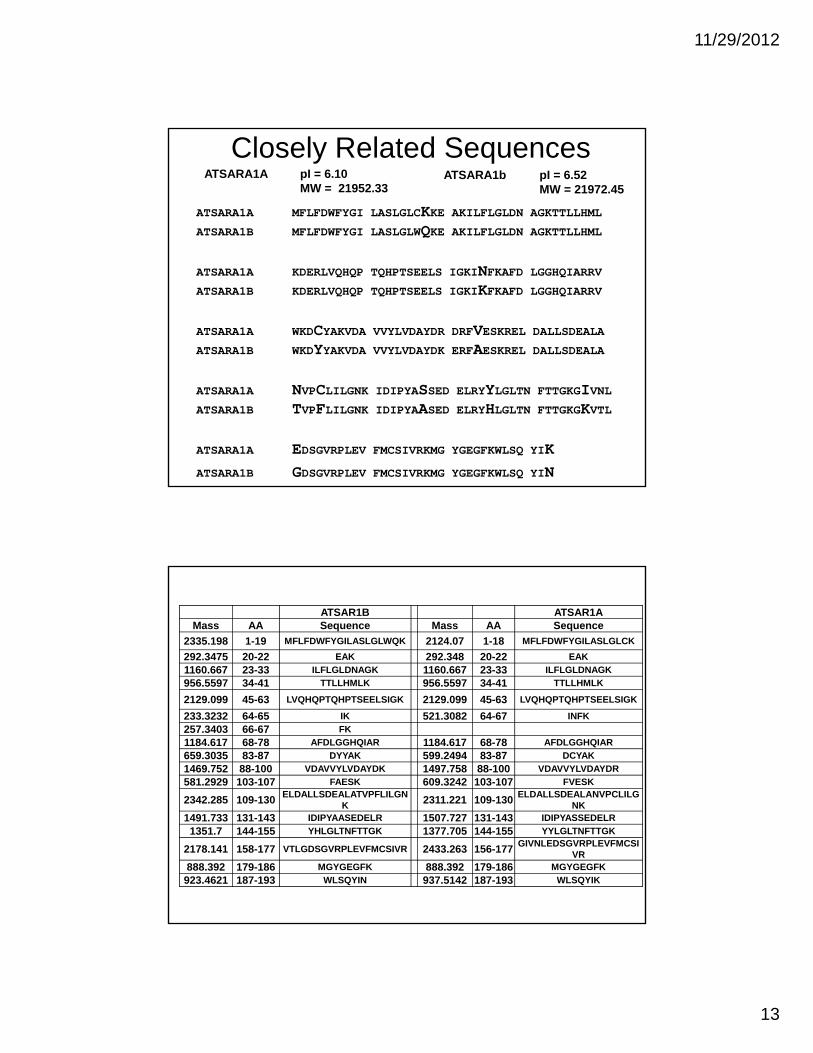
Closely Related Sequences
ATSARA1A MFLFDWFYGI LASLGLCKKE AKILFLGLDN AGKTTLLHML ATSARA1B MFLFDWFYGI LASLGLWQKE AKILFLGLDN AGKTTLLHML
ATSARA1A KDERLVQHQP TQHPTSEELS IGKINFKAFD LGGHQIARRV ATSARA1B KDERLVQHQP TQHPTSEELS IGKIKFKAFD LGGHQIARRV
ATSARA1A WKDCYAKVDA VVYLVDAYDR DRFVESKREL DALLSDEALA ATSARA1B WKDYYAKVDA VVYLVDAYDK ERFAESKREL DALLSDEALA
ATSARA1A NVPCLILGNK IDIPYASSED ELRYYLGLTN FTTGKGIVNL ATSARA1B TVPFLILGNK IDIPYAASED ELRYHLGLTN FTTGKGKVTL
ATSARA1A EDSGVRPLEV FMCSIVRKMG YGEGFKWLSQ YIK
ATSARA1B GDSGVRPLEV FMCSIVRKMG YGEGFKWLSQ YIN
ATSARA1A pI = 6.10MW = 21952.33
ATSARA1b pI = 6.52 MW = 21972.45
ATSAR1B ATSAR1AMass AA Sequence Mass AA Sequence
2335.198 1-19 MFLFDWFYGILASLGLWQK 2124.07 1-18 MFLFDWFYGILASLGLCK
292.3475 20-22 EAK 292.348 20-22 EAK
1160.667 23-33 ILFLGLDNAGK 1160.667 23-33 ILFLGLDNAGK
956.5597 34-41 TTLLHMLK 956.5597 34-41 TTLLHMLK
2129.099 45-63 LVQHQPTQHPTSEELSIGK 2129.099 45-63 LVQHQPTQHPTSEELSIGK
233.3232 64-65 IK 521.3082 64-67 INFK
257.3403 66-67 FK
1184.617 68-78 AFDLGGHQIAR 1184.617 68-78 AFDLGGHQIAR
659.3035 83-87 DYYAK 599.2494 83-87 DCYAK
1469.752 88-100 VDAVVYLVDAYDK 1497.758 88-100 VDAVVYLVDAYDR
581.2929 103-107 FAESK 609.3242 103-107 FVESK
2342.285 109-130ELDALLSDEALATVPFLILGN
K 2311.221 109-130ELDALLSDEALANVPCLILG
NK1491.733 131-143 IDIPYAASEDELR 1507.727 131-143 IDIPYASSEDELR
1351.7 144-155 YHLGLTNFTTGK 1377.705 144-155 YYLGLTNFTTGK
2178.141 158-177 VTLGDSGVRPLEVFMCSIVR 2433.263 156-177GIVNLEDSGVRPLEVFMCSI
VR888.392 179-186 MGYGEGFK 888.392 179-186 MGYGEGFK
923.4621 187-193 WLSQYIN 937.5142 187-193 WLSQYIK
11/29/2012
14
How do we deal with this?
• Use available information– The genome
– Edman sequences
– Comparison to known proteins• Use programs such as Protein Prophet,
Sequest, Mascot, etc.
Sequencing with MS/MS
• Currently three main search engine programs are used to identify sequences rather than creating the sequence from the data.– SEQUEST (Xcor values > 1.9, 2.2, or 3.7 for
ions of 1, 2, or 3 charges are usually accurate)
– Mascot (Scores of >40-50 give good assignments)
– X!Tandem (hyperscore, the larger the better)

11/29/2012
15
Sequencing with MS/MS
• This process requires that the peptide be from a protein that the sequence is known.– From an organism with a sequenced and
anotated genome.
– Protein was purified and sequenced.
– Present in an EST library.
– Has identity or high similarity with a protein from another organism.
Quantification by MS
• SILAC (stable isotope labeling of amino acids in cell culture)– In vivo labeling with C13 or N15
• ICAT (Isotope coded affinity tag)
• iTRAQ (Isobaric tag for relative and absolute quantitation)
• Competing technology– DIGE (Differential Gel Electrophoresis)
11/29/2012
16
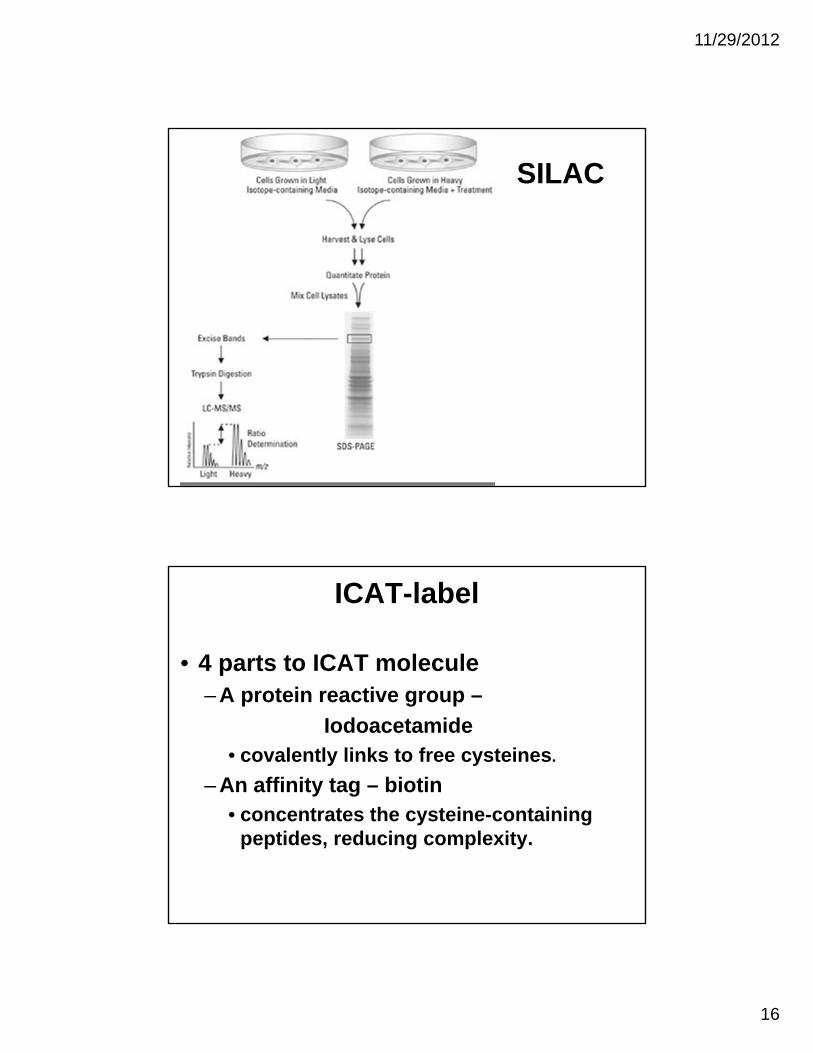
SILAC
ICAT-label
• 4 parts to ICAT molecule– A protein reactive group –
Iodoacetamide• covalently links to free cysteines.
– An affinity tag – biotin• concentrates the cysteine-containing
peptides, reducing complexity.

11/29/2012
17
ICAT-label
• An isotopically labeled linker (C10H17N3O3)– The linker chain can substitute up to nine 13C
atoms.
– The light and heavy molecules are chemically identical
– Comparison of labeled peptides provides a ratio of the protein concentration in the original sample.
• http://www.bio.davidson.edu/courses/GENOMICS/ICAT/ICAT.swf
ICAT-label
• An acid cleavage site: – remove biotin and part of the linker by
adding TFA.
– reduces the mass of the tag
– improves the overall peptide fragmentation efficiency.

11/29/2012
18
iTRAQ• Label up to 8 samples at once
• Amine specific labeling (lysine and N-terminal) (N-hydroxysuccinamide)
• Mass of all labels the same.– The tag consists of the reactive group, a
reporter molecule and a linker to balance the masses.
– During fragmentation in MS the reporter group is released.
• After fragmentation reporter labels are found between m/z 113 and m/z 121
• Ratio of peaks of reporter ions is proportional to relative concentrations.
11/29/2012
19
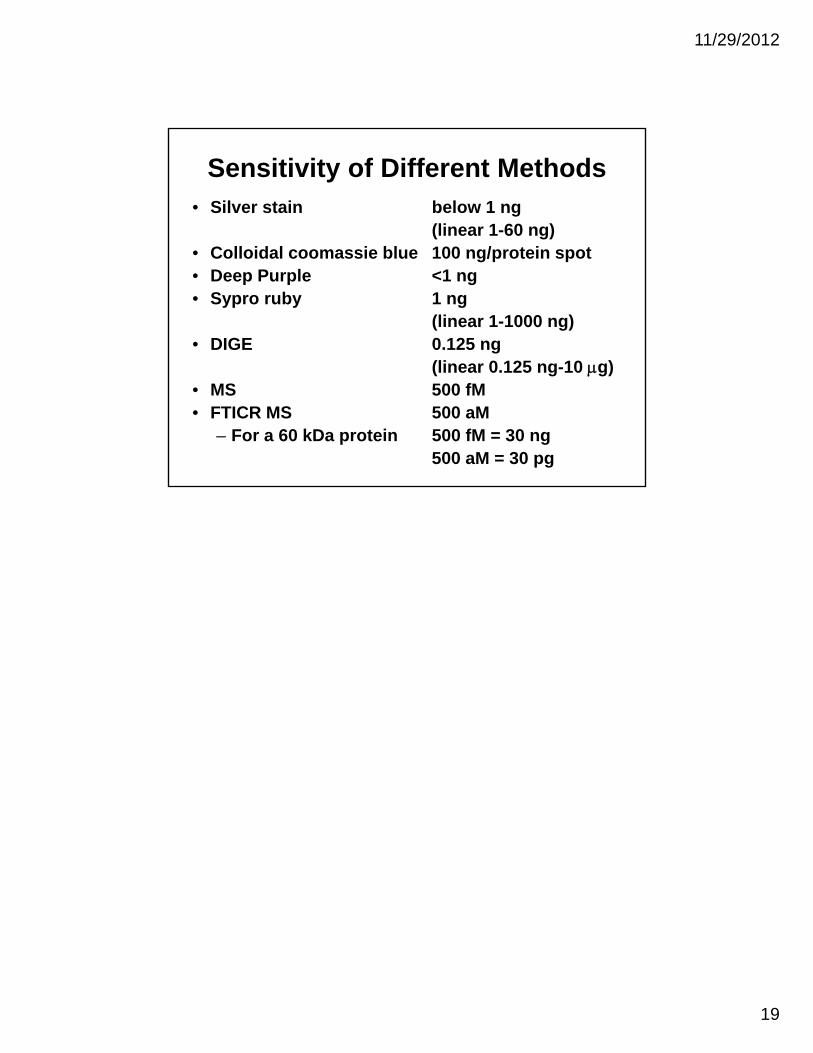
Sensitivity of Different Methods• Silver stain below 1 ng
(linear 1-60 ng)• Colloidal coomassie blue 100 ng/protein spot• Deep Purple <1 ng• Sypro ruby 1 ng
(linear 1-1000 ng)• DIGE 0.125 ng
(linear 0.125 ng-10 g)• MS 500 fM• FTICR MS 500 aM
– For a 60 kDa protein 500 fM = 30 ng 500 aM = 30 pg