lecture 4: drawing a triangle (and an intro to sampling)
TRANSCRIPT

Computer Graphics CMU 15-462/15-662
Lecture 4:
Drawing a Triangle (and an Intro to Sampling)

CMU 15-462/662
HW 0.5 due, HW 1 out!▪ GOAL: Implement a basic “rasterizer”
- (Topic of today’s lecture) - We hand you a bunch of lines, triangles, etc. - You draw them by lighting up pixels on the screen!
▪ Code skeleton available from course webpage
▪ First checkpoint due February 22nd.
▪ Completed assignment due March 1st.

CMU 15-462/662
TODAY: Rasterization▪ Two major techniques for “getting stuff on the screen”
▪ Rasterization (TODAY) - for each primitive (e.g., triangle), which pixels light up? - extremely fast (BILLIONS of triangles per second on GPU) - harder (but not impossible) to achieve photorealism - perfect match for 2D vector art, fonts, quick 3D preview, …
▪ Ray tracing (LATER) - for each pixel, which primitives are seen? - easier to get photorealism - generally slower - much more later in the semester!

CMU 15-462/662
3D Image Generation Pipeline(s)▪ Can talk about image generation in terms of a “pipeline”:
- INPUTS — what image do we want to draw?
- STAGES — sequence of transformations from input→output - OUTPUTS — the final image
VERTICESA: ( 1, 1, 1 ) E: ( 1, 1,-1 )B: (-1, 1, 1 ) F: (-1, 1,-1 )C: ( 1,-1, 1 ) G: ( 1,-1,-1 )D: (-1,-1, 1 ) H: (-1,-1,-1 )
EDGESAB, CD, EF, GH,AC, BD, EG, FH,AE, CG, BF, DH
p=(x,y,z)
q=(u,v)
1z
y
v
INPUT OUTPUTPERSPECTIVE PROJECTION
STAGE
LINE DRAWING
STAGE
E.g., our pipeline from the first lecture:

CMU 15-462/662
Rasterization Pipeline▪ Modern real time image generation based on rasterization
- INPUT: 3D “primitives”—essentially all triangles! - possibly with additional attributes (e.g., color)
- OUTPUT: bitmap image (possibly w/ depth, alpha, …) ▪ Our goal: understand the stages in between*
VERTICESA: ( 1, 1, 1 ) E: ( 1, 1,-1 )B: (-1, 1, 1 ) F: (-1, 1,-1 )C: ( 1,-1, 1 ) G: ( 1,-1,-1 )D: (-1,-1, 1 ) H: (-1,-1,-1 )
TRIANGLESEHF, GFH, FGB, CBG,GHC, DCH, ABD, CDB,HED, ADE, EFA, BAF
INPUT (TRIANGLES)
RASTERIZATION PIPELINE
OUTPUT (BITMAP IMAGE)
*In practice, usually executed by graphics processing unit (GPU)

CMU 15-462/662
▪ Rasterization pipeline converts all primitives to triangles - even points and lines!
▪ Why? - can approximate any shape - always planar, well-defined normal - easy to interpolate data at corners
- “barycentric coordinates”
▪ Key reason: once everything is reduced to triangles, can focus on making an extremely well-optimized pipeline for drawing them
Why triangles?
“point”“line”

CMU 15-462/662
The Rasterization PipelineRough sketch of rasterization pipeline:
▪ Reflects standard “real world” pipeline (OpenGL/Direct3D) – the rest is just details (e.g., API calls)
zx
y
Transform/position objects in the world
Project objects onto the screen
(0, 0)
(w, h)
Sample triangle coverage
Interpolate triangle attributes at covered samples
Sample texture maps / evaluate shaders
Combine samples into final image (depth, alpha, …)

CMU 15-462/662
Let’s draw some triangles on the screen
Question 2: which triangle is closest to the camera in each pixel? (“occlusion”)
Question 1: what pixels does the triangle overlap? (“coverage”)
Pixel

CMU 15-462/662
The visibility problem
Recall the pinhole camera…
Pinhole Camera
(0,0)
Virtual Sensor
(x,z)
1
x/zz-axis
x-axis

CMU 15-462/662
The visibility problem
Recall the pinhole camera… which we can simplify with a “virtual sensor”:
▪ Visibility problem in terms of rays: - COVERAGE: What scene geometry is hit by a ray from a pixel through the pinhole?
- OCCLUSION: Which object is the first hit along that ray?
Pinhole Camera
(0,0)
Virtual Sensor
(x,z)
1
x/z
z-axis
x-axis

CMU 15-462/662
Computing triangle coverage
Input: projected position of triangle vertices: P0, P1, P2
Output: set of pixels “covered” by the triangle
“Which pixels does the triangle overlap?”

CMU 15-462/662
What does it mean for a pixel to be covered by a triangle?
Pixel
1
2
3
4
Q: Which triangles “cover” this pixel?

CMU 15-462/662
One option: compute fraction of pixel area covered by triangle, then color pixel according to this fraction.
10%
35%
60%
85%
15%
Intuition: if triangle covers 10% of pixel, then pixel should be 10% red.

CMU 15-462/662
Coverage gets tricky when considering occlusion
Two regions of triangle 1 contribute to pixel. One of these regions is not even convex.
12 2
1
2
1
Interpenetration of triangles: even trickier
Pixel covered by triangle 1, other half covered by triangle 2
CMU 15-462/662
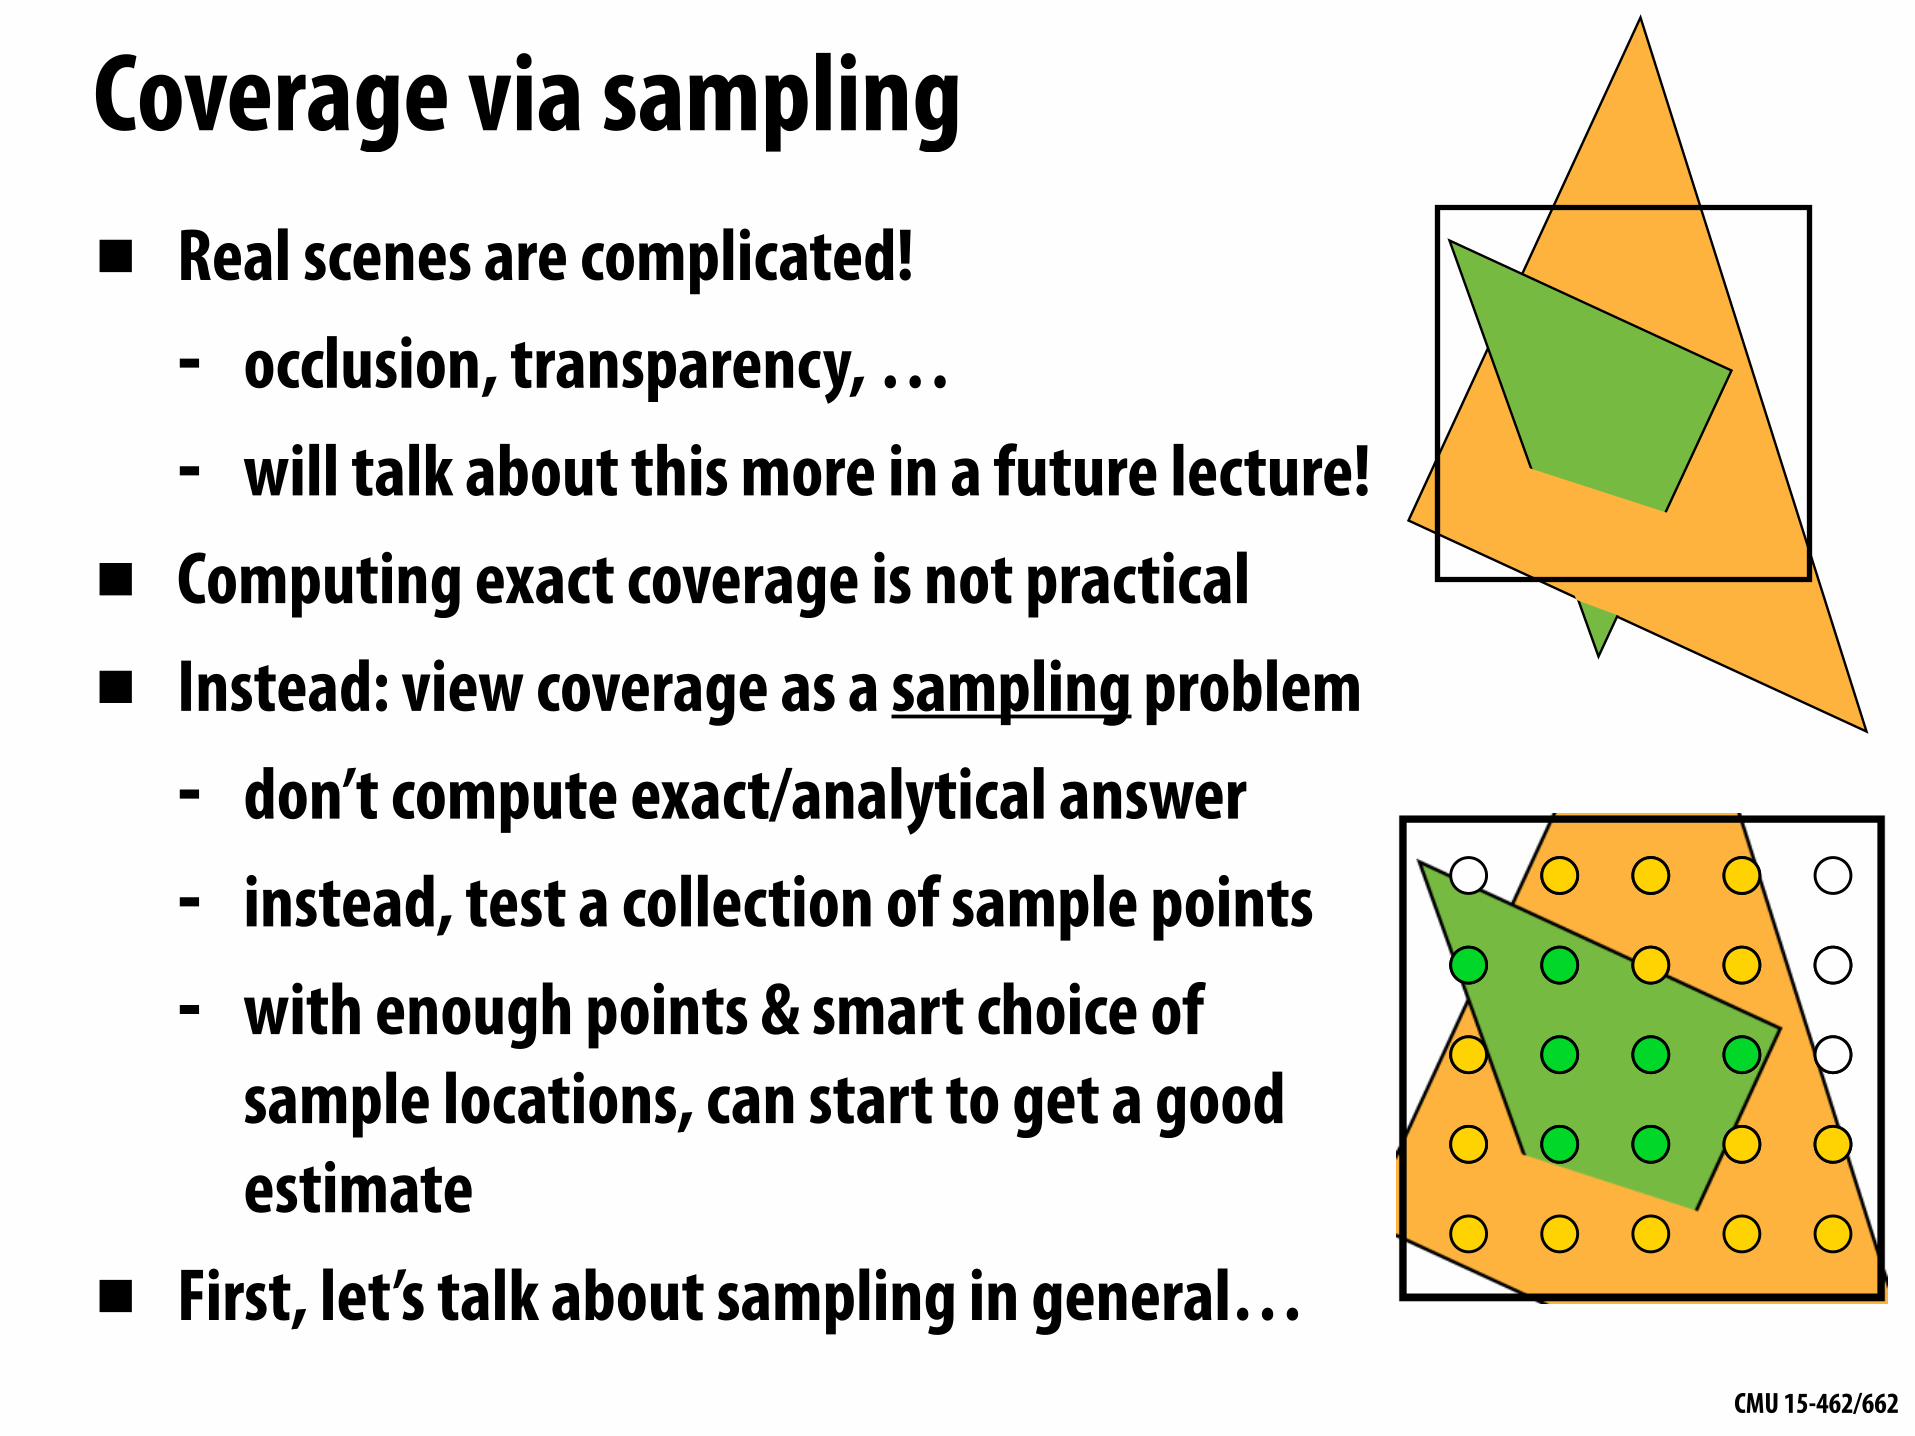
Coverage via sampling▪ Real scenes are complicated!
- occlusion, transparency, … - will talk about this more in a future lecture!
▪ Computing exact coverage is not practical
▪ Instead: view coverage as a sampling problem - don’t compute exact/analytical answer - instead, test a collection of sample points - with enough points & smart choice of
sample locations, can start to get a good estimate
▪ First, let’s talk about sampling in general…
CMU 15-462/662
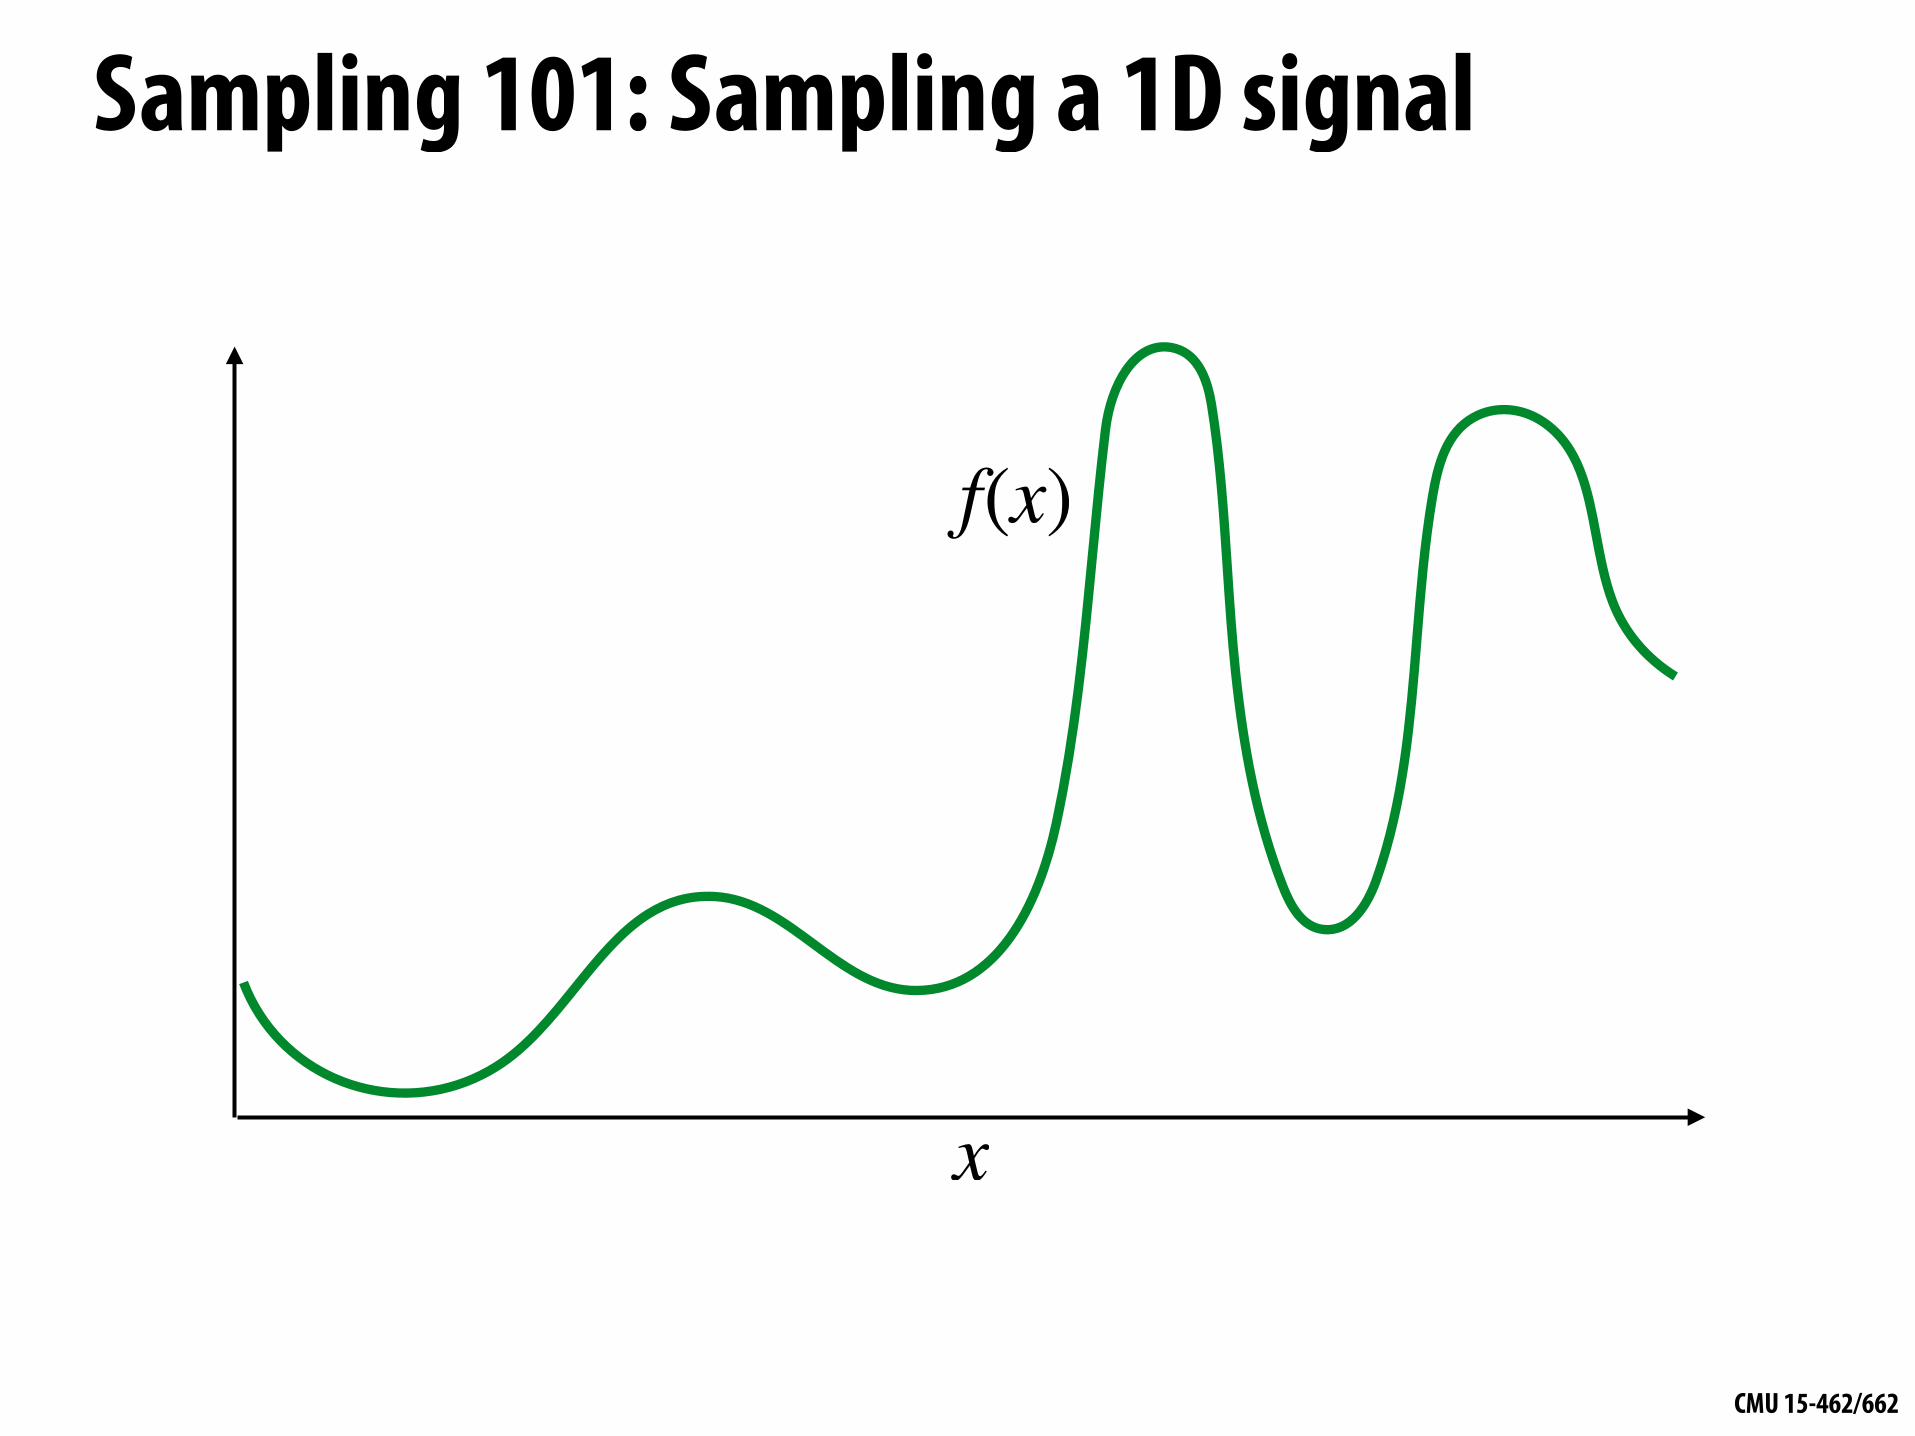
Sampling 101: Sampling a 1D signal
x
f(x)

CMU 15-462/662
Sampling = taking measurements of a signal
x1x0 x2 x3 x4
f(x0)f(x1) f(x2) f(x3)
f(x4)
f(x)
Below: 5 measurements (“samples”) of f(x)
CMU 15-462/662
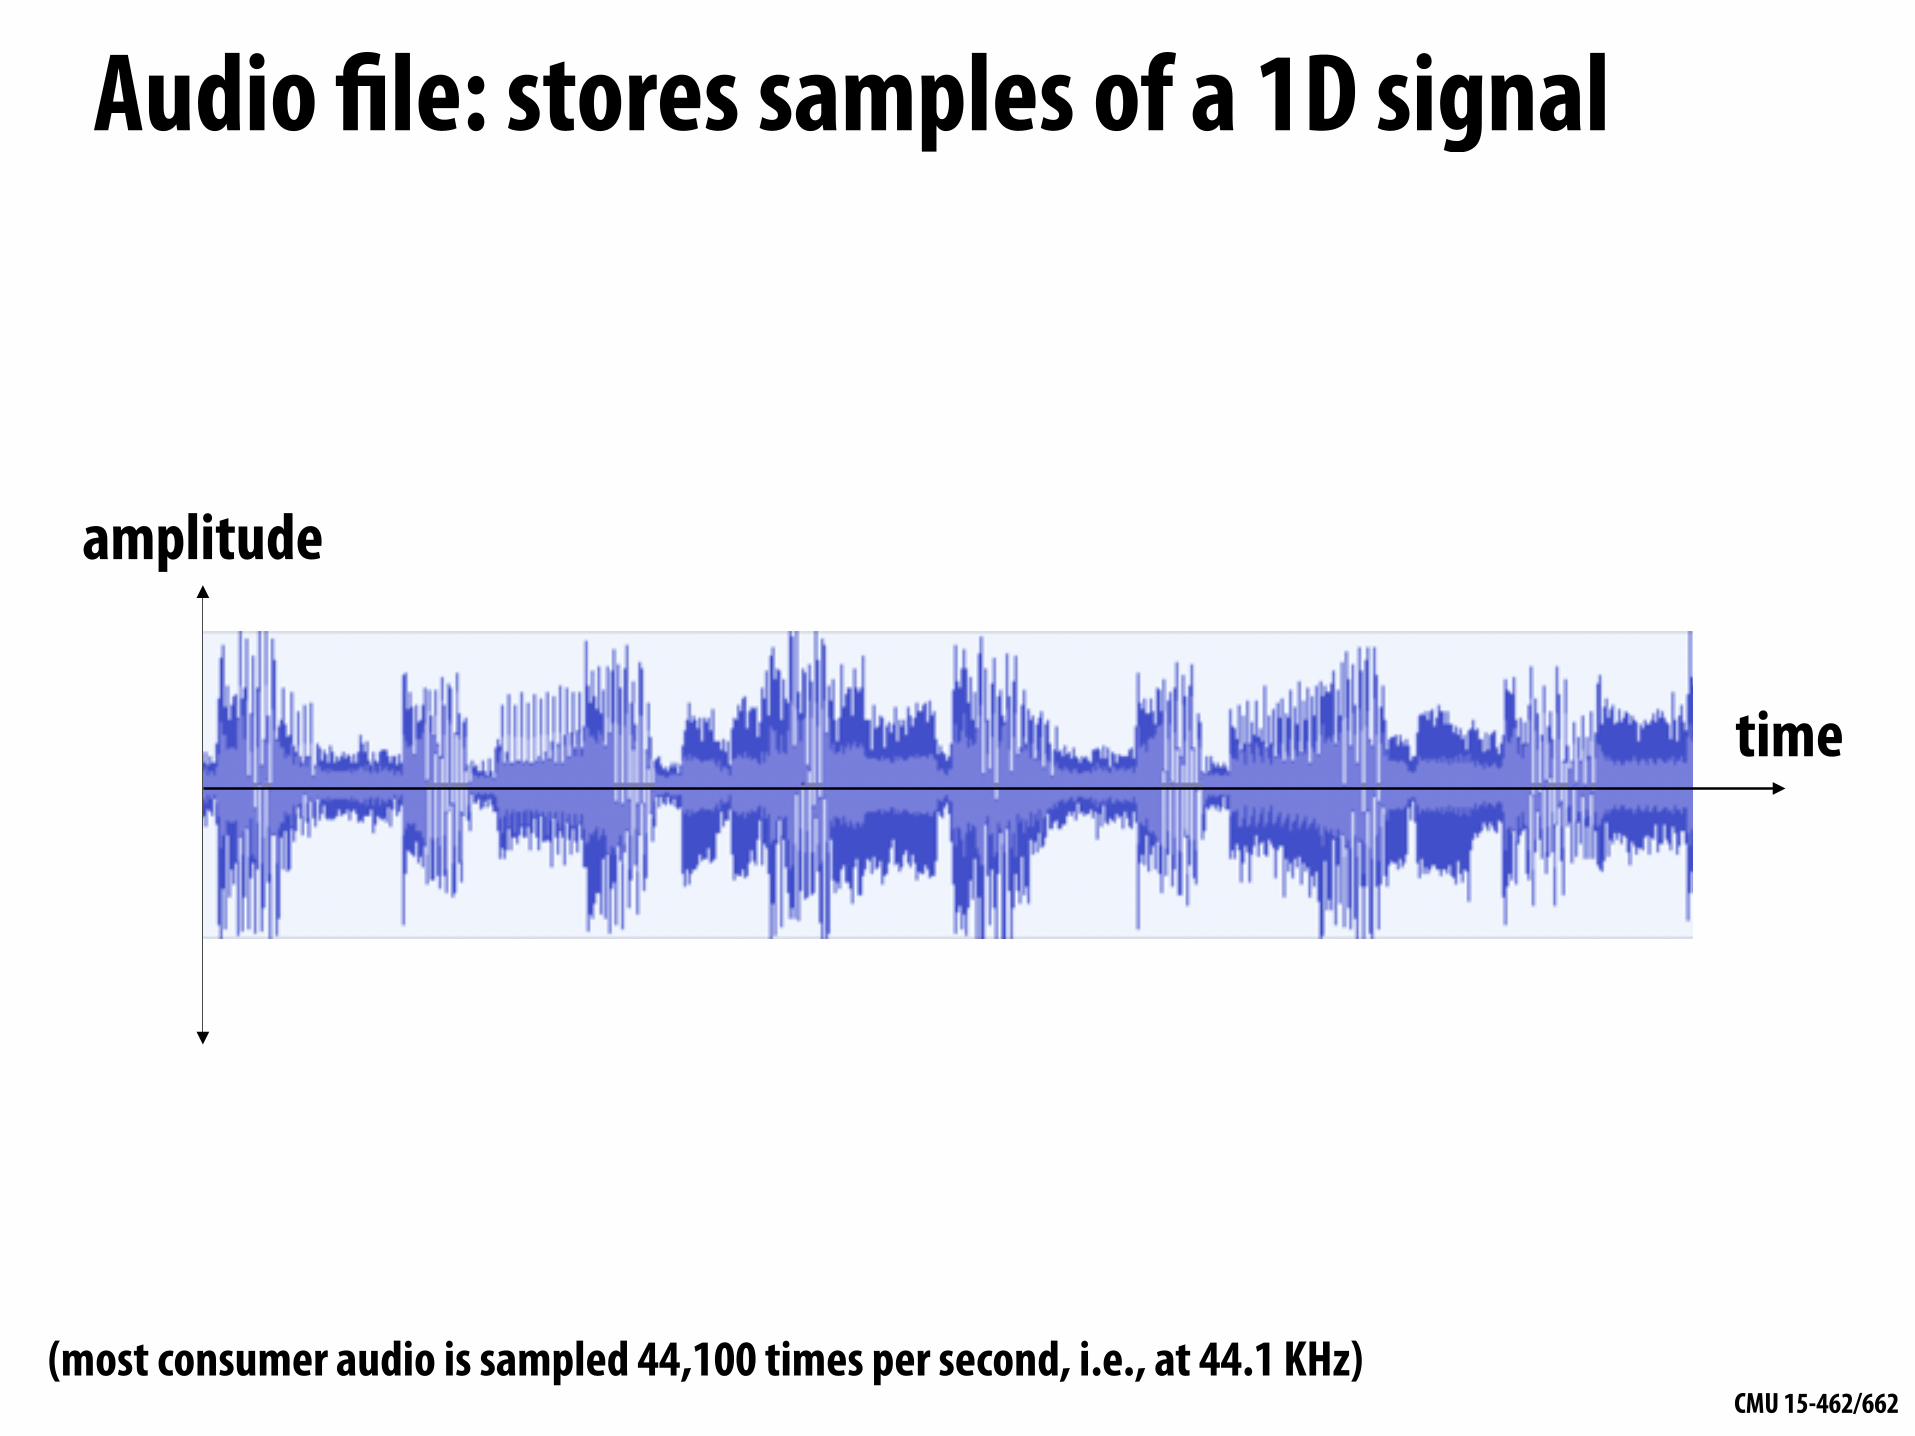
Audio file: stores samples of a 1D signal
time
amplitude
(most consumer audio is sampled 44,100 times per second, i.e., at 44.1 KHz)

CMU 15-462/662
Reconstruction: given a set of samples, how might we attempt to reconstruct the original signal ?f(x)
x1x0 x2 x3 x4
f(x0) f(x1) f(x2)f(x3)
f(x4)

CMU 15-462/662
Piecewise constant approximation
x1
f(x)
x0 x2 x3 x4
f(x)
= value of sample closest to f(x) x
CMU 15-462/662
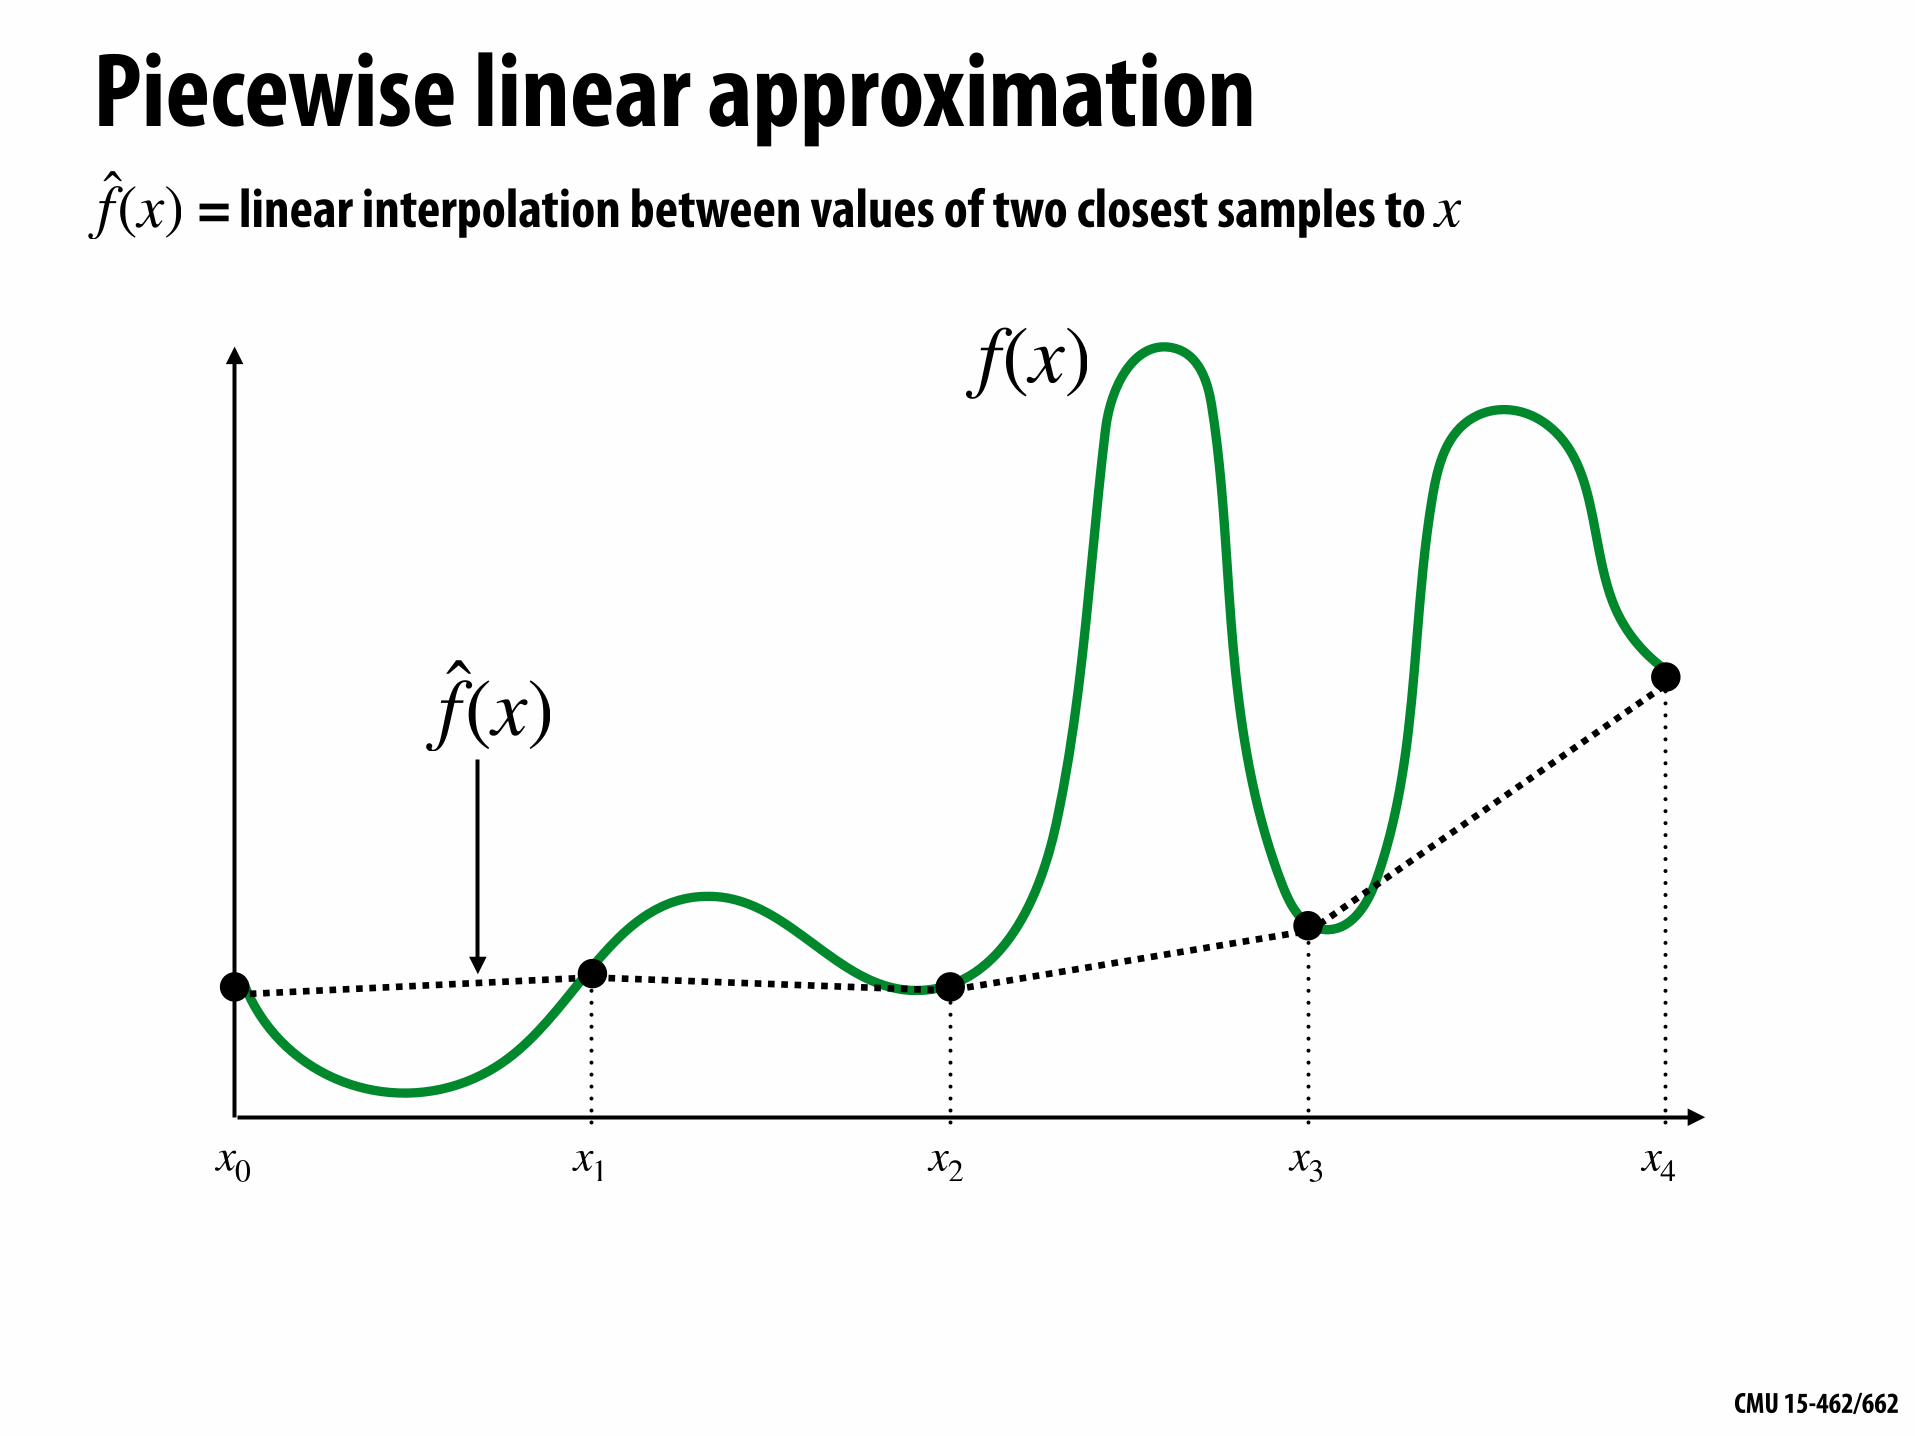
Piecewise linear approximation
x1x0 x2 x3 x4
f(x)
f(x)
= linear interpolation between values of two closest samples to f(x) x

CMU 15-462/662
How can we represent the signal more accurately?
x1x0 x2 x3 x4 x5 x6 x7 x8
Sample signal more densely (increase sampling rate)

CMU 15-462/662
Reconstruction from denser sampling
= reconstruction via linear interpolation= reconstruction via nearest
x1x0 x2 x3 x4 x5 x6 x7 x8

CMU 15-462/662
2D Sampling & Reconstruction▪ Basic story doesn’t change much for images:
- sample values measure image (i.e., signal) at sample points - apply interpolation/reconstruction filter to approximate image
original piecewise constant (“nearest neighbor”)
piecewise bi-linear

CMU 15-462/662
Sampling 101: Summary▪ Sampling = measurement of a signal
- Encode signal as discrete set of samples - In principle, represent values at specific points (though hard to measure in reality!)
▪ Reconstruction = generating signal from a discrete set of samples
- Construct a function that interpolates or approximates function values
- E.g., piecewise constant/“nearest neighbor”, or piecewise linear
- Many more possibilities! For all kinds of signals (audio, images, geometry…)
[Image credit: Wikipedia]

CMU 15-462/662
For rasterization, what function are we sampling?
coverage(x, y) := {1, triangle contains point (x, y)0, otherwise
10

CMU 15-462/662
Simple rasterization: just sample the coverage function
Pixel (x,y)
1
2
3
4
Example: Here I chose the coverage sample point to be at a point corresponding to the pixel center.
= triangle covers sample
= triangle does not cover sample
(x+0.5, y+0.5)

CMU 15-462/662
Edge cases (literally)
Is this sample point covered by triangle 1? or triangle 2? or both?
1
2

CMU 15-462/662
Breaking Ties*▪ When edge falls directly on a screen sample point, the sample is classified as within
triangle if the edge is a “top edge” or “left edge” - Top edge: horizontal edge that is above all other edges - Left edge: an edge that is not exactly horizontal and is on the left side of the
triangle. (triangle can have one or two left edges)
*These are the rules used in OpenGL/Direct3D, i.e., in modern GPUs. Source: Direct3D Programming Guide, Microsoft

CMU 15-462/662
Results of sampling triangle coverage

CMU 15-462/662
I have a sampled signal, now I want to display it on a screen

CMU 15-462/662
Pixels on a screen
LCD display pixel on my laptop
Each image sample sent to the display is converted into a little square of light of the appropriate color: (a pixel = picture element)
* Thinking of each LCD pixel as emitting a square of uniform intensity light of a single color is a bit of an approximation to how real displays work, but it will do for now.

CMU 15-462/662
So if we send the display this:

CMU 15-462/662
We see this when we look at the screen (assuming a screen pixel emits a square of perfectly uniform intensity of light)

CMU 15-462/662
But the real coverage signal looked like this!
CMU 15-462/662
Aliasing

CMU 15-462/662
Sampling & Reconstructioncontinuous signal
(original)continuous signal
(approximate)
sample reconstruct
digital information
Goal: reproduce original signal as accurately as possible.

CMU 15-462/662
1D signal can be expressed as a superposition of frequencies
f1(x) = sin(!x)
f2(x) = sin(2!x)
f4(x) = sin(4!x)
f(x) = f1(x) + 0.75 f2(x) + 0.5 f4(x)

CMU 15-462/662
E.g., audio spectrum analyzer shows the amplitude of each frequency
Intensity of low-frequencies (bass)
Image credit: ONYX Apps
Intensity of high frequencies

CMU 15-462/662
Aliasing in AudioGet a constant tone by playing a sinusoid of frequency ω:
Q: What happens if we increase ω over time?ω(t) = 6000 t
Why did that happen?

CMU 15-462/662
Undersampling high-frequency signals results in aliasing
Low-frequency signal: sampled adequately for accurate reconstruction
f1(x)
f2(x)
f3(x)
f4(x)
f5(x)
x
High-frequency signal is insufficiently sampled: reconstruction appears to be from a low frequency signal
“Aliasing”: high frequencies in the original signal masquerade as low frequencies after reconstruction (due to undersampling)

CMU 15-462/662
Images can also be decomposed into “frequencies”
SpectrumSpatial domain result

CMU 15-462/662
Low frequencies only (smooth gradients)
Spectrum (after low-pass filter) All frequencies above cutoff have 0 magnitude
Spatial domain result

CMU 15-462/662
Mid-range frequencies
Spatial domain result Spectrum (after band-pass filter)

CMU 15-462/662
Mid-range frequencies
Spatial domain result Spectrum (after band-pass filter)

CMU 15-462/662
High frequencies (edges)
Spatial domain result (strongest edges)
Spectrum (after high-pass filter) All frequencies below threshold
have 0 magnitude

CMU 15-462/662
An image as a sum of its frequency components
+ + +
=

CMU 15-462/662
Spatial aliasing: the function sin(x2 + y2)
(0,0)
Rings in center-left: Actual signal (low frequency oscillation)
Right: aliasing from undersampling high frequency oscillation makes it appear that rings are low-frequency (they’re not!)
Middle: ring frequency approaches limit of what we can represent w/ individual pixels
Figure credit: Pat Hanrahan and Bryce Summers
x
y

CMU 15-462/662
Temporal aliasing: wagon wheel effect
Camera’s frame rate (temporal sampling rate) is too low for rapidly spinning wheel.

Nyquist-Shannon theorem▪ Consider a band-limited signal: has no frequencies above some threshold
- 1D example: low-pass filtered audio signal - 2D example: blurred image example from a few slides ago
ω0
▪ The signal can be perfectly reconstructed if sampled with period T = 1 / 2ω0 ▪ …and if interpolation is performed using a “sinc filter”
– ideal filter with no frequencies above cutoff (infinite extent!)
sinc(x) = 1πx sin(πx)

CMU 15-462/662
▪ Signals are often not band-limited in computer graphics. Why?
Challenges of sampling in computer graphics
Hint:
▪ Also, infinite extent of “ideal” reconstruction filter (sinc) is impractical for efficient implementations. Why?

CMU 15-462/662
Aliasing artifacts in images▪ Imperfect sampling + imperfect reconstruction
leads to image artifacts - “Jaggies” in a static image
- “Roping” or “shimmering” of images when animated
- Moiré patterns in high-frequency areas of images

CMU 15-462/662
How can we reduce aliasing?▪ No matter what we do, aliasing is a fact of life: any
sampled representation eventually fails to capture frequencies that are too high.
▪ But we can still do our best to try to match sampling and reconstruction so that the signal we reproduce looks as much as possible like the signal we acquire
▪ For instance, if we think of a pixel as a “little square” of light, then we want the total light emitted to be the same as the total light in that pixel - I.e., we want to integrate the signal over the pixel
(“box filter”)
Let’s (approximately) integrate the signal coverage (x,y) by sampling…

CMU 15-462/662
Initial coverage sampling rate (1 sample per pixel)

CMU 15-462/662
Increase frequency of sampling coverage signal

CMU 15-462/662
Supersampling
CMU 15-462/662
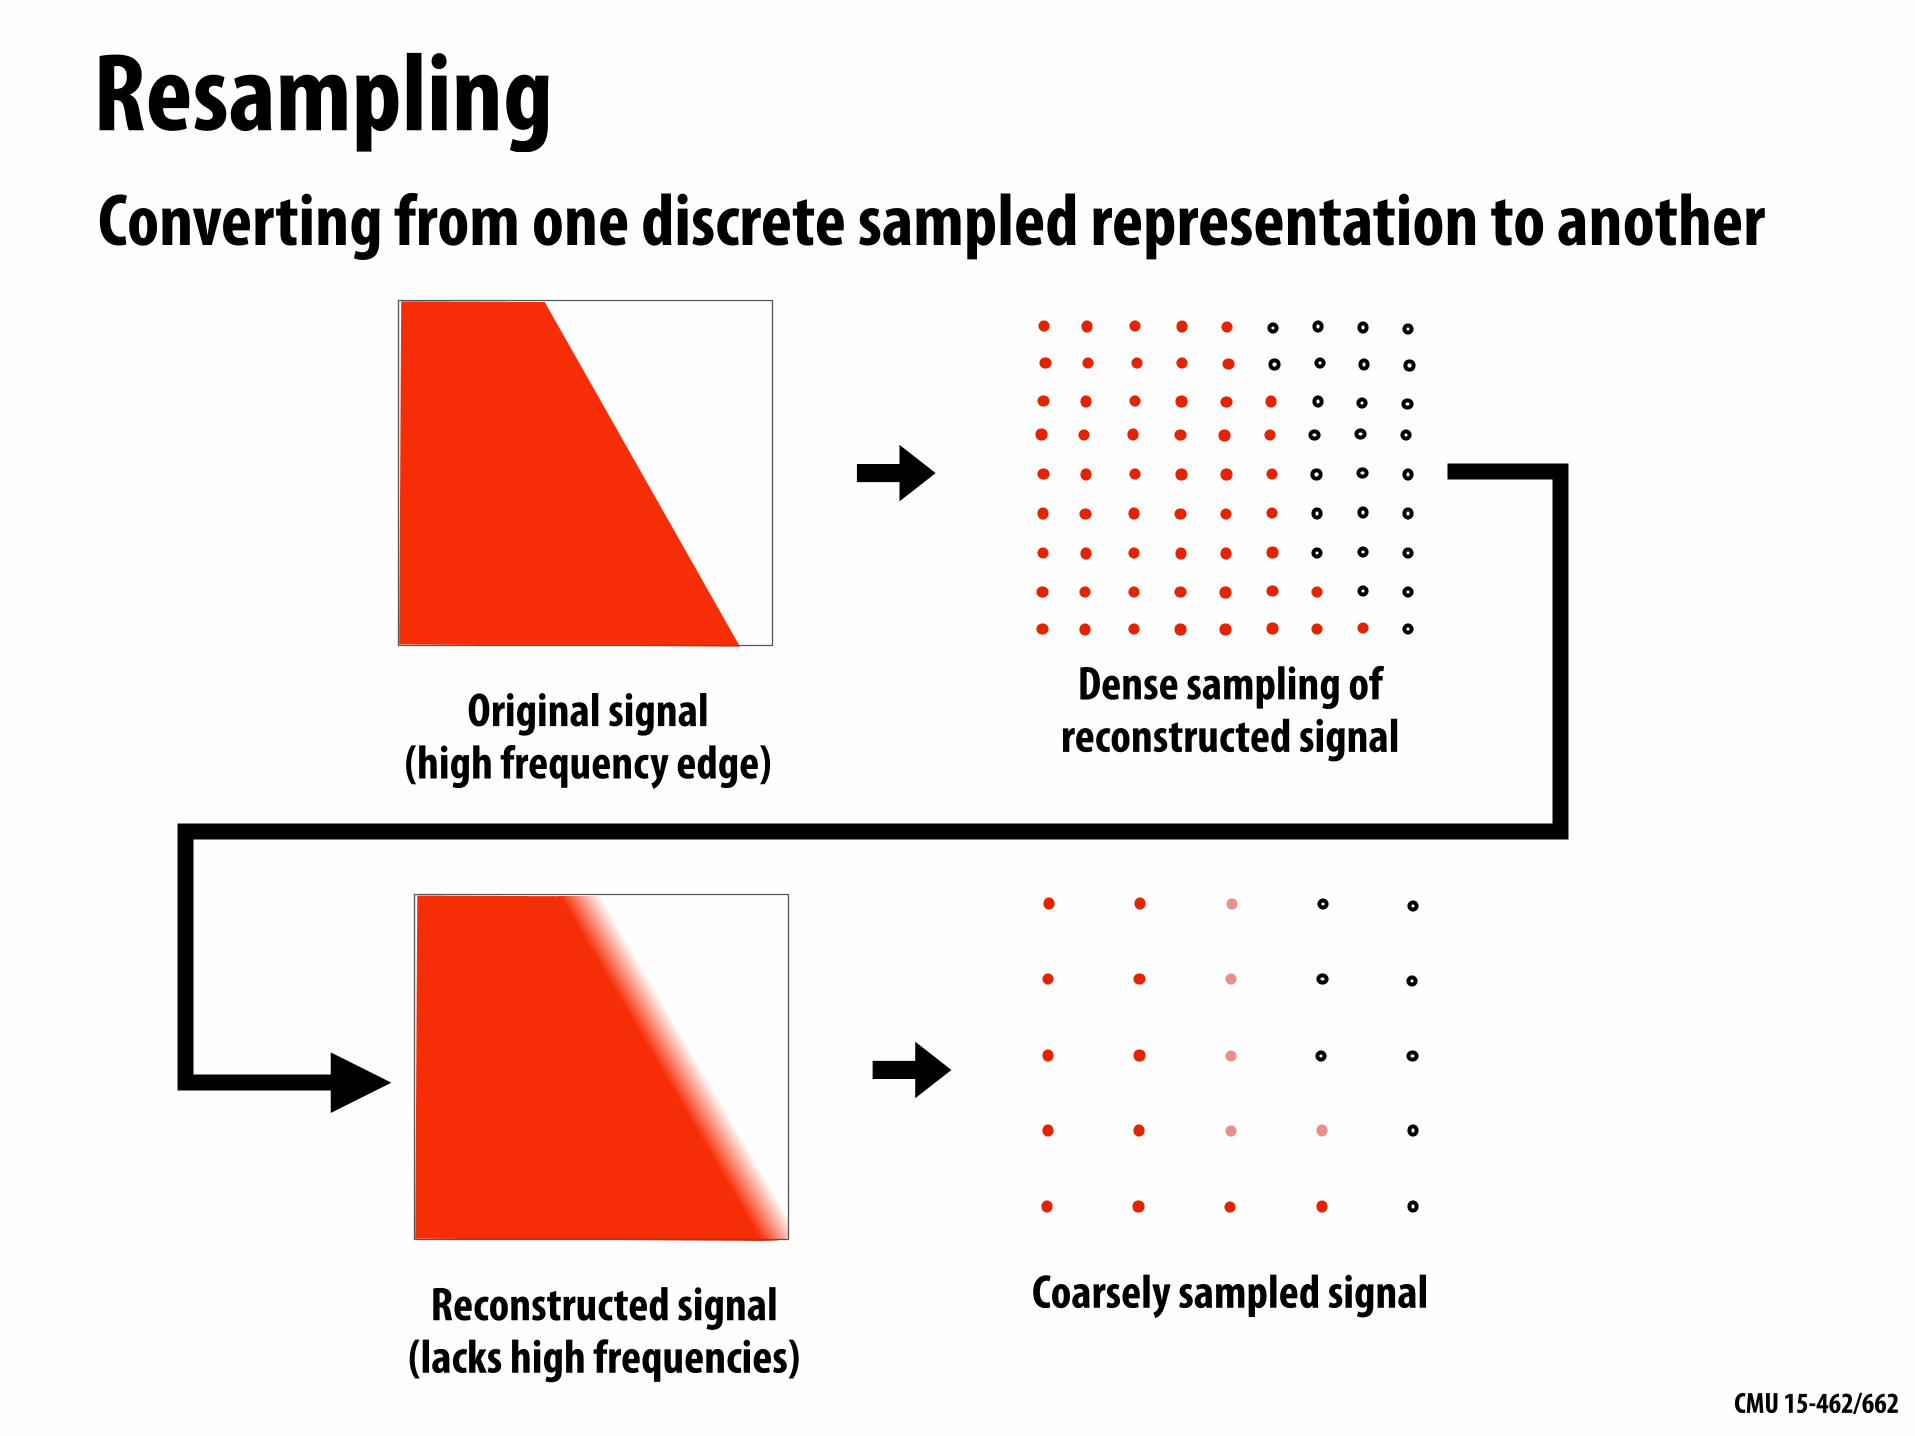
Resampling
Coarsely sampled signalReconstructed signal (lacks high frequencies)
Dense sampling of reconstructed signal
Converting from one discrete sampled representation to another
Original signal (high frequency edge)

CMU 15-462/662
Resample to display’s pixel resolution (Because a screen displays one sample value per screen pixel...)

CMU 15-462/662
Resample to display’s pixel rate (box filter)

CMU 15-462/662
Resample to display’s pixel rate (box filter)

CMU 15-462/662
Displayed result (note anti-aliased edges)
100% 0%
50%
50%
100%
25%100%
CMU 15-462/662
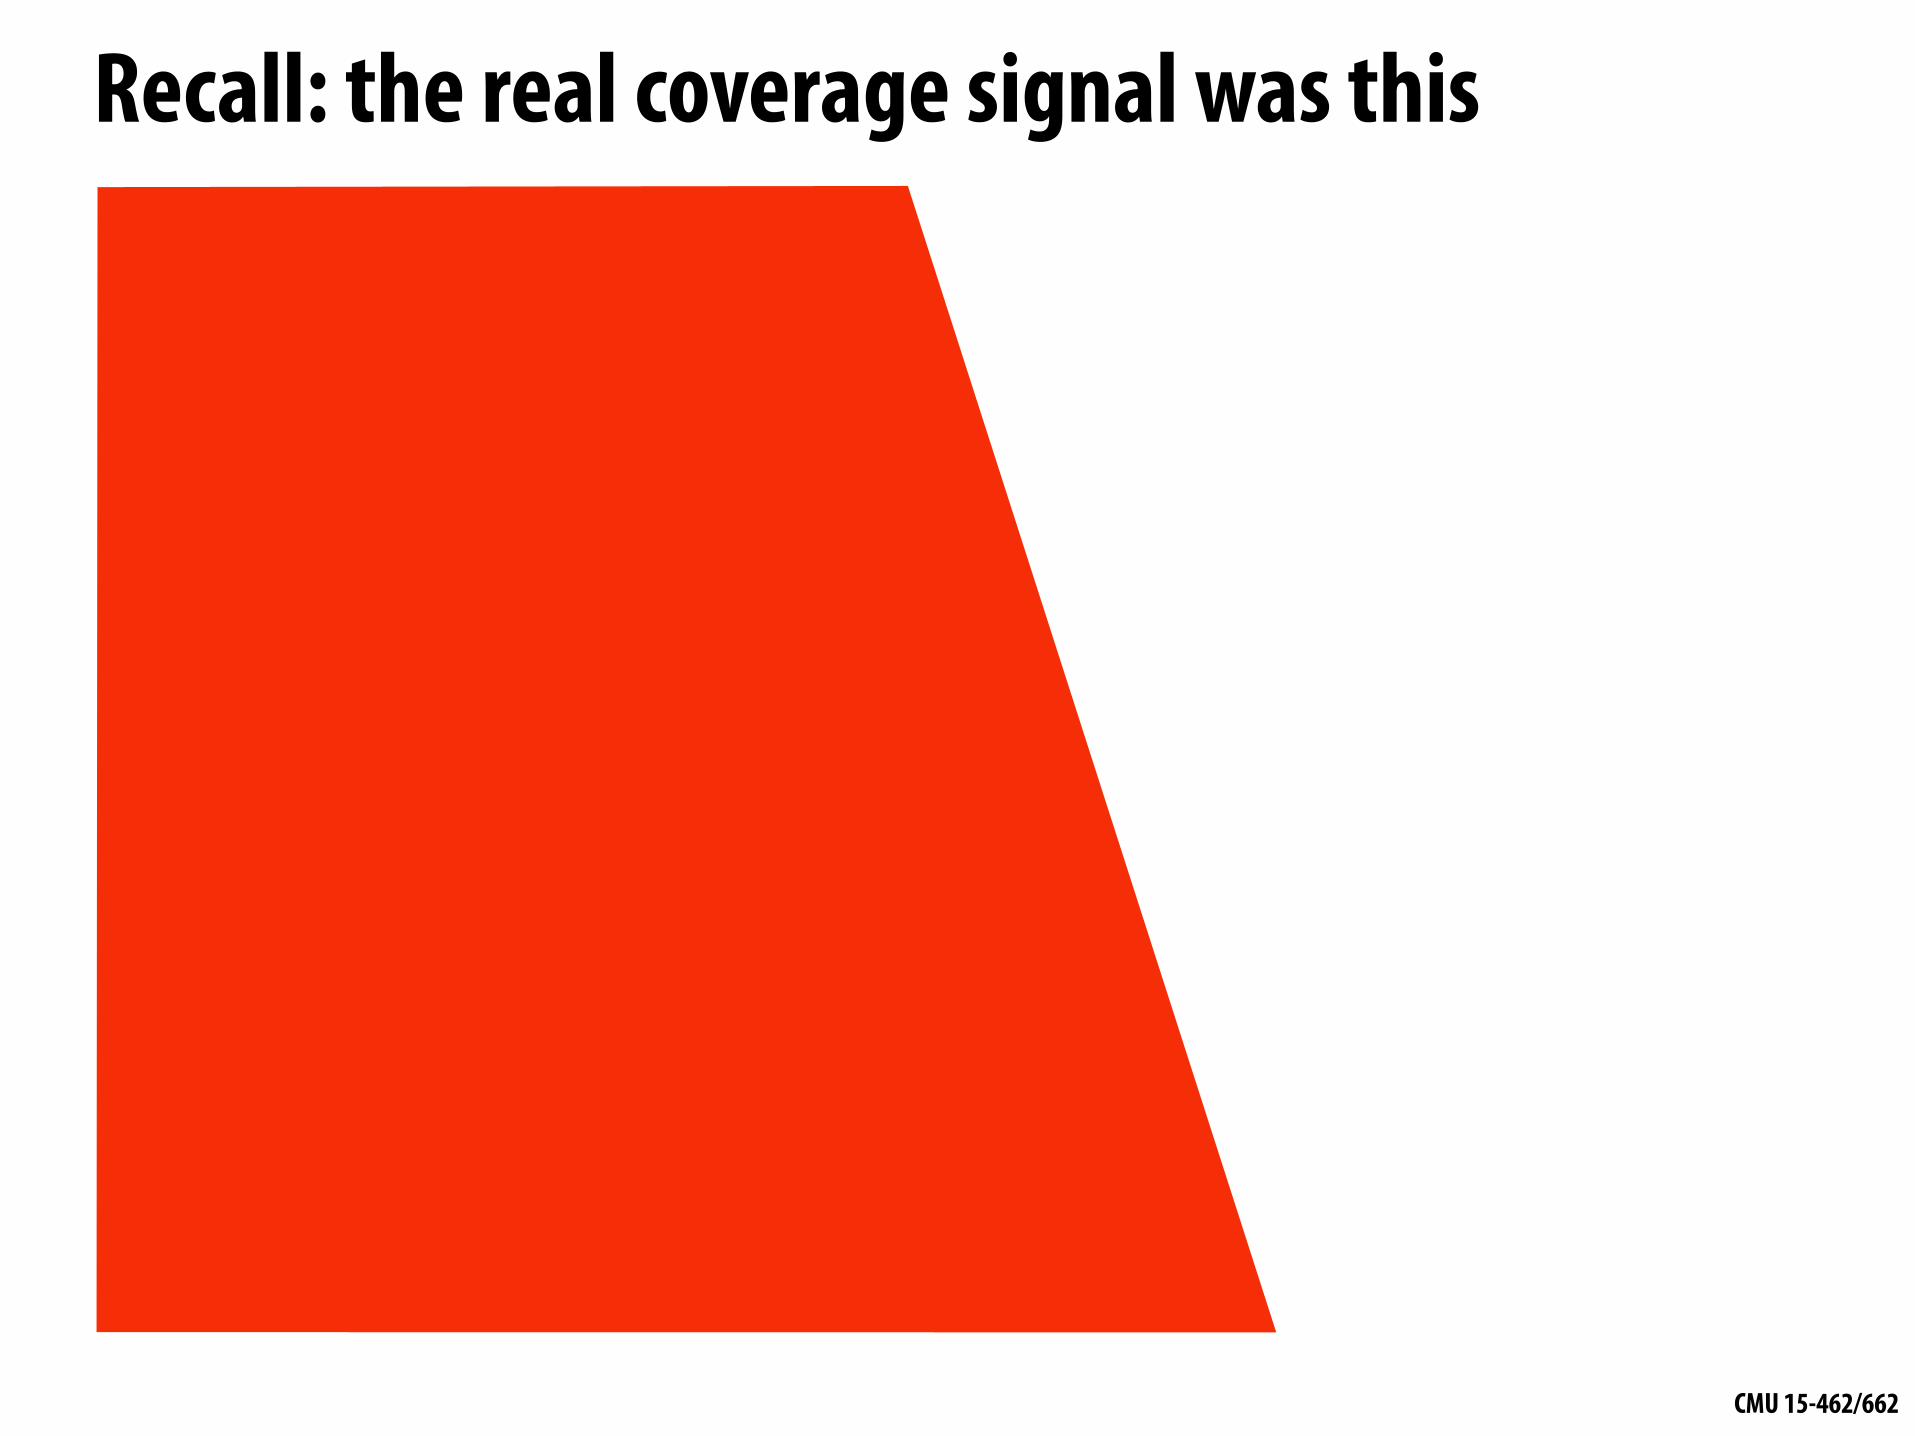
Recall: the real coverage signal was this

CMU 15-462/662
Single Sample vs. Supersampling
single sampling 2x2 supersampling

CMU 15-462/662
Single Sample vs. Supersampling
single sampling 4x4 supersampling

CMU 15-462/662
Single Sample vs. Supersampling
single sampling 32x32 supersampling

CMU 15-462/662
Checkerboard — Exact SolutionIn very special cases we can compute the exact coverage:
Such cases are extremely rare—want solutions that will work in the general case!
See: Inigo Quilez, “Filtering the Checkerboard Pattern” & Apodaca et al, “Advanced Renderman” (p. 273)

CMU 15-462/662
How do we actually evaluate coverage(x,y) for a triangle?

CMU 15-462/662
Point-in-triangle test
P0
P1
P2Q: How do we check if a given point q is inside a triangle?
A: Check if it’s contained in three half planes associated with the edges. q

CMU 15-462/662
Point-in-triangle test
P0
P1
P2Q: How do we check if a given point q is inside a triangle?
A: Check if it’s contained in three half planes associated with the edges. q

CMU 15-462/662
Point-in-triangle test
P0
P1
P2Q: How do we check if a given point q is inside a triangle?
A: Check if it’s contained in three half planes associated with the edges. q

CMU 15-462/662
Point-in-triangle test
P0
P1
P2Q: How do we check if a given point q is inside a triangle?
A: Check if it’s contained in three half planes associated with the edges. q

CMU 15-462/662
Point-in-triangle test
P0
P1
P2Q: How do we check if a given point q is inside a triangle?
A: Check if it’s contained in three half planes associated with the edges.
Half plane test is then an exercise in linear algebra/vector calculus:
GIVEN: points Pi, Pj along an edge, and a query point qFIND: whether q is to the “left” or “right” of the line from Pi to Pj
q
(Careful to consider triangle coverage edge rules…)

CMU 15-462/662
Traditional approach: incremental traversal
P0
P1
P2Since half-plane check looks very similar for different points, can save arithmetic by clever “incremental” schemes.
Incremental approach also visits pixels in an order that improves memory coherence: backtrack, zig-zag, Hilbert/Morton curves, …

CMU 15-462/662
Modern approach: parallel coverage tests
P0
P1
P2
Q: What’s a case where the naïve parallel approach is still very inefficient?
• Incremental traversal is very serial; modern hardware is highly parallel
• Alternative: test all samples in triangle “bounding box” in parallel
• Wide parallel execution overcomes cost of extra tests (most triangles cover many samples, especially when super-sampling)
• All tests share some “setup” calculations
• Modern graphics processing unit (GPU) has special-purpose hardware for efficiently performing point-in-triangle tests

CMU 15-462/662
Naïve approach can be (very) wasteful…

CMU 15-462/662
Hybrid approach: tiled triangle traversal
Idea: work “coarse to fine”:
- First, check if large blocks intersect the triangle
- If not, skip this block entirely (“early out”)
- If the block is contained inside the triangle, know all samples are covered (“early in”)
- Otherwise, test individual sample points in the block, in parallel
earlyout
earlyin
This how real graphics hardware works!

CMU 15-462/662
Can we do even better for this example?

Hierarchical strategies in computer graphics
Q: Better way to find finest blocks? A: Maybe: incremental traversal!

CMU 15-462/662
Summary• Can frame many graphics problems in terms of sampling and reconstruction
- sampling: turn a continuous signal into digital information - reconstruction: turn digital information into a continuous signal - aliasing occurs when the reconstructed signal presents a false sense of
what the original signal looked like • Can frame rasterization as sampling problem
- sample coverage function into pixel grid - reconstruct by emitting a “little square” of light for each pixel - aliasing manifests as jagged edges, shimmering artifacts, … - reduce aliasing via supersampling
• Triangle rasterization is basic building block for graphics pipeline - amounts to three half-plane tests - atomic operation—make it fast! - several strategies: incremental, parallel, blockwise, hierarchical…

CMU 15-462/662
Next time: 3D Transformations