lecture 7 : costs and time
DESCRIPTION
lecture 7 : costs and time this lecture is about how to handle costs and dynamic aspects in hard-OR models types of costs costs that are relevant to decision making case example. types of costs a first classification: - PowerPoint PPT PresentationTRANSCRIPT

Spring 2010 - ÇG IE 398 Lecture 7 1
lecture 7 : costs and timethis lecture is about how to handle
costs and dynamic aspects in hard-OR models
• types of costs • costs that are relevant to decision making• case example

Spring 2010 - ÇG IE 398 Lecture 7 2
types of costs• a first classification:
– explicit costs: out-of-pocket costs involving an actual transfer of funds (eg. payrol costs, purchasing costs etc.)
– implicit costs: no funds change hand (eg. depreciation, cost of reduced productivity, goodwill loss etc.)
• implicit costs that are relevant to OR decisions are called intangible costs; (eg. depreciation is not relevant to decision making but goodwill cost is)
• implicit costs that are shown in the balance sheet are also known as intangible costs from an accounting point of view, but these are not relevant to OR (eg. depreciation or intangible asset value reduction concerning reserves for bad debts or acquired assets that exceed purchase cost)

Spring 2010 - ÇG IE 398 Lecture 7 3
• a second classification– accounting costs as summarised in balance
sheets and income statements• direct costs which can be variable (ie.changing with
the level of output) or fixed (eg. depreciation of a machine that is dedicated to a certain product remains independent of output and is fixed)
• indirect costs or overheads which are essentially joint costs of production; overhead can change with output also, but it will remain fixed over wide intervals
– economic costs are opportunity costs (or shadow prices) ie. the implicit cost of a resource calculated as forgone benefits from the best alternative activity that the resource could have been used for
• variable costs that change in the short-run• fixed costs that change only in the long-run

Spring 2010 - ÇG IE 398 Lecture 7 4
Max 90 xA + 60 xBsubject to2xA + xB < 8xA < 3xB < 4
OBJECTIVE FUNCTION VALUE
1) 420.0000
VARIABLE VALUE REDUCED COST XA 2.000000 0.000000 XB 4.000000 0.000000
ROW SLACK OR SURPLUS DUAL PRICES 2) 0.000000 45.000000 3) 1.000000 0.000000 4) 0.000000 15.000000

Spring 2010 - ÇG IE 398 Lecture 7 5
Max 90xA + 60xBsubject to2xA + xB < 7xA < 3xB < 4
OBJECTIVE FUNCTION VALUE
1) 375.0000
VARIABLE VALUE REDUCED COST XA 1.500000 0.000000 XB 4.000000 0.000000
ROW SLACK OR SURPLUS DUAL PRICES 2) 0.000000 45.000000 3) 1.500000 0.000000 4) 0.000000 15.000000

Spring 2010 - ÇG IE 398 Lecture 7 6
relevant costs and benefits • change as a result of decision choice
– explicit costs are often relevant unless they are
• sunk costs, which are irrelevant (eg. suppose the LOD project has costed $ 8 000 already and requires further spending of $ 30 000 in order to provide benefits of $ 35 000; it should be implemented since the $ 8 000 is only a sunk cost)
• sunk costs can be hidden, (eg. as depreciation entered for accounting purposes rather than as a wear-and-tear cost; this indicates that identifying a sunk cost is not always straightforward)
– opportunity costs of resources used are relevant and in general not the same as historical (ie. accounting) costs (eg. the cost of warehousing space at LOD can be zero if there is no alternative use for the warehouse, or $ 44/m2 if it can be used for parking etc)

Spring 2010 - ÇG IE 398 Lecture 7 7
– replacement costs represent opportunity costs and are relevant, unlike historical purchase costs which are irrelevant
– future costs and benefits are relevant opportunity costs that can be explicit such as a decommissioning cost or a salvage value
– intangible costs are relevant opportunity costs in the form of shortage costs, goodwill costs etc.; extensive sensitivity analysis will be needed if they cannot be estimated directly
• conclusions– accounting records provide important historical cost and
benefit data– not all of these are relevant to managerial decision
making– economic ie. opportunity costs must be used in decision
making

Spring 2010 - ÇG IE 398 Lecture 7 8
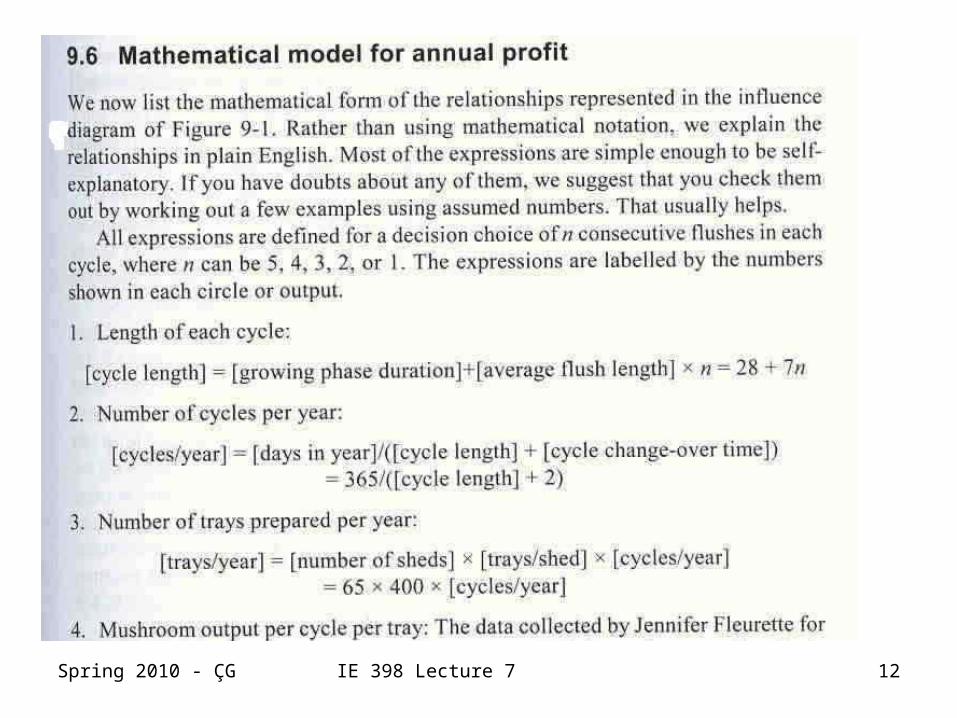
case example: Champignons Galore, a French mushroom grower
• Three stage process– put compost in trays– mycelium growing – 26 to 28 days– mushroom harvesting – in flushes with
decreasing yield and size at 6 to 8 day intervals (<5 times)
• 66 sheds (400 trays in each) 65 in use except for 2 days cleaning between cycles

Spring 2010 - ÇG IE 398 Lecture 7 9
• costing three alternatives to increase production:1. adopting two-layer sheds at the current site2. acquiring a second site for new sheds
3. optimising the number of flushes without adding new sheds
A MS/OR project by a friend’s students on costs and yields of consecutive flushes
• only the third alternative is investigated based on the objective to maximise profits making the following boundary judgments:– the production process remains unchanged, using 66
sheds and 400 trays/shed– additional output can be sold at current prices– additional inputs can be obtained at current prices– the number of flushes per cycle can be 1, 2, 3, 4 or 5

Spring 2010 - ÇG IE 398 Lecture 7 10
Problem identified• Decision maker : Gerard Mousse• Objective : High annual profit• Performance measure : Profit (= revenue – total
cost)
• Decision criterion : maximize profit • Alternative courses of action : number of
flushes in each cycle• Problem context : in accordance with the
boundary judgements

Spring 2010 - ÇG IE 398 Lecture 7 11
Spring 2010 - ÇG IE 398 Lecture 7 12

Spring 2010 - ÇG IE 398 Lecture 7 13

Spring 2010 - ÇG IE 398 Lecture 7 14

Spring 2010 - ÇG IE 398 Lecture 7 15
• Yield data : yield and picking data are collected by observations over a 5-flush cycle in two sheds:
Flushes per cycle: 1 2 3 4 5
Cycle length in days 37 44 51 58 65
Number of cycles/year
9.865 8.295 7.157 6.293 5.615
Yield/tray in kg 22.973 16.080 7.103 4.278 2.610
Cumul. yield/tray in kg
22.973 39.053 46.155 50.433 53.043
Picking hours/tray 2.126 1.670 1.024 0.841 0.625
Cumul. picking hr/tray
2.126 3.796 4.820 5.661 6.286
Number of trays/year 256,486 215,682 186,078 163,621 146,000
Total output/year in kg
5,892,136 8,422,914 8,588,4508,251,80
07,744,205

Spring 2010 - ÇG IE 398 Lecture 7 16
Relevant and irrelevant costs1.C. Brun’s section (composting and
preparation):– € 5,493,557 for raw materials (straw, manure, peat, casing
sand, sterilization agent etc.). Most raw materials were purchased regularly, some like straw almost daily, with raw material stocks being small and remaining fairly constant over the entire year.
– € 267,844 for electricity for peak heating, operation of tray filling equipment, etc.
– € 27,911 diesel fuel for yard vehicles.– € 25,787 maintenance and repair costs on yard vehicles.– € 123,000 depreciation on yard vehicles and equipment.– € 86,520 yard ground and building maintenance and repair
costs.– € 428,211 for yard workers’ wages, including vacation pay.– € 36,400 salary of C. Brun.

Spring 2010 - ÇG IE 398 Lecture 7 17
2. Michel Boite’s section (shed loading/unloading):– € 51,333 for supplies (sterilization and cleaning chemicals for
sheds).– € 219, 102 packing material for spent compost.– € 24,451 for diesel fuel.– € 12,211 for vehicle maintenance and repairs; € 35,600
depreciation on vehicles.– € 44,898 repairs and maintenance of sheds.– € 281,346 for replacement, repairs, and maintenance oftrays.– € 188,231 wages, including vacation pay.– € 31,200 salary of M. Boite.
3. Karl Scharf’s section (climate control):– € 37,866 electricity for climate control (approx. const.)– € 34,613 for materials (approx. const.)– € 12,452 laboratory maintenance, cleaning, etc.– € 33,200 depreciation on climate control and lab equipment.– € 55,800 new climate control and lab equipment (sunk)– € 68,400 salary of K. Scharf and Tina Paille.

Spring 2010 - ÇG IE 398 Lecture 7 18
4. Jennifer Fleurette’s section (picking, sorting, and packaging):– € 4,071,758 for packing materials.– € 14,881 for supplies; €6,554 for electricity.– € 24,600 for new sorting machine (sunk)– € 4,212 for sorting and packing equipment maintenance.– € 14,600 depreciation on sorting and packing equipment.– € 5,602 maintenance and repair of sorting and packing shed.– € 18,006 for diesel fuel for trucks.– € 5,787 for truck maintenance and repairs; € 37,800 depreciation on
trucks– € 2,044,324 wages for sorting and packing staff, including vacation
pay.– € 52,120 wages for drivers.– € 36,000 salary of J. Fleurette.– Pickers hourly wage: € 9.20; vacation and sick pay allowance: 8% on
wages.
5. Local marketing:– € 34,800 salary of J. Marchand.– € 26,922 travel and daily allowances (approx. cons.)

Spring 2010 - ÇG IE 398 Lecture 7 19
6. Other costs:• € 48,766 for office supplies (approx. cons.)• € 32,688 for new office equipment and computers (sunk)• € 3,435 for office building electricity.• € 12,111 fuel and maintenance costs for two cars (approx. cons.)• € 6,600 depreciation on company cars.• € 288,420 salaries of office staff (approx. cons.) €22,600
gardener.• € 8,688 office building maintenance € I90,000 depreciation • € I,360,000 mortgage interest; €124,005 fire and property
insurance.• € 301,887 accident insurance on waged workers (2.5%).• € 8,517 accident insurance on salaried employees (1.5%).• € 483,019 pension fund contribution on waged workers (4%).• € 34,069 pension fund contribution on salaried employees (6%).• € 72,000 salary of G. Mousse.• € 35,210 travel cost for G. Mousse (approx. cons.)

Spring 2010 - ÇG IE 398 Lecture 7 20
Revenue and cost computations
flushes / cycle 1 2 3 4 5
Mushroom revenue 21,211,68930,322,49
130,918,42
029,706,4
8227 879
138
Compost revenue 2,154,486 1,811,727 1,563,0591,374,41
41,226,400
Tray preparation cost
11,017,629 9,264,824 7,993,1827,028,48
76,271,573
Shed cost 1,385,840 1,165,366 1,005,414 884,071 788,863
Picking cost 5,744,763 8,625,051 9,447,9249,757,61
99,668,026
Sorting & packing cost
4,834,338 6,910,773 7,046,5916,770,37
96,353,911
Fixed cost 2,914,294 2,914,294 2,914,2942,914,29
42,914,294
Net profit (2,530,689) 3,253,910 4,074,0753,726,045
3,108,871
Difference -578,182 145,040 965,204 617,174 0

Spring 2010 - ÇG IE 398 Lecture 7 21
growing three flushes per cycle instead of five, provides higher profits as well as a 10% increase in output
• this is effectively equivalent to acquiring seven additional sheds, so it seems that the other options can be ignored for the time being