lecture notes on information technology for managers mba … theory... · crec, dept of mba page 1...
TRANSCRIPT

CREC, Dept of MBA Page 1
LECTURE NOTES
ON
INFORMATION TECHNOLOGY FOR
MANAGERS
MBA I Year I SEMESTER
(JNTUA-R15)
Mr. P.MADHU SHARMA
ASST.PROF
DEPARTMENT OF MANAGEMENT STUDIES
CHADALAWADA RAMANAMMA
ENGINEERING COLLEGE
CHADALAWADA NAGAR, RENIGUNTA ROAD,
TIRUPATI (A.P) - 517506

CREC, Dept of MBA Page 2
JAWAHARLAL NEHRU TECHNOLOGIAL UNIVERSITY
ANANTAPUR
MBA Semester – I
Th C
2 2
(14E00107) INFORMATION TECHNOLOGY FOR
MANAGERS The main objective of this course is to make the student familiarize in information technology
and their applications to business processes.
1.Fundamentals of Computer:- CPU, Basic logic gates, Computer Memory and Mass storage
devices, Computer Hierarchy, Input Technologies, Output Technologies, Number Systems
and Arithmetic: Decimal, Binary, Octal and Hexadecimal Number Systems, Binary
Arithmetic.
2. Computer Software: Application and System Software, Programming Languages and their
Classification, Assemblers, Compilers and Interpreters, Process of Software Development,
Operating Systems- Functions of Operating Systems, Types of Operating Systems (Batch
Processing, Multitasking, Multiprogramming and Real time Systems) Database Management
Systems Concepts, Types of Data Models.
3.Software Packages:- MS Word-Mail Merge, MS Excel-Formulae, Graphs, Basis Statistical
Formulae, MS PowerPoint- Creating Effectiveness presentations.
4.Data Communication and Networks: Concepts of Data Communication, Types of Data-
Communication Networks, Communications Media, Concepts of Computer Networks, the
Internet, Intranet and Extranets: Operation of the Internet, Services provided by Internet,
World Wide Web.
5.Functional and Enterprise Systems: Data, Information and Knowledge Concepts, Decision
Making, Process, Physical Components of Information Systems, Classification of information
Systems. Overview of Security Issues in
Information Technology, Emerging Trends in Information Technology
References:
•Foundations of IT, Dhiraj Sharma, Excel books.
•Basics of Computer Sciencs, Behrouz Forouzan, Firoz
Mosharraf, Cengage.
•Foundation of Information Technology, Alexis Leon,
Mathews Leon, Leon Vikas.
•Information Technology for Management, Ramesh Behi,
Mc Graw Hill.
•Introduction to Computers and Communications, Peter
Norton-Sixth Edition-Tata
McGraw Hill.
•V.Rajaraman-Introduction to Information Technology,
Prentice Hall Ind

CREC, Dept of MBA Page 3
UNIT – I

CREC, Dept of MBA Page 4
1. Fundamentals of Computer
History of Computers:
1. The earliest mechanical computing device was the Abacus, named after the Chinese
scientist Abacus, during 1200 A.D.
2. Later during 1614 a Scottish nobleman John Napier developed a tool called Napier’s
Bones as an aid for multiplication.
3. By 1642, the French philosopher and mathematician, Blaise Pascal developed a rotating
wheel calculator, the predecessor of the later desk calculator.
4. By 1822, the Father of Computers Charles Babbage invented a Electronic Machine.
Computers and Information Systems:
Computers and information systems are the tools that allow you to transform data efficiently and
effectively into information and distribute it to where it is needed. If used properly they can also
improve your productivity. Productivity refers to the amount of time and resources required to
gain a desired result. In recent years, the growing use of computers has brought the benefits of
these tools to anyone who wants to take advantage of them.
Preliminary Definitions:
Data: are raw facts that convey little meaning by themselves and hence need further processing.
Information: it is the result of processing, gathering, manipulating and organizing data in a way
that adds to the knowledge of the receiver. Both data and information might take any form such as
text, picture, audio and video.
Technology: the application of scientific knowledge to benefit humanity
Electronic device: a device that is made up of semi-conductor materials (materials that fall
between conductor and insulators).
Computer: An electronic device that has the ability to store, retrieve, and process data. A
computer consists of hardware and software.
Hardware: the physical part of a computer that can be seen and touched.
Software: Instructions that direct the operation of a computer.
System: A collection of components organized to accomplish a specific function or set of
functions. A computer-based information system collects, processes, transmits and disseminates
information in accordance with defined procedures.
Information and Communications Technology, also called Information Technology (IT) is
the study, design, development, implementation, support and management of computer-based
information systems. IT deals with the use of electronic computers and computer software to
convert, store, protect, process, transmit and retrieve information, securely.

CREC, Dept of MBA Page 5
An information system has three basic functions:
to accept data (input) ,
to convert data to information (process), and
to produce and communicate information in a timely fashion to users for decision making
(output).
Features of computers :
Storage capacity
Computers help to save space and economy by storing very large amount of data. Data stored on
paper that filled the shelves of a registrar office can be stored in a single computer with larger
storage capacity. This saves space, money to buy paper, ink, and shelves. This also helps to have
backup (copy) of the data and put it somewhere else for security purpose. Now day computers can
store data in multiples of tens of gaga bytes. You can also put multiples of hard disks in a
computer to increase its storage capacity.
Speed
These days, computers process tasks in very short period of time. They can accomplish tasks in
Nanoseconds or less. So they can perform very repetitive activities in slice of time.
Accuracy
Once well programmed, computers accomplish tasks accurately. The perfectness of the set of
instruction that drives the system determines the accuracy of their activities.
Reliability
Now a day’s computers are used in sensitive areas that need very high reliability. For example
hospitals are using computers in patient diagnosis, monitoring patient operations. They are also
monitoring activities in industries that may cause failure or success of the company. Computers
are also used in nuclear plants that need very high care and its failure may cause the destruction of
a continent or the whole world. In general computers are becoming reliable devices even in life
and death situations.
Note- that the failure of computers in sensitive areas also causes very great destruction.
Versatility
Computers accomplish various types of tasks at the same time or at different time. For this reason
they are called versatile. For example, you can listen music while you are writing some text.
Computers can be used for transaction processing, computers can be used for designing, they can
be used for communication, etc.
CPU :
The central processing unit (CPU) is the brain of your computer. It handles all the
instructions you give your computer, and the faster it does this, the better.
Definition of CPU :
The central processing unit (CPU) of a computer is a piece of hardware that carries out the
instructions of a computer program. It performs the basic arithmetical, logical, and

CREC, Dept of MBA Page 6
input/output operations of a computer system. The CPU is like the brain of the computer -
every instruction, no matter how simple, has to go through the CPU.
Invention :
In April 1970, Intel hired Italian-born engineer Federico Faggin as project leader, a move
that ultimately made the single-chip CPU final design a reality.
Components of CPU :
Two typical components of a CPU are the following: The arithmetic logic unit (ALU), which
performs arithmetic and logical operations. The control unit (CU), which extracts instructions
from memory and decodes and executes them, calling on the ALU when necessary.
Early CPUs consists of many separate components, but since the 1970s, they have been
constructed as a single integrated unit called a microprocessor. As such, a CPU is a specific
type of microprocessor.
Parts of a CPU and Description :
Random Access Memory (RAM):
Random Access Memory is also known as the computer’s system memory. It needs power to
be read; hence, when a computer turns off, the memory is lost.
Hard Disk Drive :
Hard disk drive is the main storage device of a computer. It uses uses disks that are made of
aluminum or glass to store information. Hard drives are measured in gigabytes. Sometimes a
special cache is used for quick retrieval of often-used information (such as web pages).
Microprocessor :
Microprocessor functions as the central processing unit of the computer which provides
computation control. Its speed is measured in megahertz. It holds info about the operating
system of the computer. The microprocessor is one type of ultra-large-scale integrated circuit
that consists of extremely tiny components formed on a single, thin, flat piece of material
known as a semiconductor.
CD ROM :
Compact Disk Read-Only Memory is collectively known as CD ROM. With the help of laser
optics technology, CD ROM reads information from a CD. However, it is not capable of
writing informatioin on the CD.
Floppy Disk Drive :
Floppy disk drive helps store and read data on a removable floppy disk.
CREC, Dept of MBA Page 7
Video Card :
Video Card is an expansion card that is connected to the motherboard. It serves as the visual
link between the user and its computer, allowing the user to view and manage the computer’s
software data.
LAN Card :
A LAN Card or Network Interface Card is also an expansion card. Also known as the
modem, it helps the computer to connect to another computer on a Network.
Motherboard :
The Motherboard is the computer’s circuit board where all the ‘inside parts’ are connected. It
contains the microprocessor; important computing components; different types of memory
chips; mouse, keyboard, and monitor control circuitry; and logic chips that control various
parts of the computer’s function. Having as many of the key components of the computer as
possible on the motherboard improves the speed and operation of the computer.
BASIC LOGIC GATES :
Logic Gates : Digital systems are said to be constructed by using logic gates. These gates are
the AND, OR, NOT, NAND, NOR, EXOR and EXNOR gates. The basic operations are
described below with the aid of Truth tables.
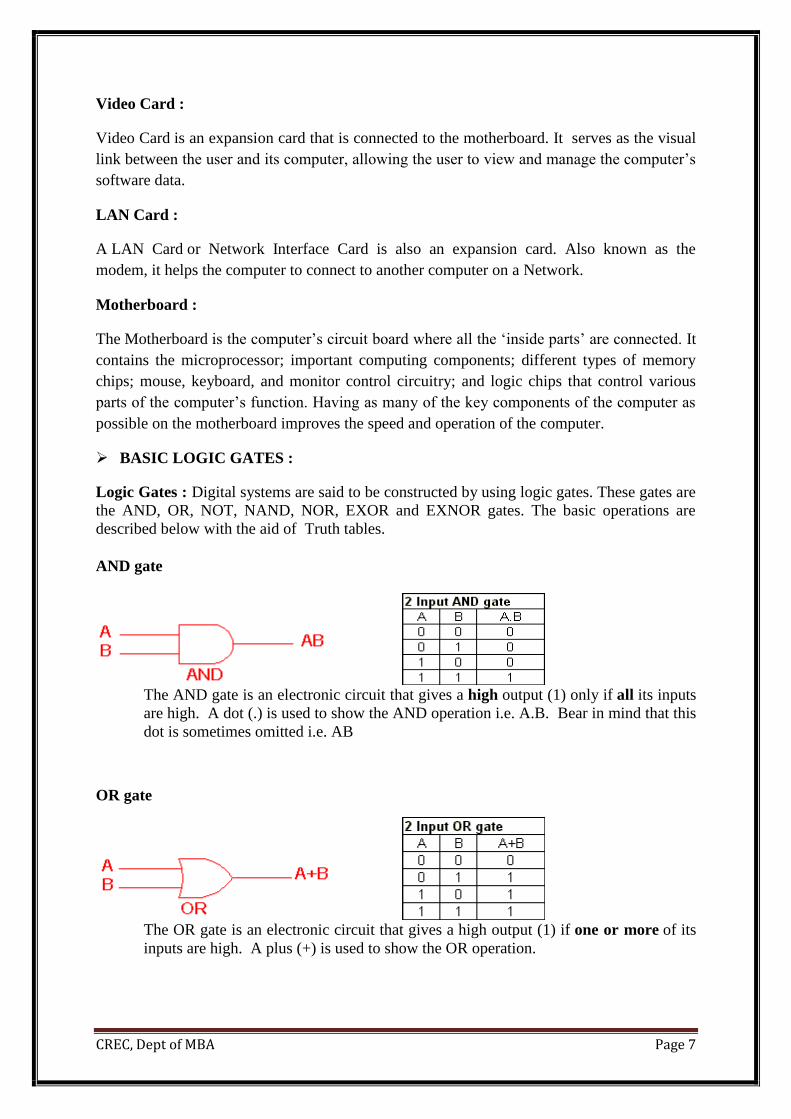
AND gate
The AND gate is an electronic circuit that gives a high output (1) only if all its inputs
are high. A dot (.) is used to show the AND operation i.e. A.B. Bear in mind that this
dot is sometimes omitted i.e. AB
OR gate
The OR gate is an electronic circuit that gives a high output (1) if one or more of its
inputs are high. A plus (+) is used to show the OR operation.

CREC, Dept of MBA Page 8
NOT gate
The NOT gate is an electronic circuit that produces an inverted version of the input at
its output. It is also known as an inverter. If the input variable is A, the inverted
output is known as NOT A. This is also shown as A', or A with a bar over the top, as
shown at the outputs. The diagrams below show two ways that the NAND logic gate
can be configured to produce a NOT gate. It can also be done using NOR logic gates
in the same way.
NAND gate
This is a NOT-AND gate which is equal to an AND gate followed by a NOT
gate. The outputs of all NAND gates are high if any of the inputs are low. The
symbol is an AND gate with a small circle on the output. The small circle represents
inversion.
NOR gate
This is a NOT-OR gate which is equal to an OR gate followed by a NOT gate. The
outputs of all NOR gates are low if any of the inputs are high.
The symbol is an OR gate with a small circle on the output. The small circle
represents inversion.
CREC, Dept of MBA Page 9
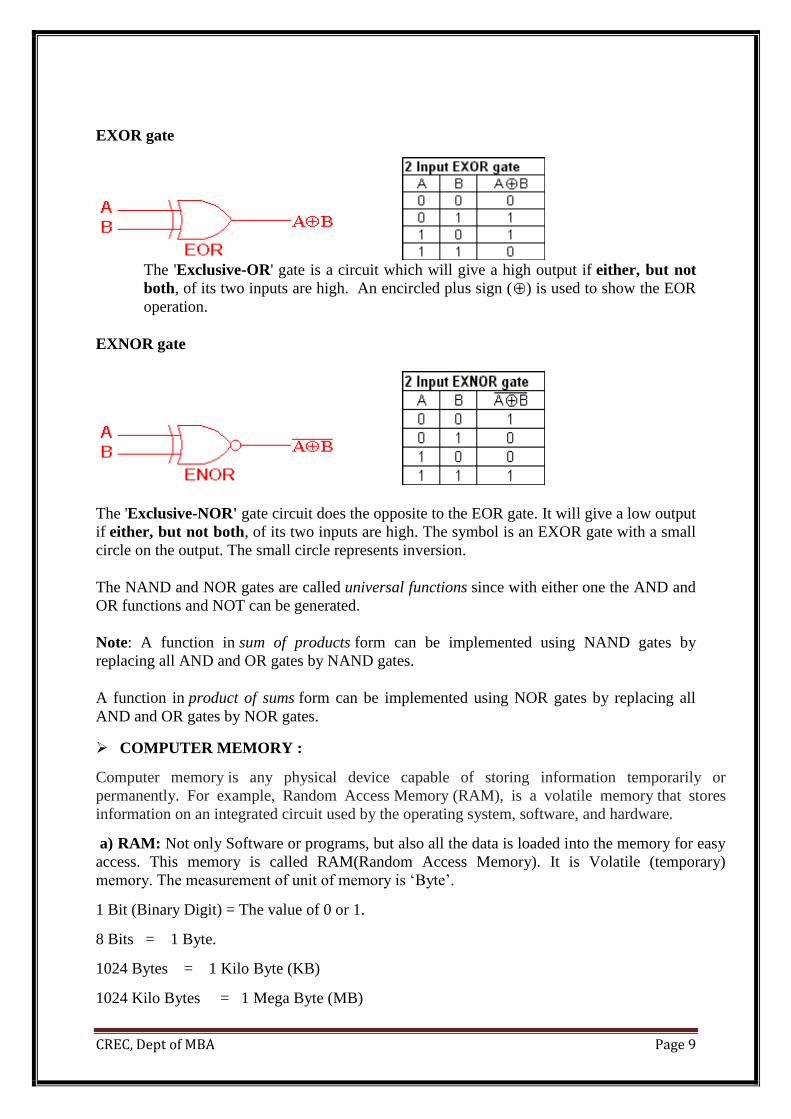
EXOR gate
The 'Exclusive-OR' gate is a circuit which will give a high output if either, but not
both, of its two inputs are high. An encircled plus sign ( ) is used to show the EOR
operation.
EXNOR gate
The 'Exclusive-NOR' gate circuit does the opposite to the EOR gate. It will give a low output
if either, but not both, of its two inputs are high. The symbol is an EXOR gate with a small
circle on the output. The small circle represents inversion.
The NAND and NOR gates are called universal functions since with either one the AND and
OR functions and NOT can be generated.
Note: A function in sum of products form can be implemented using NAND gates by
replacing all AND and OR gates by NAND gates.
A function in product of sums form can be implemented using NOR gates by replacing all
AND and OR gates by NOR gates.
COMPUTER MEMORY :
Computer memory is any physical device capable of storing information temporarily or
permanently. For example, Random Access Memory (RAM), is a volatile memory that stores
information on an integrated circuit used by the operating system, software, and hardware.
a) RAM: Not only Software or programs, but also all the data is loaded into the memory for easy
access. This memory is called RAM(Random Access Memory). It is Volatile (temporary)
memory. The measurement of unit of memory is ‘Byte’.
1 Bit (Binary Digit) = The value of 0 or 1.
8 Bits = 1 Byte.
1024 Bytes = 1 Kilo Byte (KB)
1024 Kilo Bytes = 1 Mega Byte (MB)
CREC, Dept of MBA Page 10
1024 Mega Bytes = 1 Giga Byte (GB)
1024 Giga Bytes = 1 Tera Byte (TB)
1024 Tera Bytes = 1 Peta Byte (PB)
b)ROM: ROM holds permanent data or instructions that can only be read and nothing can be able
to written on it. The information is permanently recorded in it. ROM contains instructions to get
the computer started when it gets ON. It holds instructions as Graphic Display, Disk Drives, etc.,
at the time of manufacturing, they built into it.
MASS STORAGE DEVICES :
In computing, mass storage refers to the storage of large amounts of data in
a persisting and machine-readable fashion. computer drives such as hard disk drives, magnetic
tape drives, magneto-optical disc drives, optical disc drives, and solid-state drives. It also includes
experimental forms like holographic memory and historic forms like drum memory, floppy
diskdrives and punched tape. Mass storage includes devices with removable and non-removable
media. It does not includerandom access memory (RAM), which is volatile in that it loses its
contents after power loss.
COMPUTER HIERARCHY :
In a computing context, there are various types of hierarchical systems. Most file systems, for
example, are based on a hierarchical model in which files are placed somewhere in a
hierarchical tree model.
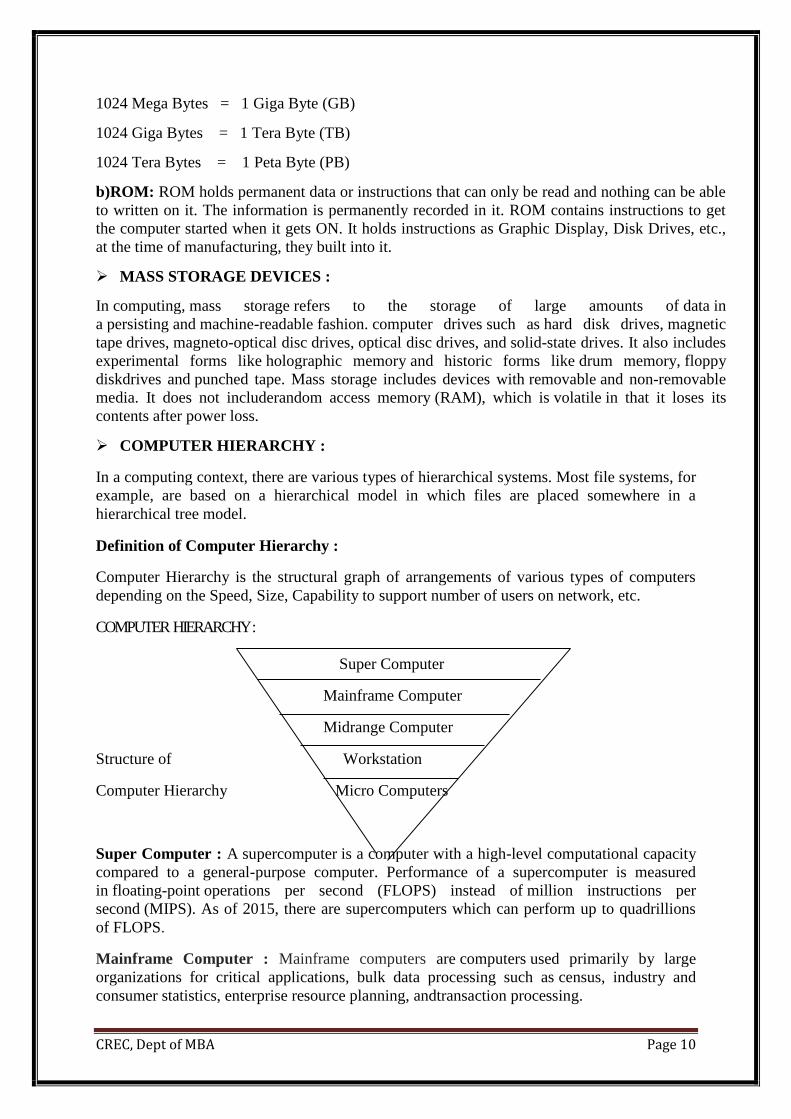
Definition of Computer Hierarchy :
Computer Hierarchy is the structural graph of arrangements of various types of computers
depending on the Speed, Size, Capability to support number of users on network, etc.
COMPUTER HIERARCHY :
Super Computer
Mainframe Computer
Midrange Computer
Structure of Workstation
Computer Hierarchy Micro Computers
Super Computer : A supercomputer is a computer with a high-level computational capacity
compared to a general-purpose computer. Performance of a supercomputer is measured
in floating-point operations per second (FLOPS) instead of million instructions per
second (MIPS). As of 2015, there are supercomputers which can perform up to quadrillions
of FLOPS.
Mainframe Computer : Mainframe computers are computers used primarily by large
organizations for critical applications, bulk data processing such as census, industry and
consumer statistics, enterprise resource planning, andtransaction processing.

CREC, Dept of MBA Page 11
Midrange Computer : Midrange computers, or midrange systems, are a class
of computer systems which fall in between mainframe computers andmicrocomputers.
Midrange systems are primarily high-end network servers and other types of servers that can
handle the large-scale processing of many business applications. Although not as powerful as
mainframe computers, they are less costly to buy, operate, and maintain than mainframe
systems and thus meet the computing needs of many organizations.
Work Station : A workstation is a special computer designed for technical
or scientific applications. Intended primarily to be used by one person at a time, they are
commonly connected to a local area network and run multi-user operating systems. The
term workstation has also been used loosely to refer to everything from a mainframe
computer terminal to a PC connected to a network.
Micro Computer : A microcomputer is a small, relatively inexpensive computer with
a microprocessor as its central processing unit (CPU).[2] It includes a microprocessor,
memory, and minimal input/output (I/O) circuitry mounted on a single printed circuit board.
INPUT AND OUTPUT TECHNOLOGIES : Device is generally used to refer any piece of
Hardware. The Computer accept the instructions and deliver the results to the users, by means
of some devices. Those devices are Input devices and Output devices.
Input devices – The Input devices are used to enter the instructions.
Ex: Keyboard- Numbers, Alphabets and Commands.
Mouse- Action of Click. , Joystick, Light pen, Microphones.
Output devices – The Output devices are used to see the results of processing.
Ex: Screen or VDU- Visual Display Unit, Printer.
NUMBER SYSTEM AND ARITHMETIC :
Number System defines a set of values used to represent ‘quantity’.
Base or Radix: The total number of digits available in a number system .
DECIMAL NUMBER SYSTEM :
There are 10 digits i.e. 1, 2, 3, 4, 5, 6, 7, 8, 9 available in decimal number system. It is known
as Base 10 system. The value of a digit in a number depends upon its position in the number
e.g. the number 546 in this system is represented as (546)10
546 = (4*102) + (8*101) + (6*100)
BINARY NUMBER SYSTEM :
The Binary Number System contains 2 unique digits 0 and 1. it is known as Base 2 system.
OCTAL NUMBER SYSTEM :
There are 8 unique digits available in octal number system. These are 0, 1, 2, 3, 4, 5, 6, 7.
thus, any number formed is the combination of these digits. It is known as Base 8 system.
HEXADECIMAL NUMBER SYSTEMS :
There are 16 unique digits available in Hexadecimal number system. These are 0, 1, 2, 3, 4, 5,
6, 7, 8, 9, A, B, C, D, E, F where A denotes 10, B denotes 11………,F denotes 15. thus any
number formed is a combination of these digits. It is known as Base 16 system.

CREC, Dept of MBA Page 12
Converting Between Number Bases
Converting Decimal to Binary, Octal and Hexadecimal
Integer Part
Remainder method 1. Divide the decimal number by the base of the target number system that is, to convert
decimal to binary, divide the decimal number with 2 (the base of binary number system), 8
for octal and 16 for hexadecimal.
2. Note the remainder separately as the first digit from the right. In case of hexadecimal , if
the remainder exceeds 9, convert the remainder into equivalent hexadecimal form. For e.g., if
the remainder is 10 then note the remainder as A.
3. Continually repeat the process of dividing until the quotient is zero and keep writing the
remainders after each step of division.
4. Finally, when no more division can occur, write down the remainders in reverse order.
FractionalPart 1. Multiply the fractional part by the value of the new base.
2. Record the integer part if it exits, else record 0.
3. Repeat step 1 with the result of the previous multiplication and then step 2, until the
fractional part becomes 0. in case of infinite calculations, generally 6 digits are taken.
Converting Binary, Octal and Hexadecimal to Decimal
The method used for conversion of a binary, octal and hexadecimal number to decimal
number involves each digit of the binary, octal or hexadecimal number to be multiplied by its
weighted position, and then each of the weighted values are added to get the decimal number.
Example:
Binary Number 1 1 0 1 0
Weight of each bit 24 22 22 21 20
Weighted Value 24 * 1 23 * 1 22 * 0 21 * 1 20 * 0
Solved Multiplication 16 8 0 2 0
Sum of weight of all bits = 16 + 8 +0 + 2 + 0 = 26
Thus, the decimal equivalent of (11010)2 is (26)10
Converting Between Octal and Hexadecimal
Steps of conversion: 1. Convert each octal digit to 3-bit binary form
2. Combine all the 3-bit binary numbers.
3. Segregate the binary numbers into 4-bit binary form by starting the first number from the
right bit (LSB) towards the number on the left bit (MSB).
4. Finally, convert these 4-bit blocks into their respective hexadecimal symbols.

CREC, Dept of MBA Page 13
UNIT – II

CREC, Dept of MBA Page 14
COMPUTER SOFTWARE
Application and System Software :
Software brings life into the Computer. It is nothing but instructions required to run the Computer.
It guides the Hardware on how to do its job. In Early starting Generations in 1950’s, Machine
Level Language were used and it is very hard to understand and process. Later, in 1960’s, High
Level Programming Languages were introduced and hence the operation of computers become
user-friendy nature. Software is mainly categorized into two types. They are:
1. System Software and 2. Application Software.
1. System Software : The Operating System (O.S.) is required by the computer to function. The
ROM, Keyboard, Mouse, performs functions only if the O.S. is installed in the computer. The
types of operating systems as- Microsoft Windows - NT,Windows- 95,Windows- 98, Windows-
XP, Windows- 7, Windows- 8.
2. Application Software : The Application Software is mainly categorized into two types. They
are:
a) Special purpose application software and
b) General purpose application Software.
a) Special purpose application software – Used for specific task / function to be performed.
b) General purpose application software – Used for general purpose of actions such as Word,
Excel Spread sheets, DBMS, Network, Education and Utilities, Resource discovery software and
Entertainment Softwares.
Programming Languages and their Classification :
A programming language is a formal computer language or constructed language designed to
communicate instructions to a machine, particularly a computer. Programming languages can
be used to create programs to control the behavior of a machine or to express algorithms.
Computer programming language can be classified into two major categories:
Low Level Languages
High Level Languages
Low Level Languages: The languages which use only primitive operations of the computer are known as low
language. In these languages, programs are written by means of the memory and registers
available on the computer. Since the architecture of computer differs from one machine to
another, so far each type of computer there is a separate low level programming language. In
the other words, Programs written in one low level language of one, architectural can’t be
ported on any other machine dependent languages. Examples are Machine Language and
Assembly Language.
a) Machine Language: In machine language program, the computation is based on binary numbers. All the
instructions including operations, registers, data and memory locations are given in there
binary equivalent.

CREC, Dept of MBA Page 15
The machine directly understands this language by virtue of its circuitry design so these
programs are directly executable on the computer without any translations. This makes the
program execution very fast. Machine languages are also known as first generation
languages.
b) Assembly Language: Assembly languages are also known as second generation languages. These languages
substitutes alphabetic or numeric symbols for the binary codes of machine language. That is,
we can use mnemonics for all opcodes, registers and for the memory locations which provide
us with a facility to write reusable code in the form of macros. Has two parts, one is macro
name and the other is macro body which contains the line of instructions. A macro can be
called at any point of the program by its name to use the instruction. A macro can be called at
any point of the program by its name to use the instructions given in the macro repetitively.
These languages require a translator known as “Assembler” for translating the program code
written in assembly language to machine language. Because computer can interpret only the
machine code instruction, once the translation is completed the program can be executed.
High Level Languages: All high level language is procedure-oriented language and is intended to be machine
independent. Programs are written in statements akin to English language, a great advantage
over mnemonics of assembly languages require languages use mnemonics of assembly
language. That is, the high level languages use natural language like structures. These
languages require translators (compilers and interpreters) for execution. The programs written
in a high level language can be ported on any computer, that’s why these languages are
known as machine independent. The early high level languages come in third generation of
languages, COBOL, BASIC, APL, etc.
These languages enable the programmer to write instruction using English words and familiar
mathematical symbols which makes it easier than technical details of the computer. It makes
the programs more readable too.
FORTRAN Programming Language: FORTRAN is an imperative computer programming language and also considered general
purpose and procedural. It was developed in the 1950s by International Business
Machines Corporation (IBM) and was intended for use in scientific and engineering related
applications. Since its design, Fortran has been steadily used for scientific and numerical
computing, especially in such areas as computational sciences and climate modeling. In fact,
it is the most commonly used numerical programming language in existence.
COBOL Programming Language: COmmon Business-Oriented Language, more commonly known as COBOL Language, is one
of the oldest programming languages in existence. COBOL languages can primarily be found
in areas like business and finance for the government, as well as many companies. COBOL
Language first appeared in late 1959, after a short-range committee, formed during a meeting
at the Pentagon, was asked to recommend a new approach to a common business language.
BASIC Programming Language: Beginner's All-purpose Symbolic Instruction Code (BASIC) is a family of easy-to-use
programming languages. Introduced in 1963, the initial purpose of this high-level language
was to make computers accessible to non-science students. BASIC and its variations enjoyed
widespread popularity for microcomputers in the 1970s. It gained a similar level of popularity
with personal computers in the 80s.

CREC, Dept of MBA Page 16
PASCAL Programming Language: Developed in 1970, by Niklaus Wirth, Pascal is a computer programming language. Pascal is
an imperative language that is considered a viable option for structured programming. The
language’s original purpose was to help in teaching structured programming concepts to
college students. In fact, teachers have employed it as an introductory programming language
for many years. Though it was created decades ago, versions of the language are still in use
today, in educational and software development sectors.
ADA Programming Language: A high-level programming language developed in the late 1970s and early 1980s for the
United States Defense Department. Ada was designed to be a general-purpose language for
everything from business applications to rocket guidance systems. One of its principal
features is that it supports real-time applications. In addition, Ada
incorporates modular techniques that make it easier to build and maintain large systems.
Since 1986, Ada has been the mandatory development language for most U.S. military
applications. In addition, Ada is often the language of choice for large systems that require
real-time processing, such as banking and air traffic control systems.
LISP Programming Language:
Lisp is a family of computer programming languages based on formal functional calculus.
Lisp (for "List Processing Language") stores and manipulates programs in the same manner
as any other data, making it well suited for "meta-programming" applications. One of the
oldest "high level" programming languages (second only to Fortran), Lisp continues to be
popular in the field of artificial intelligence down to the present day.
C Programming Language: C is a general-purpose computer programming language developed in 1972 by Dennis
Ritchie at the Bell Telephone Laboratories for use with the UNIX operating system. Although
C was designed for implementing system software, it is also widely used for developing
portable application software. C is one of the most popular programming languages and there
are very few computer architectures for which a C compiler does not exist. C has greatly
influenced many other popular programming languages, most notably C++, which originally
began as an extension to C.
C++ Programming Language: C++ is a type of computer programming language. Created in 1983 by Bjarne Stroustrup,
C++ was designed to serve as an enhanced version of the C programming language. C++ is
object oriented and is considered a high level language. However, it features low level
facilities. C++ is one of the most commonly used programming languages.
ASSEMBLERS :
A program for converting instructions written in low-level symbolic code into machine code.
An assembler is a program that takes basic computer instructions and converts them into a
pattern of bits that the computer's processor can use to perform its basic operations. Some
people call these instructions assembler language and others use the term assembly language.
The programmer can write a program using a sequence of these assembler instructions.
This sequence of assembler instructions, known as the source code or source program, is
then specified to the assembler program when that program is started.

CREC, Dept of MBA Page 17
The assembler program takes each program statement in the source program and
generates a corresponding bit stream or pattern (a series of 0's and 1's of a given length).
The output of the assembler program is called the object code or object program relative
to the input source program. The sequence of 0's and 1's that constitute the object
program is sometimes called machine code.
The object program can then be run (or executed) whenever desired.
COMPILERS :
A compiler is a program that translates human readable source code into computer
executablemachine code. To do this successfully the human readable code must comply with
the syntax rules of whichever programming language it is written in. The compiler is only a
program and cannot fix your programs for you. If you make a mistake, you have to correct
the syntax or it won't compile.
The name "compiler" is primarily used for programs that translate source code from a high-
level programming language to a lower level language (e.g., assembly language or machine
code). If the compiled program can run on a computer whose CPU or operating system is
different from the one on which the compiler runs, the compiler is known as a cross-
compiler. More generally, compilers are a specific type of translator.
A program that translates from a low level language to a higher level one is a decompiler. A
program that translates between high-level languages is usually called a source-to-source
compiler or transpiler. A language rewriter is usually a program that translates the form of
expressions without a change of language.
With the advent of high-level programming languages that followed FORTRAN, such
as COBOL, C, and BASIC, programmers could write machine-independent source programs.
A compiler translates the high-level source programs into target programs in machine
languages for the specific hardware. Once the target program is generated, the user can
execute the program.
INTERPRETERS :
In computer science, an interpreter is a computer program that directly executes,
i.e. performs, instructions written in aprogramming or scripting language, without
previously compiling them into a machine language program. An interpreter generally uses
one of the following strategies for program execution:
1. parse the source code and perform its behavior directly.
2. translate source code into some efficient intermediate representation and immediately
execute this.
3. explicitly execute stored precompiled code made by a compiler which is part of the
interpreter system.
4. A program that executes instructions written in a high-level language. There are two ways
to run programs written in a high-level language. The most common is to compile the
program; the other method is to pass the program through an interpreter.
5. An interpreter translates high-level instructions into an intermediate form, which it then
executes. In contrast, a compiler translates high-level instructions directly into machine
language. Compiled programs generally run faster than interpreted programs. The
advantage of an interpreter, however, is that it does not need to go through the
compilation stage during which machine instructions are generated. This process can be

CREC, Dept of MBA Page 18
time-consuming if the program is long. The interpreter, on the other hand, can
immediately execute high-level programs. For this reason, interpreters are sometimes
used during the development of a program, when a programmer wants to add small
sections at a time and test them quickly.
Both interpreters and compilers are available for most high-level languages.
However, BASIC and LISP are especially designed to be executed by an interpreter. In
addition, page description languages, such asPostScript, use an interpreter.
Process of Software Development :
Software development is the process of computer programming, documenting, testing,
and bug fixing involved in creating and maintaining applications and frameworks involved in
a software release life cycle and resulting in a software product.
There are following six phases in every Software development life cycle model:
1. Requirement gathering and analysis
2. Design
3. Implementation or coding
4. Testing
5. Evolution
6. Maintenance
1)Requirement gathering and
analysis: Business requirements are gathered in
this phase. This phase is themain focus of the project
managers and stake holders. Meetings with
managers, stake holders and users are held in order to determine the requirements like; Who
is going to use the system? How will they use the system? What data should be input into the
system? What data should be output by the system? These are general questions that get
answered during a requirements gathering phase. After requirement gathering these
requirements are analyzed for their validity and the possibility of incorporating the
requirements in the system to be development is also studied. Finally, a Requirement
Specification document is created which serves the purpose of guideline for the next phase of
the model.
2) Design: In this phase the system and software design is prepared from the requirement
specifications which were studied in the first phase. System Design helps in specifying
hardware and system requirements and also helps in defining overall system architecture. The
system design specifications serve as input for the next phase of the model.
In this phase the testers comes up with the Test strategy, where they mention what to test,
how to test.
3) Implementation / Coding: On receiving system design documents, the work is divided
in modules/units and actual coding is started. Since, in this phase the code is produced so it is
the main focus for the developer. This is the longest phase of the software development life
cycle.

CREC, Dept of MBA Page 19
4) Testing: After the code is developed it is tested against the requirements to make sure
that the product is actually solving the needs addressed and gathered during the requirements
phase. During this phase all types of functional testinglike unit testing, integration
testing, system testing, acceptance testing are done as well as non-functional testing are also
done.
5) Deployment: After successful testing the product is delivered / deployed to the customer
for their use.As soon as the product is given to the customers they will first do the beta
testing. If any changes are required or if any bugs are caught, then they will report it to the
engineering team. Once those changes are made or the bugs are fixed then the final
deployment will happen.
6) Maintenance: Once when the customers starts using the developed system then the actual
problems comes up and needs to be solved from time to time. This process where the care is
taken for the developed product is known as maintenance.
OPERATING SYSTEMS :
The Operating System (OS) is the most important program that runs on a computer.
Operating systems perform basic tasks, such as recognizing input from the keyboard,
sending output to the display screen, keeping track of files and directories on the disk, and
controlling peripheral devices such as disk drives and printers. Every general-purpose
computer must have an operating system to run other programs and applications.
Operating systems usually come pre-loaded on any computer you buy. Most people use the
operating system that comes with their computer, but it's possible to upgrade or even change
operating systems. The three most common operating systems for personal computers
are Microsoft Windows, Mac OS X, and Linux.
TYPES OF O.S. :
There are different types of operating systems. These are as follows:
1. Real-time Operating System: It is a multitasking operating system that aims at executing
real-time applications.
2. Multi-user and Single-user Operating Systems: The operating systems of this type allow
a multiple users to access a computer system concurrently.
3. Multi-tasking and Single-tasking Operating Systems:When a single program is allowed
to run at a time, the system is grouped under a single-tasking system, while in case the
operating system allows the execution of multiple tasks at one time, it is classified as a multi-
tasking operating system.
4. Distributed Operating System: An operating system that manages a group of
independent computers and makes them appear to be a single computer is known as a
distributed operating system.
5. Embedded System: The operating systems designed for being used in embedded
computer systems are known as embedded operating systems.

CREC, Dept of MBA Page 20
FUNCTIONS OF O.S. :
1. Program creation
2. Program execution
3. Access to Input/Output devices
4. Controlled access to files
5. System access
6. Error detection and response
7. Interpreting the commands
8. Managing peripherals
9. Memory management
10. Processor management
11. Information management
12. Process communication
13. Netoworking
BATCH PROCESSING : The users of batch operating system do not interact with the
computer directly. Each user prepares his job on an off-line device like punch cards and
submits it to the computer operator. To speed up processing, jobs or tasks with similar
needs are batched together and run as a group.
MULTITASKING AND MULTIPROGRAMMING :
Multitasking: More than one task/program/job/process can reside into the same CPU at
one point of time. This ability of the OS is called multitasking.
It is a logical extension of multiprogramming.It means running several tasks on
computer.Switching between the jobs is so fast that the user can interact with the system.
Multiprogramming: More than one task/program/job/process can reside into the main
memory at one point of time. This ability of the OS is called multiprogramming.
It means, running several programs on computer.Here user cannot interact with the
system,everything is decided by the OS.
DATABASE MANAGEMENT SYSTEMS : A Database Management System (DBMS) is system software for creating and managing
databases. The DBMS provides users and programmers with a systematic way to create,
retrieve, update and manage data.
Example Uses of Database Systems - Account maintenance & Access in Banking -
Lending Library systems – Airline reservation systems - Internet purchasing systems -
Media archives for radio/tv stations.
Field (Column): a single piece of information. Could be a name, or a number. In some
cases, it may even be a null or empty value.
Record (Row): A collection of related fields. A number of pieces of information that relate
to the same object. For example: If you keep records on an employee, you might have their
name, address, social security number, phone number, etc…Each piece of the information
relates back to one employee. This would be the employee’s record.
Table (File): A collection of related records. If you put all the employee records together,
you have a table of employees.
Database: A collection of tables. If you were keeping the company records, you might have
a table for employees, a table for customers, and another for sales records. All these tables
would be combined as a database.

CREC, Dept of MBA Page 21
Relational Database: A collection of related tables. The difference between a database and
a relational database is in the way the tables are constructed. If you were keeping the
company records on a series of Excel spreadsheets, you would have just a database. You
could pull information from each table, but you wouldn’t have the ability to use information
from one spreadsheet as a basis for asking questions about the information contained on
another sheet. In a relational database, the tables are constructed so that there is a logical link
between them. Based on the information that’s found in one table.
TYPES OF DATA MODELS :
Data Models are basically classifoed into three types. They are as follows:
1. Comceptual Models 2. Logical Data Model and 3. Physical Data Model.
Conceptual Models (sometimes called Semantic Models) are used to establish agreement
with business users about the most important 'Things of Interest' and Subject Areas in the
business.We use them when it is important to describe the areas of a business are being
affected.
This helps the user community to understand an Enterprise Data Model.
A Semantic Layer helps to translate terms like 'Party' to user-friendly equivalent, such as
'Customer' or 'Supplier'.It is valuable if the Semantic Layer is to be agreed with the business
community.
Logical Data Model (LDM) is where Data Modellers come into their own and add
significant value.
Subject Areas are LDMs for specific functional areas, such as Reservations and User
Workshops will be held to obtain User Buy-in.
A Physical Data Model (PDM) is usually generated in one of two ways - either by 'reverse
engineering' from a physical Database or automatically by the Modelling Tool, such
as ERwin or Dezign, that was used to design the Logical Data Models.
The design of the PDM will usually change to reflect the denormalization of the original
LDM to achieve improved performance.
The LDM is then preserved as a record of the Requirements and the PDM becomes the
solution to the Requirements.

CREC, Dept of MBA Page 22
UNIT - III

CREC, Dept of MBA Page 23
SOFTWARE PACKAGES
WORD PROCESSING :
Using a computer to create, edit, and print documents. Of all computer applications, word
processing is the most common. To perform word processing, you need a computer, a
special program called a word processor, and a printer. A word processor enables you to create a
document, store it electronically on a disk, display it on a screen, modify it by
entering commands and characters from the keyboard, and print it on a printer.
Word processors that support only these features (and maybe a few others) are called text
editors. Most word processors, however, support additional features that enable you to
manipulate and format documents in more sophisticated ways. These more advanced word
processors are sometimes called full-featured word processors.
Full-featured word processors usually support the following features:
File management :Many word processors contain file management capabilities that
allow you to create, delete, move, and search for files.
Font specifications: Allows you to change fonts within a document. For example,
you can specify bold, italics, and underlining. Most word processors also let you
change the font size and even the typeface.
Footnotes and Cross-references: Automates the numbering and placement of
footnotes and enables you to easily cross-reference other sections of the document.
Graphics: Allows you to embed illustrations and graphs into a document. Some word
processors let you create the illustrations within the word processor; others let you
insert an illustration produced by a different program.
Headers , Footers and Page numbering: Allows you to specify customized headers
and footers that the word processor will put at the top and bottom of every page. The
word processor automatically keeps track of page numbers so that the correct number
appears on each page.
Layout : Allows you to specify different margins within a single document and to
specify various methods for indenting paragraphs.
Macros : A macro is a character or word that represents a series of keystrokes. The
keystrokes can represent text or commands. The ability to define macros allows you
to save yourself a lot of time by replacing common combinations of keystrokes.
Merges: Allows you to merge text from one file into another file. This is particularly
useful for generating many files that have the same format but different data.
Generating mailing labels is the classic example of using merges.
Spell checker : A utility that allows you to check the spelling of words. It
will highlight any words that it does not recognize.
Tables of contents and Indexes: Allows you to automatically create a table of
contents and index based on special codes that you insert in the document.
Thesaurus: A built-in thesaurus that allows you to search for synonyms without
leaving the word processor.
Windows : Allows you to edit two or more documents at the same time. Each
document appears in a separate window. This is particularly valuable when working
on a large project that consists of several different files.
CREC, Dept of MBA Page 24
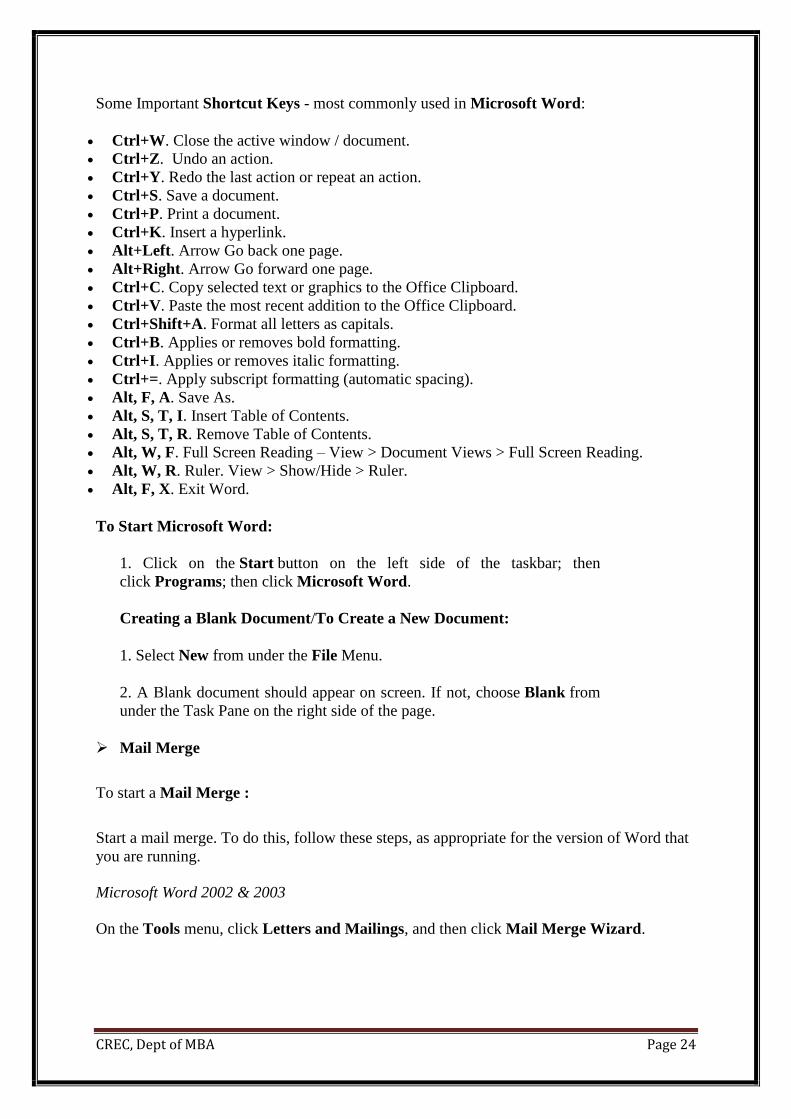
Some Important Shortcut Keys - most commonly used in Microsoft Word:
Ctrl+W. Close the active window / document.
Ctrl+Z. Undo an action.
Ctrl+Y. Redo the last action or repeat an action.
Ctrl+S. Save a document.
Ctrl+P. Print a document.
Ctrl+K. Insert a hyperlink.
Alt+Left. Arrow Go back one page.
Alt+Right. Arrow Go forward one page.
Ctrl+C. Copy selected text or graphics to the Office Clipboard.
Ctrl+V. Paste the most recent addition to the Office Clipboard.
Ctrl+Shift+A. Format all letters as capitals.
Ctrl+B. Applies or removes bold formatting.
Ctrl+I. Applies or removes italic formatting.
Ctrl+=. Apply subscript formatting (automatic spacing).
Alt, F, A. Save As.
Alt, S, T, I. Insert Table of Contents.
Alt, S, T, R. Remove Table of Contents.
Alt, W, F. Full Screen Reading – View > Document Views > Full Screen Reading.
Alt, W, R. Ruler. View > Show/Hide > Ruler.
Alt, F, X. Exit Word.
To Start Microsoft Word:
1. Click on the Start button on the left side of the taskbar; then
click Programs; then click Microsoft Word.
Creating a Blank Document/To Create a New Document:
1. Select New from under the File Menu.
2. A Blank document should appear on screen. If not, choose Blank from
under the Task Pane on the right side of the page.
Mail Merge
To start a Mail Merge :
Start a mail merge. To do this, follow these steps, as appropriate for the version of Word that
you are running.
Microsoft Word 2002 & 2003
On the Tools menu, click Letters and Mailings, and then click Mail Merge Wizard.

CREC, Dept of MBA Page 25
Microsoft Office Word 2007
On the Mailings tab, click Start Mail Merge, and then click Step by Step Mail Merge
Wizard.
Select document type :
1. In the Mail Merge task pane, click Letters. This will allow you to send letters to a group of
people and personalize the results of the letter that each person receives.
2. Click Next: Starting document.
Select the starting document
1. Click one of the following options:
Use the current document: Use the currently open document as your main document.
Start from a template: Select one of the ready-to-use mail merge templates.
Start from existing document: Open an existing document to use as your mail merge main
document.
2. In the Mail Merge task pane, click Next - Select recipients.
Select recipients :
When you open or create a data source by using the Mail Merge Wizard, you are telling
Word to use a specific set of variable information for your merge. Use one of the following
methods to attach the main document to the data source.
Method 1: Use an existing data source
To use an existing data source, follow these steps:
1. In the Mail Merge task pane, click Use an existing list.
2. In the Use an existing list section, click Browse.
3. In the Select Data Source dialog box, select the file that contains the variable information
that you want to use, and then click Open.
Note If the data source is not listed in the list of files, select the appropriate drive and folder.
If necessary, select the appropriate option in the All Data Sources list. Select the file, and
then click Open.
CREC, Dept of MBA Page 26
Word displays the Mail Merge Recipients dialog box. You can sort and edit your data if you
want to.
4. Click OK to return to the main document.
5. Save the main document.
When you save the main document at this point, you are also saving the data source and
attaching the data source to the main document.
6. Type the name that you want to give to your main document, and then click Save.
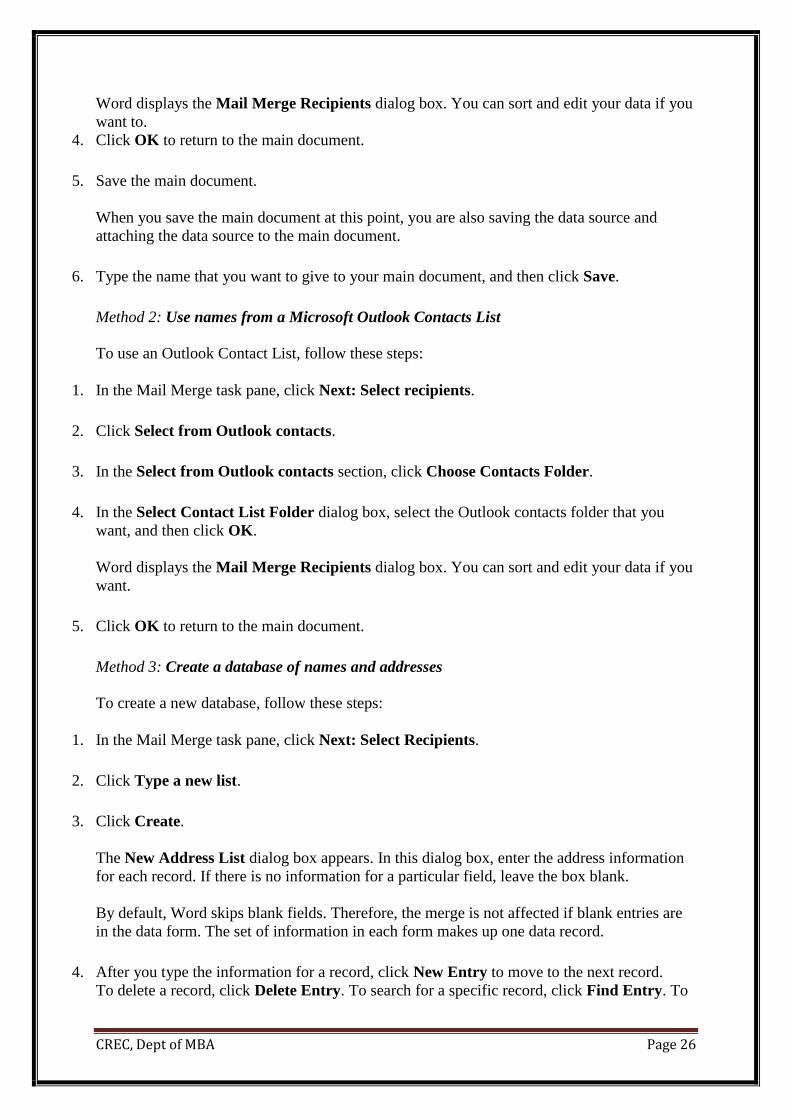
Method 2: Use names from a Microsoft Outlook Contacts List
To use an Outlook Contact List, follow these steps:
1. In the Mail Merge task pane, click Next: Select recipients.
2. Click Select from Outlook contacts.
3. In the Select from Outlook contacts section, click Choose Contacts Folder.
4. In the Select Contact List Folder dialog box, select the Outlook contacts folder that you
want, and then click OK.
Word displays the Mail Merge Recipients dialog box. You can sort and edit your data if you
want.
5. Click OK to return to the main document.
Method 3: Create a database of names and addresses
To create a new database, follow these steps:
1. In the Mail Merge task pane, click Next: Select Recipients.
2. Click Type a new list.
3. Click Create.
The New Address List dialog box appears. In this dialog box, enter the address information
for each record. If there is no information for a particular field, leave the box blank.
By default, Word skips blank fields. Therefore, the merge is not affected if blank entries are
in the data form. The set of information in each form makes up one data record.
4. After you type the information for a record, click New Entry to move to the next record.
To delete a record, click Delete Entry. To search for a specific record, click Find Entry. To

CREC, Dept of MBA Page 27
customize your list, click Customize. In the Customize Address List dialog box, you can
add, delete, rename, and reorder the merge fields.
5. In the New Address List dialog box, click OK. In the Save Address List dialog box, type
the name that you want to give to your data source in the File name box, and then click Save.
6. In the Mail Merge Recipients dialog box, make any changes that you want, and then
click OK.
7. Click Next: Write your letter to finish setting up your letter.
8. Save the main document.
When you save the main document at this point, you are also saving the data source and
attaching the data source to the main document.
9. Type the name that you want to give to your main document, and then click Save.
To proceed to the next step, click Next: Write your letter.
M.S. EXCEL :
Excel is a massive application with 1000s of features and 100s of ribbon (menu) commands.
It is very easy to get lost once you open Excel. So one of the basic survival skills is to
understand how to navigate Excel and access the features you are looking for.
When you open Excel, this is how it looks.
There are 5 important areas in the screen.
CREC, Dept of MBA Page 28
1. Quick Access Toolbar : This is a place where all the important tools can be placed. When
you start Excel for the very first time, it has only 3 icons (Save, Undo, Redo). But you can
add any feature of Excel to to Quick Access Toolbar so that you can easily access it from
anywhere (hence the name).
2. Ribbon: Ribbon is like an expanded menu. It depicts all the features of Excel in easy to
understand form. Since Excel has 1000s of features, they are grouped in to several ribbons.
The most important ribbons are – Home, Insert, Formulas, Page Layout & Data.
3. Formula Bar: This is where any calculations or formulas you write will appear. You will
understand the relevance of it once you start building formulas.
4. Spreadsheet Grid: This is where all your numbers, data, charts & drawings will go. Each
Excel file can contain several sheets. But the spreadsheet grid shows few rows & columns of
active spreadsheet. To see more rows or columns you can use the scroll bars to the left or at
bottom. If you want to access other sheets, just click on the sheet name (or use the shortcut
CTRL+Page Up or CTRL+Page Down).
5. Status bar: This tells us what is going on with Excel at any time. You can tell if Excel is
busy calculating a formula, creating a pivot report or recording a macro by just looking at the
status bar. The status bar also shows quick summaries of selected cells (count, sum, average,
minimum or maximum values). You can change this by right clicking on it and choosing
which summaries to show.
EXCEL - FORMULAE :
FORMULAS AND FUNCTIONS :
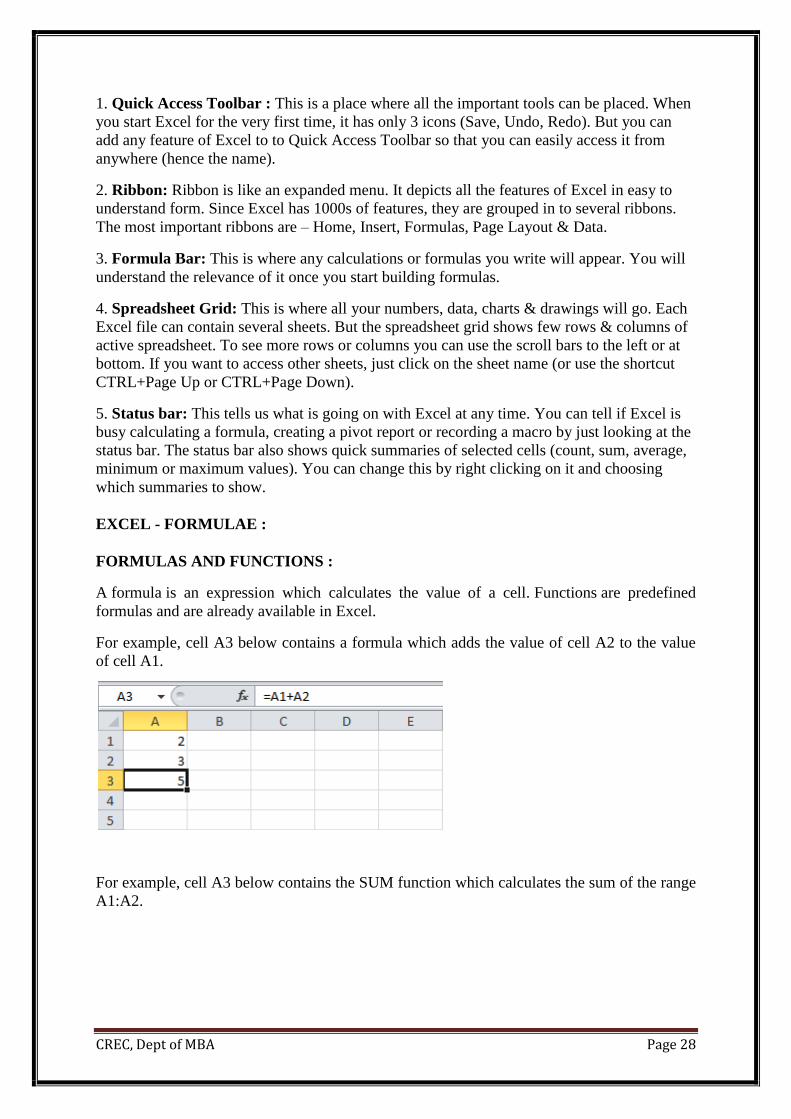
A formula is an expression which calculates the value of a cell. Functions are predefined
formulas and are already available in Excel.
For example, cell A3 below contains a formula which adds the value of cell A2 to the value
of cell A1.
For example, cell A3 below contains the SUM function which calculates the sum of the range
A1:A2.

CREC, Dept of MBA Page 29
Enter a Formula
To enter a formula, execute the following steps.
1. Select a cell.
2. To let Excel know that you want to enter a formula, type an equal sign (=).
3. For example, type the formula A1+A2.
Tip: instead of typing A1 and A2, simply select cell A1 and cell A2.
4. Change the value of cell A1 to 3.
Excel automatically recalculates the value of cell A3. This is one of Excel's most powerful
features!
Edit a Formula
When you select a cell, Excel shows the value or formula of the cell in the formula bar.

CREC, Dept of MBA Page 30
1. To edit a formula, click in the formula bar and change the formula.
2. Press Enter.
Operator Precedence
Excel uses a default order in which calculations occur. If a part of the formula is in
parentheses, that part will be calculated first. It then performs multiplication or division
calculations. Once this is complete, Excel will add and subtract the remainder of your
formula. See the example below.
First, Excel performs multiplication (A1 * A2). Next, Excel adds the value of cell A3 to this
result.
Another example,

CREC, Dept of MBA Page 31
First, Excel calculates the part in parentheses (A2+A3). Next, it multiplies this result by the
value of cell A1.
Copy/Paste a Formula
When you copy a formula, Excel automatically adjusts the cell references for each new cell
the formula is copied to. To understand this, execute the following steps.
1. Enter the formula shown below into cell A4.
2a. Select cell A4, right click, and then click Copy (or press CTRL + c)...
...next, select cell B4, right click, and then click Paste under 'Paste Options:' (or press CTRL
+ v).
2b. You can also drag the formula to cell B4. Select cell A4, click on the lower right corner of
cell A4 and drag it across to cell B4. This is much easier and gives the exact same result!
Result. The formula in cell B4 references the values in column B.

CREC, Dept of MBA Page 32
CHARTS :
Charts are used to display series of numeric data in a graphical format to make it easier to
understand large quantities of data and the relationship between different series of data.
This step-by-step article explains how to use the Chart Wizard in Microsoft Excel to create a
chart.
To create a chart, you must first enter the data for the chart on an Excel worksheet. Select that
data, and then use the Chart Wizard to step through the process of selecting a chart type and
the various chart options for your chart. To do this, follow these steps:
1. Start Excel, and then open your workbook.
2. Select the cells that contain the data that you want to display in your chart.
3. Select the Insert Tab
4. Select the Chart type you want to create
Modify the Appearance of Your Chart
After you have created your chart, you can change any of the chart settings so that it looks the
way that you want. To do this, right-click your chart, and then click any of the following:
Chart Type: with this, you can change the chart type.
Source Data: with this, you can change the data range or worksheet ranges for each series in
your chart.
Chart Options: with this, you can set different chart options.
Location: with this, you can change the location in which your chart is displayed.
Additionally, Excel offers many formatting options that you can use to customize your chart
more. You can double-click various elements of your chart to modify that specific item. A
dialog box then appears and you can select the settings specific to the chart item to modify its
appearance. For example, you can apply colors, borders, and fill effects to various chart
items, add pictures to chart items, change number and axis formatting, and modify the font,
size, and alignment of text in a chart.
CREC, Dept of MBA Page 33
BASIS STATISTICAL FORMULAE :
1. SUM
Formula: =SUM(5, 5) or =SUM(A1, B1) or =SUM(A1:B5)
The SUM formula does exactly what you would expect. It allows you to add 2 or more
numbers together. You can use cell references as well in this formula.
The above shows you different examples. You can have numbers in there separated by
commas and it will add them together. we can have cell references and as long as there are
numbers in those cells it will add them together for us, or we can have a range of cells with
a colon in between the 2 cells, and it will add the numbers in all the cells in the range.
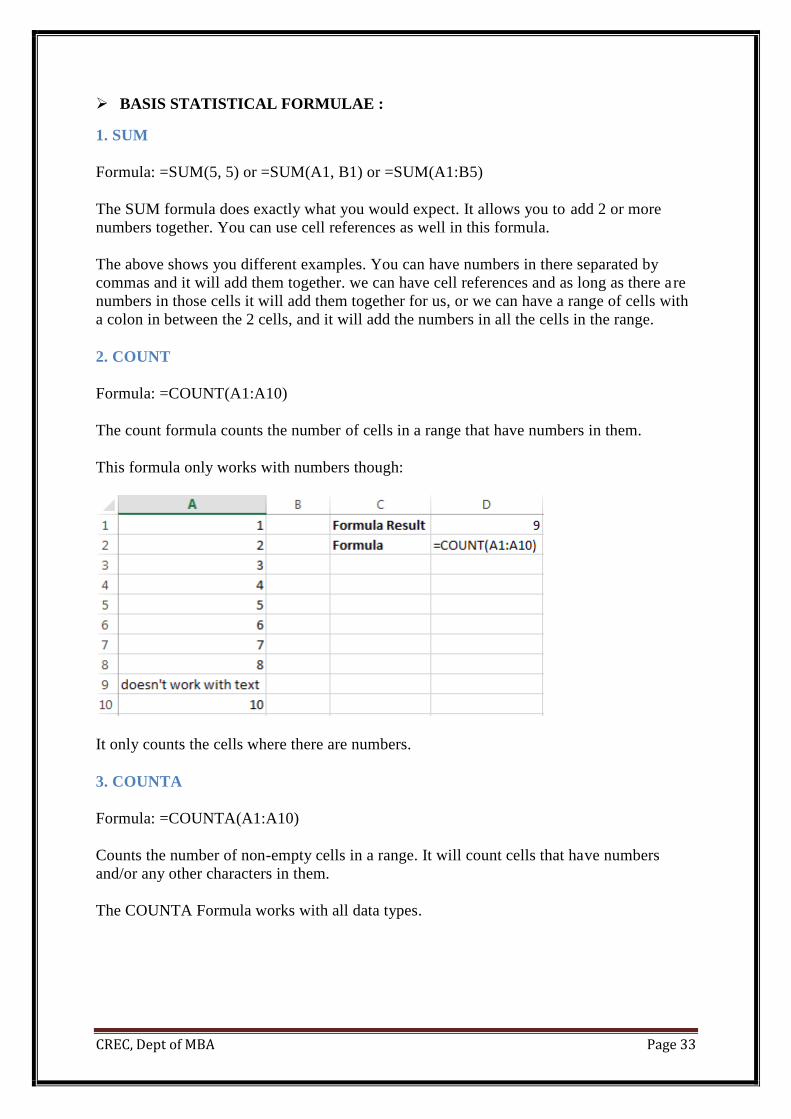
2. COUNT
Formula: =COUNT(A1:A10)
The count formula counts the number of cells in a range that have numbers in them.
This formula only works with numbers though:
It only counts the cells where there are numbers.
3. COUNTA
Formula: =COUNTA(A1:A10)
Counts the number of non-empty cells in a range. It will count cells that have numbers
and/or any other characters in them.
The COUNTA Formula works with all data types.

CREC, Dept of MBA Page 34
It counts the number of non-empty cells no matter the data type.
4. IF Statements
Formula: =IF(logical_statement, return this if logical statement is true, return this if logical
statement is false)
When you’re doing an analysis of a lot of data in Excel there are a lot of scenarios you
could be trying to discover and the data has to react differently based on a different
situation.
Continuing with the sales example: Let’s say a salesperson has a quota to meet. You used
VLOOKUP to put the revenue next to the name. Now you can use an IF statement that
says: “IF the salesperson met their quota, say “Met quota”, if not say “Did not meet quota”
(Tip: saying it in a statement like this can make it a lot easier to create the formula,
especially when you get to more complicated things like Nested IF Statements in Excel).
It would look like this:
In the example with the VLOOKUP we had the revenue in column B and the person’s name
in column C (brought in with the VLOOKUP). We could put their quota in column D and
then we’d put the following formula in cell E1:
=IF(C3>D3, “Met Quota”, “Did Not Meet Quota”)
This IF statement will tell us if the first salesperson met their quota or not. We would then
copy and paste this formula along all the entries in the list. It would change for each sales
person.

CREC, Dept of MBA Page 35
Having the result right there from the IF statement is a lot easier than manually figuring this
out.
5. SUMIF, COUNTIF, AVERAGEIF
Formulas: =SUMIF(range, criteria, sum_range), =COUNTIF(range, criteria),
=AVERAGEIF(range, criteria, average_range)
These formulas all do their respective functions (SUM, COUNT, AVERAGE) IF the
criteria are met. There are also the formulas: SUMIFS, COUNTIFS, AVERAGEIFS where
they will do their respective functions based on multiple criteria you give the formula.
We use these formulas in our example to see the average revenue (AVERAGEIF) if a
person met their quota, Total revenue (SUMIF) for the just the sales people who met their
quota, and the count of sales people who met their quota (COUNTIF)

CREC, Dept of MBA Page 36
6. CONCATENATE
A fancy word for combining data in 2 (or more) different cells into one cell. This can be
done with the Concatenate excel formula or it can be done by simply putting the
& symbol in between the two cells. If I have “Steve” in cell A1 and “Quatrani” in cell B1 I
could put this formula: =A1&” “&B1 and it would give me “Steve Quatrani”. (The “ “ puts
a space in between what you are combining with the &). I can use =concatenate(A1, “ “,
B1) and it will give me the same thing: “Steve Quatrani”
M.S.POWERPOINT :
PowerPoint is a highly innovative and versatile program that can ensure you a successful
communication whether you’re presenting in front of potential investors, a lecture theatre or
simply in front of your colleagues. Below are five features you should be using – if you aren't
already. Learn everything about these tips: they will improve your presentation skills and
allow you to Communicate your message successfully.
1) Adding Smart Art
Don’t confuse Smart Art with the similarly named WordArt. Where WordArt just allows you
to display text using a wide variety of different formats and effects, Smart Art is a
comprehensive and flexible business diagram tool that greatly improves upon the ‘Diagram
Gallery’ feature found in previous versions of Office.
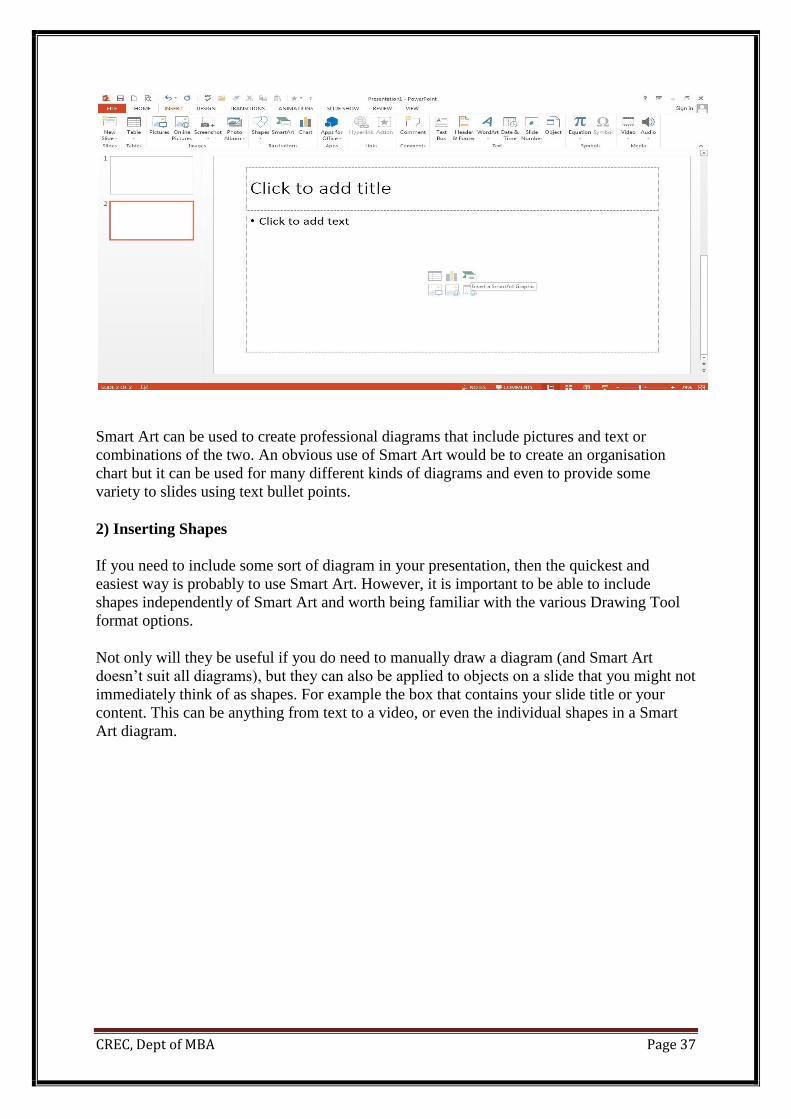
Click the insert Smart Chart Graphic to choose from a selection of options.
CREC, Dept of MBA Page 37
Smart Art can be used to create professional diagrams that include pictures and text or
combinations of the two. An obvious use of Smart Art would be to create an organisation
chart but it can be used for many different kinds of diagrams and even to provide some
variety to slides using text bullet points.
2) Inserting Shapes
If you need to include some sort of diagram in your presentation, then the quickest and
easiest way is probably to use Smart Art. However, it is important to be able to include
shapes independently of Smart Art and worth being familiar with the various Drawing Tool
format options.
Not only will they be useful if you do need to manually draw a diagram (and Smart Art
doesn’t suit all diagrams), but they can also be applied to objects on a slide that you might not
immediately think of as shapes. For example the box that contains your slide title or your
content. This can be anything from text to a video, or even the individual shapes in a Smart
Art diagram.
CREC, Dept of MBA Page 38
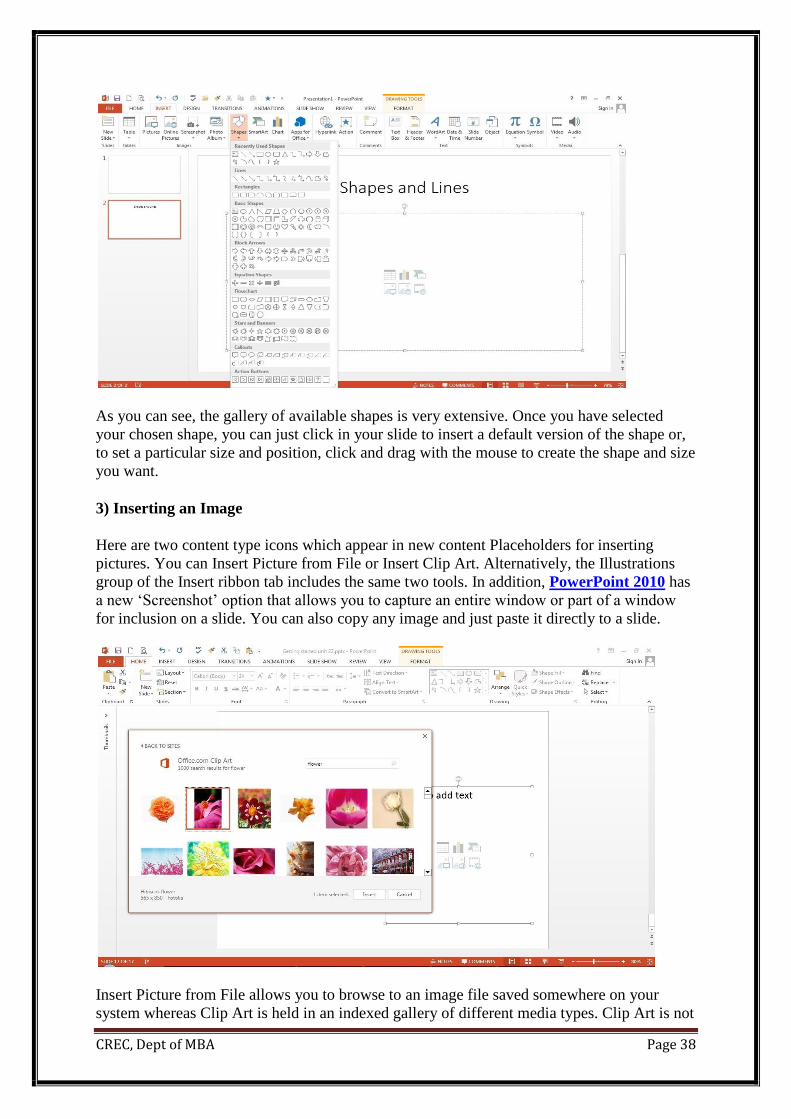
As you can see, the gallery of available shapes is very extensive. Once you have selected
your chosen shape, you can just click in your slide to insert a default version of the shape or,
to set a particular size and position, click and drag with the mouse to create the shape and size
you want.
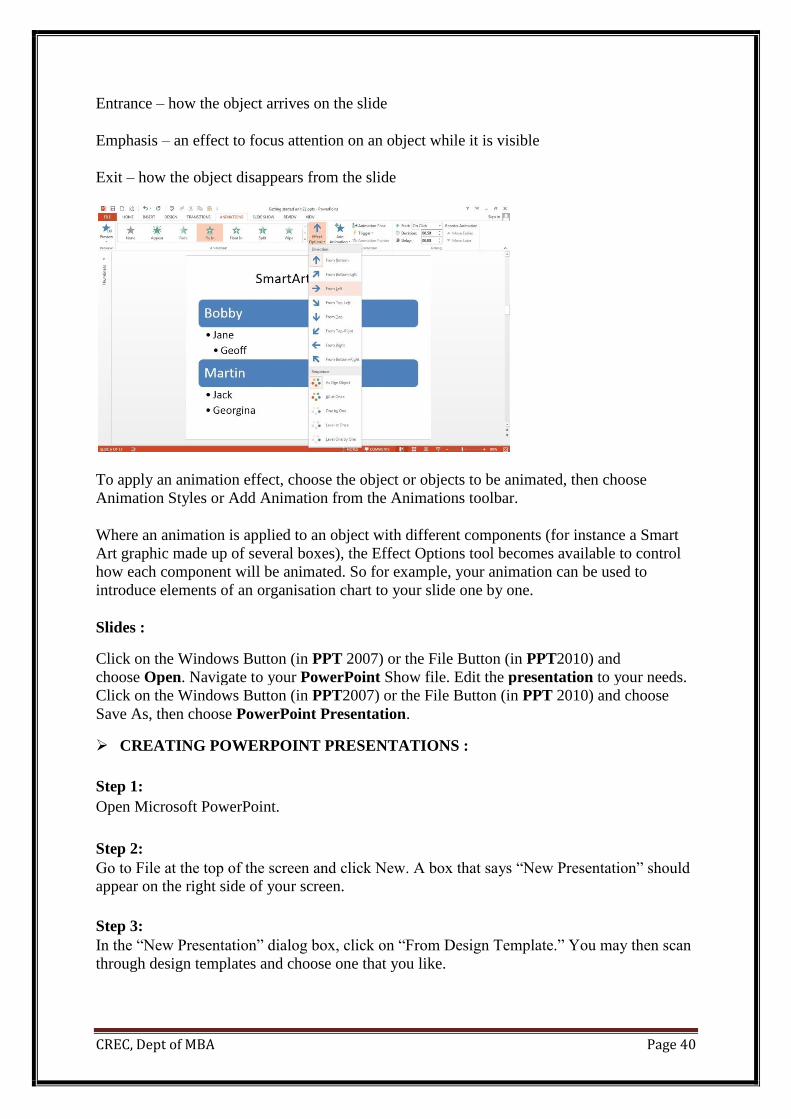
3) Inserting an Image
Here are two content type icons which appear in new content Placeholders for inserting
pictures. You can Insert Picture from File or Insert Clip Art. Alternatively, the Illustrations
group of the Insert ribbon tab includes the same two tools. In addition, PowerPoint 2010 has
a new ‘Screenshot’ option that allows you to capture an entire window or part of a window
for inclusion on a slide. You can also copy any image and just paste it directly to a slide.
Insert Picture from File allows you to browse to an image file saved somewhere on your
system whereas Clip Art is held in an indexed gallery of different media types. Clip Art is not

CREC, Dept of MBA Page 39
limited to pictures: ‘The Results should be:’ box lets you choose between: ‘All media file
types’ and one or more of the following different types:
Illustrations
Photographs
Video
Audio
Once you have found the image you want to use, click on it to insert it into the current slide.
You can now re-size and move the image accordingly with further editing options available
when you right click the desired image.
4) Slide Transitions
Properly used, slide transitions can be make your presentations clearer and more interesting
and, where appropriate, more fun. Badly used, the effect of slide transitions can be closer to
irritating or even nauseating. Simple animation effects are often used to add interest to bullet
point text. Much more extreme animation effects are available but, in most cases, should be
used sparingly if at all.
Two main kinds of animation are available in a PowerPoint presentation: the transition from
one slide to the next and the animation of images/text on a specific slide.
In PowerPoint 2010 & 2013 there is also a separate Transitions ribbon tab that includes a
gallery of different transition effects. These can be applied to selected slides or all slides. If
you want to apply different transition effects to different groups of slides, then you might
want to choose ‘Slide Sorter’ view from the Presentation Views group of the View ribbon.
5) Adding Animations
Whereas the transition effects are limited to a single event per slide, animations can be
applied to every object on a slide – including titles and other text boxes. Many objects can
even have animation applied to different components, for example each shape in a Smart Art
graphic, each paragraph in a text box and each column in a chart. Animations can be applied
to three separate ‘events’ for each object:
CREC, Dept of MBA Page 40
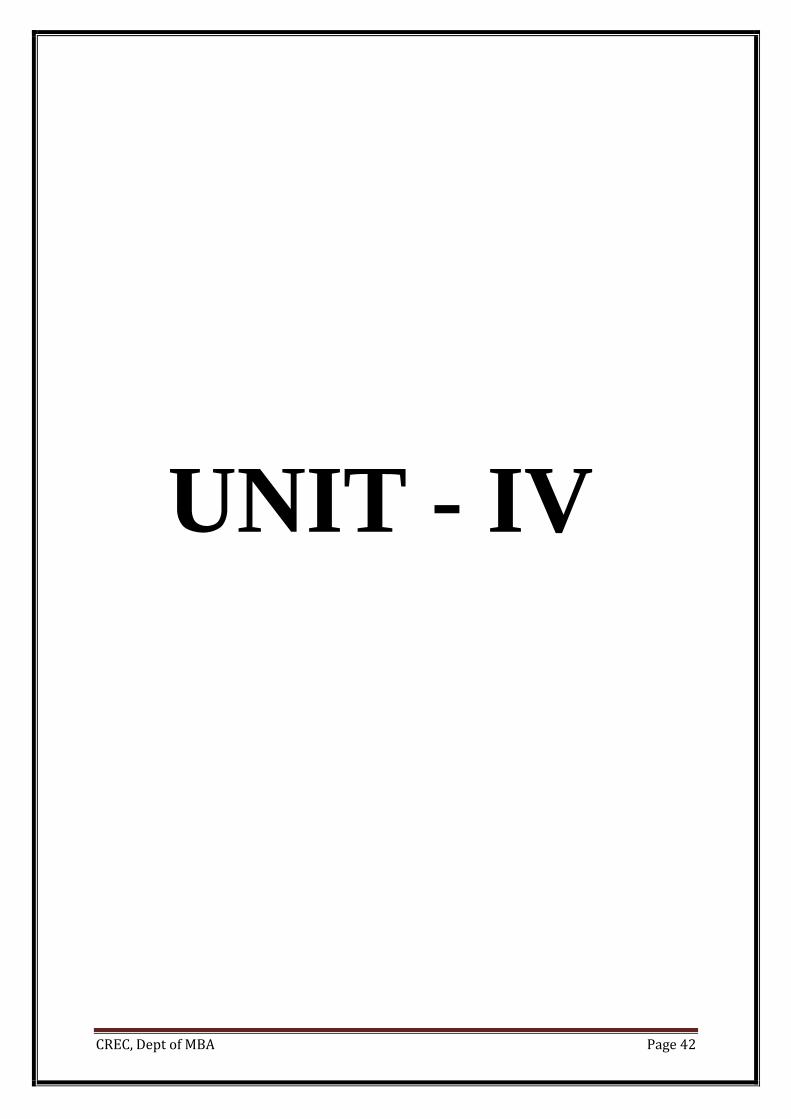
Entrance – how the object arrives on the slide
Emphasis – an effect to focus attention on an object while it is visible
Exit – how the object disappears from the slide
To apply an animation effect, choose the object or objects to be animated, then choose
Animation Styles or Add Animation from the Animations toolbar.
Where an animation is applied to an object with different components (for instance a Smart
Art graphic made up of several boxes), the Effect Options tool becomes available to control
how each component will be animated. So for example, your animation can be used to
introduce elements of an organisation chart to your slide one by one.
Slides :
Click on the Windows Button (in PPT 2007) or the File Button (in PPT2010) and
choose Open. Navigate to your PowerPoint Show file. Edit the presentation to your needs.
Click on the Windows Button (in PPT2007) or the File Button (in PPT 2010) and choose
Save As, then choose PowerPoint Presentation.
CREATING POWERPOINT PRESENTATIONS :
Step 1:
Open Microsoft PowerPoint.
Step 2:
Go to File at the top of the screen and click New. A box that says “New Presentation” should
appear on the right side of your screen.
Step 3:
In the “New Presentation” dialog box, click on “From Design Template.” You may then scan
through design templates and choose one that you like.

CREC, Dept of MBA Page 41
Step 4: Slide Design
Select a design template by clicking on the template you like. You may choose a different
color for your template by clicking on “Color Schemes” in the “New Presentation” dialog
box.
Step 5: Slide Layout
Change the Slide Layout. You may change the slide layout (how information is presented in
the slide) by going to the top of the screen and clicking on “Format” – “Slide Layout.” A box
will appear on the right side of your screen (where “New Presentation” appeared) labeled
“Slide Layout.” You may select a design by clicking on it.
Step 6: Adding Text
Enter your text by clicking and then typing in the box titled “Click to Add Text” or “Click to
Add Title.”
Step 7: Adding Pictures
You may add pictures by clicking on the box that says “Click to add content.” Inside that
box, there will be a smaller box with six icons. Click on the icon that looks like a photograph
of a mountain. A new window will open, allowing you to browse for a picture on your
computer or a CD. Once you find your picture, click on it and then click “Insert.”
Step 8: Resizing Pictures
You may change the size of your picture by clicking on the picture. The picture will then
have black lines around it with small bubbles or boxes in the corners. Place your mouse over
the bubbles or boxes and click. Holding the mouse pointer down, drag the picture to the size
you want.
CREC, Dept of MBA Page 42
UNIT - IV

CREC, Dept of MBA Page 43
DATA COMMUNICATIONS AND NETWORKS
Data communications refers to the transmission of this digital data between two or more
computers and a computer network or data network is a telecommunications network that
allows computers to exchange data.
Data Communication has two types Local and Remote which are discussed below :
Local:
Local communication takes place when the communicating devices are in the same
geographical area, same building, face-to-face between individuals etc.
Remote:
Remote communication takes place over a distance i.e. the devices are farther. Effectiveness
of a Data Communication can be measured through the following features :
1. Delivery : Delivery should be done to the correct destination.
2. Timeliness : Delivery should be on time.
3. Accuracy : Data delivered should be accurate.
CONCEPTS OF DATA COMMUNICATIONS :
1. Message : It is the information to be delivered.
2. Sender : Sender is the person who is sending the message.
3. Receiver : Receiver is the person to him the message is to be delivered.
4. Medium : It is the medium through which message is to be sent for example modem.
5. Protocol : These are some set of rules which govern data communication.
NETWORKS :
A Network is simply a group of computers that are connected together for sharing
information and resources. Several such networks have been joined together across the globe
to form what is called as the Internet? Thus, Internet is nothing but a Network of networks.
A Network is a system of interconnected computers that can communicate with one another.
Networks allow users to share peripheral devices (peripheral devices are nothing but input –
output devices connected to the computer), program and data. A network need not be only of
interconnected computers but, even interconnected telephone or any communication device
that can communicate to each other and share the existing resources.
Many computer Networks are served by a host computer (or simply host) called Server. A
“Server” is a computer shared by several users in a network. A “Node” is a device that is
attached to a network. A node may be a microcomputer through which a user can
communicate with the server and share the resources. A node may also be resources like
storage device or any peripheral device.
There are also computer networks connected as Peer – to – Peer. The word Peer denotes -
one who is equal in standing with another. This type of Network does not have any computer
as Server or Node. Microcomputers in a peer-to-peer network, communicated directly with
one another without relying on a server.

CREC, Dept of MBA Page 44
Advantages of Networks
a) Sharing of peripheral devices: Laser Printers, Hard disk drives and Scanners are
examples of peripheral devices. All these devices cannot be connected to each and every
computer as they are very expensive. Hence, these devices can be shared by many users
through a network.
b) Sharing of Programs and data: In many organizations, people use almost the same
software and access the same data. If these software and data were made available for
individual users separately, then it is wastage of memory. Hence, by sharing the software and
data the usage of memory can be minimized, thereby minimizing the expense.
c) Better Communication: In the digital world, information can be transferred within
fraction of a second over long distances. And one of the greatest features of networks is
Electronic Mail (E-Mail) system. Thus, a company can eliminate the delays encountered
with standard postal services or with telephone tag, by using E-Mail services.
d) Security of information: Before networks became a common place, an individual
employee was storing information in his or her desktop computer which was not secured.
But today, such data or information could be backed-up or duplicated on a network storage
device, shared by others.
Types of Network
Based on the size, the Networks are classified into three types:
(a) Local Area Networks (LAN)
(b) Metropolitan Area Network (MAN)
(c) Wide Area Network (WAN)
a) Local Area Network very popularly called as LAN and is a privately owned network that
serves users within a single building as an office, or a group of buildings close together as a
college campus.
b) Metropolitan Area Network, very popularly called as MAN is a communication network
covering a large geographic area when compared to LAN, like a city or suburb. A MAN can
support both data and voice, and might even be related to the local cable television network.
Cellular phone systems are also those systems that come under this type of Network. A
MAN is basically bigger version of a LAN covering a group of nearby corporate offices in a
city and might be either private or public.
c) Wide Area Network, very popularly called as WAN is communication Network spanning
a huge geographical area like a state, country or a continent. It contains a collection of
machines intended for running user (i.e., application) programs. The Internet links together
hundreds of computer WANs.
TYPES OF DATA COMMUNICATION NETWORKS :
A computer network or data network is a telecommunications network which
allows computers to exchange data. In computer networks, networked computing devices
exchange data with each other using a data link. The connections between nodes are
established using either cable media or wireless media. The best-known computer network is
the Internet.
CREC, Dept of MBA Page 45
Network computer devices that originate, route and terminate the data are called network
nodes.[1] Nodes can include hosts such aspersonal computers, phones, servers as well
as networking hardware. Two such devices can be said to be networked together when one
device is able to exchange information with the other device, whether or not they have a
direct connection to each other.
Computer networks differ in the transmission medium used to carry their signals,
the communications protocols to organize network traffic, the network's size, topology and
organizational intent.
Network Topology
Networks can be laid out in different ways. The Physical layout or shape of a Network is
called Topology.
The different network topologies are-
(a) Star Topology
(b) Bus Topology
(c) Ring Topology
(d) Mesh Topology
(e) Tree Topology
a) A Star topology is one in which all microcomputers and other communication devices
(nodes) are connected to a central hub, such as a Server or a Host computer via cables. This
creates a fault tolerant system, that is able to survive if one or two of the workstations
develops a bad link. But just like any system, a topology is only as strong as its weakest link.
If the central hub or server malfunctions, the entire network fails. The advantage of a star
topology is that, if a connection fails, the rest of the devices on the network will continue to
operate. The disadvantage of a star topology is that the information is centralized.
b) The Bus topology is the simplest of the network configurations. The development of
computer system architecture, give rise to the concept of a bus, or highway approach to
information transfer. It requires less cable than any other topology. In Bus topology all
microcomputers and devices are connected through a common channel using co-axial cables.
This layout forces every signal to be equally available to every device; thus, high traffic use
will cause the network to slow. In this topology, if any connection to the node fails the entire
network fails.

CREC, Dept of MBA Page 46
c) A Ring topology is the one in which all microcomputers and other communication devices
are connected in a continuous loop. Electronic messages are passed around the ring in one
direction, with each node serving as the repeater, until they reach the right destination. Since,
all messages are flowing in only one direction; failure of a single node can compromise the
entire network.
d) A Mesh topology is the one which requires that every terminal is connected to every other
terminal in the network. Data transmission is faster than the earlier topologies. If a particular
path or Node fails, data can be routed via alternate paths.
e) A Tree topology requires the computers to be linked in a hierarchical way. Data
transmission in this topology is relatively slower. The tree network like the star network is
dependent on the main computer. Hence, the failure of the main computer shall lead to the
failure of the entire network. The tree network is very flexible as any number of nodes can be
added or removed easily.

CREC, Dept of MBA Page 47
COMMUNICATION MEDIA :
Communication media refers to the means of delivering and receiving data or information. In
telecommunication, these means are transmission and storage tools or channels for data
storage and transmission.
The term is also commonly used in place of mass media or news media.
It involves in Social media, News, Internet, Radio, etc.
CONCEPTS OF COMPUTER NETWORKS :
The different types of networks generally have the following points in common:
Servers: computers which provided shared resources to users, by means of a network
server.
Clients: computers which access the shared resources provided by a network server.
Connection medium: how the computers are linked together.
Shared data: Files that can be accessed on the network servers
Printers and other shared peripherals: files, printers, or other elements employed by the
network's users
Miscellaneous resources: other resources provided by the server
INTERNET :
Internet or simply “the Net” is an international network connecting more than 140,000
smaller networks in more than 170 countries. These networks are formed by educational,
commercial, nonprofit, government and military organization. On a given day 163 million
computers in 200 countries get connected to the Internet.
What is Internet?
The term Inter Net has been coined from two terms, Interconnection and Network.
A Network is simply a group of computers that are connected together for sharing
information and resources. Several such networks have been joined together across the globe
to form what is called as the Internet? Thus, Internet is nothing but a Network of networks.
There is no single, generally agreed-upon answer to the question because the Internet
is different for each of us:

CREC, Dept of MBA Page 48
It is a set of computers talking over fiber optics, phone lines, satellite links, and other
media.
It is a place where you can talk to your friends and family around the world.
It is a place to get cool game demos.
It is an ocean of resources waiting to be mined.
It is a place to do research for your thesis or a business presentation.
It is unlimited commercial opportunity.
It is a worldwide support group for any problem or need.
It is a gold mine of professionals in all fields sharing information about their work.
It is hundreds of libraries and archives that are open to your fingertips.
It is the ultimate time-waster.
It is the technology of the future that will help make our lives, and those of our children,
brighter.
History of Internet
In 1969, the U.S. Defense department built the Internet under the name ARPANET.
(ARPA – Advanced Research Project Agency) to serve two purposes.
The first was to share research among military, industry and university sources.
The second was to provide a system for establishing communication among military
units in the event of a nuclear attack.
Soon after, other private networks came up following the design of ARPAnet.
In 1998 the NSF (National Science Foundation) created NSFnet a network with FIVE
super computers as a help to establish effective communication amongst universities.
Although the Internet was originally meant for research purposes, it has now changed
drastically and is mainly used for commercial purposes.
Although there are organizations that help to manage different parts of the network,
but there is no single body that owns the Internet.
Applications of Internet
As rightly mentioned earlier the Internet was originally meant for research purposes,
and now it has drastically changed for commercial purposes. Due to this drastical change the
applications of Internet are increasing day by day. Following are the few applications of
Internet.
a) Accessing and obtaining Information.
The faster growing part of the Internet is the World Wide Web (WWW). The World
Wide Web or simply the Web consists of an interconnected system of sites called Websites.
To access a website, web browser software like Microsoft’s Internet Explorer or Netscape
Navigator has to be used. It is very difficult to conceive how much information is available
on the web. Any information can be obtained from the web, say for example, about travel
agent, financial investment groups, restaurant guides, mail-order shopping sites,……… etc.
Online versions of newspapers and magazines are also available. How to search and find
such information?
By using Web search engines information of interest can be obtained. Search engines
are nothing but tools to search and find information from the web. These search engines are
software called “Spiders” to crawl around the Web for searching information.

CREC, Dept of MBA Page 49
Examples of some popular search engines are
Alta vista
Info seek
Yahoo
b) Communication
The World Wide Web is getting all the headlines, but for many people the main
attraction of Internet is the Electronic Main or E-Mail – the fastest way of sending messages
from one user to another. It hardly takes few fractions of a second to transfer a message.
There are several websites offering this service. For example,
yahoo.com
hotmail.com
rediffmail.com
freemail.com
c) Marketing and Business on the Web
Many people are now putting their business online. To do this, one needs to develop
a website with online order forms. This concept is developing very fast day by day. Of
course, it costs money to make more money.
INTRANETS :
An intranet is a private, internal, corporate network that provides users with access to data
and collaboration tools across the organization. An extranet is a private network that extends
to users outside of the organization. It allows users limited access to the company's intranet.
Intranet is a computer network system in which a specific organizational systems share
information, computing services and operational systems with each other by using an Internet
(IP) technology. This term basically refers to the network of a specific organization. You can
also says it a private network. Authenticated users of the organization can access the database
system, search engines, directory and can distribute documents and workflow. Employees can
makes interactive communication in shape of chatting, audio and videoconferencing,
groupware and teleconferencing. The benefits of Intranet is that low development and
maintenance cost arises on this setup. It is also a means of friendly environment and speedily
sharing of secret information on time. It is also the type of internet that is restricted to the
internal environment of an organisation only. The internal IT system of an organisation is the
best example of the intranet.
EXTRANETS :
The term Extranet is linked with Intranet. Extranet is a kind of computer network that allows
the outside users to access the Intranet of organization. This network system is basically used
for business to business (B2B) purposes. This system basically allows the outside users of an
organization, like partners, suppliers, vendors and other stakeholders to remain in touch with
CREC, Dept of MBA Page 50
the activities of organization. Information and data access performed through a proper
account or link system. This is a best network system to keep in touch with market position
and share a large amount of data to partners in a timely manner. Moreover, conducting new
training programs and discussing the products catalogs with partners can be easily done
without bearing too much cost of travelling. Extranet is the next stage in the intranet. It has
also very restricted users but as compared to intranet it has a more opened environment.
When the usage of the internet remains restricted to the internal environment of an
organisation only it is called as intranet but when the customers and other outsiders like the
stakeholders of an organisation also join this system then this system becomes the extranet.
WORLD WIDE WEB :
The faster growing part of the Internet is the World Wide Web (WWW). The World Wide
Web or simply the Web consists of an interconnected system of sites called Websites. To
access a website, web browser software like Microsoft’s Internet Explorer or Netscape
Navigator has to be used. It is very difficult to conceive how much information is available
on the web. Any information can be obtained from the web, say for example, about travel
agent, financial investment groups, restaurant guides, mail-order shopping sites,……… etc.
Online versions of newspapers and magazines are also available. How to search and find
such information?
By using Web search engines information of interest can be obtained. Search engines
are nothing but tools to search and find information from the web. These search engines are
software called “Spiders” to crawl around the Web for searching information.
Examples of some popular search engines are
Alta vista
Info seek
Yahoo

CREC, Dept of MBA Page 51
UNIT - V
CREC, Dept of MBA Page 52
FUNCTIONAL AND ENTERPRISE SYSTEMS :
Enterprise resource planning (ERP) is business management software typically a suite of
integrated applications that a company can use to collect, store, manage and interpret data
from many business activities, including:
Product planning, cost
Manufacturing or service delivery
Marketing and sales
Inventory management
Shipping and payment
ERP provides an integrated view of core business processes, often in real-time, using
common databases maintained by a database management system.
ERP systems track business resources cash, raw materials, production capacity and the status
of business commitments: orders, purchase orders, and payroll.
The applications that make up the system share data across the various departments
(manufacturing, purchasing, sales, accounting, etc.) that provide the data.
ERP facilitates information flow between all business functions, and manages connections to
outside stakeholders.
Enterprise system software is a multi-billion dollar industry that produces components that
support a variety of business functions.
IT investments have become the largest category of capital expenditure in United States-
based businesses over the past decade. Though early ERP systems focused on large
enterprises, smaller enterprises increasingly use ERP systems
Because of 2000 Euro disrupted legacy systems, many company’s took the opportunity to replace
their old systems with ERP.
The ERP system is considered a vital organizational to because it integrates varied organizational
systems and facilitates error-free transactions and production. However, ERP system development
is different from traditional system development.
ERP systems run on a variety of computer hardware and network configurations, typically using
a database as an information repository.
DATA, INFORMATION AND KNOWLEDGE CONCEPTS :
Data are recorded (captured and stored) symbols and signal readings.
Symbols include words (text and/or verbal), numbers, diagrams, and images (still
&/or video), which are the building blocks of communication.
Signals include sensor and/or sensory readings of light, sound, smell, taste, and touch.
As symbols, ‘Data’ is the storage of intrinsic meaning, a mere representation. The main
purpose of data is to record activities or situations, to attempt to capture the true picture or
real event. Therefore, all data are historical, unless used for illustration purposes, such as
forecasting.

CREC, Dept of MBA Page 53
Information is a message that contains relevant meaning, implication, or input for decision
and/or action. Information comes from both current (communication) and historical
(processed data or ‘reconstructed picture’) sources. In essence, the purpose of information is
to aid in making decisions and/or solving problems or realizing an opportunity.
Knowledge is the (1) cognition or recognition (know-what), (2) capacity to act (know-how),
and (3) understanding (know-why) that resides or is contained within the mind or in the brain.
The purpose of knowledge is to better our lives. In the context of business, the purpose of
knowledge is to create or increase value for the enterprise and all its stakeholders. In short,
the ultimate purpose of knowledge is for value creation.
DECISION MAKING PROCESS :
The thought process of selecting a logical choice from the available options.
When trying to make a good decision, a person must weight the positives and negatives of
each option, and consider all the alternatives. For effective decision making, a person must
be able to forecast the outcome of each option as well, and based on all these items,
determine which option is the best for that particular situation.
CREC, Dept of MBA Page 54
Step 1: Identification of the purpose of the decision
In this step, the problem is thoroughly analysed. There are a couple of questions one should
ask when it comes to identifying the purpose of the decision.
What exactly is the problem?
Why the problem should be solved?
Who are the affected parties of the problem?
Does the problem have a deadline or a specific time-line?
Step 2: Information gathering
A problem of an organization will have many stakeholders. In addition, there can be dozens
of factors involved and affected by the problem.
In the process of solving the problem, you will have to gather as much as information related
to the factors and stakeholders involved in the problem. For the process of information
gathering, tools such as 'Check Sheets' can be effectively used.
Step 3: Principles for judging the alternatives
In this step, the baseline criteria for judging the alternatives should be set up. When it comes
to defining the criteria, organizational goals as well as the corporate culture should be taken
into consideration.
As an example, profit is one of the main concerns in every decision making process.
Companies usually do not make decisions that reduce profits, unless it is an exceptional
case. Likewise, baseline principles should be identified related to the problem in hand.
Step 4: Brainstorm and analyse the different choices
For this step, brainstorming to list down all the ideas is the best option. Before the idea
generation step, it is vital to understand the causes of the problem and prioritization of
causes.
For this, you can make use of Cause-and-Effect diagrams and Pareto Chart tool. Cause-and-
Effect diagram helps you to identify all possible causes of the problem and Pareto chart
helps you to prioritize and identify the causes with highest effect.
Then, you can move on generating all possible solutions (alternatives) for the problem in
hand.
Step 5: Evaluation of alternatives
Use your judgement principles and decision-making criteria to evaluate each alternative. In
this step, experience and effectiveness of the judgement principles come into play. You need
to compare each alternative for their positives and negatives.
Step 6: Select the best alternative
Once you go through from Step 1 to Step 5, this step is easy. In addition, the selection of the
best alternative is an informed decision since you have already followed a methodology to
derive and select the best alternative.

CREC, Dept of MBA Page 55
Step 7: Execute the decision
Convert your decision into a plan or a sequence of activities. Execute your plan by yourself
or with the help of subordinates.
Step 8: Evaluate the results
Evaluate the outcome of your decision. See whether there is anything you should learn and
then correct in future decision making. This is one of the best practices that will improve
your decision-making skills.
Conclusion :
When it comes to making decisions, one should always weigh the positive and negative
business consequences and should favour the positive outcomes.
This avoids the possible losses to the organization and keeps the company running with a
sustained growth. Sometimes, avoiding decision making seems easier; especially, when you
get into a lot of confrontation after making the tough decision.
But, making the decisions and accepting its consequences is the only way to stay in control
of your corporate life and time.
PHYSICAL COMPONENTS OF INFORMATION SYSTEMS :
The 5 components that must come together in order to produce a Computer-Based
Information system are:
1.Hardware: The term hardware refers to machinery.This category includes the computer
itself, which is often referred to as the central processing unit (CPU), and all of its support
equipments. Among the support equipments are input and output devices, storage devices and
communications devices.
2.Software: The term software refers to computer programs and the manuals (if any) that
support them. Computer programs are machine-readable instructions that direct the circuitry
within the hardware parts of the CBIS to function in ways that produce useful information
from data. Programs are generally stored on some input / output medium,often a disk or tape.
3.Data: Data are facts that are used by programs to produce useful information.Like
programs,data are generally stored in machine-readable form on disk or tape until the
computer needs them.
4.Procedures: Procedures are the policies that govern the operation of a computer system.
"Procedures are to people what software is to hardware" is a common analogy that is used to
illustrate the role of procedures in a CBIS.
5.People: Every CBIS needs people if it is to be useful. Often the most over-looked element
of the CBIS are the people, probably the component that most influence the success or failure
of information systems.
OVERVIEW OF SECURITY ISSUES IN INFORMATION TECHNOLOGY :
Objectives of IT Security ♦ The Confidentiality of Electronic Data ♦ The Integrity of
Electronic Data ♦ The Availability of Electronic Data C.I.A.
Basic Security Triad As more and more information becomes available electronically, IT
security will become more and more important.

CREC, Dept of MBA Page 56
4. 1. Confidentiality ♦ For Secret or Private Information ♦ Confidentiality is the concept that
information is unavailable to those who are unauthorized to access it. ♦ The concept of
allowing access to information or resources only to those who need it is called access control.
5. Confidentiality continued ♦ The privacy of customer and employee information is
becoming more and more important, if not the business to the customer or employee. ♦
Legislation does mandate due diligence. ♦ We should ensure that only the proper people have
access to the information needed to perform their job or that they have been authorized to
access it ♦ Is often the last concern because it can impede business productivity.
6. 2. Integrity ♦ For Accuracy and Authenticity ♦ Integrity ensures that information cannot be
modified in unexpected ways. ♦ Loss of integrity could result from human error, intentional
tampering, or even catastrophic events. ♦ The consequences of using inaccurate information
be disastrous or even dangerous.
7. Integrity continued ♦ For information to have any value and in order to produce quality
product, the data must by protected against unauthorized or inadvertent modification. ♦ If the
authenticity of the information is in doubt or compromised, the integrity is jeopardized.
8. 3. Availability ♦ For Utility and Recovery ♦ Availability prevents resources from being
deleted or becoming inaccessible. ♦ This applies not only to information, but also to network
machines and other aspects of the technology infrastructure ♦ The inability to access required
resources is called “denial of service” or D.O.S.
9. Availability continued ♦ Information must be available and usable when needed. ♦ What is
the cost of unavailability (Downtime)? ♦ What good is information if you can’t get it? ♦
Redundancy, regular backups and limiting physical access helps to increase availability
10. Business Model ♦ Each business model requires emphasis on different security
objectives. ♦ A national defense system will place the greatest emphasis on confidentiality. ♦
A bank has a greater need for integrity. ♦ An emergency medical system will emphasize
availability.
11. Part 2: Areas of Security Here are the five general Areas in Information Systems or
Information Technologies security
12. 1. Users ♦ Users need to be aware of security issues ♦ Users must be trained insecurity
procedures ♦ Users need to follow guidelines (like not writing down passwords)
13. 2. Application ♦ The application has its own independent access control beyond the
network access control. ♦ An example would be module control in a financial application.
14. 3. OS Operating System ♦ Every computer has an operating system that controls access to
that computers resources. ♦ Example would be sharing a folder or printer. ♦ The OS also
controls file system security (Like NTFS)
15. 4. NOS Network Operating System ♦ The NOS controls access to network resources and
authenticates users ♦ Internet access, server access, remote access and access to other
networks are examples of controls implemented by the NOS ♦ Examples of NOS: Windows
NT 4, Windows 2000, Novell Netware, Lantastic & UNIX
16. 5. Physical ♦ Physical Control of any electronic device ♦ A server room controls physical
access to servers ♦ Watching your laptop ♦ Keeping zip disk secure

CREC, Dept of MBA Page 57
17. Who Controls the Access Control ♦ Who assigns permissions? ♦ Typically it is the IT
department that assigns access controls for all 5 levels. ♦ This can cause problems because it
only takes one person to grant access to all electronic information. ♦ How can we fix that?
18. Distributed Access Control ♦ Distributed Access Control is having different departments
or people assigning permission by level. Finance Director Network Administrator
19. Distributed Access Control 2 ♦ By having the Finance Director assign permissions to the
financial software and the Network Administrator assign permissions to the network or server
you have distributed the Access Control ♦ To give a User access to the financial software it
requires two separate people or departments to work together, in order to give that User
access.
20. Distributed Access Control Example ♦ The IS department or Network Administrator
opens the first door and gives access to the Network. ♦ Then the Finance Director opens the
next door the the financial application. ♦ This works if the Network Administrator does not
have keys to the next door.
21. Checks and Balances ♦ By having distributed access control effectively adds a layer of
checks and balances. ♦ The finance director cannot open the second door for a user if the first
door isn’t opened.
22. Limiting Control ♦ More importantly the Network administrator does not have unlimited,
unchecked control on assigning permissions.
EMERGING TRENDS IN INFORMATION TECHNOLOGY :
21st century has been defined by application of and advancement in information technology.
Information technology has become an integral part of our daily life. According to
Information Technology Association of America, information technology is defined as “the
study, design, development, application, implementation, support or management of
computer-based information systems.”
Information technology has served as a big change agent in different aspect of business and
society. It has proven game changer in resolving economic and social issues.
Advancement and application of information technology are ever changing. Some of the
trends in the information technology are as follows:
1. Cloud Computing :
One of the most talked about concept in information technology is the cloud
computing. Clouding computing is defined as utilization of computing services, i.e.
software as well as hardware as a service over a network. Typically, this network is
the internet.
Cloud computing offers 3 types of broad services mainly Infrastructure as a Service
(IaaS), Platform as a Service (PaaS) and Software as a Service (SaaS).
Some of the benefit of cloud computing is as follows:
Cloud computing reduces IT infrastructure cost of the company.
CREC, Dept of MBA Page 58
Cloud computing promotes the concept of virtualization, which enables server
and storage device to be utilized across organization.
Cloud computing makes maintenance of software and hardware easier as
installation is not required on each end user’s computer.
Some issues concerning cloud computing are privacy, compliance, security, legal,
abuse, IT governance, etc.
2. Mobile Application :
Another emerging trend within information technology is mobile applications
(software application on Smart phone, tablet, etc.)
Mobile application or mobile app has become a success since its introduction. They
are designed to run on Smartphone, tablets and other mobile devices. They are
available as a download from various mobile operating systems like Apple,
Blackberry, Nokia, etc. Some of the mobile app are available free where as some
involve download cost. The revenue collected is shared between app distributor and
app developer.
3. User Interfaces :
User interface has undergone a revolution since introduction of touch screen. The
touch screen capability has revolutionized way end users interact with application.
Touch screen enables the user to directly interact with what is displayed and also
removes any intermediate hand-held device like the mouse.
Touch screen capability is utilized in smart phones, tablet, information kiosks and
other information appliances.
4. Analytics :
The field of analytics has grown many folds in recent years. Analytics is a process
which helps in discovering the informational patterns with data. The field of analytics
is a combination of statistics, computer programming and operations research.
The field of analytics has shown growth in the field of data analytics, predictive
analytics and social analytics.
Data analytics is tool used to support decision-making process. It converts raw data
into meaningful information.
Predictive analytics is tool used to predict future events based on current and
historical information.
Social media analytics is tool used by companies to understand and accommodate
customer needs.
The every changing field of information technology has seen great advancement and changes
in the last decade. And from the emerging trend, it can be concluded that its influence on
business is ever growing, and it will help companies to serve customers better.