lecture topic 16: value and valuation – pulling it all together presentation to cox mba students...
TRANSCRIPT

Lecture Topic 16: Value and Valuation – Pulling it All Together
Presentation to Cox MBA Students
FINA 6214: International Financial Markets
Presentation to Cox Business Students
FINA 3320: Financial Management
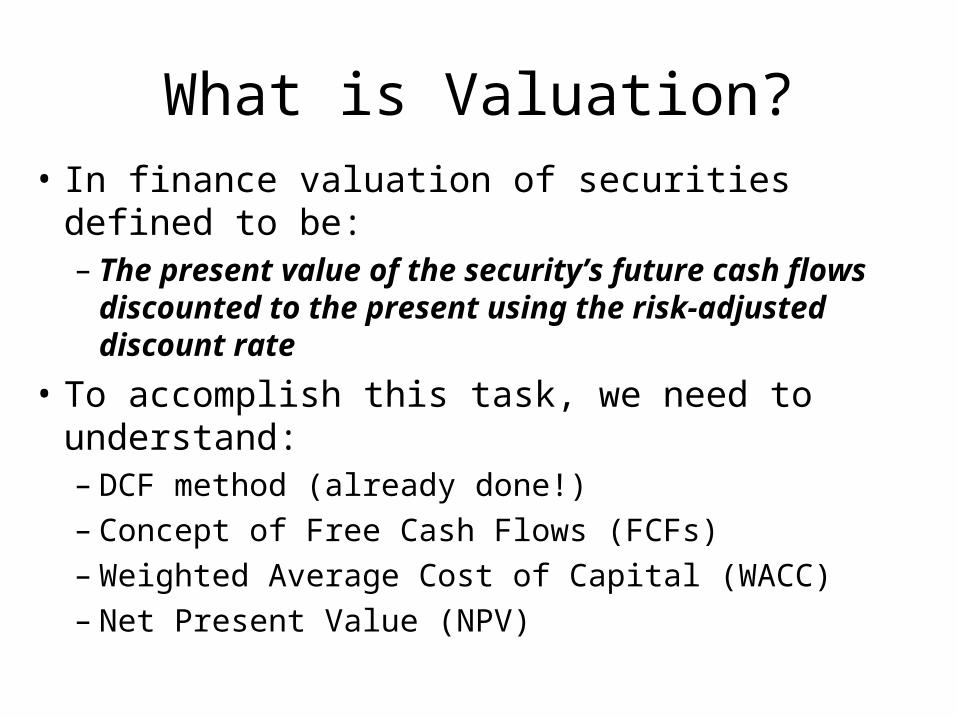
What is Valuation?
• In finance valuation of securities defined to be: – The present value of the security’s future cash flows
discounted to the present using the risk-adjusted discount rate
• To accomplish this task, we need to understand:– DCF method (already done!)– Concept of Free Cash Flows (FCFs)– Weighted Average Cost of Capital (WACC)– Net Present Value (NPV)
Question?
What is the Cost of Capital to a levered firm?
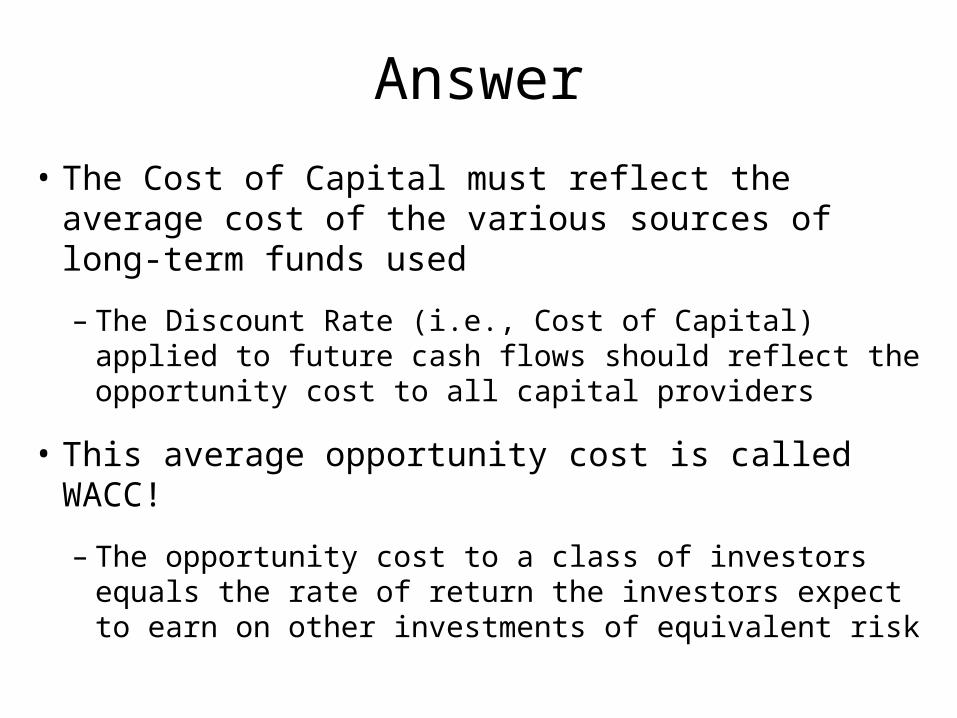
Answer
• The Cost of Capital must reflect the average cost of the various sources of long-term funds used
– The Discount Rate (i.e., Cost of Capital) applied to future cash flows should reflect the opportunity cost to all capital providers
• This average opportunity cost is called WACC!
– The opportunity cost to a class of investors equals the rate of return the investors expect to earn on other investments of equivalent risk
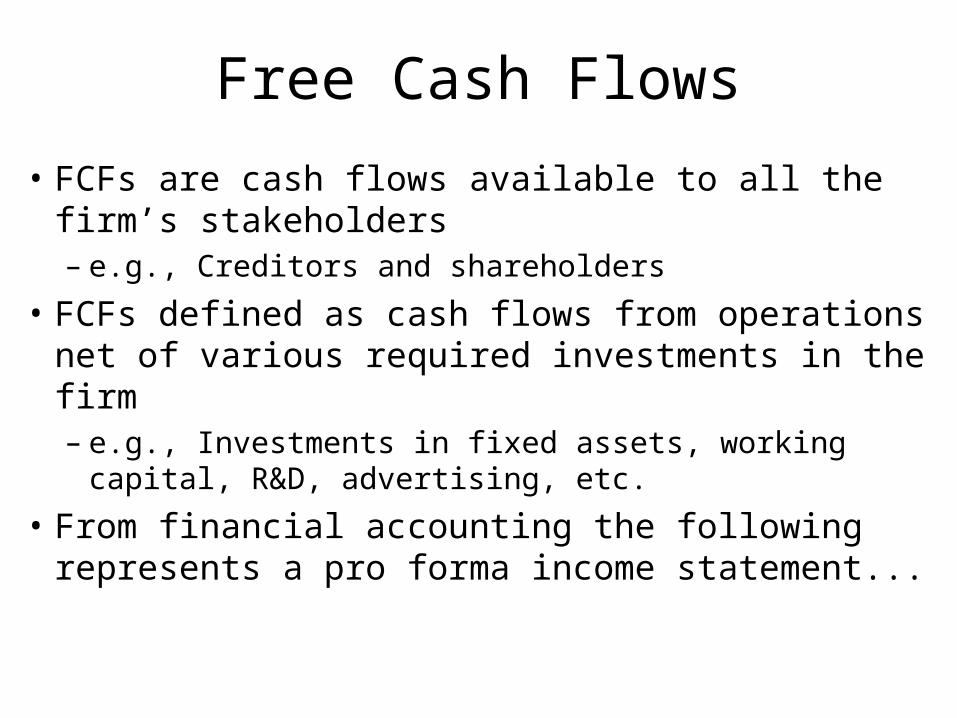
Free Cash Flows
• FCFs are cash flows available to all the firm’s stakeholders– e.g., Creditors and shareholders
• FCFs defined as cash flows from operations net of various required investments in the firm– e.g., Investments in fixed assets, working capital,
R&D, advertising, etc.
• From financial accounting the following represents a pro forma income statement...
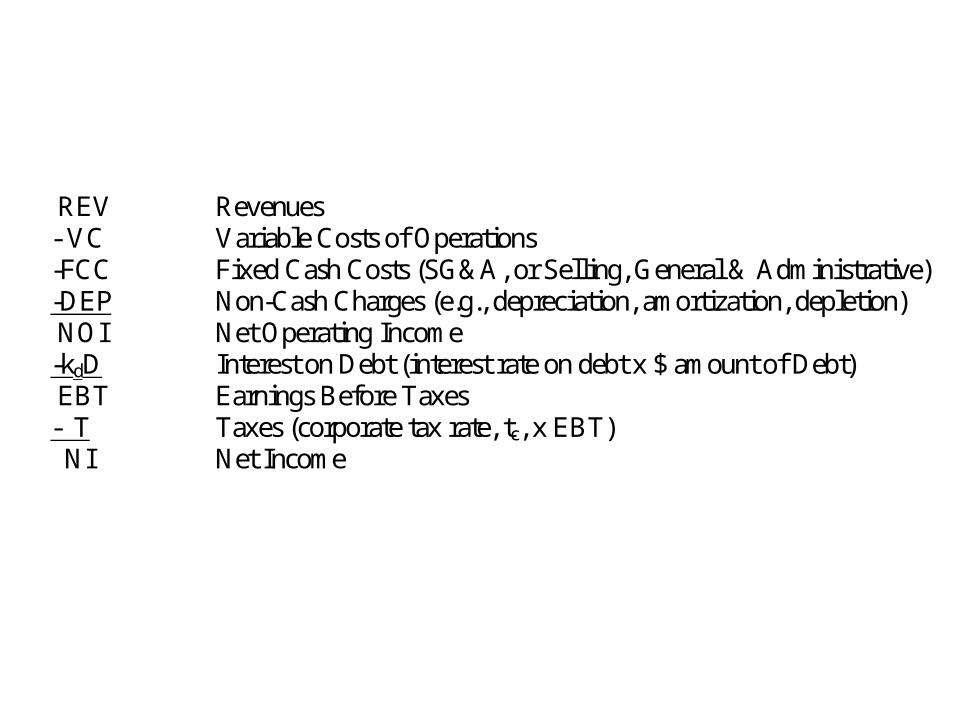
REV Revenues - VC Variable Costs of Operations -FCC Fixed Cash Costs (SG&A, or Selling, General & Administrative) -DEP Non-Cash Charges (e.g., depreciation, amortization, depletion) NOI Net Operating Income -kdD Interest on Debt (interest rate on debt x $ amount of Debt) EBT Earnings Before Taxes - T Taxes (corporate tax rate, tc, x EBT) NI Net Income
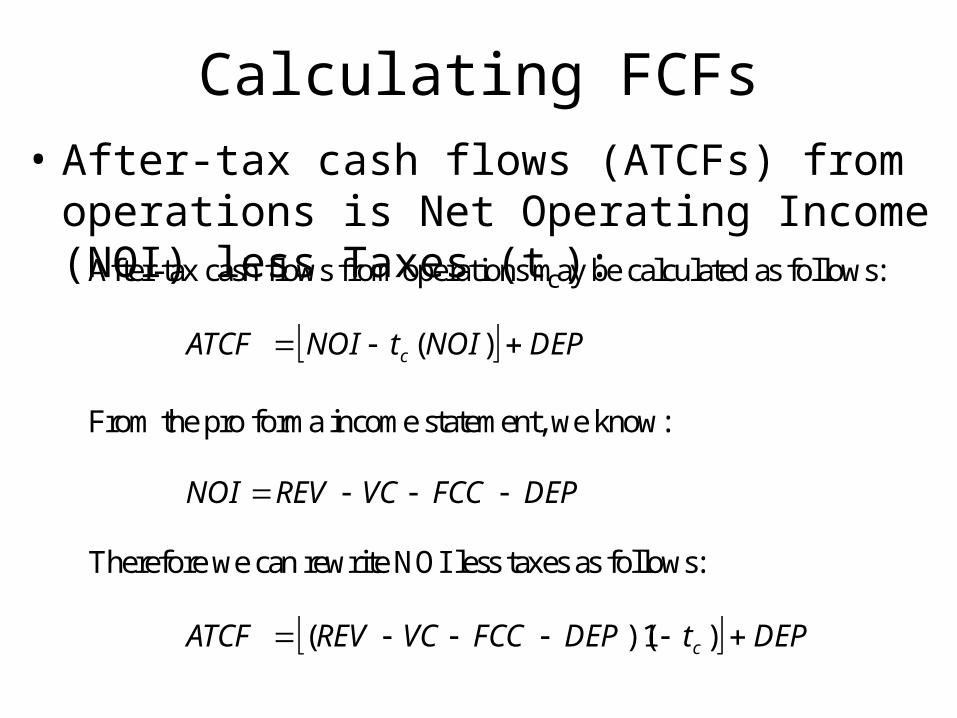
Calculating FCFs• After-tax cash flows (ATCFs) from operations is
Net Operating Income (NOI) less Taxes (tc):After-tax cash flows from operations may be calculated as follows: DEPNOItNOIATCF c )(
From the pro forma income statement, we know: DEPFCCVCREVNOI Therefore we can rewrite NOI less taxes as follows: DEPtDEPFCCVCREVATCF c )1)((
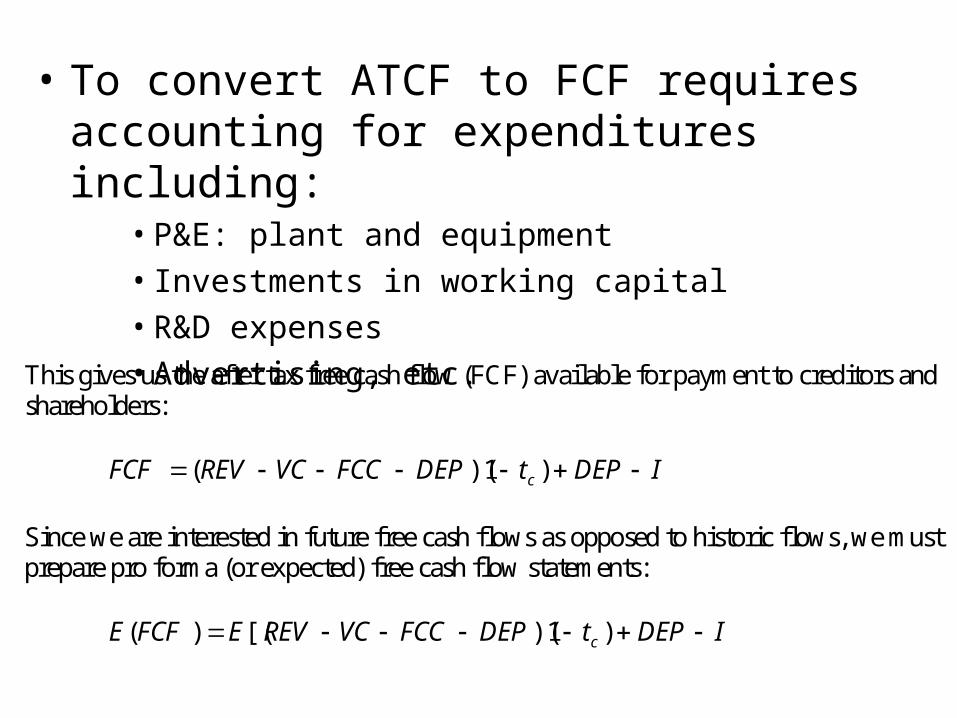
• To convert ATCF to FCF requires accounting for expenditures including:
• P&E: plant and equipment
• Investments in working capital
• R&D expenses
• Advertising, etc.
This gives us the after tax free cash flow (FCF) available for payment to creditors and shareholders: IDEPtDEPFCCVCREVFCF c )1)((
Since we are interested in future free cash flows as opposed to historic flows, we must prepare pro forma (or expected) free cash flow statements: IDEPtDEPFCCVCREVEFCFE c )1)([()(
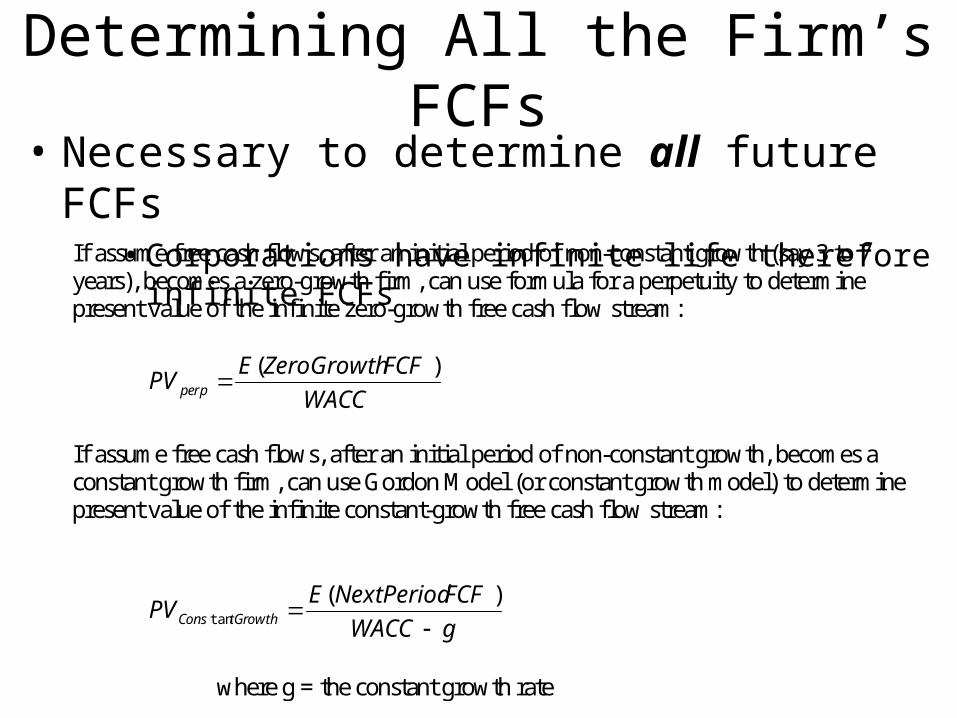
Determining All the Firm’s FCFs• Necessary to determine all future FCFs
• Corporations have infinite life therefore infinite FCFs
If assume free cash flows, after an initial period of non-constant growth (say 3 to 7 years), becomes a zero-growth firm, can use formula for a perpetuity to determine present value of the infinite zero-growth free cash flow stream:
WACC
FCFZeroGrowthEPVperp
)(
If assume free cash flows, after an initial period of non-constant growth, becomes a constant growth firm, can use Gordon Model (or constant growth model) to determine present value of the infinite constant-growth free cash flow stream:
gWACC
FCFNextPeriodEPV tGrowthCons
)(
tan
where g = the constant growth rate

Determining WACC• The 4-step process to determine appropriate
discount rate, or WACC, for discounting FCFs of the project (or the firm)
– (1) Determine firm’s optimal capital structure– (2) Determine firm’s capital requirements (i.e., I)– (3) Determine firm’s component costs of capital– (4) Determine firm’s WACC
• After calculating firm’s WACC (appropriate cost of capital for firm’s average risky project), need to determine project’s WACC based on specific project risk compared to risk of firm’s average project
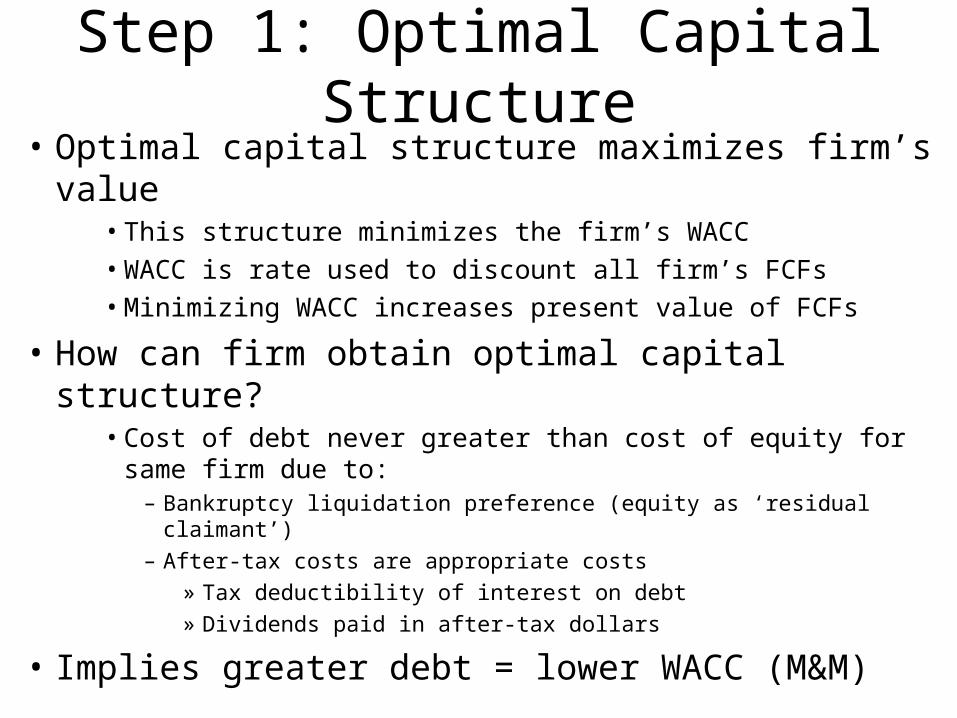
Step 1: Optimal Capital Structure• Optimal capital structure maximizes firm’s value
• This structure minimizes the firm’s WACC
• WACC is rate used to discount all firm’s FCFs
• Minimizing WACC increases present value of FCFs
• How can firm obtain optimal capital structure?• Cost of debt never greater than cost of equity for same firm
due to:– Bankruptcy liquidation preference (equity as ‘residual claimant’)
– After-tax costs are appropriate costs
» Tax deductibility of interest on debt
» Dividends paid in after-tax dollars
• Implies greater debt = lower WACC (M&M)
% $ RE Value WACC RD
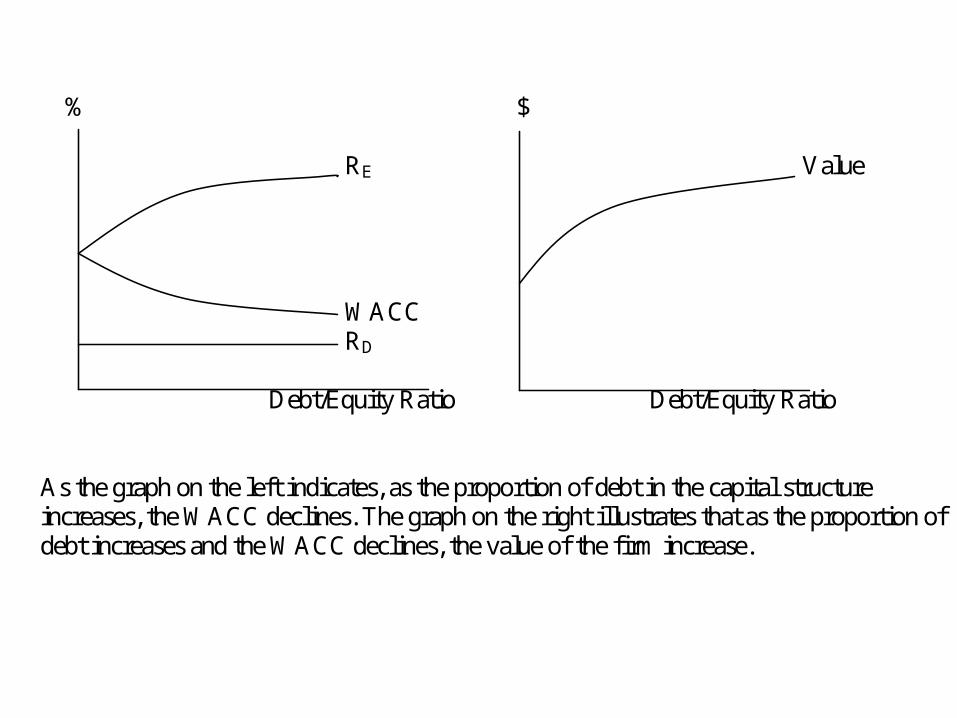
Debt/Equity Ratio Debt/Equity Ratio As the graph on the left indicates, as the proportion of debt in the capital structure increases, the WACC declines. The graph on the right illustrates that as the proportion of debt increases and the WACC declines, the value of the firm increase.
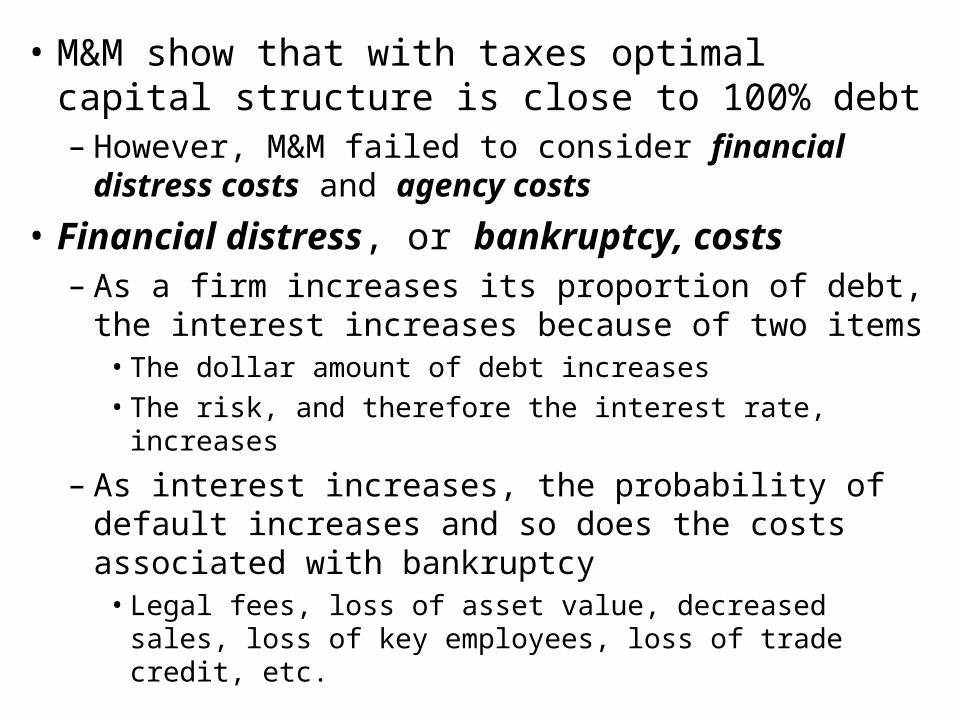
• M&M show that with taxes optimal capital structure is close to 100% debt– However, M&M failed to consider financial distress
costs and agency costs
• Financial distress, or bankruptcy, costs– As a firm increases its proportion of debt, the interest
increases because of two items• The dollar amount of debt increases
• The risk, and therefore the interest rate, increases
– As interest increases, the probability of default increases and so does the costs associated with bankruptcy
• Legal fees, loss of asset value, decreased sales, loss of key employees, loss of trade credit, etc.
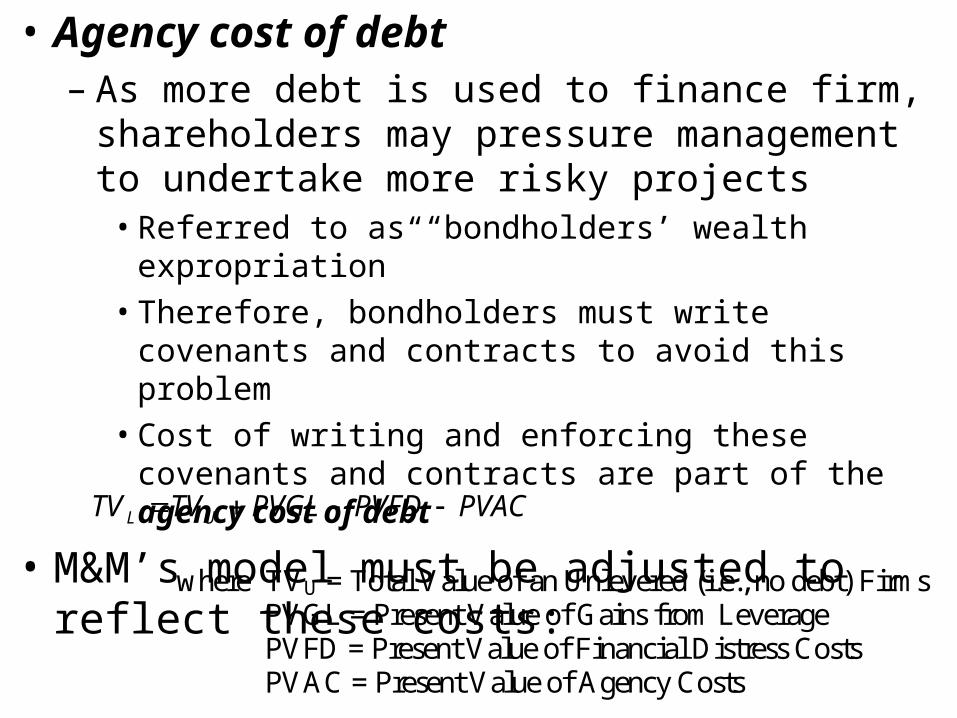
• Agency cost of debt– As more debt is used to finance firm, shareholders may
pressure management to undertake more risky projects • Referred to as “bondholders’ wealth expropriation”
• Therefore, bondholders must write covenants and contracts to avoid this problem
• Cost of writing and enforcing these covenants and contracts are part of the agency cost of debt
• M&M’s model must be adjusted to reflect these costs:
PVACPVFDPVGLTVTV UL
where TVU = Total Value of an Unlevered (i.e., no debt) Firms PVGL = Present Value of Gains from Leverage PVFD = Present Value of Financial Distress Costs PVAC = Present Value of Agency Costs
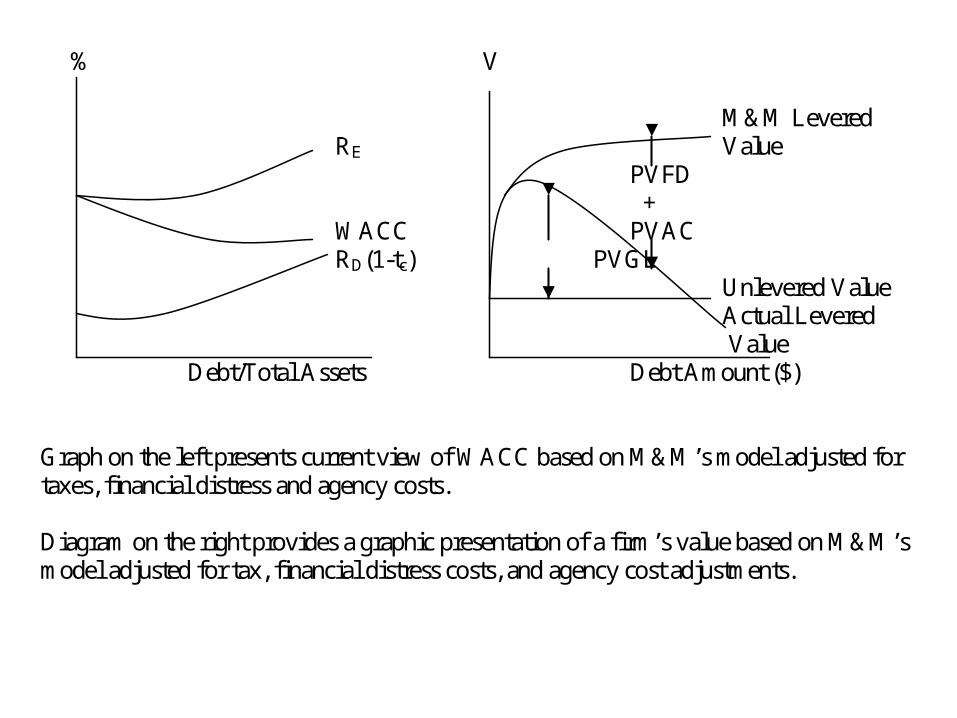
% V M&M Levered RE Value PVFD + WACC PVAC RD(1-tc) PVGL Unlevered Value Actual Levered Value Debt/Total Assets Debt Amount ($) Graph on the left presents current view of WACC based on M&M’s model adjusted for taxes, financial distress and agency costs. Diagram on the right provides a graphic presentation of a firm’s value based on M&M’s model adjusted for tax, financial distress costs, and agency cost adjustments.
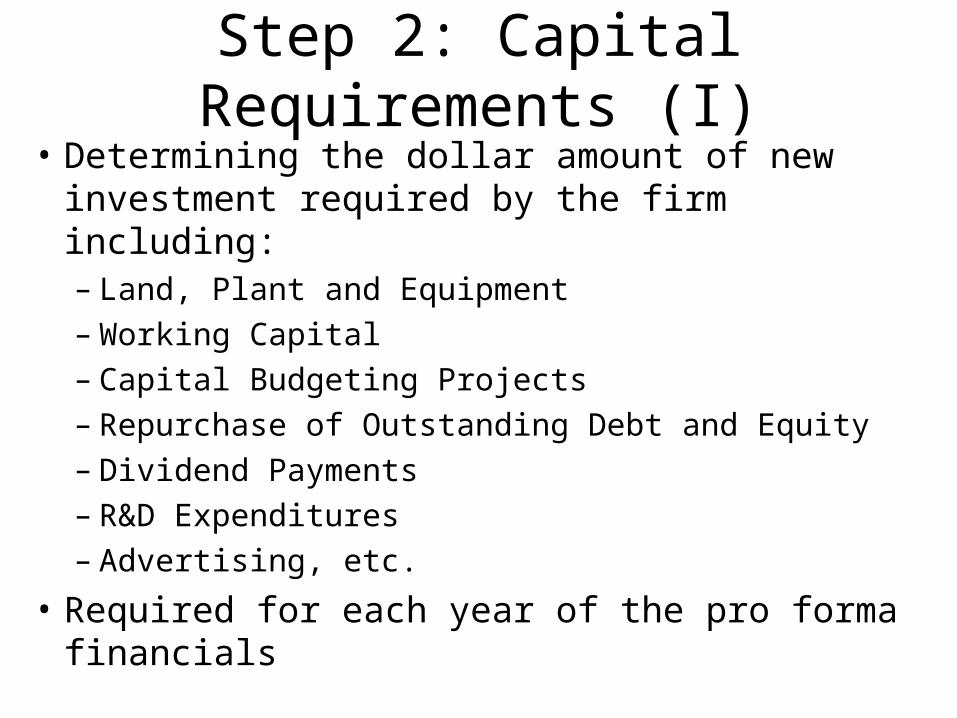
Step 2: Capital Requirements (I)• Determining the dollar amount of new investment
required by the firm including:– Land, Plant and Equipment
– Working Capital
– Capital Budgeting Projects
– Repurchase of Outstanding Debt and Equity
– Dividend Payments
– R&D Expenditures
– Advertising, etc.
• Required for each year of the pro forma financials
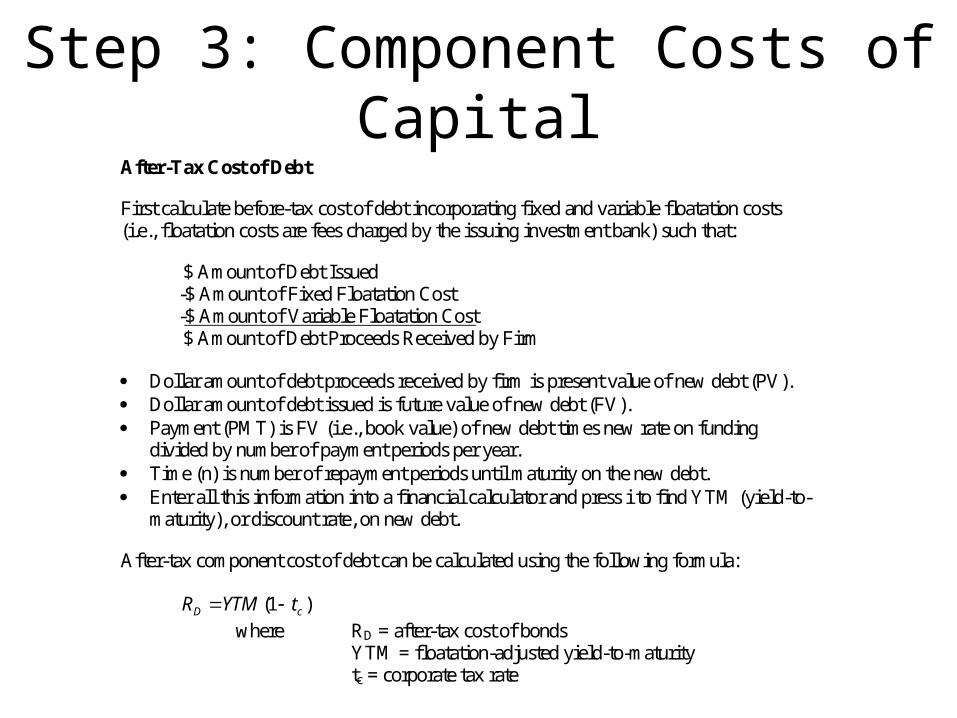
Step 3: Component Costs of CapitalAfter-Tax Cost of Debt
First calculate before-tax cost of debt incorporating fixed and variable floatation costs (i.e., floatation costs are fees charged by the issuing investment bank) such that:
$ Amount of Debt Issued -$ Amount of Fixed Floatation Cost -$ Amount of Variable Floatation Cost $ Amount of Debt Proceeds Received by Firm
Dollar amount of debt proceeds received by firm is present value of new debt (PV). Dollar amount of debt issued is future value of new debt (FV). Payment (PMT) is FV (i.e., book value) of new debt times new rate on funding
divided by number of payment periods per year. Time (n) is number of repayment periods until maturity on the new debt. Enter all this information into a financial calculator and press i to find YTM (yield-to-
maturity), or discount rate, on new debt.
After-tax component cost of debt can be calculated using the following formula:
)1( cD tYTMR
where RD = after-tax cost of bonds YTM = floatation-adjusted yield-to-maturity tc = corporate tax rate
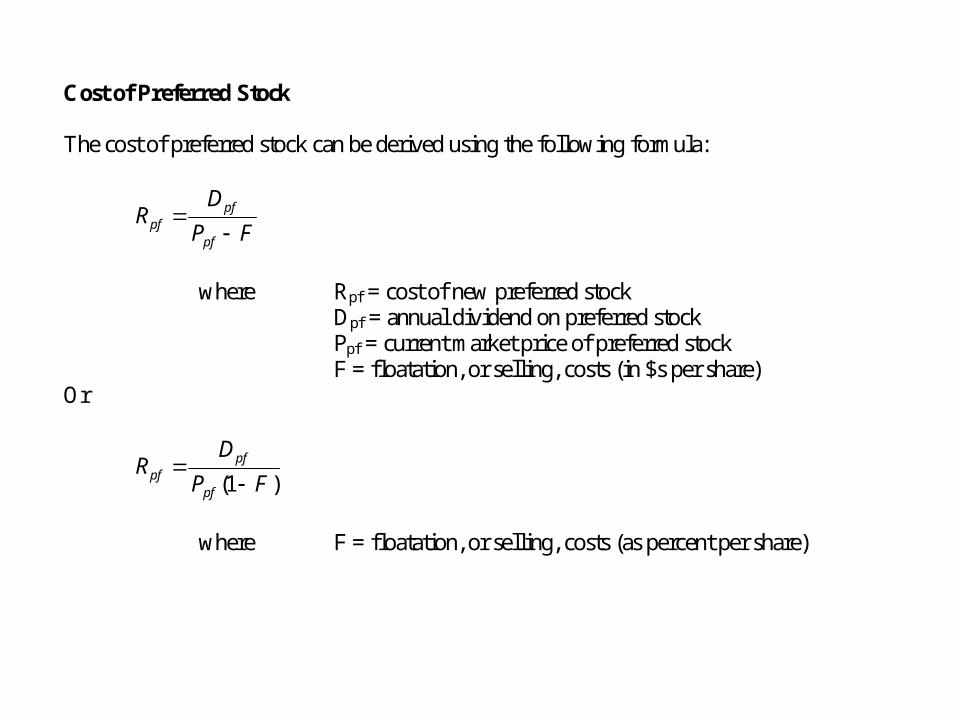
Cost of Preferred Stock The cost of preferred stock can be derived using the following formula:
FP
DR
pf
pfpf
where Rpf = cost of new preferred stock Dpf = annual dividend on preferred stock Ppf = current market price of preferred stock F = floatation, or selling, costs (in $s per share) Or
)1( FP
DR
pf
pfpf
where F = floatation, or selling, costs (as percent per share)
Cost of Common Equity There are two sources of suppliers of common equity funds: Retained Earnings: the internal source – i.e., existing shareholders And Issuance of New Common Equity: the external source – i.e., new shares Each of these two common equity sources needs to be looked at individually.
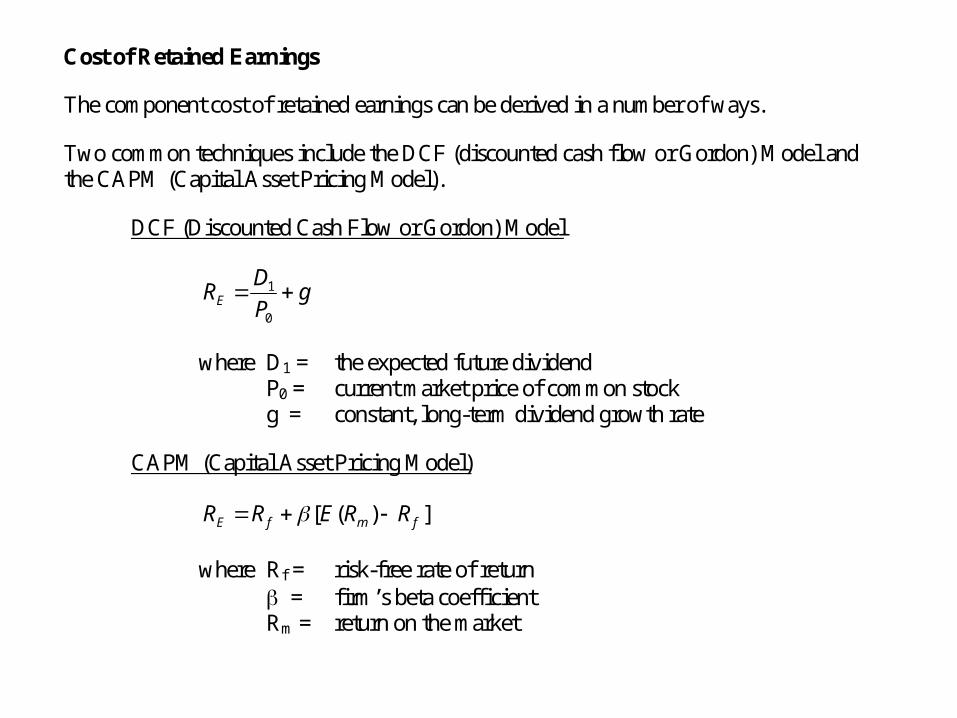
Cost of Retained Earnings
The component cost of retained earnings can be derived in a number of ways.
Two common techniques include the DCF (discounted cash flow or Gordon) Model and the CAPM (Capital Asset Pricing Model).
DCF (Discounted Cash Flow or Gordon) Model
gP
DRE
0
1
where D1 = the expected future dividend P0 = current market price of common stock g = constant, long-term dividend growth rate
CAPM (Capital Asset Pricing Model)
])([ fmfE RRERR
where Rf = risk-free rate of return = firm’s beta coefficient Rm = return on the market
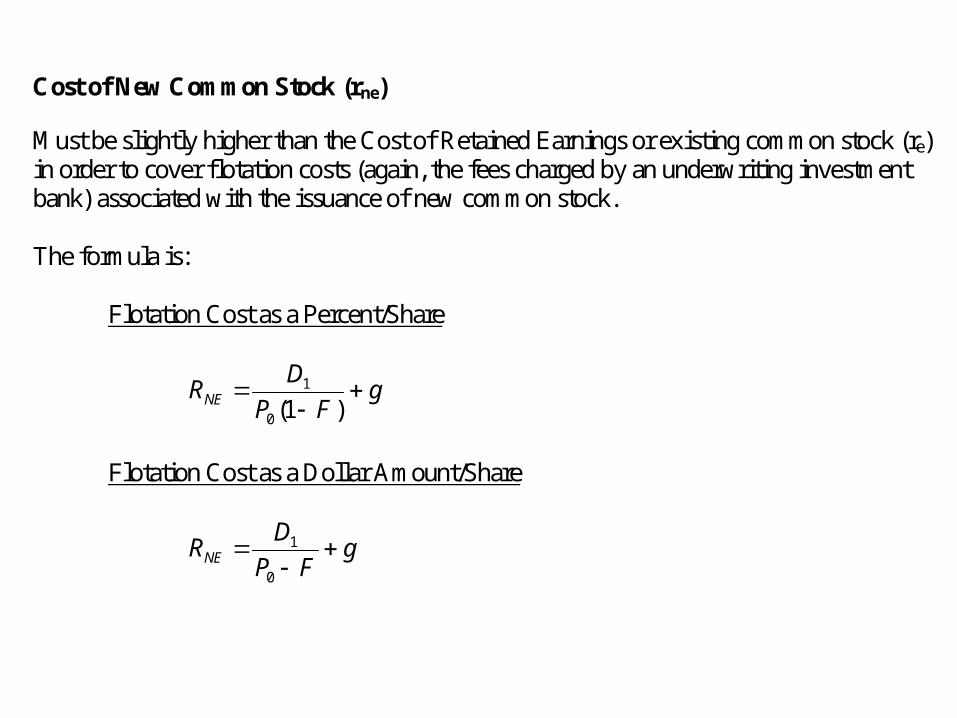
Cost of New Common Stock (rne)
Must be slightly higher than the Cost of Retained Earnings or existing common stock (re) in order to cover flotation costs (again, the fees charged by an underwriting investment bank) associated with the issuance of new common stock. The formula is: Flotation Cost as a Percent/Share
gFP
DRNE
)1(0
1
Flotation Cost as a Dollar Amount/Share
gFP
DRNE
0
1
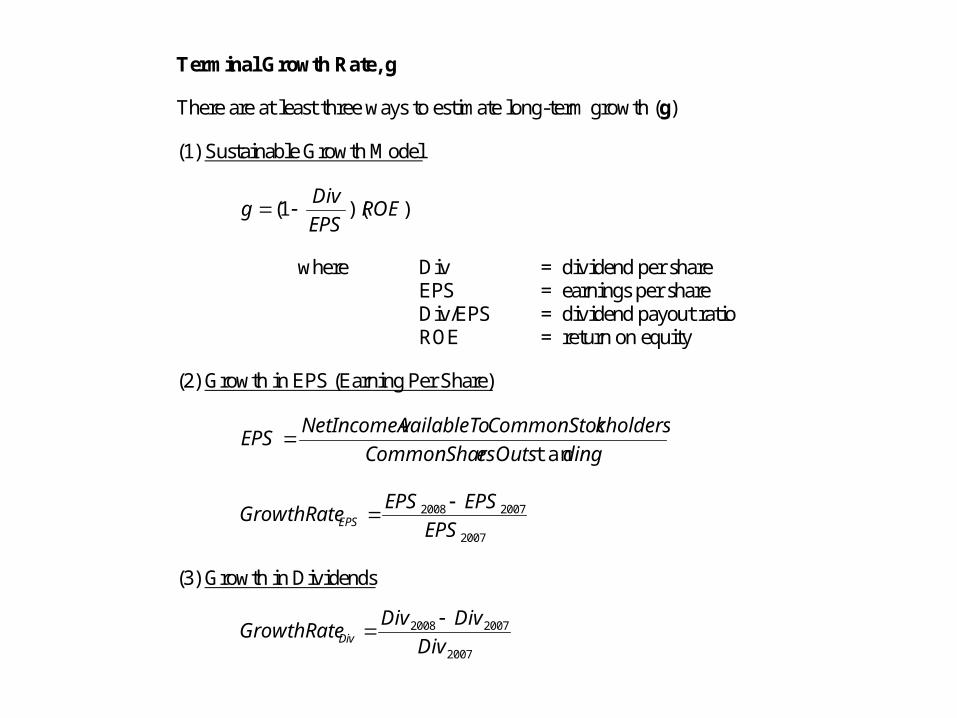
Terminal Growth Rate, g
There are at least three ways to estimate long-term growth (g)
(1) Sustainable Growth Model
))(1( ROEEPS
Divg
where Div = dividend per share EPS = earnings per share Div/EPS = dividend payout ratio ROE = return on equity
(2) Growth in EPS (Earning Per Share)
dingesOutsCommonShar
kholdersCommonStocvailableToNetIncomeAEPS
tan
2007
20072008
EPS
EPSEPSGrowthRateEPS
(3) Growth in Dividends
2007
20072008
Div
DivDivGrowthRateDiv
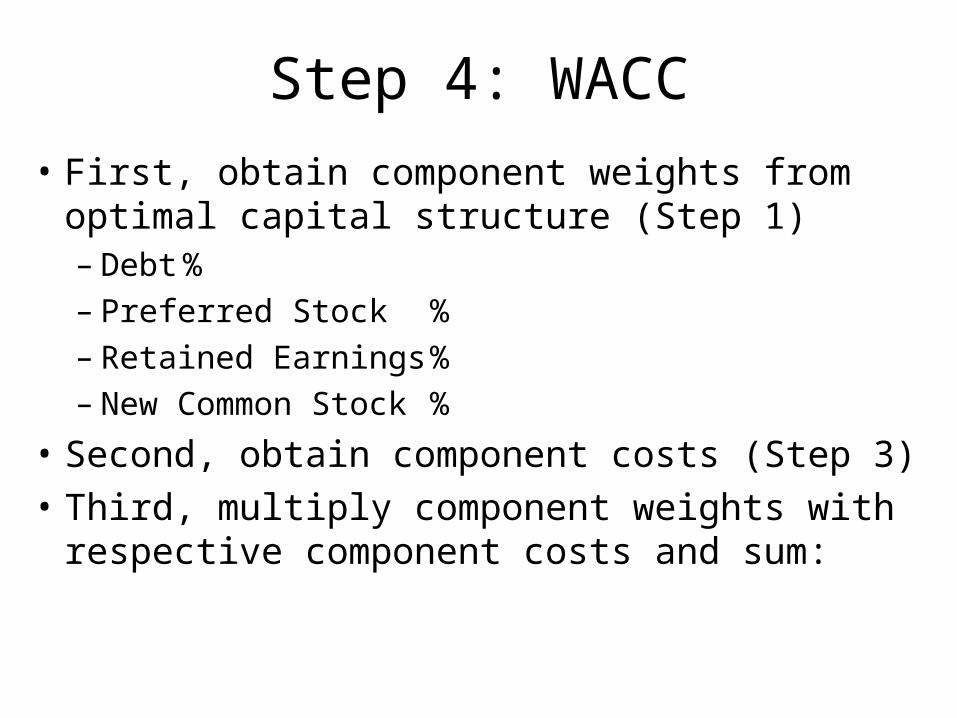
Step 4: WACC
• First, obtain component weights from optimal capital structure (Step 1)– Debt %– Preferred Stock %– Retained Earnings %– New Common Stock %
• Second, obtain component costs (Step 3)
• Third, multiply component weights with respective component costs and sum:
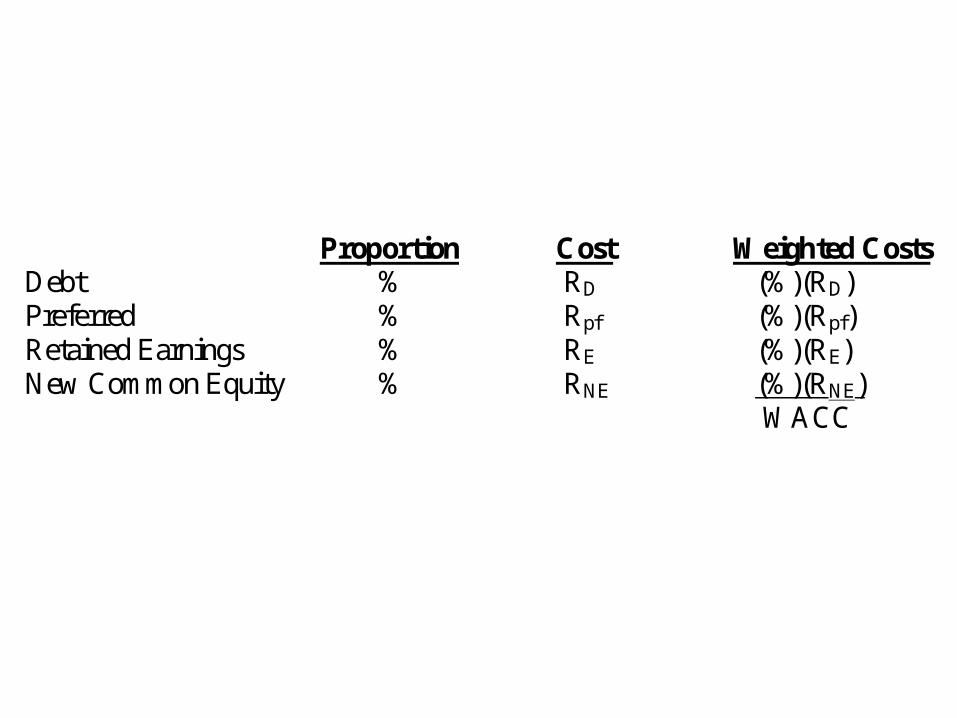
Proportion Cost Weighted Costs Debt % RD (%)(RD) Preferred % Rpf (%)(Rpf) Retained Earnings % RE (%)(RE) New Common Equity % RNE (%)(RNE) WACC

Determine Project’s WACC• Firm’s cost of capital defined as expected return on
portfolio of all company’s projects– Used to discount FCFs on projects of average risk– Not the proper discount rate to use if project not
average risky
• Each project should be evaluated at its own opportunity cost of capital– True cost of capital dependent on project risk
• Why estimate firm’s cost of capital?– Majority of projects can be treated as average risky– Firm’s cost of capital good starting point

Determine Firm’s Valuation
• We have…– (1) Determined firm’s (or project’s) FCFs– (2) Calculated firm’s (or project’s) WACC
• Final step is to calculate the present value of the stream of the firm’s (project’s) FCFs using WACC as the discount rate– This present value is the firm’s (project’s) total
valuation
• Subtracting market value of the firm’s debt provides price of firm’s equity
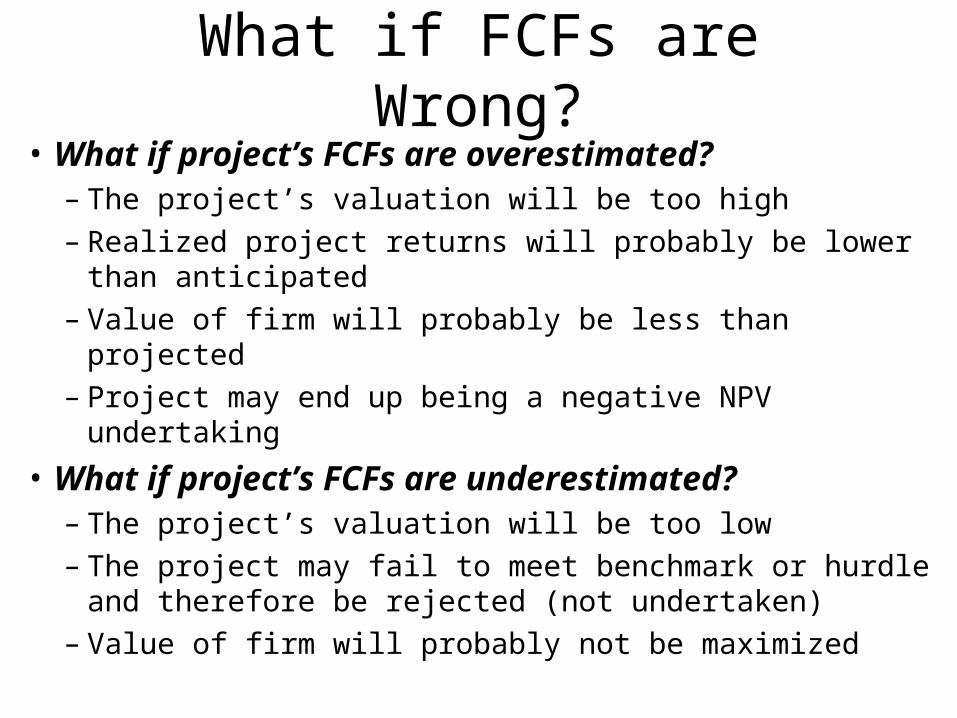
What if FCFs are Wrong?
• What if project’s FCFs are overestimated?– The project’s valuation will be too high– Realized project returns will probably be lower than
anticipated– Value of firm will probably be less than projected– Project may end up being a negative NPV undertaking
• What if project’s FCFs are underestimated?– The project’s valuation will be too low– The project may fail to meet benchmark or hurdle and
therefore be rejected (not undertaken)– Value of firm will probably not be maximized
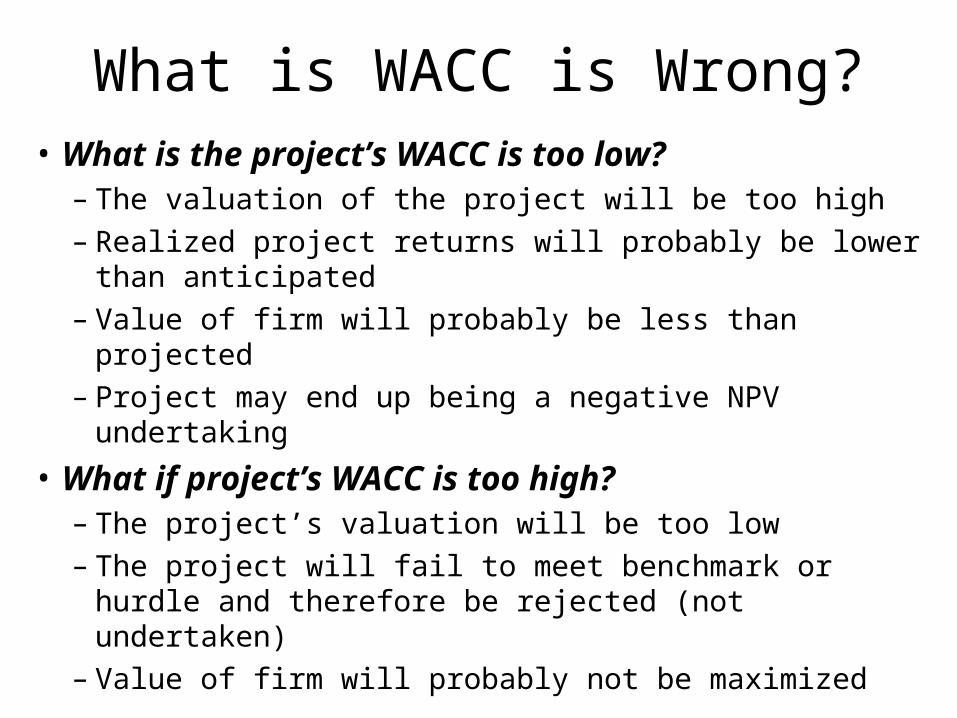
What is WACC is Wrong?
• What is the project’s WACC is too low?– The valuation of the project will be too high– Realized project returns will probably be lower than
anticipated– Value of firm will probably be less than projected– Project may end up being a negative NPV undertaking
• What if project’s WACC is too high?– The project’s valuation will be too low– The project will fail to meet benchmark or hurdle and
therefore be rejected (not undertaken)– Value of firm will probably not be maximized
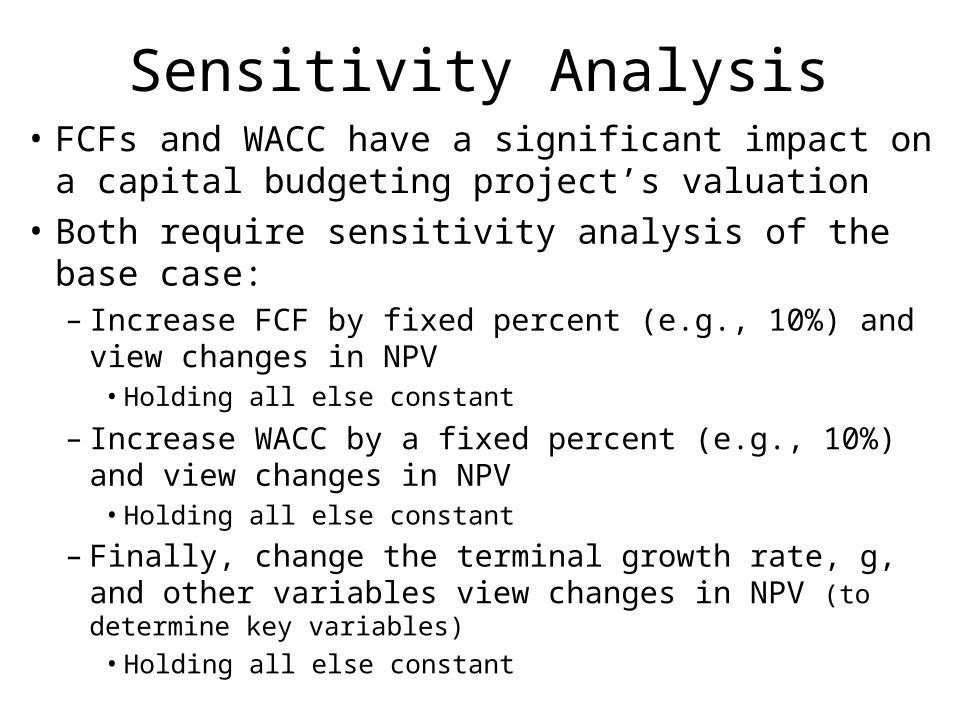
Sensitivity Analysis• FCFs and WACC have a significant impact on a
capital budgeting project’s valuation
• Both require sensitivity analysis of the base case:– Increase FCF by fixed percent (e.g., 10%) and view
changes in NPV• Holding all else constant
– Increase WACC by a fixed percent (e.g., 10%) and view changes in NPV
• Holding all else constant
– Finally, change the terminal growth rate, g, and other variables view changes in NPV (to determine key variables)
• Holding all else constant
Question?
What is the difference between a company’s cost of capital versus a
project’s cost of capital?
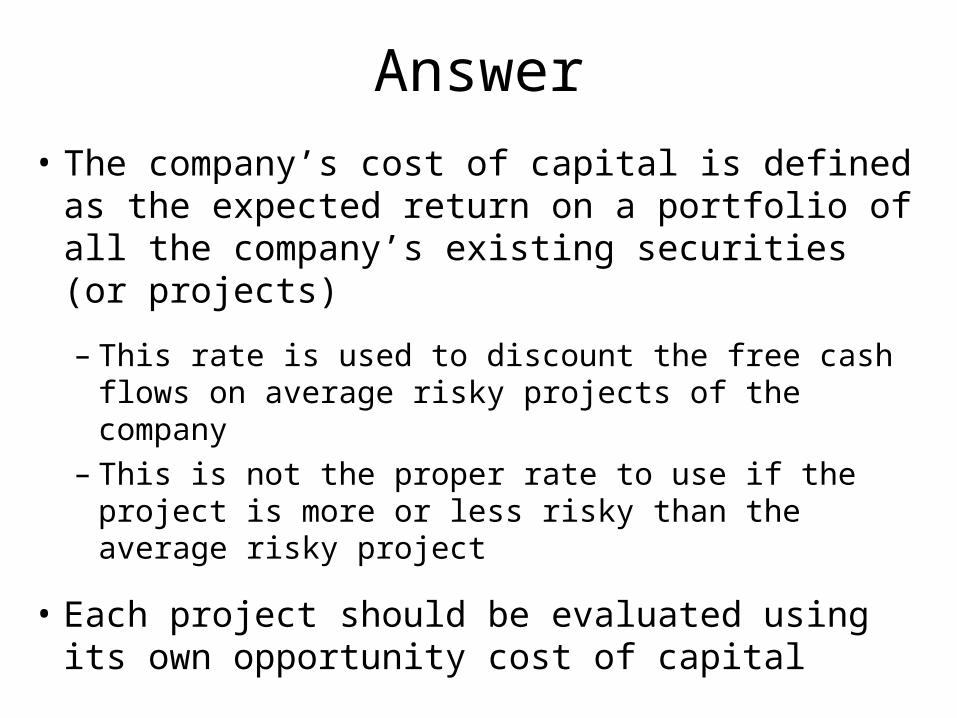
Answer
• The company’s cost of capital is defined as the expected return on a portfolio of all the company’s existing securities (or projects)
– This rate is used to discount the free cash flows on average risky projects of the company
– This is not the proper rate to use if the project is more or less risky than the average risky project
• Each project should be evaluated using its own opportunity cost of capital
Question?
So, based on the previous answer, why is so much time spent estimating the
company’s Cost of Capital?
Answer
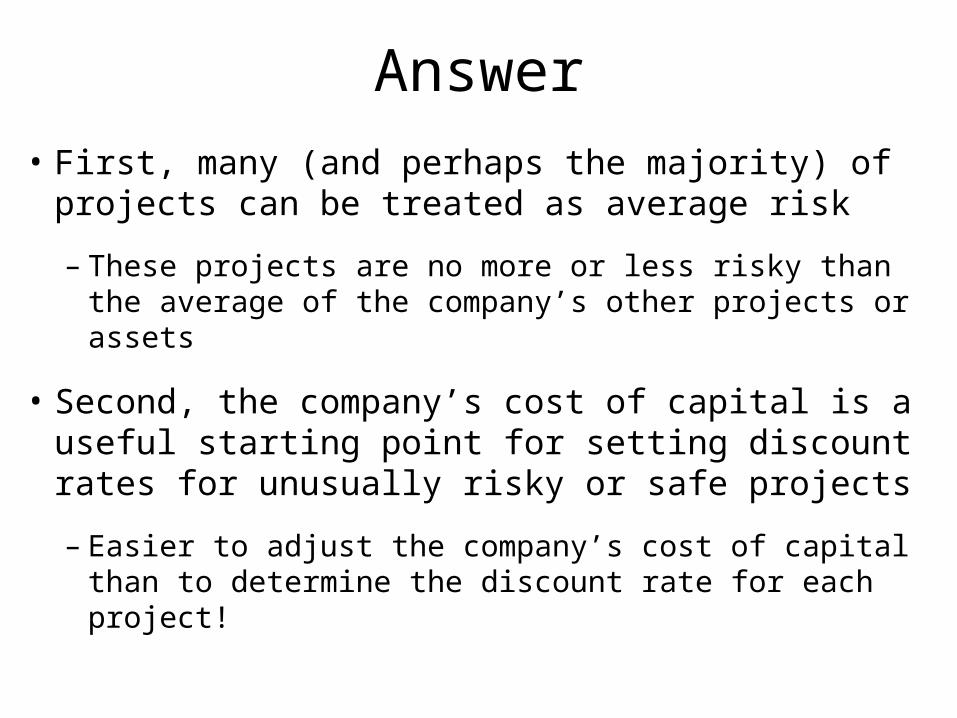
• First, many (and perhaps the majority) of projects can be treated as average risk
– These projects are no more or less risky than the average of the company’s other projects or assets
• Second, the company’s cost of capital is a useful starting point for setting discount rates for unusually risky or safe projects
– Easier to adjust the company’s cost of capital than to determine the discount rate for each project!
The Enterprise DCF Model
An General Overview

The Enterprise DCF Model• Enterprise DCF model values the entire firm
– And then subtracts the value of debt and preferred equity to obtain common equity value
• Enterprise DCF model useful in multi-business firm– Value of firm is sum of values of each operating unit
• Enterprise DCF model values components of firm that add up to enterprise value instead of just value of equity– Assists managers identify and understand separate investment and financing
sources of value
– Helps managers pinpoint key leverage areas and aids in search for value-enhancing ideas
– Model can be applied consistently at various levels of aggregation
The Enterprise DCF Model
Agile Technologies, Inc.:
An Example
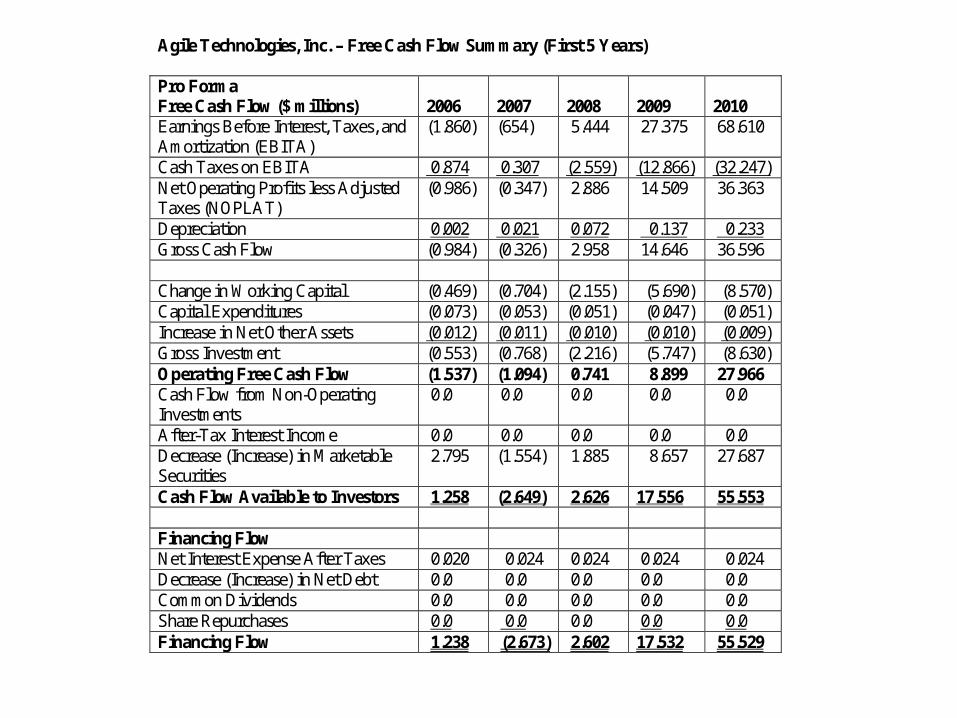
Agile Technologies, Inc. – Free Cash Flow Summary (First 5 Years) Pro Forma Free Cash Flow ($ millions)
2006
2007
2008
2009
2010
Earnings Before Interest, Taxes, and Amortization (EBITA)
(1.860) (654) 5.444 27.375 68.610
Cash Taxes on EBITA 0.874 0.307 (2.559) (12.866) (32.247) Net Operating Profits less Adjusted Taxes (NOPLAT)
(0.986) (0.347) 2.886 14.509 36.363
Depreciation 0.002 0.021 0.072 0.137 0.233 Gross Cash Flow (0.984) (0.326) 2.958 14.646 36.596 Change in Working Capital (0.469) (0.704) (2.155) (5.690) (8.570) Capital Expenditures (0.073) (0.053) (0.051) (0.047) (0.051) Increase in Net Other Assets (0.012) (0.011) (0.010) (0.010) (0.009) Gross Investment (0.553) (0.768) (2.216) (5.747) (8.630) Operating Free Cash Flow (1.537) (1.094) 0.741 8.899 27.966 Cash Flow from Non-Operating Investments
0.0 0.0 0.0 0.0 0.0
After-Tax Interest Income 0.0 0.0 0.0 0.0 0.0 Decrease (Increase) in Marketable Securities
2.795 (1.554) 1.885 8.657 27.687
Cash Flow Available to Investors 1.258 (2.649) 2.626 17.556 55.553 Financing Flow Net Interest Expense After Taxes 0.020 0.024 0.024 0.024 0.024 Decrease (Increase) in Net Debt 0.0 0.0 0.0 0.0 0.0 Common Dividends 0.0 0.0 0.0 0.0 0.0 Share Repurchases 0.0 0.0 0.0 0.0 0.0 Financing Flow 1.238 (2.673) 2.602 17.532 55.529
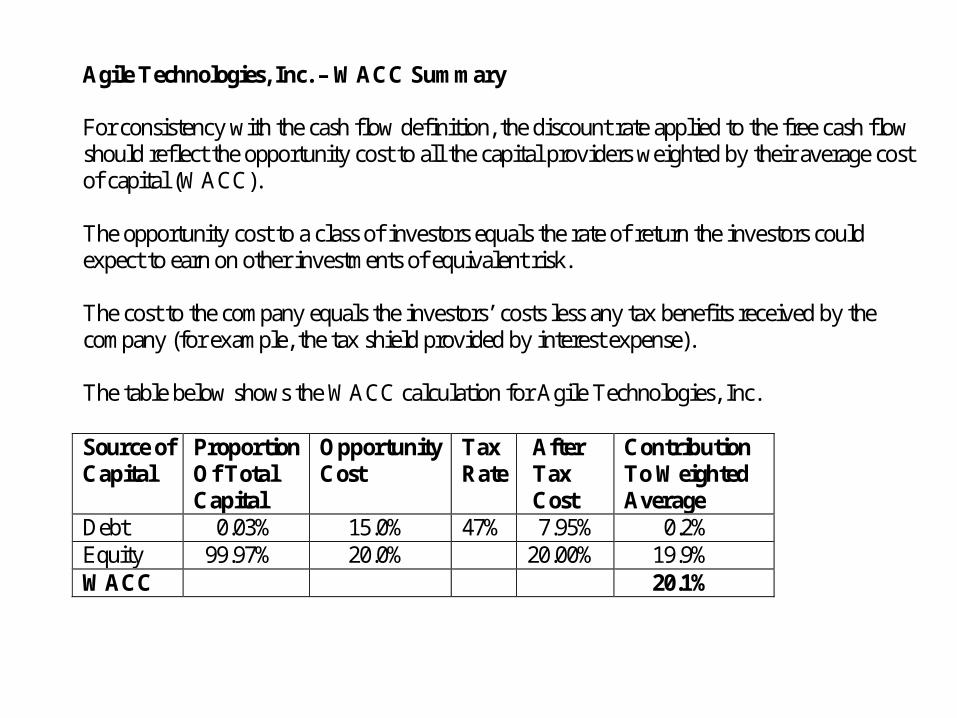
Agile Technologies, Inc. – WACC Summary For consistency with the cash flow definition, the discount rate applied to the free cash flow should reflect the opportunity cost to all the capital providers weighted by their average cost of capital (WACC). The opportunity cost to a class of investors equals the rate of return the investors could expect to earn on other investments of equivalent risk. The cost to the company equals the investors’ costs less any tax benefits received by the company (for example, the tax shield provided by interest expense). The table below shows the WACC calculation for Agile Technologies, Inc. Source of Capital
Proportion Of Total Capital
Opportunity Cost
Tax Rate
After Tax Cost
Contribution To Weighted Average
Debt 0.03% 15.0% 47% 7.95% 0.2% Equity 99.97% 20.0% 20.00% 19.9% WACC 20.1%
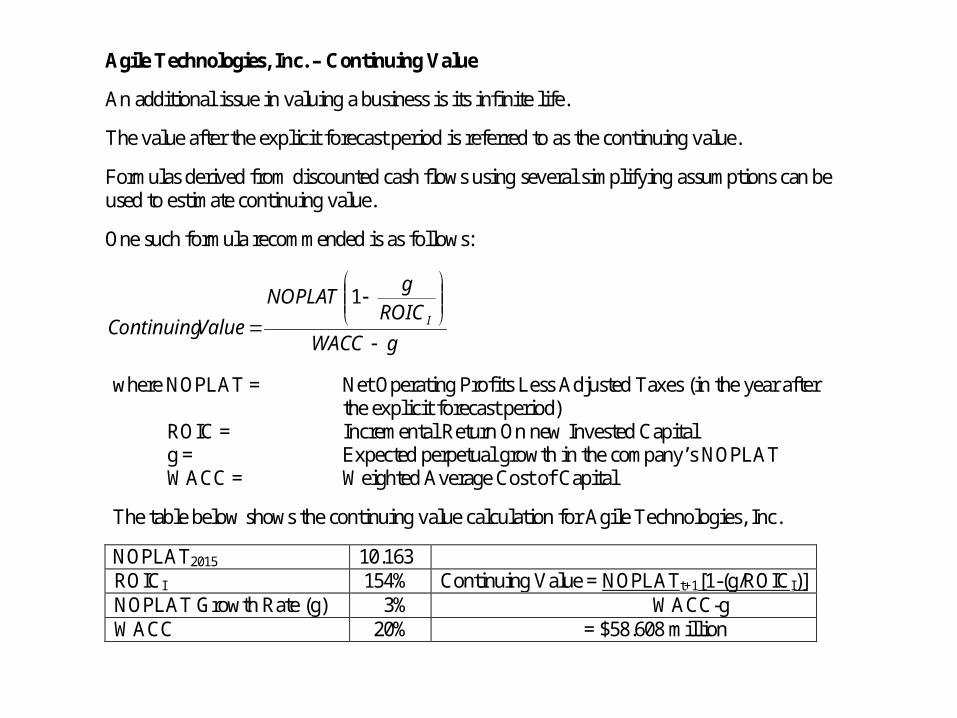
Agile Technologies, Inc. – Continuing Value
An additional issue in valuing a business is its infinite life.
The value after the explicit forecast period is referred to as the continuing value.
Formulas derived from discounted cash flows using several simplifying assumptions can be used to estimate continuing value.
One such formula recommended is as follows:
gWACC
ROIC
gNOPLAT
ValueContinuing I
1
where NOPLAT = Net Operating Profits Less Adjusted Taxes (in the year after the explicit forecast period)
ROIC = Incremental Return On new Invested Capital g = Expected perpetual growth in the company’s NOPLAT WACC = Weighted Average Cost of Capital
The table below shows the continuing value calculation for Agile Technologies, Inc.
NOPLAT2015 10.163 ROICI 154% Continuing Value = NOPLATt+1[1-(g/ROICI)] NOPLAT Growth Rate (g) 3% WACC-g WACC 20% = $58.608 million

Agile Technologies, Inc. – Free Cash Flow Valuation Summary
Year Free Cash Flow (FCF) ($ millions)
Discount Factor (20%)
Present value Of FCF ($ millions1)
2006 1.258 0.833 1.048 2007 (2.649) 0.694 (1.839) 2008 2.626 0.579 1.520 2009 17.556 0.482 8.466 2010 55.553 0.402 22.323 2011 116.915 0.335 39.149 2012 207.173 0.279 57.808 2013 267.866 0.233 62.285 2014 370.336 0.194 71.758 2015 581.825 0.161 93.945 Continuing (Terminal) Value 58.608 0.161 9.463 365.925 Mid-Year Adjustment Factor2 1.09546 Value of Operations 400.856 Value of Non-Operating Investments 0.000 Total Enterprise Value 400.856 Less: Value of Debt (0.300) Equity Value 400.556 Equity Value Per Share $41.36
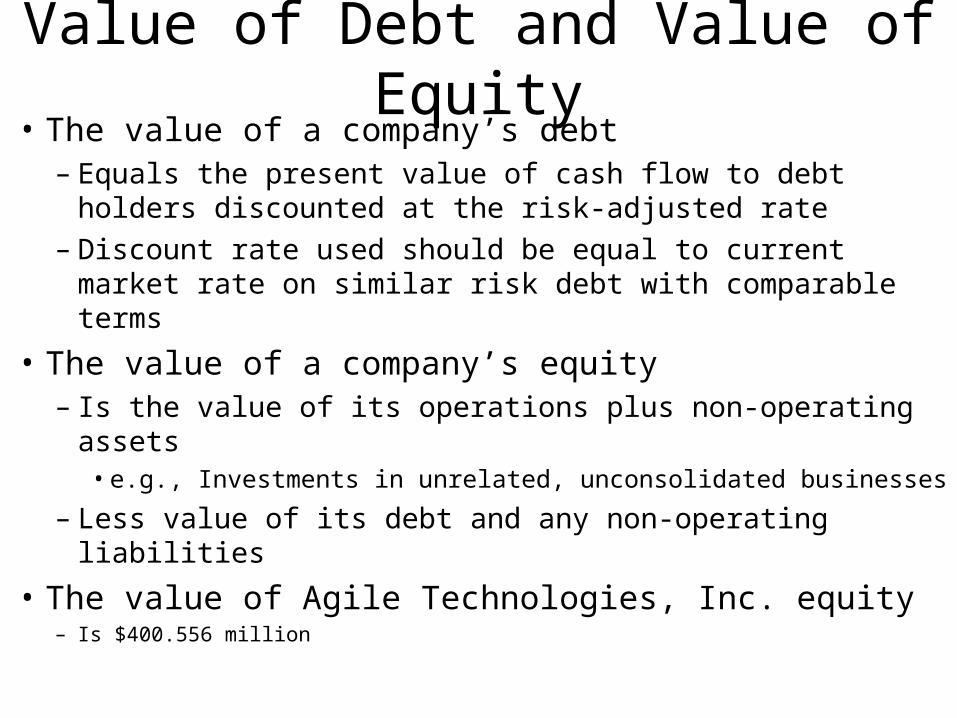
Value of Debt and Value of Equity• The value of a company’s debt
– Equals the present value of cash flow to debt holders discounted at the risk-adjusted rate
– Discount rate used should be equal to current market rate on similar risk debt with comparable terms
• The value of a company’s equity– Is the value of its operations plus non-operating assets
• e.g., Investments in unrelated, unconsolidated businesses
– Less value of its debt and any non-operating liabilities
• The value of Agile Technologies, Inc. equity– Is $400.556 million
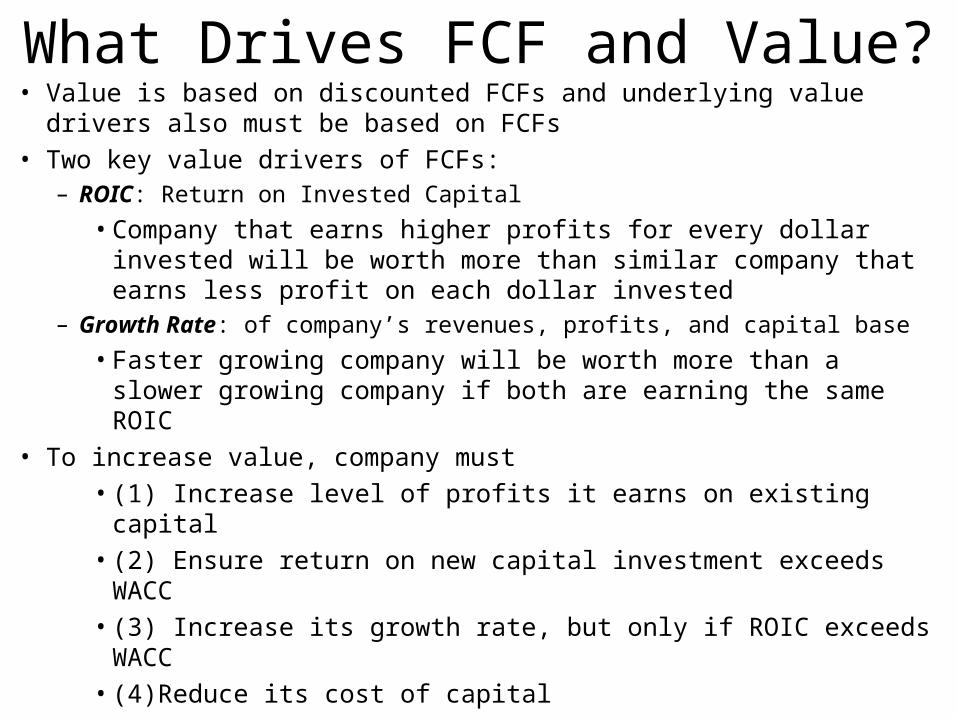
What Drives FCF and Value?• Value is based on discounted FCFs and underlying value drivers also
must be based on FCFs
• Two key value drivers of FCFs:– ROIC: Return on Invested Capital
• Company that earns higher profits for every dollar invested will be worth more than similar company that earns less profit on each dollar invested
– Growth Rate: of company’s revenues, profits, and capital base
• Faster growing company will be worth more than a slower growing company if both are earning the same ROIC
• To increase value, company must
• (1) Increase level of profits it earns on existing capital
• (2) Ensure return on new capital investment exceeds WACC
• (3) Increase its growth rate, but only if ROIC exceeds WACC
• (4)Reduce its cost of capital
Art of Valuation
• Valuation is a function of:– Understanding the business (analyzing the firms)– Understanding the industry (comparative analysis)– Understanding the general economic environment– Prudently incorporating this information into the
valuation model– Correct method is the easy part!
Art of Valuation
• Requirements of the valuation model:– Pro forma model must include complete income
statement, balance sheet, and cash flow statement (which ties the first two items together!)
• Supporting ratios should also be included
– Ground pro forma model in historical analysis– Complete a similar, though less detailed, analysis
for competitors

Where is Value?
The Value Creation Pyramid
Sources of Value Creation
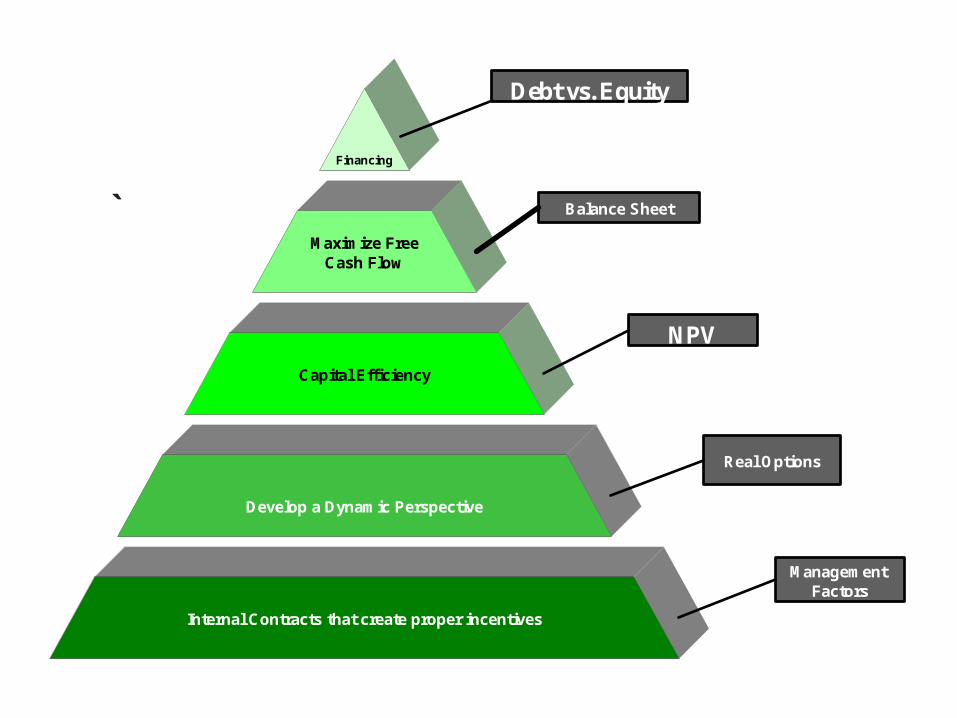
Financing
Maximize FreeCash Flow
Capital Efficiency
Develop a Dynamic Perspective
Internal Contracts that create proper incentives
NPV
Real Options
Management Factors
` Balance Sheet
Debt vs. Equity
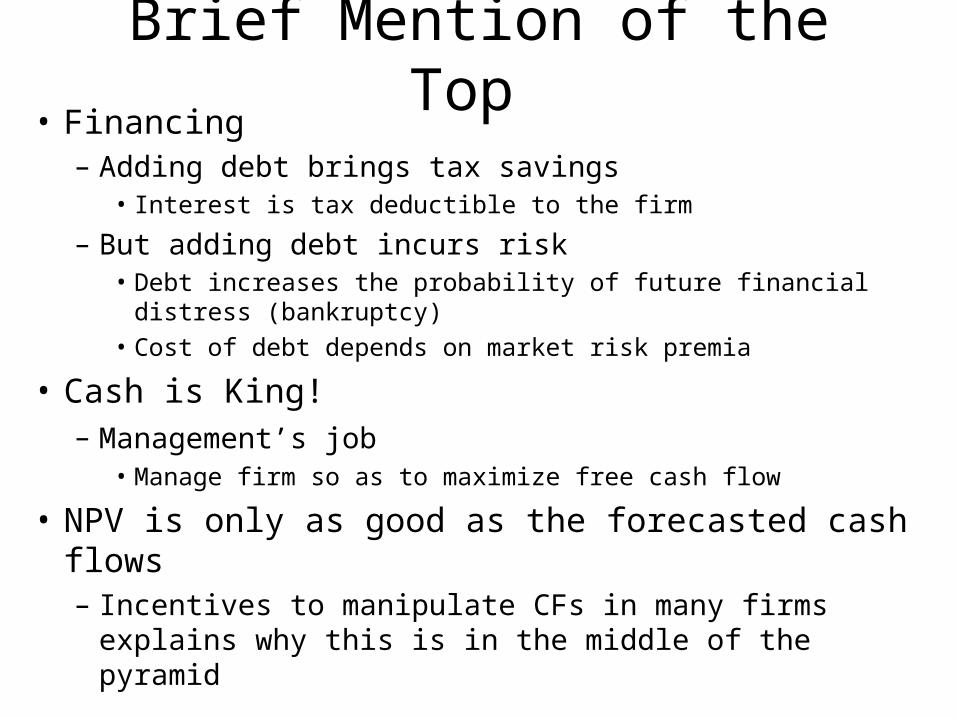
Brief Mention of the Top • Financing
– Adding debt brings tax savings• Interest is tax deductible to the firm
– But adding debt incurs risk• Debt increases the probability of future financial distress
(bankruptcy)
• Cost of debt depends on market risk premia
• Cash is King!– Management’s job
• Manage firm so as to maximize free cash flow
• NPV is only as good as the forecasted cash flows– Incentives to manipulate CFs in many firms explains why
this is in the middle of the pyramid
Method versus Process • The base of the value pyramid is process
– Management factors• Internal contracts creating properly aligned incentives for value
creation
• Historically, most – if not all – of the focus in corporate finance was on method (top three cells)
• But consulting with CFOs makes it clear that bad process can destroy the best method!– With a good process, method is
• (1) Not all that important, and
• (2) Usually optimized (i.e., it is secondary to process)
• Process forms the basis for value creation!
Harsh Realities • Wall Street places an increasingly high premium on
“transparency”
• The internal budgeting process affords a vehicle to:– Communicate corporate expectations
– Characterize perceived business opportunities
– Define managerial ability to execute the business plan
• Does Wall Street’s attention to quarterly earnings targets damage long-run value creation?– Some of the blame should be placed on management’s
unwillingness to expand the scope of the “message space” in communications with the Street!
Real Options • A dynamic focus means that when you, as a
manager, make a decision, you do not act as if you are committing the firm to a locked-in stream of future cash flows
• Rather, you are positioning the firm to make future decisions
• The key is identifying the optimal reaction to future states of nature
Big Picture: Dynamic Optimization
• A problem with most firms is the focus on the short-term or static optimization
• There is no easy way to trade-off the competing needs to induce discipline, discourage shirking, and assess talent on the one hand from inducing creativity and a long-term perspective, on the other hand
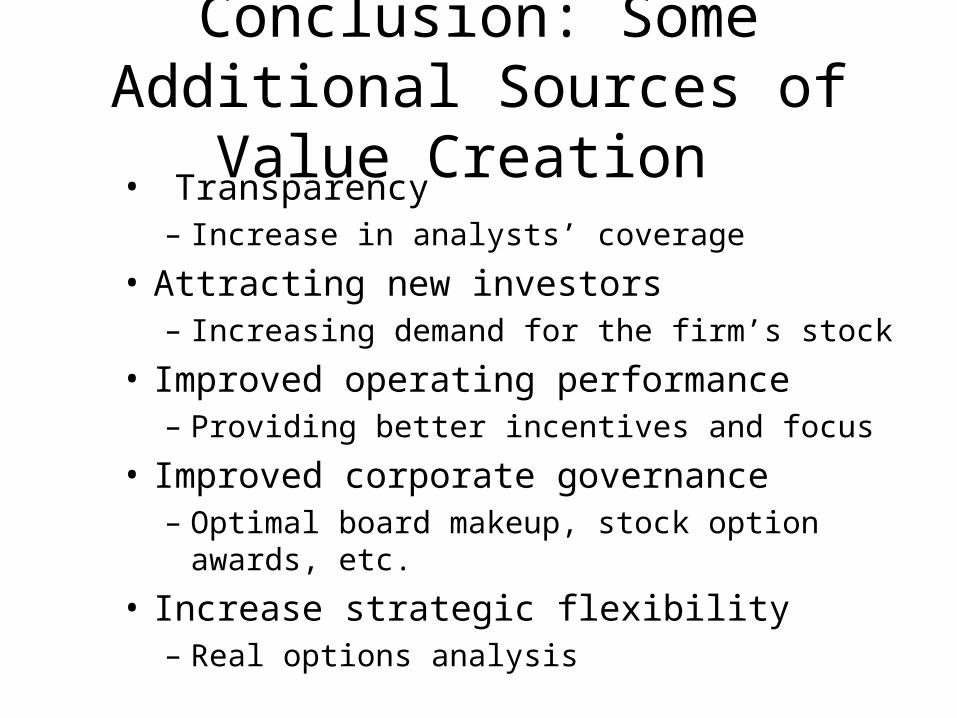
Conclusion: Some Additional Sources of Value Creation
• Transparency– Increase in analysts’ coverage
• Attracting new investors– Increasing demand for the firm’s stock
• Improved operating performance– Providing better incentives and focus
• Improved corporate governance– Optimal board makeup, stock option awards, etc.
• Increase strategic flexibility– Real options analysis
Thank You!
Charles B. (Chip) Ruscher, PhD
Department of Finance and Business Economics