lecture(s) 9 slides from atmosphere-ocean lectures has
TRANSCRIPT
Lecture(s) 9Slides from atmosphere-ocean lectures
HAS 222d/253e P.B.Rhines

ATMOSPHERE AND OCEAN – finely layered, like a parfait, by fluid density, the
atmosphere’s temperature decreases upward at about 70C per km…80% of the mass of the atmosphereis in the troposphere, the lowest 8 to 10 km. and the temperaturedecreases 50 to 700C from sea level to that altitudeThe stratosphere above this level is more stratified, more stably layered.At the ground the pressure is about 105 Newton.m2 or Pascals. This simply reflects the weight of the air overhead.
In the deep sea the pressure, also the weight per square meter of the water overhead, rises to typically 400 times the atmospheric pressure at sea level
(water is 800 times denser than air at sea level. The upper 2.5m layer of ocean has the same heat capacity as the entire atmosphere above. The average ocean depth is 3800m yet the water in the atmosphere above if condensed would make a layer only 3 cm. deep!)
– solar radiation incoming (minus the simple reflection due to the whiteness..albedo..ofclouds, snow and deserts) balances infrared radiation outgoing radiation. Without the atmosphere this balance gives a too-cold Earth (by about 350C). With a one-pane-of-glassatmosphere model we have a too-warm Earth since convection in the air also cools the Earth. A distributed greenhouse effect gives a total downward radiation about 3 times the incoming solar radiation.
– But the radiation comes in more strongly in the tropics and exits more strongly near the poles. Heat- and water-flow carries the required energy poleward. the atmosphere is a heat engine, with Hadley convection cells driven by the difference between tropical and polar solar radiation, together with albedo differences and contrasts in evaporation of ocean water between tropics and polar regions.
– Clouds are the miniature heat engines the make the great general circulation go: the sun heats the ocean, the ocean warms the air and also evaporates
moisture: both the ‘sensible’ and ‘latent’ heat fuels the vigorous overturning of the cloud visible as ‘cauliflower’ headed cumulus clouds. Where they bump up against the stratosphere they from ‘anvil clouds with flat tops.

– the ocean is also a heat engine, augmented by density differences due to the contrasts in salinity produced by evaporation and precipitation. But in addition the atmosphere blows winds on the sea, driving ocean currents through mechanical energy exchange…sort of two gear wheels, the atmosphere and ocean, meshed together and yet also forced by buoyant density differences. Ice and snow..thecryosphere are crucial components of the fresh-water cycling of the Earth…and they are disappearing…they affect albedo and ice can insulate the ocean from the atmosphere above. When the ocean surface freezes it rejects cold salty water (brine) which is very dense, while retaining nearly fresh water. Then when it melts in summer this ice makes a layer of quite fresh water at the surface.
– beside the density layering, the dominant feature that shapes the circulation of the atmosphere is the Earth’s rotation (through the Coriolis force). This force turns the north-south motions into east-west winds, which are the most visible part of the atmospheric circulation. Both the great overturning circulations and the east-west winds are cooperatively ventilating the tropics, warming the polar regions, and controlling rainfall, temperature and winds throughout the world.
– Ocean and atmosphere have many similar circulation features, jet streams(Science,26 Jan 07), cyclones and anticyclones, global overturning circulations. Yet the size of these is 10 times smaller in the ocean, making ocean ‘weather’ more complex than atmospheric weather.
• The Earth’s spin is a vector sticking out of the North Pole. The strong rotationrepresents and angular momentum that is ‘inherited’ by the fluid oceans and atmosphere. A gyroscope illustrates the great strength of this spin: moving the spin axis requires great torque…after all, it involves changing the direction of the velocity, which requires a force.
• To gauge the strength of the Earth’s rotation, consider the ‘figure-skater effect’ which explains the westerly and easterly winds (the latter are the ‘trade winds’ in the tropics), weather systems, hurricanes and tornadoes. If air moves a distance L horizontally, it will gain a velocity roughly 10-4L: that is 100 m/sec for L = 1000 km. The air pressureprovides a dominant force that balances this Coriolis force.

• Oceans and continents provide an interactive lower boundary for the atmosphere. Thus the oceans provide the water for the atmospheric heat engine…not a coolant so much as a propellant!
• Mountain ranges (dominantly the Himalayan plateau and Rocky Mts. of North America) shape the meandering pattern of the westerly winds and jet stream. The northern hemisphere has far more land and mountains than the southern hemisphere making it ‘wavier’, and giving it warmer polar temperatures (more meridional (i.e., north-south) heat- and moisture circulation)….Antarctica and the atmosphere above are colder than the Arctic. The Antarctic ozone hole is a conseqeuence of this difference

255K (-180C)..the simple radiation temp of Earth
the zone radiating back directly to space has averagetemp of about 250K, closeto the simple σT4 radiation temp 290K = average surface temp
Average vertical variationof temperature in theatmosphere. The troposphere(the lowest 8 to 10 km contains 80% of the massof the atmosphere

http://www.windows.ucar.edu/tour/link=/earth/climate/sun_radiation_at_earth.htmlsolar radiation arrives a the top of the atmosphere: 1372 W/m2 /4 = 343 W/m2 incident
sunlight, then with albedo….x 0.7 = 240 W/m2 (numbers vary somewhat..235 in fig below)
consider the differences between tropics and Arctic…(a)at 60N latitudethe sunshine incident per unit area is 50% of the full intensity withthe sun overhead; (b) the albedo (whiteness) is greater

Water….is a primary Greenhouse Gas along with methane, ozone
{Water vapor accounts for about 75 Watt meter2 …with clouds 51 Watts/meter2 of extra downward radiation.
carbon dioxide accounts for about 32 Watt meter2
…with clouds 24}sunshine causesevaporation which feeds atmosphere 13.7 Sverdrup (13.7 x
109 kg/sec)…137 Amazon riverswater vapor in atmsphere flows from warm latitudes to
cold latitudes, Eq -> poles …at a rate of about 1 Sverdrupthe north-south/up-down movement, or ‘overturning
circulations’ of Oceans and Atmosphere share this poleward flowwater flows from seas to land Big continents are dry.
Mountains catch the rain, yet continents like Australia have few. The Flat Earth does not refer only to economics and medieval astronomy
water vapor is stored form of heat…..(scalding by steam: 2.26 million Joules per kg. ..to evaporate or condense water)
Water vapor carries fully ½ the poleward heat transport of atmosphere in a transport mode which is shared with the ocean.

consider the differences between tropics and Arctic…• (a) at 60N latitude the sunshine incident per unit area
is 50% of the full intensity with the sun overhead; • (b) the albedo (whiteness) is greater:
Fresh snow or ice 60-90Old, melting snow 40-70Clouds 40-90Desert sand30-50Soil5-30Tundra15-35Grasslands18-25Forest5-20Water5-10

• But radiation is not everything. The one-pane-of-glass greenhouse model overpredicts the greenhouse ‘blanket’, giving a mean surface temperature of 21/4 x 255K the simple radiation temperature. This is 303K, or 300C, warmer than observed (290K, 180C)
The reason is convection and circulation which cools off the Earth’s surface, heating the lower atmosphere with both sensible warmth and latent warmth in the form of water vapor.
http://oceanworld.tamu.edu/resources/oceanography-book/radiationbalance.htm
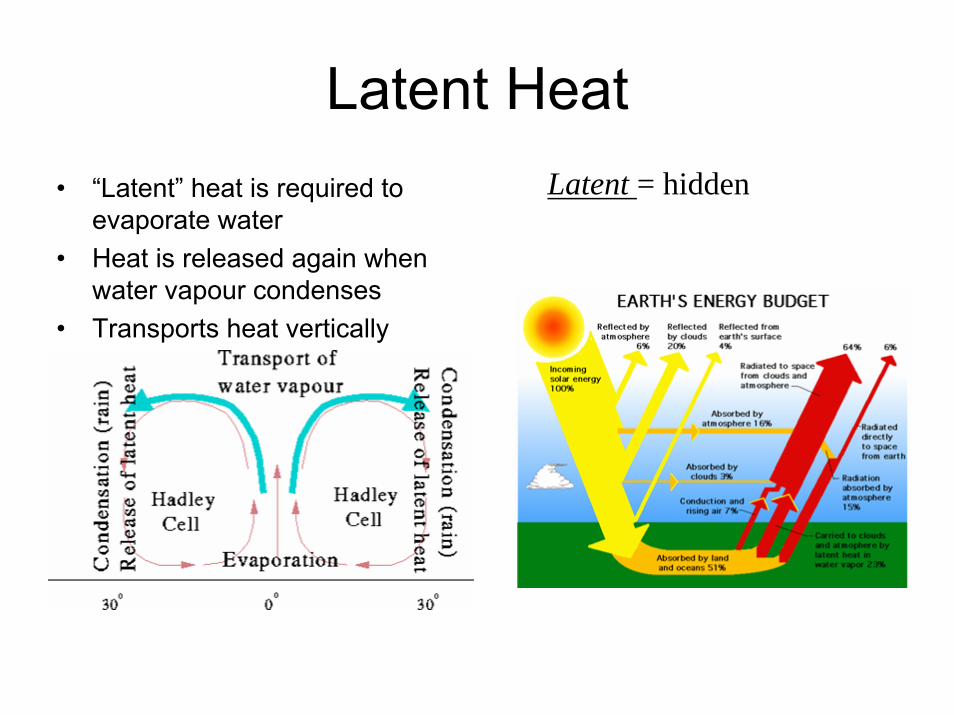
Latent HeatLatent = hidden• “Latent” heat is required to
evaporate water• Heat is released again when
water vapour condenses• Transports heat vertically
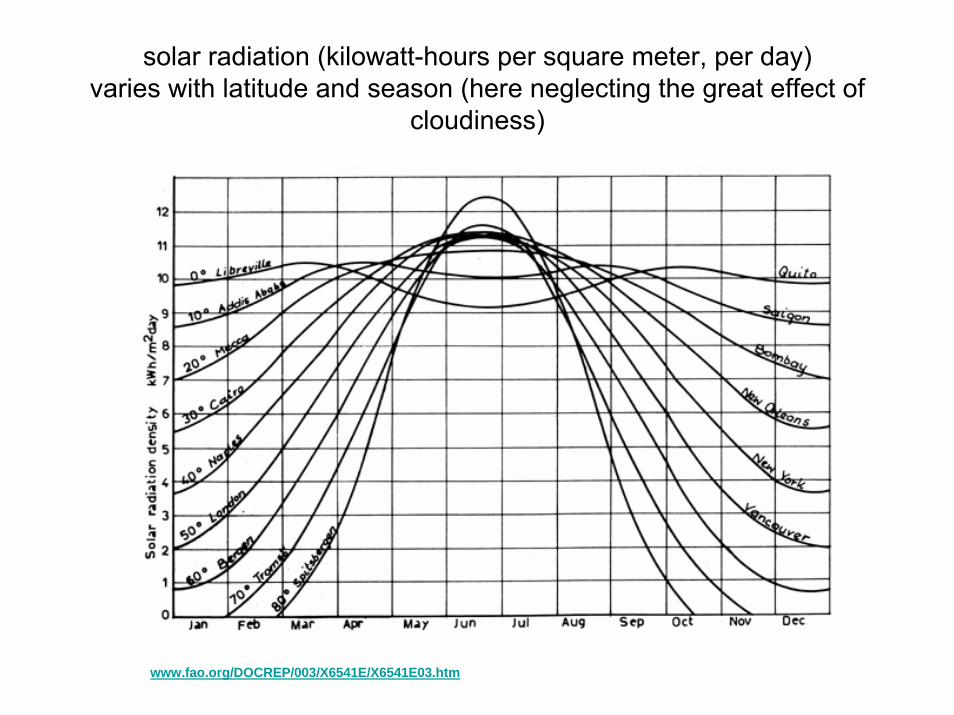
solar radiation (kilowatt-hours per square meter, per day)varies with latitude and season (here neglecting the great effect of
cloudiness)
www.fao.org/DOCREP/003/X6541E/X6541E03.htm
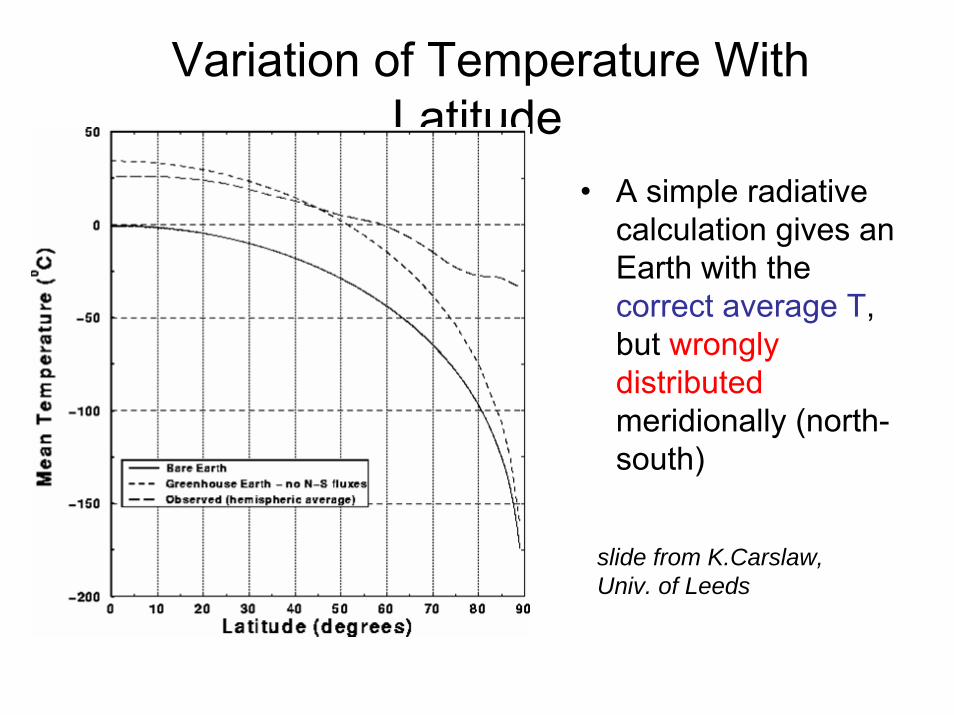
Variation of Temperature With Latitude
• A simple radiative calculation gives an Earth with the correct average T, but wrongly distributedmeridionally (north-south)
slide from K.Carslaw,Univ. of Leeds
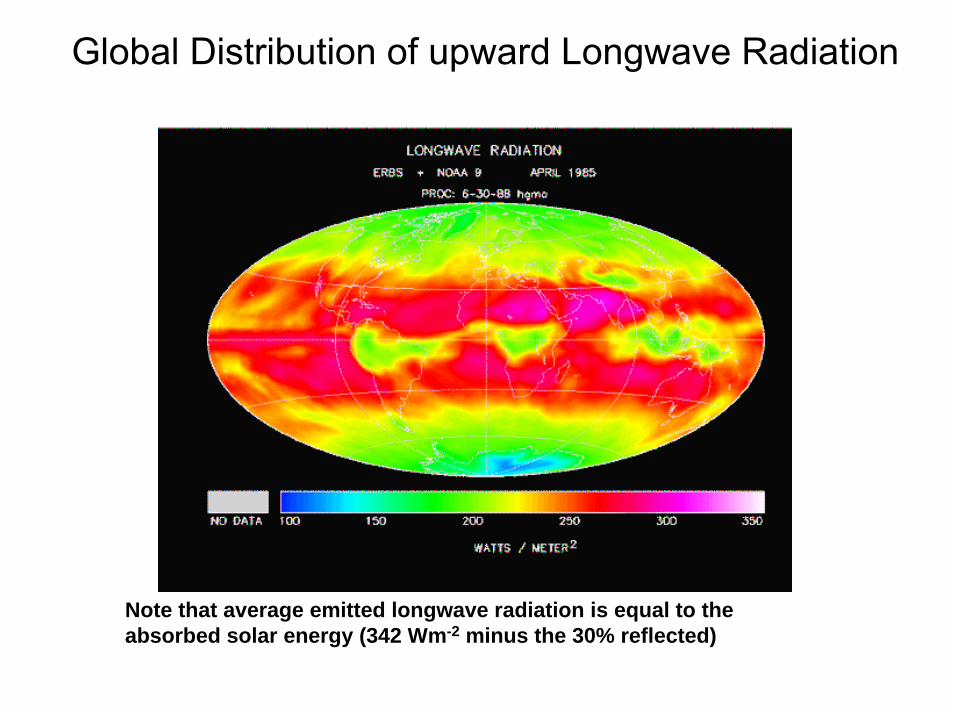
Global Distribution of upward Longwave Radiation
Note that average emitted longwave radiation is equal to the absorbed solar energy (342 Wm-2 minus the 30% reflected)

Satellite image of water vapor (not cloud…it’s gaseous water which is normally invisible). This water vapor carries heat to the Arctic from the tropics. moisture streamers: (1 Sverdrup…109 kg/sec tranport of water carries 2.2 x 10¹⁵ watt thermal energy)
polewardpolewardmoisturemoistureflux at 70Nflux at 70N((Dickson et al. 2000Dickson et al. 2000)

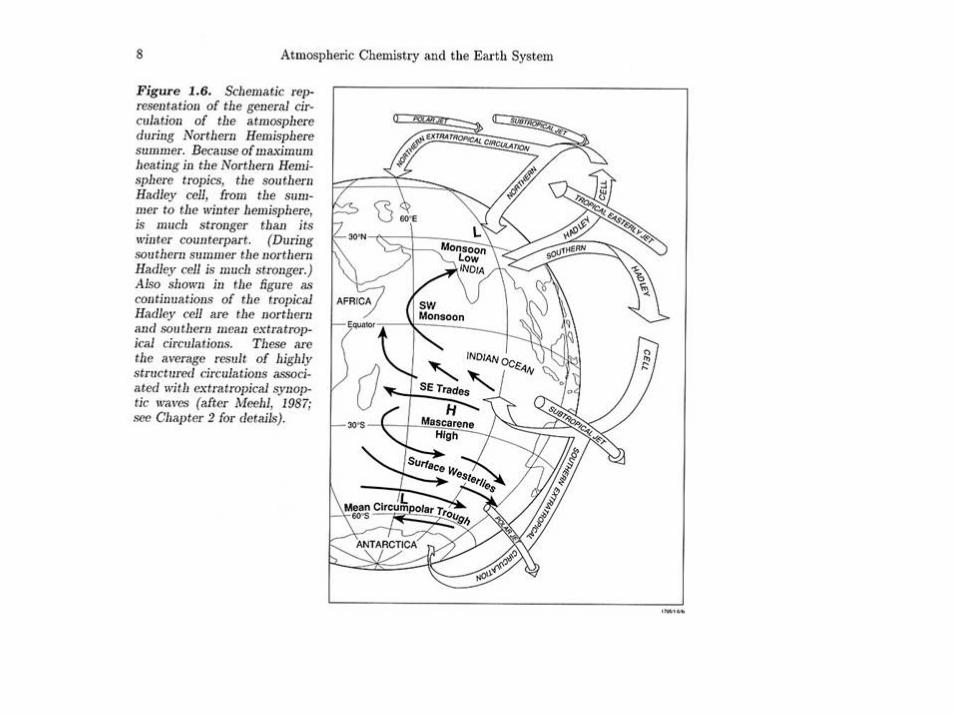
The General Circulation involves overturning circulations (‘conveyor belts’) in the north-south direction, like the Hadley convection cell shown below, in the tropics. Yet these north-south motions induce east-west winds by the ‘figure-skater effect’; that is, the
Earth’s spin is concentrated or ‘diluted’ by moving air closer to the Pole, or farther from it, respectively.
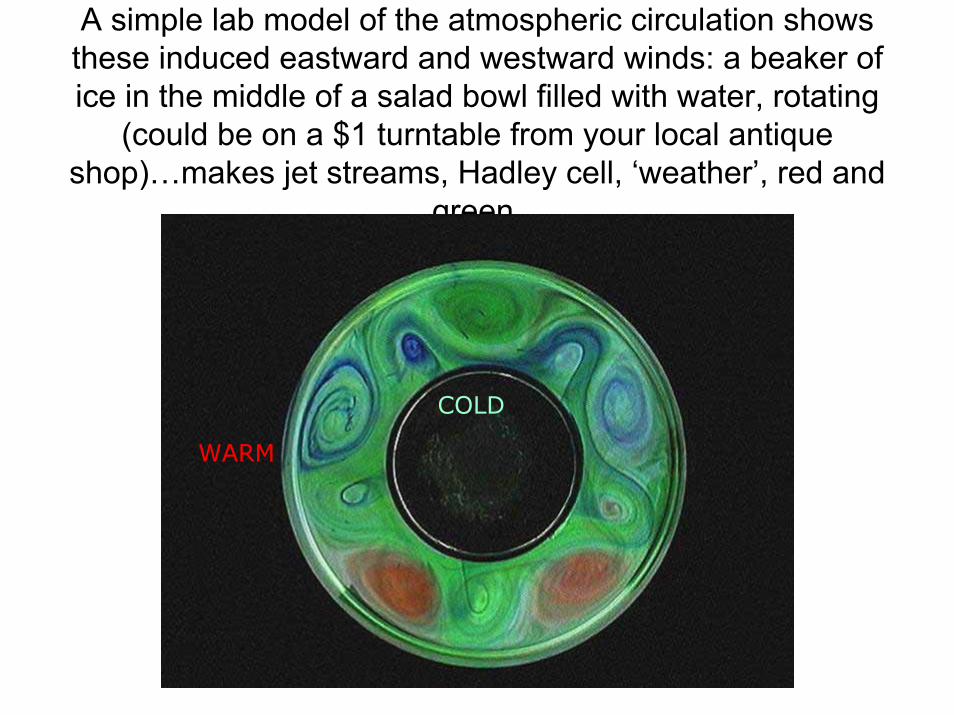
A simple lab model of the atmospheric circulation shows these induced eastward and westward winds: a beaker of ice in the middle of a salad bowl filled with water, rotating
(could be on a $1 turntable from your local antique shop)…makes jet streams, Hadley cell, ‘weather’, red and
green.
COLD
WARM

The Trade Winds
• Columbus discovered the Trade Winds in 1492. They are the ‘slowing’ of the figure skaters spin ashe stretches arms outward

Heat transport from tropics to polar regions. The ocean and atmosphere share the job of transporting heat and fresh-water poleward from the
overheated tropics. It is sort of a ‘leap-frog’ process, with the ocean acting as a reservoir for both heat and fresh-water.
The heat transport in a simple fluid like the ocean is equal to the product Cp T M
that is, T, the temperature (0C) times Cp, the specific heat capacity (Joules/(kg 0C) or equivalently, Joules/(kg 0K)) x M, the mass flow rate (kg/sec)….the units multiply to Joules/sec or Watts. The warmer, northward flowing ocean currents near the surface, like the Gulf Stream, have nearly the same mass flow rate as the cold deep currents flowing southward. The magnitudes shown in the next figure are about 2 x 10¹⁵ Watts (that is, 2 petaWatts) for the ocean contribution to heat transport. Cp is roughly 4000 Joules/(kg 0C)
Hence the heat transport in this case depends on the temperature difference between northward and southward flowing currents. (In some situations we reference the temperature to absolute zero, using degrees Kelvin, but it doesn’t matter if the mass flow is equal and opposite in the two directions).
__________________________________________________footnotes: The specific heat capacity is the amount of heating required to raise the temperture 1 degree C (or K).
When fluid flows in one direction hot, and comes back cold, it is the temperature difference that matters (the same value of M applying in both directions).
A useful alternate expression for heat transport isρ CpTAV
where ρ is the density of the fluid (kg/m3), A is the cross-sectional area of the current (m2) and V is the velocity. Thus, ρAV = M.
These formulas are examples of the general expression for the transport of a quantity of ‘stuff’dissolved in a fluid: transport of stuff (kg/sec) = concentration of the ‘stuff’ (kg of stuff/ kg of fluid) x transport of fluid (kg of fluid/sec).

Global meridional heat transport divides roughly equally into 3 contributing modes:1. warm winds blowing northward,cold winds southward (dry static energy) atmosphere ~ 3 pW (= 3 x 10¹⁵ Watts) )
2. warn ocean currents flowing north, deep cold currents flowing south (sensible heat) ocean ~ 2.5 pW3. moist air from evaporation in subtropics (green zone below) blowing northward, raining out at high latitude, returning south in ocean (a joint atmosphere/ocean mode) ~ 2.2 pW= 1.0 Sv (1 megatonne per sec)
The three modes of poleward transport are comparable in amplitude, and distinct in character
Error est.: ± 9% at mid-latitude; Bryden est 2.0 ±0.42 pW at 24N Sources: Keith, Tellus 97; Trenberth J Clim 2001
(residual method, TOA radiation (residual method, TOA radiation 19851985--89 and ECMWF/NMC 89 and ECMWF/NMC atmosatmos obsobs
90S 90N
(based on Bryden+Imawaki2002, Keith (Tellus 1995) climatology, and not very differently with Trenberth et al. J.Clim 2003)
latitude
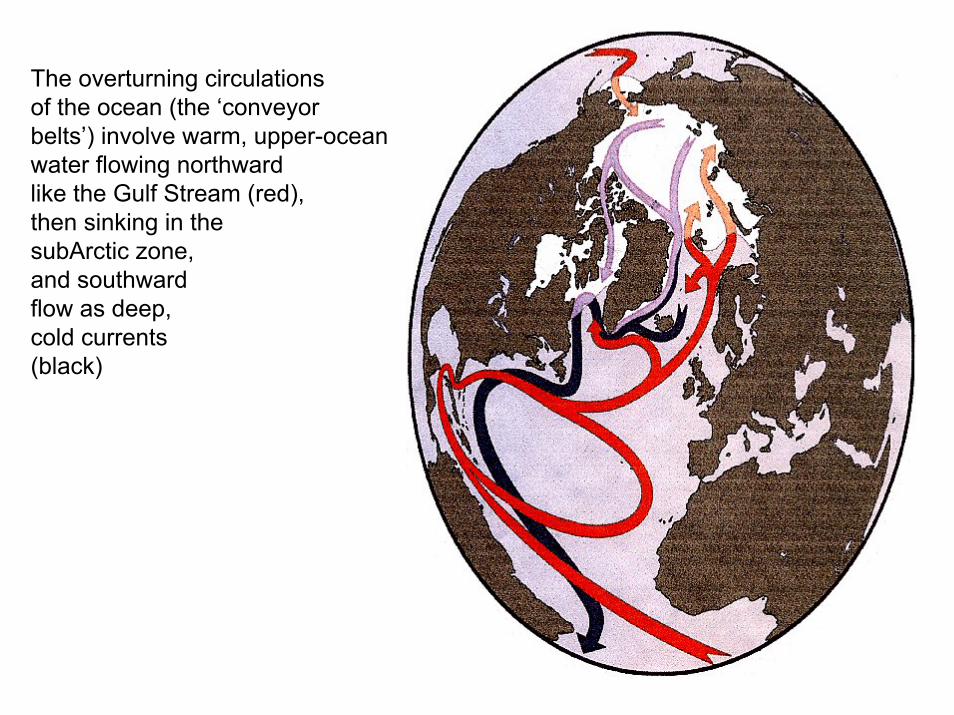
The overturning circulationsof the ocean (the ‘conveyorbelts’) involve warm, upper-oceanwater flowing northwardlike the Gulf Stream (red),then sinking in thesubArctic zone,and southwardflow as deep,cold currents (black)

topography of the northern Atlantic/Arctic ocean basins, withGreenland’s ‘ice mountain’. Note the vertical heights are greatlyexaggerated but otherwise the detail is accurate. The black curve at about 600 North latitude is the section of temperature shownon the next figure.
image:AGU 2003

Erika Dan temperature section from Labrador to Greenland to Ireland, 60N
Worthington and Wright, 1962
Labrador
warm currents (red) fed bythe Gulf Stream flownorth, leaning on Europe
Europe
deep, cold currents (blue) flow round the rim of the ocean, winding southward

9 IPCC climate models evaluated at 2080-99; Tibaldi et al., Clim. Change 2005, Meehl et al. Geophysical Research Letters 2005
Predicted change in the atmosphere by late in thiscentury: warmer, more water vapor, shifted storm tracks, enhancement of bandsof dry and wet (precipitation); note dry regions will get drier, wet regions get wetter
air descending
air descending
air rising

Water Corporation W Australis 2002
1911 1976 2005
Rainfall in Perth, Western Australia:increasingly severe drought over the past 30 years
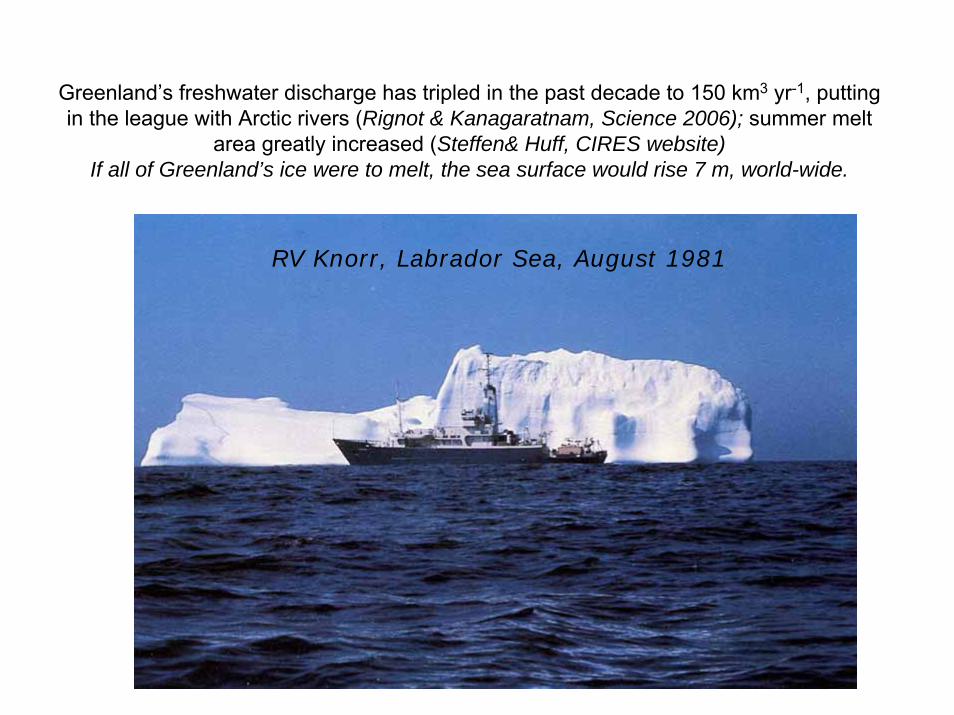
Greenland’s freshwater discharge has tripled in the past decade to 150 km3 yr-1, putting in the league with Arctic rivers (Rignot & Kanagaratnam, Science 2006); summer melt
area greatly increased (Steffen& Huff, CIRES website)If all of Greenland’s ice were to melt, the sea surface would rise 7 m, world-wide.
RV Knorr, Labrador Sea, August 1981

• upcoming in Weeks 8-10:– what causes societies to succeed or fail? (J. Diamond: Collapse)– global energy…
• Roberts: peak oil– alternative energy sources
• solar, hydro (rivers and tides), biofuels• nuclear
– can-do strategies: looking forward – Pacala: wedges of carbon remission– Lovins: Natural Capitalism (www.natcap.org, www.rmi.org)– Diamond: Collapse: what causes societies to succeed or fail (hint:
environment)